Embed Size (px)
Citation preview

A measurement of the Ratio of Tree over Two Jet Cross Sections with CMS at 7TeV
P.Kokkas, I.Papadopoulos, C.Fountas, I.Evangelou, N.ManthosUniversity of Ioannina, Greece
Senior Editor for PAS : James RohlfBoston University, USA

P.Kokkas, Univ. of Ioannina 2
Outline
• Motivation• Monte Carlo studies
• Studies on rapidity• Leading jets pT response and resolution
• HT resolution
• MC prediction for ratio R32
• Data analysis• Data and MC samples• Online Selection and Trigger studies• Offline Selection• Extraction of ratio R32 from data• Studies on Systematics
• Summary

P.Kokkas, Univ. of Ioannina 3
Motivation• Motivation: Measure the ratio R32
and compare with pQCD predictions with goals:• Extend the phase space of the measurement in a regime
that goes above the Tevatron.• Measure S: Comparisons of the measured ratio at hadron
level with the predictions of pQCD (parton level), after accounting for hadronisation corrections uncertainty, will measure the QCD coupling constant S at a scale never measured before.
• We measure the ratio because we expect that certain systematic uncertainties will cancel:• The dominant sources of systematic uncertainties in the
measurement of jet inclusive cross sections are the Luminosity and the Jet Energy Scale (JES).
• We expect the ratio to be less sensitive than absolute cross section measurements to these uncertainties.
• The pQCD predictions for the ratio may be less sensitive to uncertainties due to the renormalization and factorization scales which hamper the absolute cross section predictions particularly at low Jet-pT scales.
D0 PRL 86, p1955 (2001)
jetTpTH vs
2n X; jetsn ppσ
3n X; jetsn ppσ
2σ3σ
32R

4
Monte Carlo models and studies
• MC samples• PYTHIA : /QCDDiJet_Ptxxtoxx/Spring10-START3X_V26_S09-v1/GEN-SIM-RECO• Madgraph : /QCD_Ptxxtoxx-madgraph/Spring10-START3X_V26_S09-v2/GEN-SIM-RECO
PYTHIA6 Madgraph
LO processes LO matrix element 2→2 hard process
Tree Level helicity amplitudes +Parton shower (PS) modelHigher order
processesParton shower (PS) model
Hadronization Lund string model Lund string model
Parton Distribution(PDF) Model
CTEQ6L1 CTEQ6L1
• Jets were reconstructed using the antikt (D=0.5) clustering algorithm.• CaloJets : using antkt5 on calorimeter energy depositions• GenJets : using antikt5 on MC stable particles.
• Calo jets were corrected for energy loss and effects due to non-linear response of calorimeter• Relative (corrects for η dependence)• Absolute (corrects for the pT dependence)
P.Kokkas, Univ. of Ioannina

5
Plot the difference
• For various bins of GenJet pT
• Distributions flat for |y|≤2.5
(Barrel + EndCap regions)• Reasonable cut: |y|≤2.5
Studies on rapidity
GenCaloGen y vsyy
60-100 GeV
100-150 GeV
150-200 GeV
P.Kokkas, Univ. of Ioannina
Contour Plot Profile Y Projection
PYTHIA
PYTHIA
PYTHIA
z
z
pE
pEln
2
1yRapidity

P.Kokkas, Univ. of Ioannina 6
Leading Jets pT Response
Fitting above distribution to aGaussian, we extract pT
Response and Resolution.
The pT Response of leading jets is uniform for jet pT even below 50 GeV.
Calo jet corrections work very well.
T
TTT p
ppp
GenJet
CaloJet GenJet Resolution

7
pT Resolution
For jet pT about 50 GeV the resolutionis ≈15% dropping to ≈10% at 200 GeV.
For our analysis we apply a cuton Jet pT≥50 GeV.
With this cut we can compare our results with Tevatron for a region of HT between 300-600 GeV
P.Kokkas, Univ. of Ioannina 8
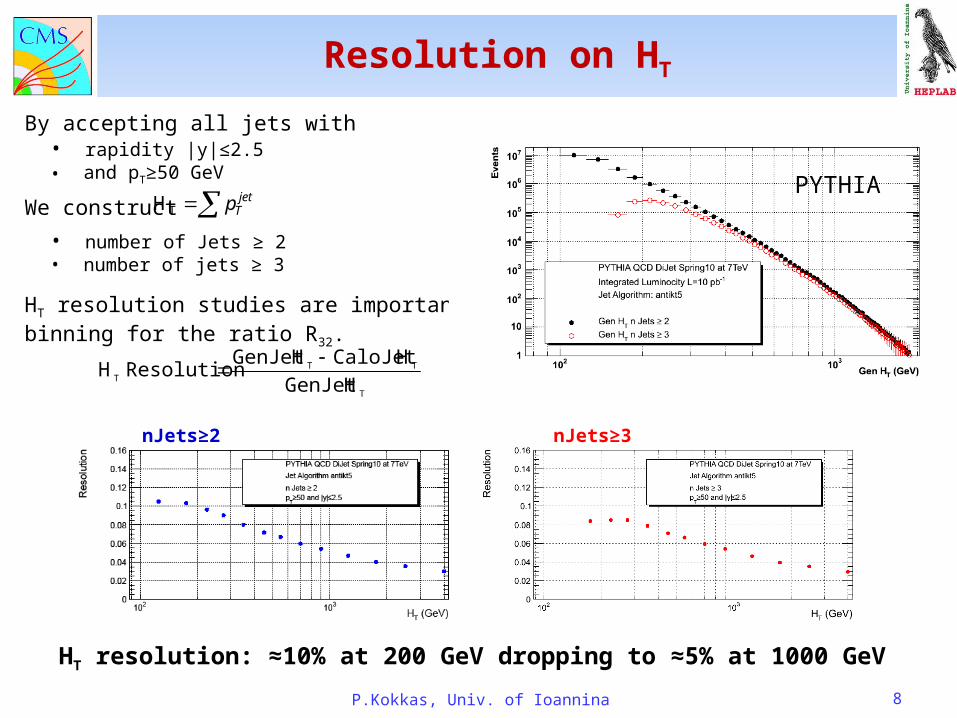
Resolution on HT
By accepting all jets with• rapidity |y|≤2.5• and pT≥50 GeV
We construct in the case of • number of Jets ≥ 2• number of jets ≥ 3
HT resolution studies are important to define the binning for the ratio R32.
jetTpTH
T
TT
T HGenJet
HCaloJet HGenJet Resolution H
nJets≥2 nJets≥3
HT resolution: ≈10% at 200 GeV dropping to ≈5% at 1000 GeV
PYTHIA

MC predictions for R32
9
• The ratio R32 starts at 150 GeV, rises fast ad reach to a plato at ≈800 to 1000 GeV.
• Madgraph is systematically lower than PYTHIA by as much as 30% in the lower HT bins. This difference decreases to ≈10% around 400 GeV and becomes smaller than 5% at higher HT bins.
• The cross section predicted by Madgraph is consistently ≈30% lower than PYTHIA’s.
PYTHIA Madgraph

10
Data Analysis
• Data Samples• /MinimumBias/Commissioning10-SD_JetMETTau-v9/RECO• /JetMETTau/Run2010A-May27thRereso_v1/RECO• JSON file
• CMS official JSON file : Cert_132440-136297_7TeV_StreamExpress_Collisions10_JSON.txt• But for Runs > 134630 (Trigger scheme 6)• Total Integ.Lumi = 10.8 nb-1 (Evaluated from crab)
• Trigger Samples• /MinimumBias/Commissioning10-SD_JetMETTauMonitoring-v9/RECO• /JetMETTauMonitoring/Run2010A-May27thRereso_v1/RECO• /MinimumBias/Commissioning10-May27thReReco_v1/RECO (MinBias Studies)
• MC Samples• PYTHIA: QCDDiJet_Ptxxtoxx/Spring10-START3X_V26_S09-v1/GEN-SIM-RECO• Madgraph: QCD_Ptxxtoxx-madgraph/Spring10-START3X_V26_S09-v1/GEN-SIM-RECO
• On line Selection:• Require BPTX Technical bit 0, to select events with consistent timing
with LHC bunch crossing• None of the BSC beam halo triggers (Technical bits 36,37,38,39)• Select events with HLT Jet15U
P.Kokkas, Univ. of Ioannina

11
Online Selection - Trigger
HLT Jet Trigger L1 Prerequisite Prescaled
HLT L1Jet6U L1 SingleJet6U yes
HLT Jet15U L1 SingleJet6U no
HLT Jet30U L1 SingleJet20U no
HLT Jet50U L1 SingleJet30U no
Main HLT Jet Triggers
• Trigger efficiencies vs HLT MinBiasBSC.• HLT L1Jet6U turn on point well in advance, can be used
for calculating efficiencies .
HLT Jet15U Trigger efficiency with HLT L1Jet6U and HLT MinBiasBSC – complete agreement,
P.Kokkas, Univ. of Ioannina

P.Kokkas, Univ. of Ioannina 12
Online Selection - Trigger
• Safe to use HLT Jet15U for our analysis • Turn on points for simulation is systematically
higher.
12
HLT Jet Trigger Turn on points (GeV)Leading Jet
HLT Jet15U 37HLT Jet30U 62HLT Jet50U 87
Data PYTHIA

P.Kokkas, Univ. of Ioannina 13
Online Selection - Trigger
HLT Jet Trigger
HT nJets≥2 (GeV)
HT nJets≥3 (GeV)
HLT Jet15U 100 150
HLT Jet30U 120 150
HLT Jet50U 230 230
• HLT Jet15U : R32 can be measured for HT≥150GeV .• HLT Jet30U : Practically the same as above• HLT Jet50U : R32 can be measured for HT≥230GeV.• The “kink” appearing to HLT Jet50U at ≈150GeV (left
plots), is due to events with three jets of almost equal pT which do not pass the trigger HLT Jet50U.
nJets ≥2 Data
nJets ≥2 PYTHIA
nJets ≥3 Data
nJets ≥2 PYTHIA
14
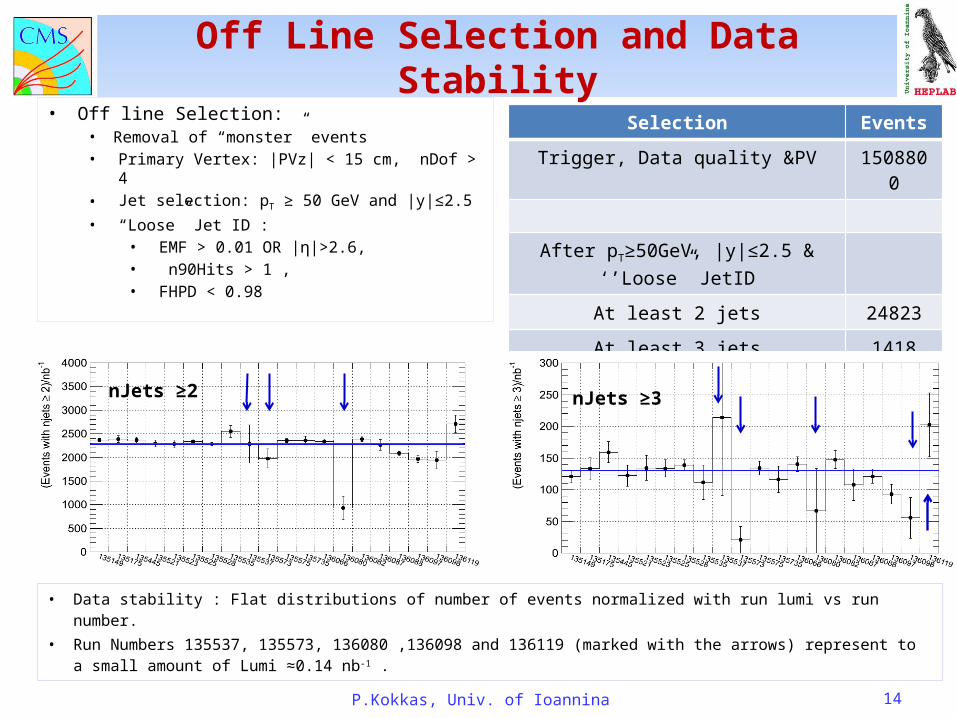
Off Line Selection and Data Stability• Off line Selection:
• Removal of “monster” events• Primary Vertex: |PVz| < 15 cm, nDof > 4• Jet selection: pT ≥ 50 GeV and |y|≤2.5• “Loose” Jet ID :
• EMF > 0.01 OR |η|>2.6, • n90Hits > 1 , • FHPD < 0.98
Selection Events
Trigger, Data quality &PV 1508800
After pT≥50GeV, |y|≤2.5 & ‘’Loose” JetID
At least 2 jets 24823
At least 3 jets 1418
• Data stability : Flat distributions of number of events normalized with run lumi vs run number.• Run Numbers 135537, 135573, 136080 ,136098 and 136119 (marked with the arrows) represent to
a small amount of Lumi ≈0.14 nb-1 .
nJets ≥2 nJets ≥3
P.Kokkas, Univ. of Ioannina
P.Kokkas, Univ. of Ioannina 15
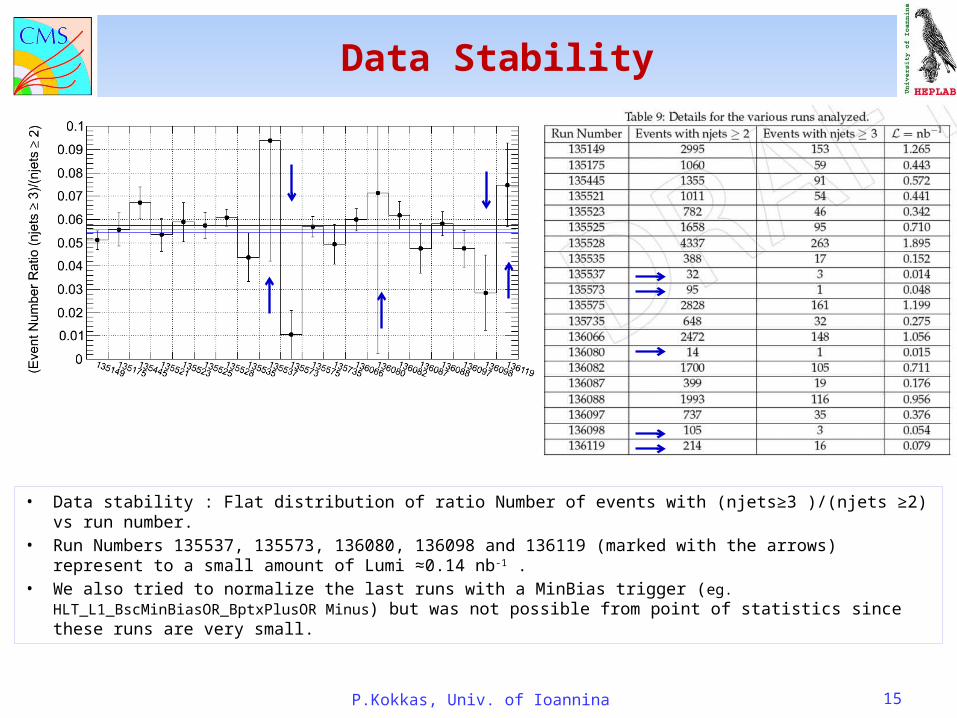
Data Stability
15
• Data stability : Flat distribution of ratio Number of events with (njets≥3 )/(njets ≥2) vs run number.• Run Numbers 135537, 135573, 136080, 136098 and 136119 (marked with the arrows) represent to a
small amount of Lumi ≈0.14 nb-1 .• We also tried to normalize the last runs with a MinBias trigger (eg. HLT_L1_BscMinBiasOR_BptxPlusOR
Minus) but was not possible from point of statistics since these runs are very small.

P.Kokkas, Univ. of Ioannina 16
All jets: Data over PYTHIA
Good agreement with simulation.
Small differences in shape for fHPD and N90Hits, not important for our analysis.
PYTHIA MC normalized to the total number of inclusive DiJet events.
The effect of the “loose” JetID selection is ≈0.3%.

17
Leading Jets: Data over PYTHIA
PAS
PAS
PAS
PAS
PAS
PAS
PYTHIA MC normalized to the total number of inclusive DiJet events.
%3.197935
1532CaloR
%7.168485
1416CaloR
GeV 800 H 150
PYTHIA32
Data32
T
%2.624819
1532CaloR
%7.524821
1416CaloR
GeV 800 H 100
PYTHIA32
Data32
T
PYTHIA describes well the shape of the data distributions

P.Kokkas, Univ. of Ioannina 18
All jets: Data over Madgraph
Good agreement with simulation.
Small differences in shape for fHPD and N90Hits, not important for our analysis.
Madgraph MC normalized to the total number of inclusive DiJet events.

19
Leading Jets: Data over Madgraph
PAS
PAS
PAS
PAS
PAS
PAS
Madgraph MC normalized to the total number of inclusive DiJet events.
Madgraph describes well the shape of the data distributions
%7.424819
1172CaloR
%7.524821
1416CaloR
GeV 800 H 100
Madgraph32
Data32
T
%2.148282
1172CaloR
%7.168485
1416CaloR
GeV 800 H 150
Madgraph32
Data32
T
20
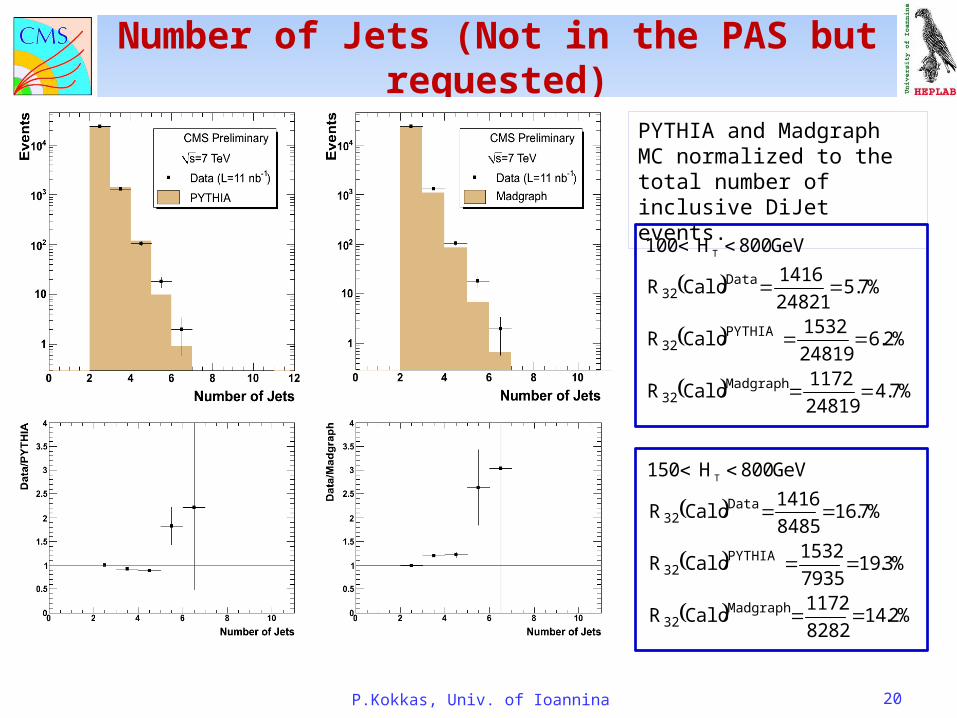
Number of Jets (Not in the PAS but requested)
PYTHIA and Madgraph MC normalized to the total number of inclusive DiJet events.
%7.424819
1172CaloR
%2.624819
1532CaloR
%7.524821
1416CaloR
GeV 800 H 100
Madgraph32
PYTHIA32
Data32
T
P.Kokkas, Univ. of Ioannina
%2.148282
1172CaloR
%3.197935
1532CaloR
%7.168485
1416CaloR
GeV 800 H 150
Madgraph32
PYTHIA32
Data32
T

P.Kokkas, Univ. of Ioannina 21
Method of extracting R32
T
CaloSmear
T ΔH
jetsN
ε
C
dH
dσ
L
Inclusive jetcross section
sizebin H the: ΔH
bin ain counted events ofnumber : jetsN
ibin in eventsGen ofNumber
ibin at eventsGen from events Calo tedreconstruc ofNumber ε
cuts survived eventsfor efficiency the: ε
luminocity integrated the:
ibin in events Calo tedreconstruc ofNumber
ibin at eventsGen from events Calo tedreconstruc ofNumber C
correction smearing : C
TT
Calo
Smear
Smear
L
Smear2
2
3
Smear3
T
CaloT
Calo
T
Calo
2
Smear2
T
Calo
3
Smear3
T
2
T
3
C
ε
ε
C
ΔH
2Jetsn N
ΔH
3Jetsn N
ΔH
2Jetsn N
ε
C
ΔH
3Jetsn N
ε
C
dH
dσdH
dσ
32R
L
LRatio R32
A Bmeasurement
• The factor AxB has been used to correct the Calo Level ratio to stable particle level (Hadron Level).

P.Kokkas, Univ. of Ioannina 22
Method of extracting R32
3 jetsn N
3 jetsn N
3 jetsn N
3 jetsn NA
Calo
CaloPass
CaloPass
Gen
2 jetsn N
2 jetsn N
2 jetsn N
2 jetsn NB
Gen
CaloPass
CaloPass
Calo
H of ibin in eventsGen ofNumber : 2,3 jetsn N TGen
TCalo H of ibin in events Calo tedreconstruc ofNumber : 2,3 jetsn N
bin any appear to and cuts survived events
Calo tedreconstruc allH of ibin of eventsGen For : 2,3 jetsn N TCaloPass
1/ε3 (1/efficiency)nJets≥3
CSmear3
Smearing correctionnJets≥3
ε2 (efficiency)nJets≥2
1/CSmear2
Smearing correctionnJets≥2
With
• This MC driven method of extracting R32 from the data does not depend upon the absolute predictions of the MC programs .
• It does depend on how well the MC distributions describe the shape of the data distributions.
• As we have seen in the previous slides both PYTHIA and Madgraph describe well the shapes of the data distributions, hence we are entitle to use them to derive the AXB correction factors to the data.

P.Kokkas, Univ. of Ioannina 23
Closure test
• PYTHIA MC events were considered as “data” (top left).• Madgraph MC events were considered as “MC” and used to evaluate factor AxB (bottom left). • Then with AxB from Madgraph, PYTHIA CaloJets were corrected and compared with GenJets from
PYTHIA (top right).• The corrected PYTHIA CaloJet ratio (with AxB from Madgraph) is within ±5% from the GenJet ratio
except the first bin which is off by ≈10%.
AxB from Madgraph
PYTHIA PYTHIA Corrected
24
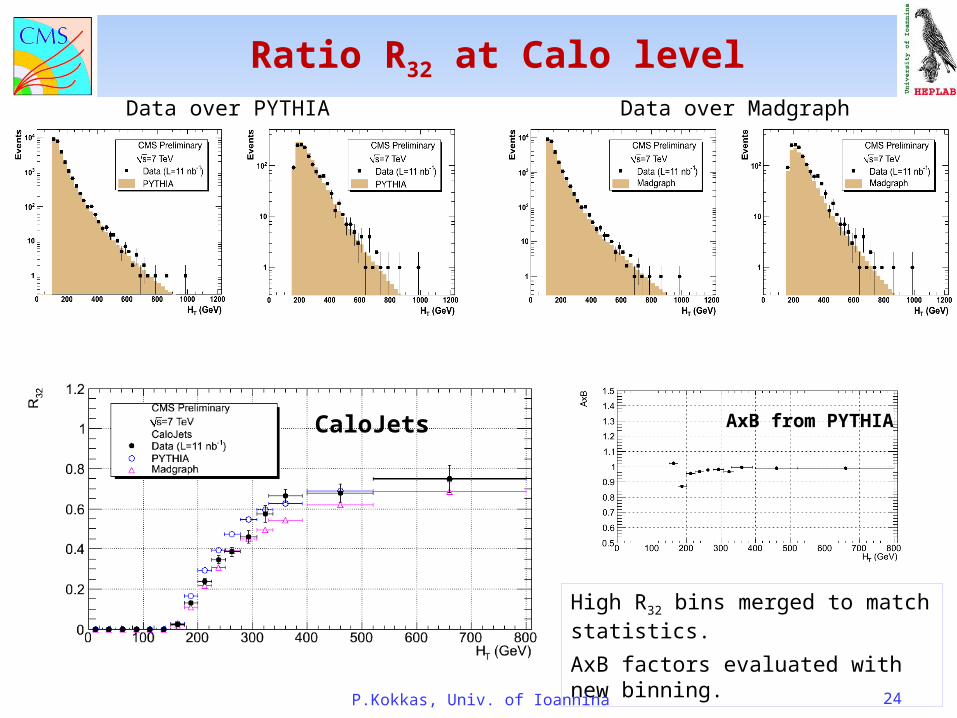
Ratio R32 at Calo levelData over PYTHIA Data over Madgraph
High R32 bins merged to match statistics.
AxB factors evaluated with new binning.
AxB from PYTHIACaloJets
P.Kokkas, Univ. of Ioannina

P.Kokkas, Univ. of Ioannina 25
Ratio R32 at Hadron Level
• Measured ratio rises with HT in the range 150≤HT≤800 GeV in agreement with predictions of PYTHIA and Madgraph.
PAS

P.Kokkas, Univ. of Ioannina 26
Studies on the Systematic uncertainties.
• Studies on Systematics
• Jet Energy Scale (JES) systematics• Absolute scale : flat 10% JES uncertainty• Relative scale : 2% for every unit of pseudorapidity
• Systematic uncertainty due to difference in shape between data and MC• Reweight the pT and HT spectra so that the shape of distributions changes and
repeat the analysis to compute systematic.
• Systematic uncertainty due to detector response• Smearing Calo Jets by 10% and 15% while leaving Hadron jets unchanged.

P.Kokkas, Univ. of Ioannina 27
Jet Energy Scale (JES) systematics : Absolute Scale
The pT≥50 GeV/c cut modulates the efficiency at low HT
Above 400 GeV we observe a rather flat distribution shifted by 50% to 80%
Absolute scale : flat 10% JES uncertainty

P.Kokkas, Univ. of Ioannina 28
Jet Energy Scale (JES) systematics : Absolute Scale
Smearing effects dominate
• We observe a strong uncertainty cancellation (uncertainty less than 5%).• For the first two bins bellow 200 GeV systematics are of the order of 10%.
Absolute scale : flat 10% JES uncertainty

P.Kokkas, Univ. of Ioannina 29
Jet Energy Scale (JES) systematics : Relative Scale
Relative scale : 2% for every unit of pseudorapidity
• This results to a systematic uncertainty which is significantly small than the previous.
)Jet(0.02 1 Jet Jet TT pp

Systematic uncertainty due to difference in shape between data and MC
onsDistributi Normal
No reweightnJets≥2
Pythia with harder pT spectrumnJets≥2
Pythia withsofter pT spectrumnJets≥2
No reweightnJets≥3
Pythia with harder pT spectrumnJets≥3
Pythia with softer pT spectrumnJets≥3
TGenJet1p0.71weightweight TGenJet1p0.11weightweight
• To see how sensitive we are to smearing corrections we assume that the detector response is correct in the MC and we change the underline physics by reweighting and we observe the change in the measured ratio due to different smearing effects.
• Reweight the pT and HT spectra so that the shape of distributions changes and repeat the analysis to compute systematic.
30

P.Kokkas, Univ. of Ioannina 31
Systematic uncertainty due to difference in shape between data and MC
• This uncertainty, while probably over-estimated, is of the same order of the JES uncertainty.

P.Kokkas, Univ. of Ioannina 32
Systematics due to detector response
Smearing Calo Jets by 10% or 15% while leaving Hadron jets unchanged.
TT
TT
pJet Second pJet Leading
pJet Second - pJet Leading
10% Smearing
15% Smearing
With 10% smearing MC shapedescribes data better.
We plot :
%2.624819
1532CaloR
%7.524821
1416CaloR
GeV 800 H 100
PYTHIA32
Data32
T

P.Kokkas, Univ. of Ioannina 33
Systematics due to detector response : smearing by 10%
• Results consistent with previous studies. • Uncertainty ≈5% , except the first two bins bellow 200 GeV where uncertainty is of the order of 10%.
Smearing Calo Jets by 10% while leaving Hadron jets unchanged.

P.Kokkas, Univ. of Ioannina 34
Systematics due to detector response : smearing by 15%
Smearing Calo Jets by 15% while leaving Hadron jets unchanged.
• Results consistent with previous studies. • Uncertainty ≈5% , except the first two bins bellow 200 GeV where uncertainty is of the order of 10%.

P.Kokkas, Univ. of Ioannina 35
Summary
• Summary:• The ratio of the inclusive three-jet over two-jet cross sections as a function of the
total jet transverse energy, HT, has been measured with the CMS detector at the LHC for proton-proton center-of-mass energy 7 TeV using an integrated luminosity of 10.8 nb-1.
• Measurements have been performed for jets with pT ≥50 GeV in the rapidity range |y| ≤2.5.
• The measured ratio rises with HT in the range 150≤HT≤800 GeV.• The measured ratio is consistent with the predictions of PYTHIA and MadGraph.

P.Kokkas, Univ. of Ioannina 36
Spare

P.Kokkas, Univ. of Ioannina 37
Gen HT for PYTHIA and Madgraph
PYTHIA Madgraph
The cross section predicted by Madgraph is consistently ≈30% lower than PYTHIA’s

P.Kokkas, Univ. of Ioannina 38
Predicted R32 with various pT – y cuts
Both Figures demonstrate theinfluence of the threshold cutson pT and y to the measurement.

39
Main HLT Jet Trigger efficiencies
HLT Jet Trigger
L1 Prerequisite Prescaled Turn on points (GeV)Raw pT
Turn on points (GeV)corrected pT
HLT L1Jet6U L1 SingleJet6U yes 13 28
HLT Jet15U L1 SingleJet6U no 16 37
HLT Jet30U L1 SingleJet6U no 32 60
HLT Jet50U L1 SingleJet6U no ≈53 >80
Main HLT Jet Triggers
Raw pT Corrected pT

P.Kokkas, Univ. of Ioannina 40
Ratio R32 at Calo level
CaloJets

P.Kokkas, Univ. of Ioannina 41
AxB from PYTHIA and Madgraph
• Correction factors AxB from PYTHIA and Madgraph agrees better than 5%. • Except the two first bins where disagreement is ≈10%.

P.Kokkas, Univ. of Ioannina 42
Residual Corrections
According to JEC group a residualcorrection for η>1.5 is needed (on the top of the Default L2L3).
Selection Events Eventswith Residual Corrections
At least 2 jets 24823 23909
At least 3 jets 1418 1369
• The effect is ≈ 3%. • Small effect to the measurement.

P.Kokkas, Univ. of Ioannina 43
Analysis without JetID selection
Selection EventsWith ‘’Loose”
JetID
EventsWithout
‘’Loose” JetID
At least 2 jets 24823 24891
At least 3 jets 1418 1420
The effect of the “loose” JetID selection is ≈ 0.3%.
P.Kokkas, Univ. of Ioannina 44
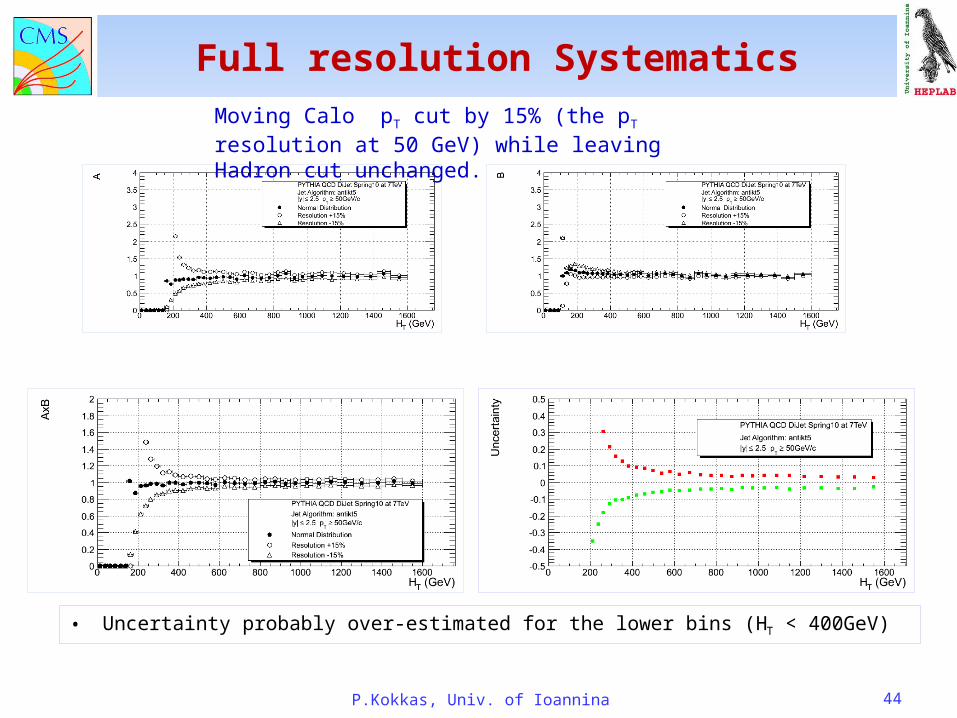
Full resolution SystematicsMoving Calo pT cut by 15% (the pT resolution at 50 GeV) while leaving Hadron cut unchanged.
• Uncertainty probably over-estimated for the lower bins (HT < 400GeV)