Embed Size (px)
Citation preview
J. Astrophys. Astr. (2000) 21, 1–17 A Measurement of the Cosmic Microwave Background Temperature at 1280 MHz A. Raghunathan & Ravi Subrahmanyan*, Raman Research Institute, C. V. Raman Avenue, Bangalore – 560 080, India *Present address: Australia Telescope National Facility, CSIRO, Locked bag 194, Narrabri, NSW, Australia. Received 2000 April 18; accepted 2000 May 11
Abstract. The absolute temperature of the cosmic microwave back-ground (CMB) has been measured at a frequency of 1280 MHz. The observation was made with a modified version of the L-band receiver used in the Giant Metre wavelength Radio Telescope (GMRT): the feed horn was replaced by a corrugated plate and the receiver was placed on the ground, directed at zenith, and shielded from ground radiation by an aluminium screen with corrugated edges. Novel techniques have been adopted for • reducing and cancelling unwanted contributions to the system tempera-
ture of the receiver and • calibrating the contributions from the feed assembly and receiver. The thermodynamic temperature of the CMB is estimated to be 3.45 ± 0.78 K. Key words. Cosmic microwave background — cosmology: observations.
1. Introduction The spectrum of the cosmic microwave background (CMB) has been measured by the COBE-FIRAS experiment (Fixen et al. 1996) to be very closely Plankian in form over the frequency range 70–640 GHz; the best-fit thermodynamic temperature of the radiation was determined to be 2.728 ± 0.004 Κ over this frequency range. This is consistent with the expectation – within the Standard big-bang cosmology – that the relict radiation was thermalized via free-free and radiative Compton scattering at redshifts z > z th ∼ 7.5 × 10⁶ (Burigana, Danese & De Zotti 1991).
The damping of small wavelength (large k-mode) sub-horizon scale baryon adiabatic perturbations – as a result of photon diffusion – may be viewed as a mixing of radiation with different thermodynamic temperatures. As a consequence, the Plankian radiation spectrum undergoes a y-type distortion: it may be characterized by a Compton-y parameter. Damping of perturbations that ‘enter’ the horizon at epochs z < zth when thermalization processes had ceased to be effective, but at epochs z > zc ∼ 1.6 × 10⁵ when Compton scattering was capable of driving the radiation spectrum to kinetic equilibrium, resulted in a transformation of the y distortions to µ- type distortions characterised by a chemical potential (Daly R.A. 1991; Hu, Scott & Silk 1994). These µ distortions are inevitable in ‘standard’ theories of structure
1
2 A. Raghunathan & Ravi Subrahmanyan formation; the magnitude of the distortion is a probe of the amplitude of the primordial perturbation spectrum at large k modes or – combined with the COBE normalization for small k modes – may be viewed as a probe of the index n of a power-law form spectrum.
Besides the inevitable distortions from structure formation, any processes that release radiant energy in the redshift interval zth > z > zc would result in a µ distortion in the CMB today. For example, the decay of particles with half lives in this range of cosmic epochs could be probed via the expected µ distortions in the relict CMB (Silk & Stebbins 1983). Α simple µ distortion in a Plankian spectrum manifests as a divergence in the
thermodynamic temperature with increasing wavelength. However, because the ther- mal bremsstrahlung, which is one of the processes responsible for the thermalization of the radiation at redshifts z > zth, has a frequency dependence and is more effective at longer wavelengths, distortions at long wavelengths are thermalized and consequently the thermodynamic temperature of the radiation may be expected to have an extermum in its deviation. Maximum distortion occurs at about a wavelength λm ~ 30 cm (Burigana, Danese & De Zotti 1991).
µ distortions in the CMB that arise as a consequence of processes at epochs zth > z > zc may, therefore, be best constrained by measurements of the absolute temperature of the CMB at frequencies about 1 GHz. We have attempted to make a measurement of the thermodynamic temperature of the CMB at 1280 MHz.
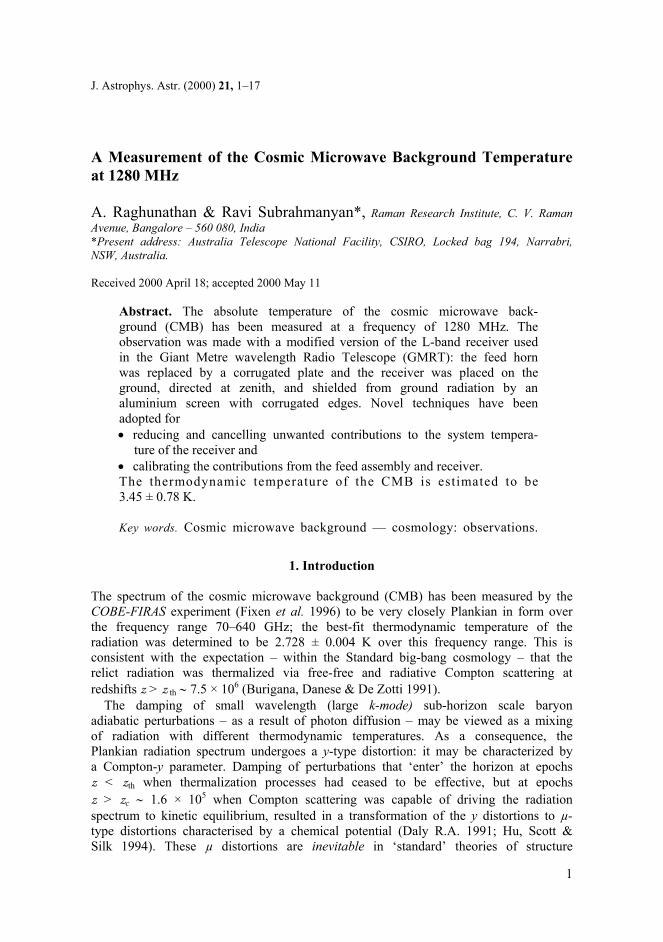
2. The receiver system The receiver used for the measurement described in this work is a modified form of the L-band front-end package built for the Giant Metrewave Radio Telescope (GMRT; Swarup et al. 1991, 1997). This receiver was designed to be a package mounted at the prime focus of the GMRT antennae and its feed horn was designed to illuminate the parabolic dish aperture. For our experiment, the receiver package was placed on the ground and pointed at zenith. A schematic of the receiver configuration is shown in Fig. 1.
The corrugated feed-horn used in the GMRT receiver was replaced by a flat plate with concentric corrugations; this is directly connected to the top of the quadridged orthomode transducer (OMT) and serves as the interface between free space and the transducer. The OMT is a circular cylindrical waveguide and at the bottom end the
Figure 1. Schematic diagram of the 1280 MHz receiver.
Cosmic Microwave Background Temperature at 1280 MHz 3 signal is transduced onto coaxial cables. Although the OMT provides dual orthogonal polarizations, only a single linearly polarized signal (‘V’ port signal) has been used for the background measurement. This coaxial signal is fed to a low- noise amplifier (LNA) through a circulator. In section 3, we elaborate on issues related to the introduction of this circulator. The LNA output is connected to a chain of band-pass filters and is effectively limited to a 120 MHz band centred at 1280 MHz. The receiver package is at ambient temperature and no part is cooled.
The receiver output is connected to a spectrum analyser through a commercial Miteq amplifier. The noise figure of the spectrum analyser is so high that in the absence of the Miteq amplifier, the spectrum analyser’s noise contribution degrades the signal-to-noise by contributing significantly to the overall system temperature. The power spectrum is measured by reading the trace of the spectrum analyser using a general purpose interface board (GPIB) and the spectral data are acquired through a personal computer.
The receiver and feed assembly are surrounded by an aluminium shield to mini- mize ground radiation leakage into the feed. The design of the shield and measure- ments of the ground contribution are detailed respectively in sections 4 and 12.
The cosmic microwave background temperature (T CMB) has been measured using the above receiver at 1280 MHz over a bandwidth of 100 MHz. The signal power incident at the corrugated plate (feed) will be an additive combination of contributions from the cosmic microwave background, emission from the Milky Way Galaxy, atmospheric emission and ground contribution through sidelobes of the feed assembly. Therefore, the noise temperature entering the feed plate will be the sum of the Galactic temperature TGal, atmospheric temperature Tatm , ground temperature Tgnd and cosmic microwave background temperature TCMB For an accurate determination of T CMB, it is necessary to know the values of TGal, Tatm , and Tgnd so that these may be subtracted from the measurement of power at the feed plate. In sections below, these contributions are separately estimated.
The noise power entering the feed propagates via the OMT and circulator before amplification in the LNA. Beyond this point, the high gain in the LNA and the negligible signal-to-noise-ratio degradation in successive stages ensure that any additive noise contributions are insignificant. Following the calibration scheme discussed below in section 7, the power measured by the spectrum analyser is calibrated to represent the equivalent noise power referred to in the input port (port 1) of the circulator. Expressed in Kelvin, this noise power represents the total system temperature Tsys In order to estimate the noise power entering the feed and isolate this component in a measurement of the total system temperature, it is necessary to separately measure system parameters like the receiver temperature ( TR ) and the reflection coefficient (Γ) and the absorption coefficient (α) of the feed assembly (corrugated plate + OMT).
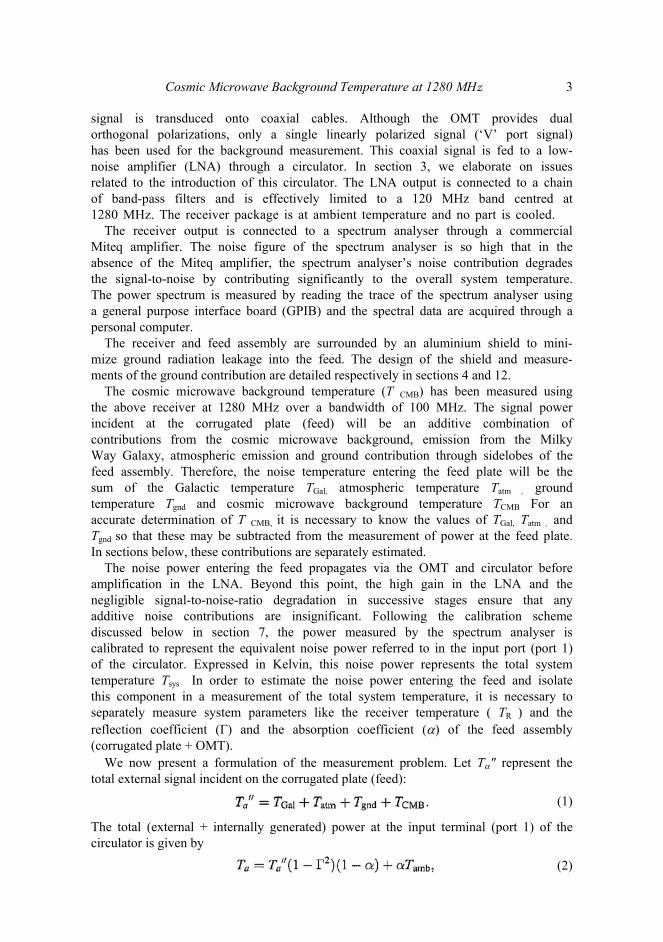
We now present a formulation of the measurement problem. Let Tα" represent the total external signal incident on the corrugated plate (feed):
(1)
The total (external + internally generated) power at the input terminal (port 1) of the circulator is given by
(2)
4 A. Raghunathan & Ravi Subrahmanyan where the antenna temperature Ta is represented as an additive sum of the external power – corrected for attenuations and reflections in the feed assembly – and the internal noise generated as a consequence of the loss in the feed assembly. The feed assembly is at ambient temperature Tamb. The system temperature Tsys, as referred to the input of the circulator (port 1), is given by
(3)
In this equation, the first term on the right represents the net external signal present at the input of the circulator, the second term represents the thermal noise contribution from the feed assembly and the third term is the receiver temperature as referred to the circulator input. Measurements of the various parameters in the above equations are necessary for an estimation of the absolute value of TCMB from a measurement of the calibrated system temperature at the input of the circulator.
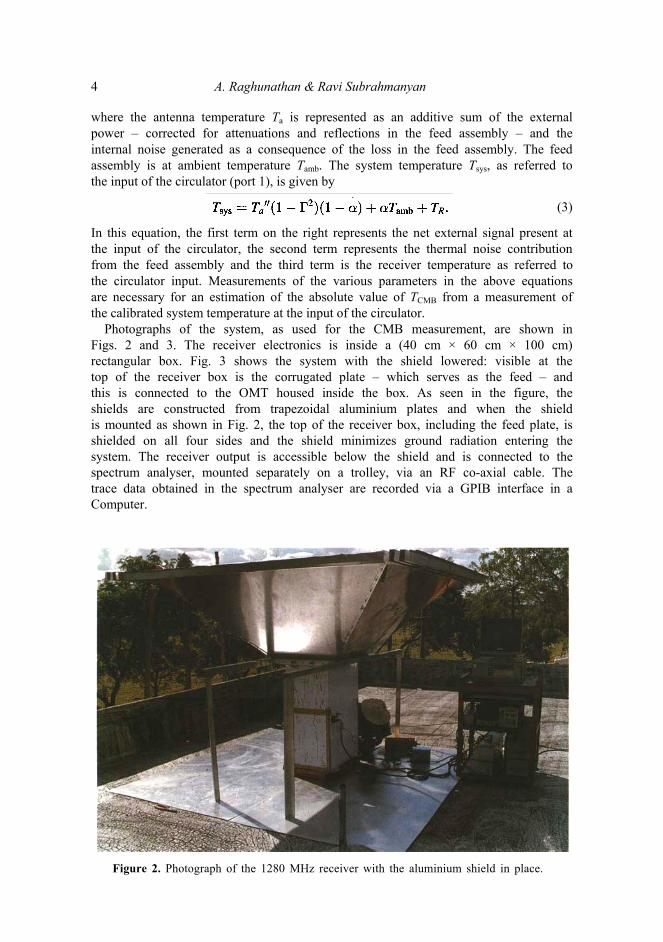
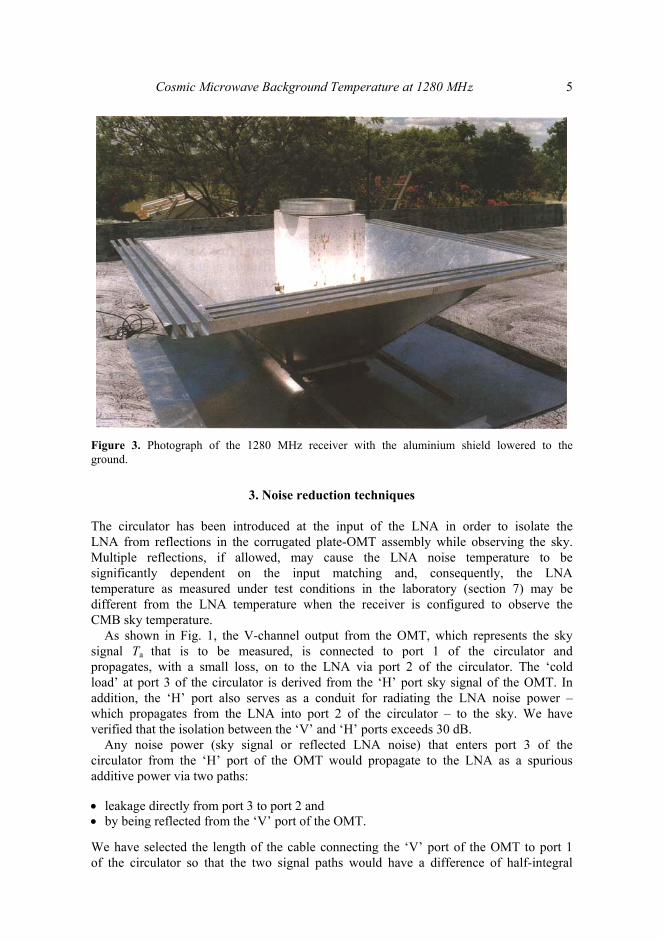
Photographs of the system, as used for the CMB measurement, are shown in Figs. 2 and 3. The receiver electronics is inside a (40 cm × 60 cm × 100 cm) rectangular box. Fig. 3 shows the system with the shield lowered: visible at the top of the receiver box is the corrugated plate – which serves as the feed – and this is connected to the OMT housed inside the box. As seen in the figure, the shields are constructed from trapezoidal aluminium plates and when the shield is mounted as shown in Fig. 2, the top of the receiver box, including the feed plate, is shielded on all four sides and the shield minimizes ground radiation entering the system. The receiver output is accessible below the shield and is connected to the spectrum analyser, mounted separately on a trolley, via an RF co-axial cable. The trace data obtained in the spectrum analyser are recorded via a GPIB interface in a Computer.
Figure 2. Photograph of the 1280 MHz receiver with the aluminium shield in place.
Cosmic Microwave Background Temperature at 1280 MHz 5
Figure 3. Photograph of the 1280 MHz receiver with the aluminium shield lowered to the ground.
3. Noise reduction techniques The circulator has been introduced at the input of the LNA in order to isolate the LNA from reflections in the corrugated plate-OMT assembly while observing the sky. Multiple reflections, if allowed, may cause the LNA noise temperature to be significantly dependent on the input matching and, consequently, the LNA temperature as measured under test conditions in the laboratory (section 7) may be different from the LNA temperature when the receiver is configured to observe the CMB sky temperature.
As shown in Fig. 1, the V-channel output from the OMT, which represents the sky signal Τa that is to be measured, is connected to port 1 of the circulator and propagates, with a small loss, on to the LNA via port 2 of the circulator. The ‘cold load’ at port 3 of the circulator is derived from the ‘H’ port sky signal of the OMT. In addition, the ‘H’ port also serves as a conduit for radiating the LNA noise power – which propagates from the LNA into port 2 of the circulator – to the sky. We have verified that the isolation between the ‘V’ and ‘H’ ports exceeds 30 dB.
Any noise power (sky signal or reflected LNA noise) that enters port 3 of the circulator from the ‘H’ port of the OMT would propagate to the LNA as a spurious additive power via two paths:
• leakage directly from port 3 to port 2 and • by being reflected from the ‘V’ port of the OMT.
We have selected the length of the cable connecting the ‘V’ port of the OMT to port 1 of the circulator so that the two signal paths would have a difference of half-integral
6 A. Raghunathan & Ravi Subrahmanyan wavelengths. Consequently, the ‘phase-compensation’ cable (Fig. 1) causes a partial cancellation of the spurious signal power and enhances the isolation, by an additional 5 dB, of the LNA from spurious signals entering via port 3.
4. Ground shields The OMT in the receiver is a uniform circular waveguide. Usually, the free-space impedance is matched to the OMT impedance via a feed; in the case of the GMRT, a wide-flare-angle corrugated scalar horn is used. Derivation of the sky temperature from system temperature measurements requires a characterization of the losses in the feed assembly. The losses in the OMT are measured, as discussed below, by taking advantage of the fact that the OMT is uniform; however, the losses in any tapered horn are difficult to measure. Therefore, we omitted the feed horn from our receiver system. As a consequence:
• on the positive side we do not have to measure any losses in any feed system, • the negative aspect is that the OMT is now poorly matched to free space. The mismatch is measured, as described below, by taking advantage of reciprocity in the passive OMT.
Steps are taken to minimise the ground contribution as much as possible. We have chosen to have a simple corrugated plate on the top of the OMT to reduce the far-off sidelobes in the instrument response. The plate reactively, rather than resistively, attenuates any incoming power from directions at large angles to the OMT axis. Because this interface between the OMT and free space, which replaces the feed horn, acts only on signals incident at large off-axis angles where the OMT response is low, and because the corrugated plate is a reactive block, we do not expect any significant contribution from the plate to the system temperature.
We have also constructed a solid aluminium ground shield to further reduce the ground contribution. In order to reduce diffractive leakage of ground emission around the edges of the shield, chokes are placed all along the periphery of the shield around the receiver. In addition, as shown in Figs. 2 and 3, an aluminium sheet covers the ground directly below the system.
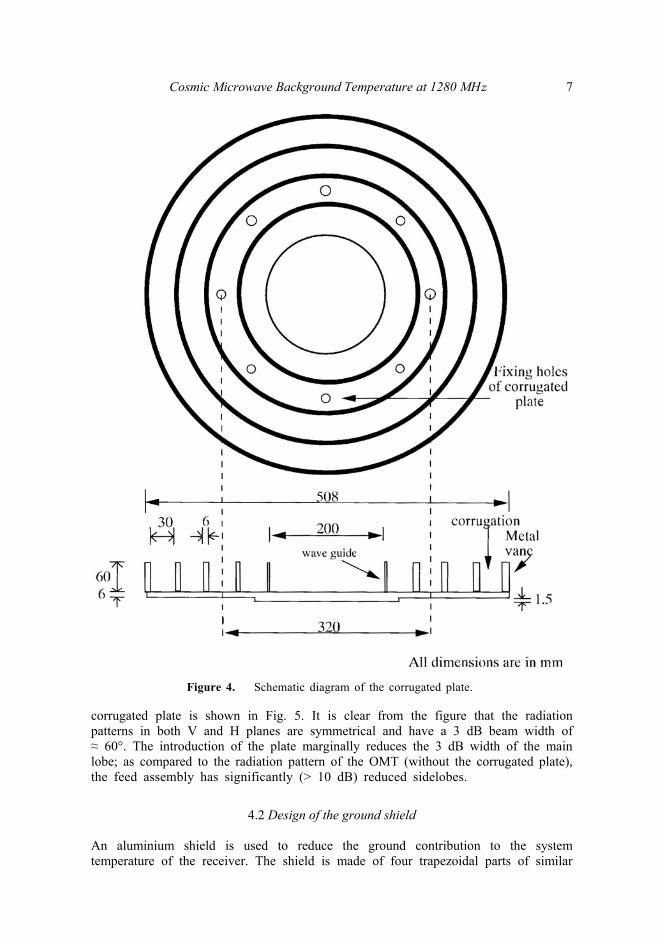
4.1 Design of the corrugated plate A circular aluminium plate of 6 mm thickness and with outside diameter equal to 508 mm and inner diameter equal to 200 mm is used as a base for the choke slots. Three concentric corrugations are formed on this plate using 6 mm thick and 60 mm wide aluminium strips bent in the form of rings of different diameters as shown in Fig 4. The width of the circular strips are chosen to be λ/4 at the centre frequency (1280 MHz); this makes the corrugations λ/4 deep. The rings are spaced at approximately 0.125λ (30 mm) apart and this dimension will be the width of the concentric corrugation slots. These circular rings are fastened onto the metal plate using screws. For good electrical continuity, tinned copper braid is introduced between the circular rings and the base plate before fastening. The corrugated plate is attached to the OMT via an interface plate. The radiation pattern of the OMT with the
Cosmic Microwave Background Temperature at 1280 MHz 7
Figure 4. Schematic diagram of the corrugated plate.
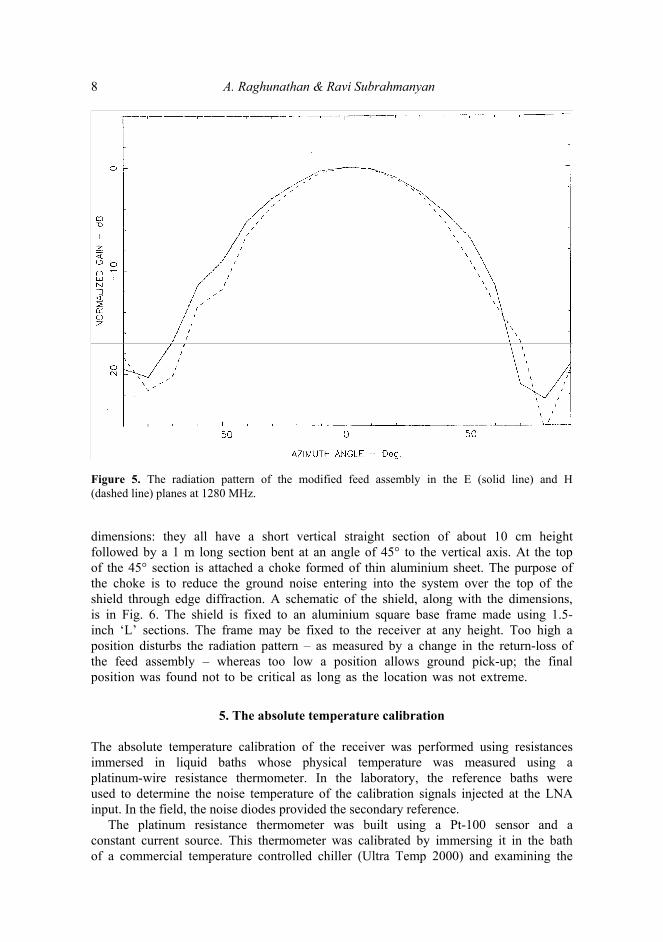
corrugated plate is shown in Fig. 5. It is clear from the figure that the radiation patterns in both V and Η planes are symmetrical and have a 3 dB beam width of ≈ 60°. The introduction of the plate marginally reduces the 3 dB width of the main lobe; as compared to the radiation pattern of the OMT (without the corrugated plate), the feed assembly has significantly (> 10 dB) reduced sidelobes.
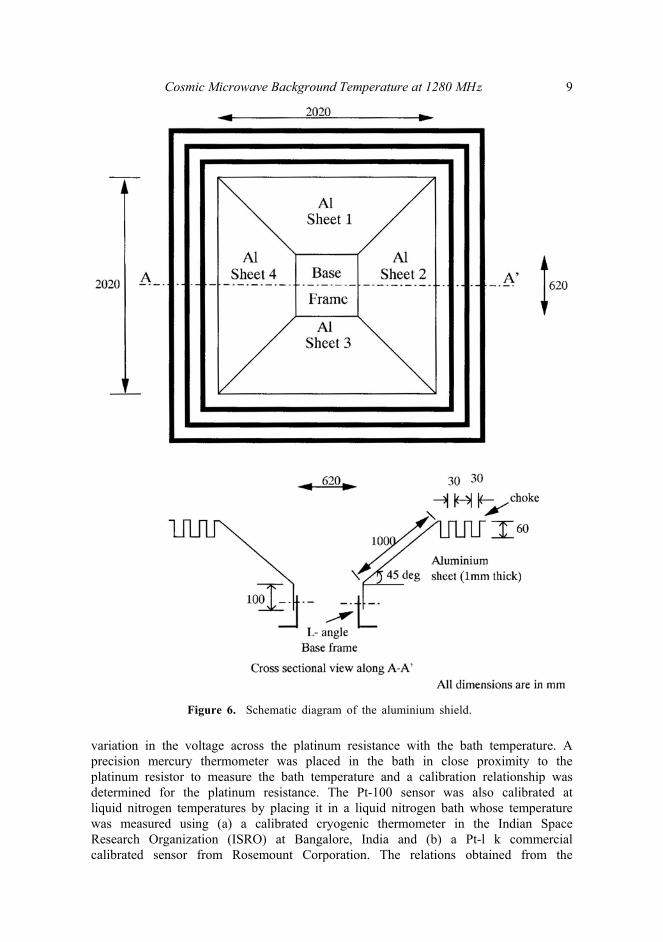
4.2 Design of the ground shield An aluminium shield is used to reduce the ground contribution to the system temperature of the receiver. The shield is made of four trapezoidal parts of similar
8 A. Raghunathan & Ravi Subrahmanyan
Figure 5. The radiation pattern of the modified feed assembly in the Ε (solid line) and Η (dashed line) planes at 1280 MHz. dimensions: they all have a short vertical straight section of about 10 cm height followed by a 1 m long section bent at an angle of 45° to the vertical axis. At the top of the 45° section is attached a choke formed of thin aluminium sheet. The purpose of the choke is to reduce the ground noise entering into the system over the top of the shield through edge diffraction. A schematic of the shield, along with the dimensions, is in Fig. 6. The shield is fixed to an aluminium square base frame made using 1.5- inch ‘L’ sections. The frame may be fixed to the receiver at any height. Too high a position disturbs the radiation pattern – as measured by a change in the return-loss of the feed assembly – whereas too low a position allows ground pick-up; the final position was found not to be critical as long as the location was not extreme.
5. The absolute temperature calibration The absolute temperature calibration of the receiver was performed using resistances immersed in liquid baths whose physical temperature was measured using a platinum-wire resistance thermometer. In the laboratory, the reference baths were used to determine the noise temperature of the calibration signals injected at the LNA input. In the field, the noise diodes provided the secondary reference.
The platinum resistance thermometer was built using a Pt-100 sensor and a constant current source. This thermometer was calibrated by immersing it in the bath of a commercial temperature controlled chiller (Ultra Temp 2000) and examining the
Cosmic Microwave Background Temperature at 1280 MHz 9
Figure 6. Schematic diagram of the aluminium shield.
variation in the voltage across the platinum resistance with the bath temperature. A precision mercury thermometer was placed in the bath in close proximity to the platinum resistor to measure the bath temperature and a calibration relationship was determined for the platinum resistance. The Pt-100 sensor was also calibrated at liquid nitrogen temperatures by placing it in a liquid nitrogen bath whose temperature was measured using (a) a calibrated cryogenic thermometer in the Indian Space Research Organization (ISRO) at Bangalore, India and (b) a Pt-l k commercial calibrated sensor from Rosemount Corporation. The relations obtained from the
10 A. Raghunathan & Ravi Subrahmanyan calibration measurements for the determination of temperature using the measured voltages were
V = 195.531799 + 0.757149(T + 273.15), and (4) V = 0.83T – 25.88, (5)
where Τ is the temperature of the sensor in Kelvin and V is the voltage measured across the sensor in volts. Equation 4 is used while measuring the temperature in the range 0–100°C and equation 5 is used in the temperature range 50–100 K. The calibrated platinum resistance thermometer is estimated to give the temperature of liquid nitrogen baths accurate to within 0.2 Κ and the temperature of water in the range 0–100°C to within 0.1 K.
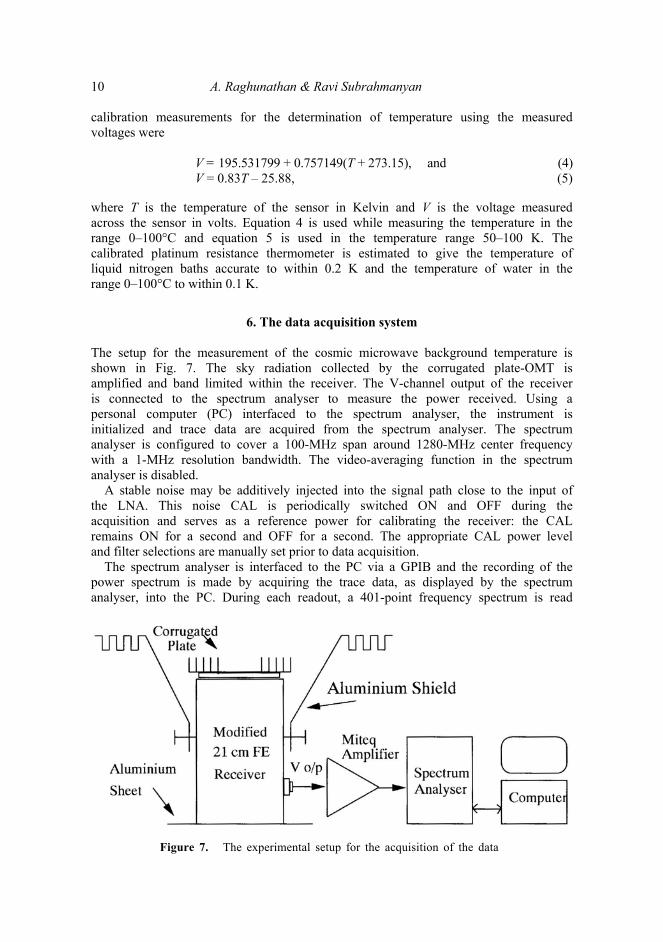
6. The data acquisition system The setup for the measurement of the cosmic microwave background temperature is shown in Fig. 7. The sky radiation collected by the corrugated plate-OMT is amplified and band limited within the receiver. The V-channel output of the receiver is connected to the spectrum analyser to measure the power received. Using a personal computer (PC) interfaced to the spectrum analyser, the instrument is initialized and trace data are acquired from the spectrum analyser. The spectrum analyser is configured to cover a 100-MHz span around 1280-MHz center frequency with a 1-MHz resolution bandwidth. The video-averaging function in the spectrum analyser is disabled.
A stable noise may be additively injected into the signal path close to the input of the LNA. This noise CAL is periodically switched ON and OFF during the acquisition and serves as a reference power for calibrating the receiver: the CAL remains ON for a second and OFF for a second. The appropriate CAL power level and filter selections are manually set prior to data acquisition.
The spectrum analyser is interfaced to the PC via a GPIB and the recording of the power spectrum is made by acquiring the trace data, as displayed by the spectrum analyser, into the PC. During each readout, a 401-point frequency spectrum is read
Figure 7. The experimental setup for the acquisition of the data
Cosmic Microwave Background Temperature at 1280 MHz 11 from the spectrum analyser. In each 2-sec period, 120 × 2 traces are read (120 with CAL in ON state and 120 with CAL OFF) and the traces are averaged separately for the CAL ON and CAL OFF states over the 100 MHz band. The laboratory determination of the CAL noise temperature (Tcal) — this procedure is described in section 7 – is used to calibrate the temperature scale of the acquired trace data. It may be noted here that the internal calibration of the spectrum analyser is not used for determining the temperature scale.
This acquisition system was used not only for making measurements of the CMB sky power but also in all the calibration measurements described below for determining TR, Tcal and α. This ensured that all calibration measurements were made over the same frequency band and with the same spectral weighting.
Because we use the spectrum analyser to acquire the data, which effectively sweeps a narrow filter with 1 MHz width across the 100 MHz band in order to measure the spectrum, the effective integration time is only about 1 per cent of the observing duration. With our system, spectra are measured with a fractional accuracy of about 0.13 per cent if data are acquired for a period of one hour.
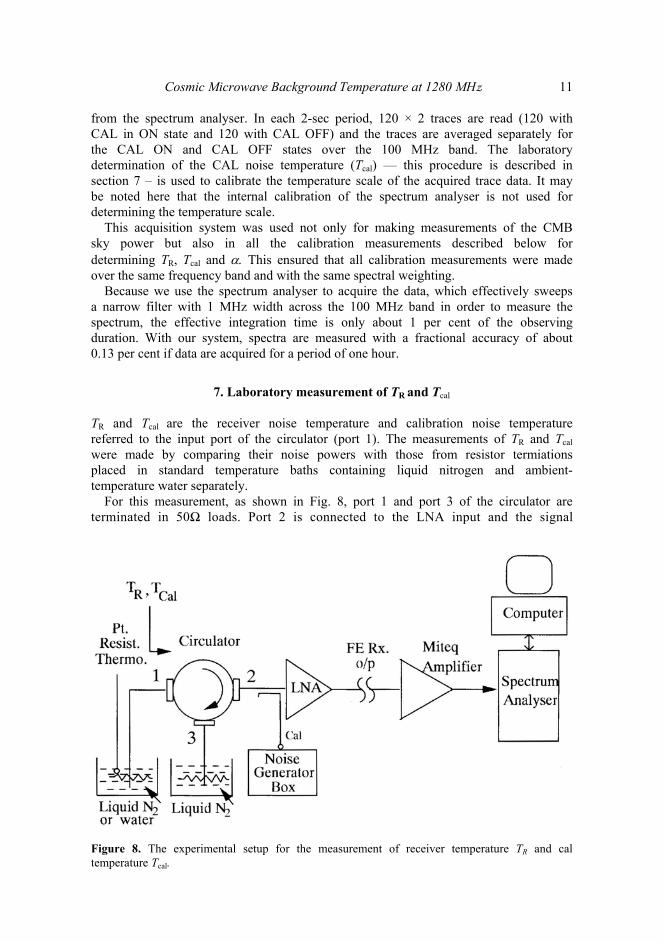
7. Laboratory measurement of TR and Tcal TR and Tcal are the receiver noise temperature and calibration noise temperature referred to the input port of the circulator (port 1). The measurements of TR and Tcal were made by comparing their noise powers with those from resistor termiations placed in standard temperature baths containing liquid nitrogen and ambient- temperature water separately.
For this measurement, as shown in Fig. 8, port 1 and port 3 of the circulator are terminated in 50Ω loads. Port 2 is connected to the LNA input and the signal
Figure 8. The experimental setup for the measurement of receiver temperature TR and cal temperature Tcal.
12 A. Raghunathan & Ravi Subrahmanyan continues through to the rest of the receiver and acquisition system. The termination at port 3 is kept immersed in liquid nitrogen, while the termination at port 1 is separately immersed in liquid nitrogen and then ambient temperature water for the process of calibration. The calibrated platinum resistance thermometer is used to measure the temperature of the 50 Ω load at port 1. The calibration signal (Tcal) is injected in alternate seconds of time as would be done during the sky temperature measurement.
The measured uncalibrated noise powers Pon and Poff , corresponding to the states when the CAL is ON and OFF, are used to compute y-factors: (Pon – Poff)/Ρ off . The y-factors x and y corresponding to the measurements with the port 1 load at ambient temperature Tamb and at liquid nitrogen temperature TN2 are used to estimate the LNA noise temperature
(6) and the CAL noise temperature
(7)
The l-σ errors in the TR and Tcal estimates owing to measurement noise (corresponding to the finite bandwidth and averaging time of the measurement) are 0.38 Κ and 0.20 Κ respectively. The errors due to the uncertainty in the temperatures of the liquid nitrogen and ambient temperature water baths are 0.34 Κ for TR and 0.08 Κ for Tcal. The measured values of TR and Tcal are
TR = 52.12 ± 0.51 Κ and (8) Tcal = 70.166 ± 0.215 K, (9)
where the uncertainties quoted represent the net l-σ errors.
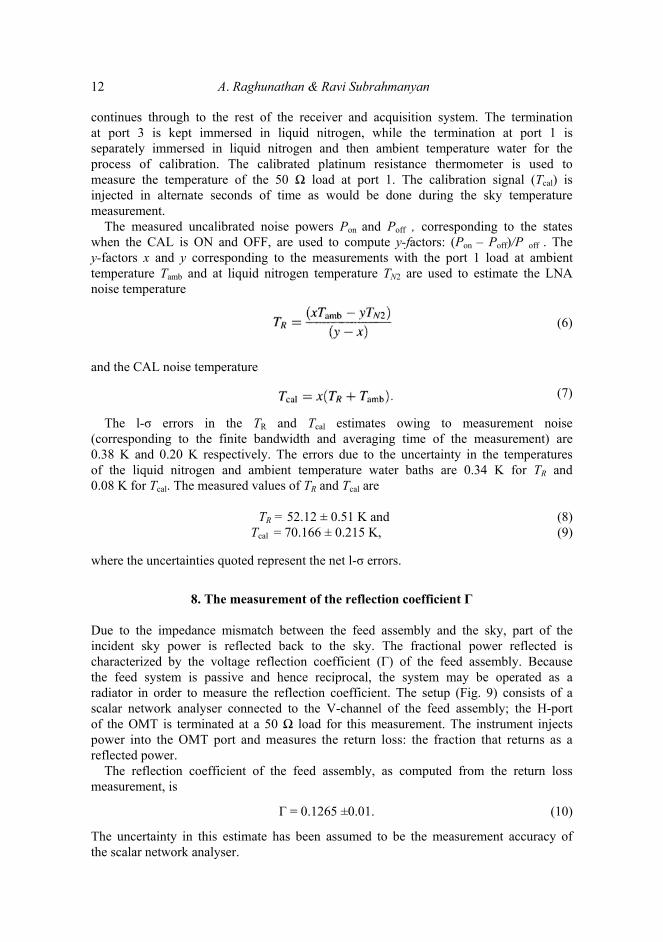
8. The measurement of the reflection coefficient Γ Due to the impedance mismatch between the feed assembly and the sky, part of the incident sky power is reflected back to the sky. The fractional power reflected is characterized by the voltage reflection coefficient (Γ) of the feed assembly. Because the feed system is passive and hence reciprocal, the system may be operated as a radiator in order to measure the reflection coefficient. The setup (Fig. 9) consists of a scalar network analyser connected to the V-channel of the feed assembly; the H-port of the OMT is terminated at a 50 Ω load for this measurement. The instrument injects power into the OMT port and measures the return loss: the fraction that returns as areflected power.
The reflection coefficient of the feed assembly, as computed from the return loss measurement, is
Γ = 0.1265 ±0.01. (10)
The uncertainty in this estimate has been assumed to be the measurement accuracy of the scalar network analyser.
Cosmic Microwave Background Temperature at 1280 MHz 13
Figure 9. The experimental setup for the measurement of the reflection co-efficient of the feed assembly.
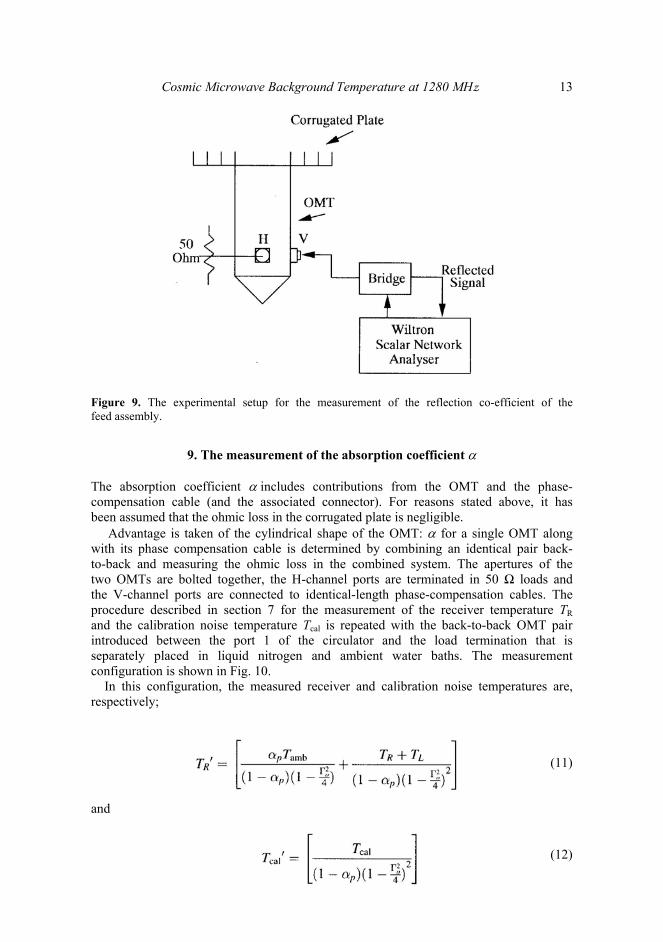
9. The measurement of the absorption coefficient α The absorption coefficient α includes contributions from the OMT and the phase- compensation cable (and the associated connector). For reasons stated above, it has been assumed that the ohmic loss in the corrugated plate is negligible.
Advantage is taken of the cylindrical shape of the OMT: α for a single OMT along with its phase compensation cable is determined by combining an identical pair back- to-back and measuring the ohmic loss in the combined system. The apertures of the two OMTs are bolted together, the Η-channel ports are terminated in 50 Ω loads and the V-channel ports are connected to identical-length phase-compensation cables. The procedure described in section 7 for the measurement of the receiver temperature TR and the calibration noise temperature Tcal is repeated with the back-to-back OMT pair introduced between the port 1 of the circulator and the load termination that is separately placed in liquid nitrogen and ambient water baths. The measurement configuration is shown in Fig. 10.
In this configuration, the measured receiver and calibration noise temperatures are, respectively;
(11) and
(12)
14 A. Raghunathan & Ravi Subrahmanyan
Figure 10. The experimental setup for the measurement of the absorption co-efficient of an OMT pair. in terms of the TR and Tcal values determined in section 7. In these equations, αp is the absorption coefficient of the OMT pair along with the two phase compensation cables, Γo is the voltage reflection coefficient of the OMT pair and ΤL is the small leakage signal at port 2 due to the load at port 3 of the circulator.
From the measurements, we find that the reflection coefficient of each OMT in this configuration is Γ0 /2 = 0.0912 and the absorption coefficient was determined to be
αp/2 = 0.031059 ± 0.0016. (13)
10. The galactic contribution ΤGal We estimate the galactic contribution to the sky signal from a 408 MHz all sky map (Haslam et al. 1982). The sky image is smoothed to the resolution of the feed assembly and the brightness temperature at 1280 MHz is computed assuming a spectral index of –2.7 for the temperature spectrum.
The sky background observations were made at zenith from the radio observatory site at Gauribidanur which is at a latitude of +13°.5. The observations were made at night to avoid the sun. The sky region observed was away from the galactic plane and was at approximately RA:10–12h and DEC:+13°.5. The value of the sky brightness T408 towards this region is 18 ± 2 Κ in the 408 MHz all sky map. Assuming that the CMB temperature at 408 MHz is 2.7 K, the galactic background temperature at 408 MHz may be 15.3 ± 2K. The galactic contribution at 1280 MHz is estimated to be
TGal = 0.9 ± 0.3K. (14)
The sources of uncertainty in this estimate are the uncertainty in the 408-MHz absolute temperature scale and the uncertainty in the spectral index of the galactic background.
Cosmic Microwave Background Temperature at 1280 MHz 15
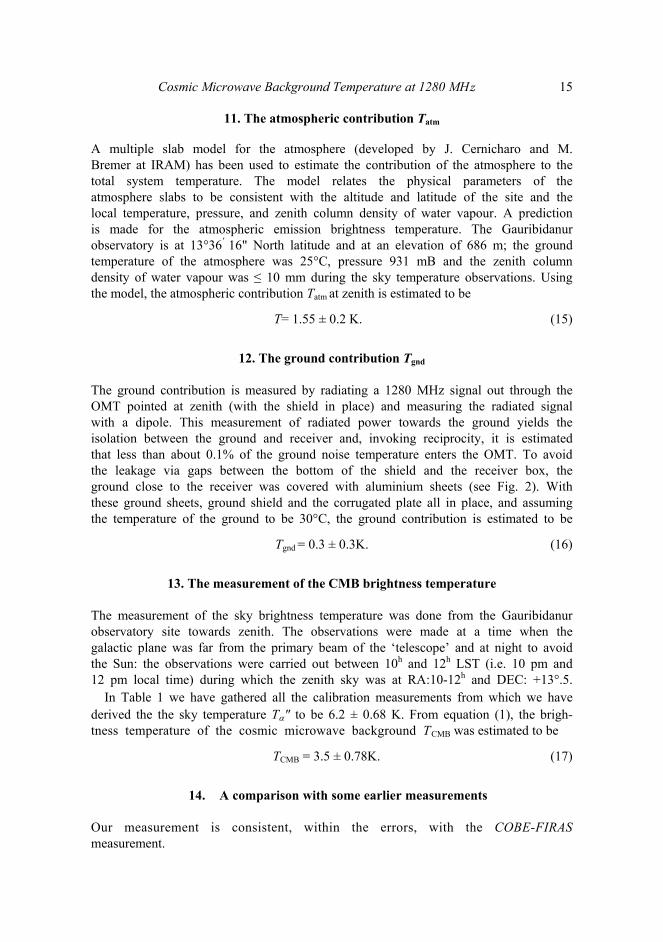
11. The atmospheric contribution Tatm Α multiple slab model for the atmosphere (developed by J. Cernicharo and Μ. Bremer at IRAM) has been used to estimate the contribution of the atmosphere to the total system temperature. The model relates the physical parameters of the atmosphere slabs to be consistent with the altitude and latitude of the site and the local temperature, pressure, and zenith column density of water vapour. A prediction is made for the atmospheric emission brightness temperature. The Gauribidanur observatory is at 13°36' 16" North latitude and at an elevation of 686 m; the ground temperature of the atmosphere was 25°C, pressure 931 mB and the zenith column density of water vapour was ≤ 10 mm during the sky temperature observations. Using the model, the atmospheric contribution Tatm at zenith is estimated to be
T= 1.55 ± 0.2 K. (15)
12. The ground contribution Tgnd The ground contribution is measured by radiating a 1280 MHz signal out through the OMT pointed at zenith (with the shield in place) and measuring the radiated signal with a dipole. This measurement of radiated power towards the ground yields the isolation between the ground and receiver and, invoking reciprocity, it is estimated that less than about 0.1% of the ground noise temperature enters the OMT. To avoid the leakage via gaps between the bottom of the shield and the receiver box, the ground close to the receiver was covered with aluminium sheets (see Fig. 2). With these ground sheets, ground shield and the corrugated plate all in place, and assuming the temperature of the ground to be 30°C, the ground contribution is estimated to be
Tgnd = 0.3 ± 0.3K. (16)
13. The measurement of the CMB brightness temperature The measurement of the sky brightness temperature was done from the Gauribidanur observatory site towards zenith. The observations were made at a time when the galactic plane was far from the primary beam of the ‘telescope’ and at night to avoid the Sun: the observations were carried out between 10h and 12h LST (i.e. 10 pm and 12 pm local time) during which the zenith sky was at RA:10-12h and DEC: +13°.5.
In Table 1 we have gathered all the calibration measurements from which we have derived the the sky temperature Tα" to be 6.2 ± 0.68 K. From equation (1), the brigh- tness temperature of the cosmic microwave background TCMB was estimated to be
TCMB = 3.5 ± 0.78K. (17)
14. A comparison with some earlier measurements Our measurement is consistent, within the errors, with the COBE-FIRASmeasurement.
16 A. Raghunathan & Ravi Subrahmanyan
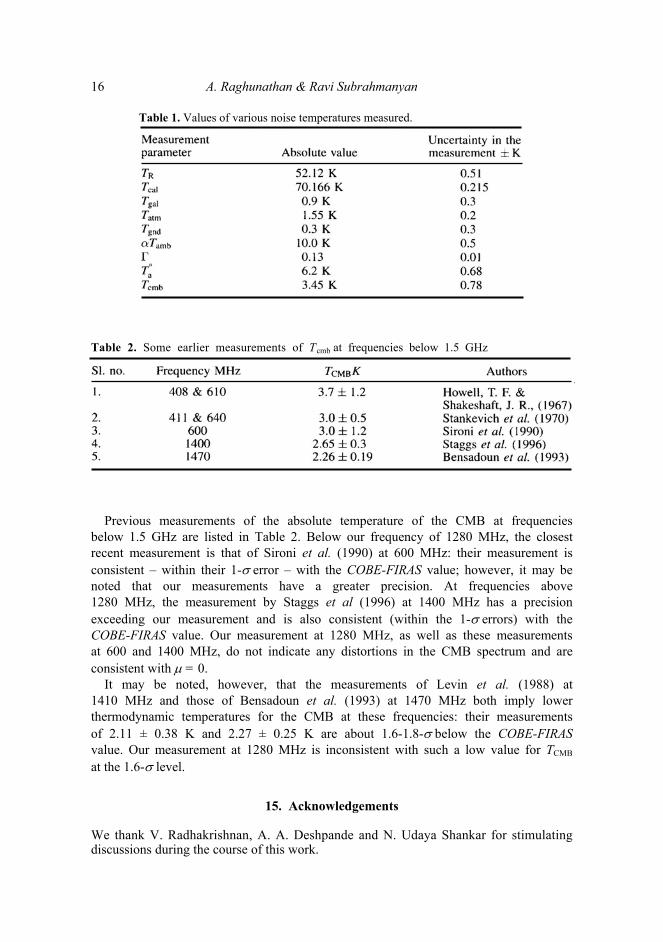
Table 1. Values of various noise temperatures measured.
Table 2. Some earlier measurements of Tcmb at frequencies below 1.5 GHz
Previous measurements of the absolute temperature of the CMB at frequenciesbelow 1.5 GHz are listed in Table 2. Below our frequency of 1280 MHz, the closestrecent measurement is that of Sironi et al. (1990) at 600 MHz: their measurement isconsistent – within their 1-σ error – with the COBE-FIRAS value; however, it may benoted that our measurements have a greater precision. At frequencies above1280 MHz, the measurement by Staggs et al (1996) at 1400 MHz has a precision exceeding our measurement and is also consistent (within the 1-σ errors) with the COBE-FIRAS value. Our measurement at 1280 MHz, as well as these measurements at 600 and 1400 MHz, do not indicate any distortions in the CMB spectrum and are consistent with μ = 0.
It may be noted, however, that the measurements of Levin et al. (1988) at 1410 MHz and those of Bensadoun et al. (1993) at 1470 MHz both imply lower thermodynamic temperatures for the CMB at these frequencies: their measurements of 2.11 ± 0.38 K and 2.27 ± 0.25 K are about 1.6-1.8-σ below the COBE-FIRAS value. Our measurement at 1280 MHz is inconsistent with such a low value for TCMB at the 1.6-σ level.
15. Acknowledgements We thank V. Radhakrishnan, A. A. Deshpande and N. Udaya Shankar for stimulatingdiscussions during the course of this work.
Cosmic Microwave Background Temperature at 1280 MHz 17
References Bensadoun, M., Bersanelli, M., De Amici, G., Kogut, A., Levin, S. M., Limon, M., Smoot, G.
F., Witebsky, C. 1993, Astrophys, J., 409, 1. Burigana, C., Danese, L., De Zotti, G. 1991, Astr. Astrophys, 246, 49. Daly, R. A. 1991, Astrophys, J 371, 14. Fixsen, D.J., Cheng E.S., Gales, J.M., Mather, J.C., Shafer, R.A., Wright, E.L. 1996,
Astrophys, J 486, 623. Haslam, C.G.T., Salter, C.J., Stoffel, H., Wilson, W.E. 1982, Asir. Astrophys Suppl. No.47. Howell, T.F., Shakeshaft, J.R. 1967, Nature, 216, Hu, W., Scott, D., Silk, J. 1994, Astrophys, J., 430, L5. Levin, S. M., Witebsky, C., Bensadoun, M., Bersanelli, M., De Amici, G., Kogut, A., Smoot,
G. 1988, Astrophys J., 334, 14. Silk, J., Stebbins, A., 1983, Astrophys, J., 269, 1 Sironi, G., Limon, M., Marcellino, G., Bonelli, G., Bersanelli, M., Conti, G., Reif, K.
Astrophys., J. 357, 301. Staggs, S. T., Jarosik, N.C., Wilkinson, D. T., Wollack, E.J. 1996, Astrophys. J., 458, 407. Stankevich, K.S., Wielebinski, R., Wilson, W.E. 1970, Aust. J. Phys., 23, 529. Swarup, G., Ananthakrishnan, S., Kapahi V. K., Rao, A. P., Subrahmanya, C. R., Kulkarni V.
K. 1991, Curr. Sci., 60, 95. Swarup, G., Ananthakrishnan, S., Subrahmanya, C.R., Rao, A.P., Kulkarni V.K. Kapahi V.K.,
1997, in High-sensitivity Radio Astronomy. (eds.) N Jackson., R. J., Davis (Cambridge: Cambridge Univ. press).


![Cosmic background KM anisotrophy measurement at 10 degrees€¦ · Cosmic background anisotrophy measurement at 10 degrees TODD GAIER, JEFFREY Sci 1LT ER, (flj(] Pi iiiii M. LLs]x](https://img.pdfslide.us/doc/110x75/5fb8e0c526155f25af492891/cosmic-background-km-anisotrophy-measurement-at-10-cosmic-background-anisotrophy.jpg)