Embed Size (px)
Citation preview

Compurers Chem. Vol. 16, No. 2, pp. I 17-124, 1992 Printed in Great Britain
0097~8485/92 $5.00 + 0.00 Pergamon Press Ltd
A MAXIMUM ENTROPY PRINCIPLE FOR THE DISTRIBUTION OF LOCAL COMPLEXITY IN
NATURALLY OCCURRING NUCLEOTIDE SEQUENCES*
PETER SALAMON’~. and ANDRZEJ K. KONOPKA’ ‘Department of Mathematical Sciences, San Diego State University, San Diego, CA 92182. U.S.A.
‘NCI/DCBDC, Laboratory of Mathematical Biology, National Institutes of Health Bldg 469, Rm 151, Frederick, MD 21702, U.S.A.
(Received I8 February 1992)
Abstract-A maximum entropy principle (MEP) governing the distribution of complexity of short oligonucleotides from large collections of functionally equivalent sequences is presented. The principle is seen to work well in both translated regions (exons and bacterial genes) and introns from various genomes. It also works in cases of sample sequences from various genomes and even a representative sample of the entire GenBank. This suggests that all naturally occurring DNA sequences are likely to follow the MEP described in this report. The linear trend of surprisal as a function of complexity is systemat- ically characterized by remarkably different slope values for introns and translated regions of genes from all eukaryotic genomes studied (primates, rodents, other mammals, other vertebrates, invertebrates, organella, plants and viruses). This fact may be used as a criterion for discriminant analysis.
1. INTRODUCTION
It has long been known (Britten & Kohne, 1968; Gall, 1981) that, in contrast to bacteria, higher eukaryotic genomes contain as much as 95-97% of repetitious DNA. This so-called simple sequence DNA (Gall, 1981; Singer, 1982) tends to be spread over the genome regions spanning several kilobases. Genes for proteins and functional RNAs (ribosomal and trans- fer) curiously do not tend to reside in these regions of low complexity.
The idea that the tendency to maintain repetitious DNA also takes place locally (i.e. at the level of relatively short oligonucleotides) was first proposed by Tautz et ol. (1986). Detailed studies of local compositional complexity in several collections of functionally equivalent sequences (FES) (Konopka & Owens, 1990a, b) provided the evidence that at the level of short oligonucleotides, eukaryotic DNA tends to display lower complexity than bac- terial DNA. Moreover, it has been demonstrated (Konopka & Owens, 1990b) that different functional domains in a genome display different mean values of compositional complexity, as measured by Shannon entropy (Hartley, 1928; Shannon, 1948) over the relative frequencies of mononucleotides.
In the present report the frequency distributions of compositional complexities of short oligonucleotides in each of 35 large collections of sequences are
* The preliminary version of this work was presented during the Open Problems in Computafional Molecular Biology Workshop, TeUurlde Summer Research Center, Telluride, CO, 2-8 June 1991.
t To whom all correspondence should be addressed.
determined (see Table 2 for a description of the FES studied). First, the prior distribution of complexity is determined, based on a hypothetical situation in which all short oligonucleotides of the same length occur with equal frequencies (i.e. are distributed according to a uniform distribution in which each oligonucleotide of length N occurs with probability l/4N). Next, a “surprisal analysis” is performed (Levine & Bernstein, 1974) on the nucleotide sequence data by examining the logarithm of the ratio of actual to prior probabilities as a function of complexity. The analysis was performed for di- through octanucleotides in ths above mentioned collections of sequences. It detected a clear linear trend in all cases studied. The existence of such a linear trend confhmed the initial observations of Konopka & Owens (1991a, b) and has prompted the undertaking of a more formal study. The main result here indicates that all naturally occurring nucleo- tide sequences follow a maximum entropy principle (MEP):
The distribution of complexity in short oligo- nucleotides is as random as possible, consistent with a given mean value of complexity.
The exact reasoning leading to this principle is pre- sented below.
2. REPETITION VRCTOR AND COMPOSITIONAL COMPLEXEY OF
SHORT OLIGONUCLEOTID~
Consider an oligonucleotide of length
N=n,+n,+++n,,
117

118 PETER SALAMON and ANDRZU K. KONOPKA
where R~, nc, R= and n, represent the number of occurrences of adenine, cytosine, thymine and guanine, respectively. Thus, for example, the octa- nucleotide ACAACGGT has n, = 3, n, = 2, nT = 1, nc = 2 and N = 8. In the present report, we seek to characterize a string L of length M 9 iV using the distribution of repetition vectors present in L.
We pay attention only to the degree of repetition as represented by the four-tuple (nA, n,, nT, nc) with- out regard to the order of the entries. To stress this point, we will write the four entries in this four-tuple sorted by the size of the entry and refer to
n=(ni,n,,n,,n,), nk+l 6 nkr (1)
as the repetition vector of the collection of N-nucleotides whose (nA, n,, nT, nG) equals some permutation of the entries in n. Note that for N = 8, this way of counting combines all cctanucleotides with the same repetition vector; the category (3,2,2, 1) includes the string ACAACGCT as well as TTTGGAAC. We begin by asking the question: How likely is a given repetition vector n assuming that all N-nucleotides are equally likely?
We compute the likelihood of a given repetition vector n by determining the number of different N-nucleotide sequences corresponding to it. (For- mally it is equivalent to counting an orbit of N- nucleotide under symmetry operations that preserve the repetition vector.) Thus, we count the number of distinct realizations of n resulting from all rearrange- ments and relabelings of nucleotides occurring in a given realization of n.
Rearrangement of a particular realization of n=(n n n n,)yields 1, 2, 31
W(n) = N! lp (2)
different sequences, all corresponding to the same II. For example, any realization of (2, 1, 0, 0), say MC, will have exactly 3 = W(2, 1, 0,O) re- arrangements, viz. AAC, ACA and CAA. Provided all the n, are sufficiently large to allow the use of Stirling’s approximation, the logarithm of W is familiar as the Shannon entropy (Hartley, 1928; Shannon, 1948):
I shaMc.0 * (l/N)log(JV. (3)
Since we are not dealing tith large ns we will use this logarithm directly as our measure of complexity, defined simply by
c = (l/N)log( w>. (4)
The base of our logarithms sets the units to be used. While base 2 (bits) and base e (nats) are the most common (Abramson, 1963; Ash, 1965), the present application makes it more natural to use base 4. Accordingly, all the logarithms in the calculations for this paper were to this base.
Next we consider relabelings of the nuclcotides in our sequence. We can think of this as “coloring” the bins 1, 2, 3, 4 with one each of the colors A, C, T and G. For each of these “colorings” we will find W(n) rearrangements. Since we can consider II as defined only up to a rearrangement of the nk, and since the n k+I < n, condition may not specify a unique ordering of the ns, the count for the number of ways of “coloring” n requires the definition of some additional quantities. Let h,(n) be the number of occurrences of i in the repetition vector II, i.e. the number of nt such that nL = i, where 1 d k < 4 and 0 < i < N. Thus, h3 (ACAACCGT) = 2 since two nucleotides have three occurrences. With this definition, the number of “colorings” of n is given by
If there are no repetitions among the n,, the number of colorings F is 4!. If there are repetitions, then colorings differing only as regards the nucleotides assigned to the repating categories will generate the same set of rearrangements. (The hi! compensate for the overcounting this would otherwise entail.) As an illustration, F(3,2,2,1) = 41/2! = 12. Table 1 lists the set of possible n for N = 2,3, and 8 along with F, W and C values.
The a priori prediction for the likelihood of n is then obtained as
Prob(n) = F(n) W(t1)/4~.
These predicted probabilities arc tabulated in the last column of Table 1.
Table 1. Examples of mpetition vmtors along with their compkity and prior probability
Repetition Probability vector F w COlDDhitV DdiCtcd
N==2 (1,l,O,O) C&0,0* 0)
N==3 (1.1.1.0) (2, 1,090) (3,0,0,0)
N-8 (29292.2) (3*2,2. 1) (3,3, I, 1) (4,2,l,l) (3.392.0)
2 1
0.25000 O.OOWJ
0.7500 0.2500
4 6 0.43083 0.3750 I2 3 0.26416 0.5625 4 1 O.OWOO 0.0625
I: 6
12 12 4
g 24 12 6
I2 I2 I2 4
2520 1680 1120 840
g 420 280 I68 56 70
;: 8
0.70620 0.66964 0.63308 0.60714 0.57058 0.52452
oO:Z 0,46202 0.362% 0.38308 0.362% 0.30046 0.18750
0.0385 0.3076 0.1025 0.1538 0.1025 0.0205 0.0769 0. I025 0.0615 0.0103 0.0064 0.0103 0.005 1 0.0015
1 O.OWXJ O.ooOl
F - numkr of “colorhgs” of a given repetition vector [ee equation (S)]. W = number af “rearrangementa” of a &en repetition vector [see equation (2)]. Complexities - calculattd from equation (4) and prior probabilities Fram equation (6).

Complexity of short oligoaucleotidea 119
It should be noted that the *‘overlap capability” (Guibas 8r Odlyzko, 1981; Gentleman & Mullin, 1989; Pevzner et al., 1989; Pevzner, 1992) of oligo- nucleotides was not considered in this paper. We also note that although the prior distribution in equation (6) can be realized as the stationary distribution of a Markov chain (L. IS. Hansen, A. K. Konopka 9, P. Salamon, work in progress), such considerations are omitted from the present effort.
compared to this prior distribution. Such surprisal is defined as
Trends in the values of the surprisal have been successfully exploited in various physico-chemical contexts (Levine & Tribus, 1978; Jaynes, 1957a, b). Trends in observed surprisal have reveaIed new hidden “laws” concerning the underlying pro-
3. SURPRISAL ANALYSIS cesses.
For our present analysis, we examined the relation- A priori probabilities of the repetition vectors ship between surprisal and complexity. The sizes
can be used to assess the surprisal in real data when of FES used in this study are listed in Table 2. The
Table 2. Collections of the FES used in this study and their sizes
Collection of FES (datbase) No. of No. of Lengths entries bases variation
Bacterial protein coding genes 3617 3,834,597 10,776 I02
invertebrates Exons Introns
714 799,110 11,280 I04 282 154,069 5392 IO1
Mammals Exons Introns
454 495,673 15,114 Ill 193 98,528 5496 IO1
Organella Exons Introns
Phage protein coding genes Plants (“on-yeast)
Exons lntrons
293 216,383 6396 I02 69 104,501 54,164 103
396 343.332 6072 102
yeast exollS
612 667,62 I 11,376 I02 367 115,650 4434 101
514 774,765 9240 IO1
Primate EXOllS
Introns
924 1024
l,l47,985 494,783
15,099 15,166
102 101
Rodent Exons Introns
Vertebrates EXO”S Introns
977 1,096,460 15,504 I04 734 361,551 9568 IO1
419 469,92 I 10,983 I02 422 220,675 7139 101
Viruses Exons Introns
837 1,199,318 21,584 I02 56 72,307 14,371 108
16sRNAs (sequences longer than 1 kb) 8 11,663 1544 1136 I SsRNAs 4 5663 1869 I05
5sRNAs 449 55,783 1651 36 tRNAs 535 41,234 170 51
GenBank (representative sample) Bacterial genomc sample Invertebrate genome sample Mammalian genomc sample Organella genome sample Phage genome sample Plant (no yeast) genome sample Primate genome sample Rodent genomc sample Vertebrate gcnome sample Viral genome sample Yeast genome sample
6890 I 1,67 I ,503 172,202 1154 2.298,728 28,793
571 851,910 17,137 302 471,023 44,594 114 165,919 155,844 137 265,761 48,502 442 728,287 13,457
1285 I ,852,347 73.326 1215 I ,491,622 54,670
362 480,050 31,111 474 1.401,393 172,282
101 IO1 105 I03 IO1 II5 103 IO1 IO1 IO1 IO1 I06 196 417,588 7555
The data were extracted from GenBank (relaasc 70, 15 Dec. 1991) and thtn “ckancd” such that: (1) sequences containing ambiguous “uckotide symbols (N, R, Y) were deleted: (2) if two or more sequences in a FBS had a cootiguous string of 17 nudcotides in -on, only the longest sequence was retained in the collections and all others were dekted (this assures us that our FESs do not contain multiple copies of the same or almost the same sequence); and (3) except for 5sRNA and tRNA wllcctions all sequences shorter than 100 “t were not considered. f” the case of genes for proteins and functional RNAs we deleted all GanBank entries annotated as “fmgme”t”, “end”, “terminus” or “partial”.

120 PETER SALMON and ANDRZEJ K. KONOPKA
Table 3. Slope and R’ values for the linear fit of surprisal as a function of compknity for t&a- through octarucleotidcs in 35 large collections of FES [points corresponding to zero complexity (C = 0) were excluded from the calculation]
N nl m/N R” N m m/N R2 Vertebrate coding sequences
Vertebrate introns
Vertebrate gcnome samples
Organella (mitachondria and chloroplast coding sxxpletlccs
organella (mitochondria and chloroplast) introns
Organella genomc sample
Mammalian coding sequences
Mammalian introns
Mammalian gcnomc sample
Rodent coding scquenecs
Rodent iatrons
-1.12 -0.14 0.796 -0.90 -0.13 0.787 -0.78 -0.13 0.780 -0.69 -0.14 0.907 -0.57 -0.14 0.983
8 -3.23 -0.40 0.983 7 -2.69 -0.38 0.983 6 -2.18 -0.36 0.980 5 -1.67 -0.33 0.971 4 - 1.05 -0.26 0.960
- 2.64 -0.33 0.980 -2.13 -0.30 0.983 -1.68 -0.28 0.983 - 1.30 -0.26 0.980 -0.89 -0.22 0.982
8 -3.44 - 0.43 0.993 7 -2.96 -0.42 0.992 6 - 2.40 -0.40 0.991 5 -1.95 -0.39 0.995 4 -1.48 -0.37 0.996
8 -5.17 -0.65 0.990 7 -4.43 -0.63 0.99 1 6 -3.65 -0.61 0.991 5 - 2.90 -0.58 0.992 4 -2.12 -0.53 0.994
8 -3.53 -0.44 0.978 7 -3.00 -0.43 0.979 6 -2.39 -0.40 0.976 5 -1.91 -0.38 0.982 4 -1.41 , .-0.35 0.99 I
8 -1.17 -0.15 0.768 7 -1.00 -0.14 0.832 6 -0.87 -0.15 0.857 5 -0.82 -0.16 0.962 4 -0.77 -0.19 0.981
8 -3.82 -0.48 0.990 7 -3.26 -0.47 0.990 6 -2.75 -0.46 0.989 5 - 22.22 -0.44 0.988 4 -1.&l -0.40 0.987
8 -2.35 -0.29 0.986 7 -I.94 -0.2% 0.987 6 -I.&l -0.27 0.989 5 -1.33 -0.27 0.994 4 -1.03 -0.26 0.998
8 -0.84 -0.11 0.604 7 -0.70 -0.10 0.637 6 - 0.66 -0.11 0.699 5 - 0.63 -0.13 0.884 4 -0.61 -0.15 0.959
8 -2.83 -0.35 0.976 7 -2.30 -0.33 0.97% 6 -1.90 - 0.32 0.973 5 -1.49 -0.30 0.980 4 -1.06 -0.26 0.974
-2.26 - 0.28 0.971 -1.80 -0.26 0.974 -1.44 -0.24 0.966 -1.16 -0.23 0.978 -0.88 -0.22 0.9&i
Invertebrate introns
Primate coding sequence
Primate introns
Plant (no yeast) coding sequences
Plant introns
Plant (no yeast) genomc sample
Viral coding sequences
Viral introns
Viral gcnome sample
8 -1.25 -0.16 0.968 7 -0.92 -0.13 0.931 6 -0.69 -0.12 O.S9Q 5 -0.61 -0.12 0.944 4 -0.57 -0.14 0.984
-3.80 -0.48 0.990 -3.21 -0.46 0.990 -2.60 -0.43 0.988 -2.04 -0.41 0.982 - 1.37 -0.34 0.982
-2.76 -0.35 0.982 -2.23 -0.32 0.986 -1.72 -0.29 0.988 -1.33 -0.27 0.988 -0.984 - 0.024 0.994
-1.38 - 1.17 0.940 -1.14 -0.16 0.938 -0.96 -0.16 0.939 -0.85 -0.17 0.98 1 -0.74 -0.18 0.994
8 -3.32 - 0.42 0.987 7 -2.83 -0.40 0.987 6 - 2.42 -0.40 0.990 5 -2.01 - 0.40 0.990 4 -1.46 -0.37 0.986
-2.59 - 0.32 0.989 -2.14 -0.31 0.990 -1.7b -0.29 0.941 -1.44 - 0.29 0.993 -1.11 -0.28 0.997
8 -0.97 -0.12 0.665 7 -0.77 -0.11 0.619 6 -0.68 -0.11 0.637 5 -0.68 -0.14 0.848 4 -0.71 -0.18 0.934
8 -3.92 -0.49 0.990 7 -3.29 -0.47 0.989 6 -2.61 -0.44 0.986 5 -1.98 -0.40 0.976 4 -1.18 -0.30 0.962
-2.59 -0.32 0.987 -2.09 -0.30 0.989 -1.63 -0.27 0.986 -1.28 -2.26 0.990 -0.98 -0.24 0.990
-1.78 -0.22 -1.52 -0.22 -1.26 -0.21 -1.05 - 0.21 -0.81 -0.20
0.992
~~ 0:997 0.999
-2.62 -0.33 0.976 -2.34 -0.33 0.993 -1.86 -0.31 0.992 -1.51 - 0.30 0.997 -1.13 - 0.28 0.997
8 -2.31 -0.29 0.993 7 -1.96 - 0.28 0.994 6 -1.58 -0.26 0.995 5 -1.28 - 0.26 0.9Q4 4 - 0.95 -0.24 0.9%

Complexity of short 0ligonucIeotides 121
Table 3--mmimwd
N m m/N R2 N m m/N IF
Yeast gcnomc sample 8 -2.68 -0.33 0.97 I 7 -2.21 - 0.32 0.979 6 -1.74 - 0.29 0.98 I 5 -1.41 - 0.28 0.992 4 -1.09 - 0.27 0.997
GcnBank sample 8 -233 -0.29 0.988 7 -I.90 -0.27 a.991 6 -1.50 -0.25 0.992 5 -1.19 -0.24 0.993 4 -0.88 -0.22 0.997
tRNA 8 -0.47 -0.06 0.699 7 -0.33 -0.05 0.546 6 -0.33 -0.06 0.551 5 -0.29 -0.06 0.456 4 -0.38 -0.10 0.476
5sRNA 8 - 1.06 -0.13 0.674 7 -0.79 -0.11 0.683 6 -0.56 -0.09 0.592 5 -0.27 -0.05 0.4% 4 -0.44 -0.11 0.882
Yeast coding scquena 8 -1.66 -0.21 7 -1.45 -0.21 6 -1.23 -0.21 5 -1.09 -0.22 4 -0.95 - 0.24
0.986 0.991 0.992 0.999 0.998
- I.29 -0.16 0.983 -lx)6 -0.15 0.983 -0.77 -0.13 0.969 -0.61 -0.12 0.997 -0.46 -0.12 0.997
-1.56 -0.20 0.975 -1.28 -0.18 0.974 -0.93 -0.16 0.963 -0.71 -0.14 0.991 -0.50 -0.12 0.995
PlYage coding sequcnccs
-1.26 -0.16 0.945 -1.11 -0.16 0.950 -0.84 -0.14 0.903 --oh8 -0.14 0.965 -0.52 -0.13 0.951
-1.73 - I.51 -1.17 -0.94 - 0.67
-0.22 - 0.22 -0.19 -0.19 -0.17
-0.20 -0.21 -0.20 -0.19 -0.17
0.959 0.958 0.929 0.964 0.954
I6sRNA 8 -1.63 7 -1.44 6 -1.17 5 -0.93 4 -0.68
0.854 0.894 0.941 0.952 0.975
I BsRNA 8 7 6 5 4
-2.09 -0.26 0.867 - 1.74 -0.25 0.918 - I.28 -0.21 0.855 - I.00 -0.20 0.879 -0.70 -0.17 0.831
Introll colkctions displayed syatcmatically lower (“*more negative”) valws of the slope than the comsponding cxon scqcqucnces. The !cignifi- cant and systematic diWmncc bctwem slope values for sequcnas belonging to diffennl functional domains can be used for ditiminant analysis purposes (A. K. Konopka Br P. Salanion, work in progress).
.
selection of FES was made so that it represents all classes of naturally occurring DNA.
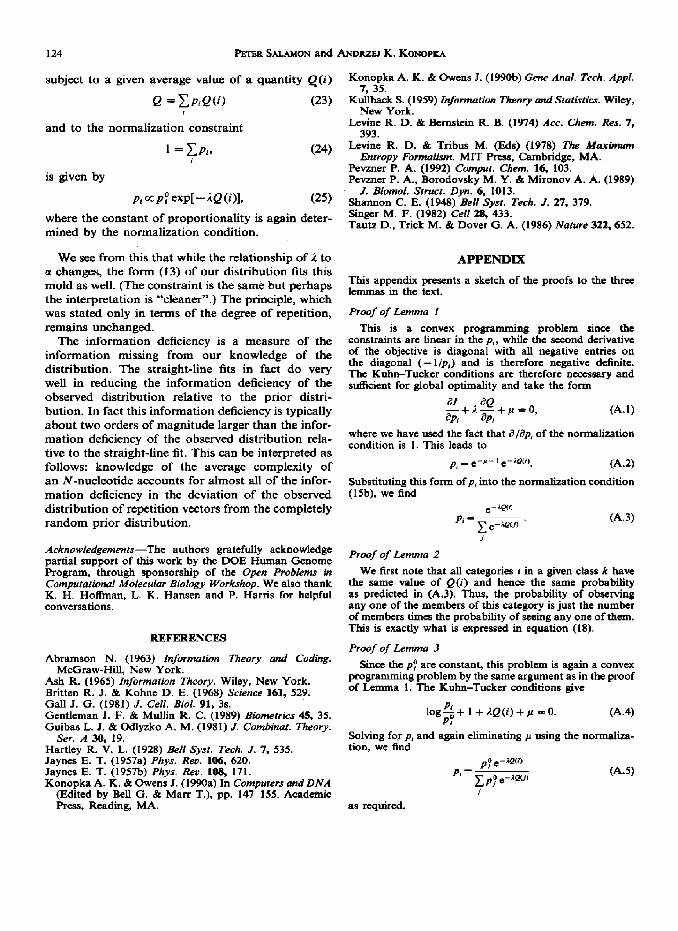
All 35 FES displayed a strong linear trend of surprisal as a function of complexity. Table 3 lists the slopes m of this linear trend and the R’ values measuring its goodness-of-fit. The trends are additionally illustrated in Fig. 1 which shows data from primates, organella and viruses. Note that the RZ values are consistently very high with the exception of tRNA and 5sRNA. We believe that the relatively poor performance of these two FES are due to the short lengths of these sequences. As the figures and Table 3 illustrate, the slopes m are markedly different for intron vs coding regions; this offers a potential tool for discriminant analysis.
The slopes and A* values in Table 3 were com- puted without including the C = 0 points, i.e. the points corresponding to repetition veotors of the form II = (N, 0, 0,O). Sample points with C = 0 are very rare and thus the sampled frequency consists of but a few events. An alternative approach might have been to weight the errors in the regression by the probability of the corresponding complexity C. This would also eliminate the noise due to the point at C = 0 and would give values very close to those reported in Table 3.
Now we proceed with a formal interpretation of the observed linear trend. We examine the impli- cations of this trend for the form of the distribution P(n). If m and b arc the slope and the intercept of the S vs C line, then
f(n) log - P(n) pa (a)
= log F(n) w(aY4”
= mC(n) 4 b =G log W(n) f b. (8)
Solving for P(o), we find
P(n) = F(n) W(n)’ + m’N
z ’ (9)
where Z is the normalization constant
2 = 4Ne-b. (10)
On making use of the normalization condition,
(11)
we find a more convenient form of Z:
2 =~P(n)w(n)‘+~N. (12) .

122
(a)
3T
FBTER SALMON and A~JODRZEI K. KONOPSA
Complexity
Organe’llr
Comploxlty
(c)
3
2
Vlruser
Complextty
Fig. 1. Examples of linear trends of surprisal as a function of octanucleotide oompositioti complexity in introns (4) and translated regions of genes (m) from three different categories of Fk: primates (top); organella (middle); and viruses (bottom). It can be seen that slopes for mtroil8 are connstently more negative than slopes for translated regions of genes. In the case of organella (middle), both siope values are more negative than the corresponding values in primates (top) and viruree~ (bottom)-.This is due fo a high repetitiveness of entire organella genomes (sse slope values for aample of geaow Sequences. in Table 3) Nonetheless, evet~ in organella, intro- display markedly more negative slopes than cxona (Le. translateh regions). The difference in slope values is less pronounced in viruses than in pcmatea and organella. This is due to instances of overlappins genes in which the intron of one gene coxttam~ an exon of another gene. Nonetheless, the difference in slope values between introns and exons is Ml remarkable.

Complexity of short oligonucleotides 123
The form of the distribution P(n) suggests that perhaps the parameter CI = m/N is more natural for describing our distributions. In fact, the observed slopes are approximately proportional to N and therefore K is nearly independent of the length N of the oligonucleotide. This fact is also illustrated in Table 3.
4. MAXIMUM ENTROPY
The form of our distribution P(n) is suggestive in other ways as well. Let us write the distribution in the form
P(n) 0~ [F(n) W41 WO (13)
and recall two lemmas from information theory.
Lemma 1. The distribution pi, i = 1, . . . , L which maximizes the Shannon entropy
z = -~pp,logp,, (14)
subject to a given average value of a quantity Q(i) and to the normalization constraint
Q = CP;QG,, 1 = CP,, Cl!% b)
is given by
pI 0~ expi - %2 (91, (16) where 1 is a constant (the Lagrange multiplier) and the constant of proportionality is determined by the normalization condition (15b).
Lemma 2. If the categories i are partitioned into groupsk,k=l,..., K, such that Q(i) is the same for all i in k, then the above distribution pi induces a corresponding distribution over k. Letting Q(k) be the common value of Q on all i group k and
g(k) = number of members i in group k, (17)
then the maximum entropy distribution may altema- tively be written as a distribution over k:
~(k)~cg(k)expj-~Q(k)l- (18)
These lemmas state standard results (Ash, 1965; Kullback, 1959). Proofs are sketched in the Appendix.
This form applies directly to our distribution. The pi of Lemma 1 are the probabilities of seeing a particular oligonucleotide while the groupings k correspond to the degree of repetition n. We see that if we take Q to be the complexity C of a given N-nucleotide, then it takes the same value for differ- ent oligonucleotides which have the same n and the resulting maximum entropy distribution is exactly of the form (13), with
and
g(n) = F(n) W(n) (19)
A= -KNln4. (20)
Translating this into biological terms we arrive at the following theorem.
Theorem I. The distribution of repetition vectors n among N-nucleotides is as random as possible, con- sistent with a given average value of the complexity
c = c P(n)C(a). (21) q
Recall that the complexity was just a (logarithmic) measure of the number of distinct rearrangements of a given string of symbols. Constraining this number constrains the average number of rearrangements of an N-nucleotide in the string. Some caution must be exercised in applying this, since the averag- ing is actually logarithmic. It is perhaps easier to interpret this constraint in the equivalent form of a given “total complexity”, defined as C times the number of N-nucleotides in our sample. The con- straint can then be loosely interpreted as requiring that each N-nucleotide will have enough rearrange- ments, on average, to carry a message using (over- lapping!) N-nucleotides in the code.
Another alternative view of our constraint is also of interest. Instead of constraining the total complex- ity of our sequence, we could constrain the mean information conveyed per base. Consider extending our string L of length M % N by one base. This adds one additional N-nucleotide, which carries I? units of information. For the FES analyzed, this comes out very close to N/S. Small changes in c translate to markedly different trends in surprisal as a function of complexity. The slope of this trend (m in Table 3) is, thus, a much more sensitive indicator than C of which FES we are dealing with.
A maximum entropy distribution, as derived above, has the property that all oligonucleotides with the same repetition vector n are equally likely. This is, in fact, not the case, as can be seen by considering N = 1 and I-nucleotides of different composition. Unless the base compositions for A, C, T and G are exactly 0.25,0.25,0.25 and 0.25, these four I-nucleotides [all belonging to n = (1, 0, 0, 0)] will have different likelihoods. We, may thus, prefer to arrive at distribution (13) by the alternate route described in the next section. The required constraint and the resulting interpretation above is unchanged.
5. MINIMUM INFORMATION DEFICIENCY
We will give an alternate (albeit equivalent) interpretation of the above results in terms of the information deficiency, also known as the Kullback information (Kullback, 1959). We again begin by citing the relevant facts from information theory as a lemma.
Lemma 3. The distribution pi, i = 1, . . , Z, which maximizes the KuIlback information
124 PETER SALAMON and AND- K. KONOPKA
subject to a given average value of a quantity Q(i)
e = CPiQW (23)
and to the normalization constraint
1 = CP,. (24)
is given by
where the constant of proportionality is again deter- mined by the normalization condition.
We set from this that while the relationship of 1 to 01 changes, the form (13) of our distribution fits this mold as well. (The constraint is the same but perhaps the interpretation is “cleaner”.) The principle, which was stated only in terms of the degree of repetition, remains unchanged.
The information deficiency is a measure of the information missing from our knowledge of the distribution, The straight-line fits in fact do very well in reducing the information deficiency of the observed distribution relative to the prior distri- bution. In fact this information deficiency is typically about two orders of magnitude larger than the infor- mation deficiency of the observed distribution rela- tive to the straight-line fit. This can be interpreted as follows: knowledge of the average complexity of an IV-nucleotide accounts for almost all of the infor- mation deficiency in the deviation of the observed distribution of repetition vectors from the completely random prior distribution.
Acknow&zdgements-The authors gratefully acknowledge partial support of this work by the DOE Human Genome Program, through sponsorship of the Open Problems in Computational Molecular Biology Workshop. We also thank K. H. Hoffman, L. K. Hansen and P. Harris for helpful conversations.
REFERENCES
Abramson N. (1943) Znform~fion Theory and Codhg. McGraw-Hill, New York.
Ash R. (1965) Information Theory. Wiley, New York. Britten R. .J. 8c Kohne D. E. (1968) Science 161, 529. Gall J. G. (1981) J. CeN. BioL‘91, 3s. Gentleman J. F. & Mullin R. C. (1989) Biometrics 45, 35. Guibas L. J. & Odlyzko A. M. (1981) J. Combinat. Theory.
Ser. A 30, 19. Hartlev R. V. L. 11928) Bell SM. Tech. J. 7. 535. Jay&E. T. (195?a) P&. Re;. 106, 620. Jaynes E. T. (1957b) P&s. Reo. 108, 171. K&opka A. k. & Owens J. (199Oa) In Computers and DNA
(Edited by Bell G. 8i Marr T.), pp. 147-155. Academic Press, Reading, MA.
Konopka A. K. & Owens J. (199Ob) Gene Anal. Tech. Appl. 7, 3.5.
Kullback S. (1959) Znformation Theory and Statisics. Wiley, New York.
Levine R. D. % Bernstein R. B. (1974) Act. Chem. Res. 7, 393.
Levine R. D. & Tribus M. (Eds) (1978) The Maximum Entropy Formalism. MIT Press, Cambridge, MA.
Pevzner P. A. (1992) Comput. Gem. 16, 103. Pevzner P. A., Borodovsky M. Y. & Mironov A. A. (1989)
J. Biomoi. Struct. Dyn.-6, 1013. Shannon C. E. (1948) Bell Syst. Tech. 3. 27, 379. Singer M. F. (1982) Cell 28, 433. Tautz D., Trick M. & Dover G. A. (1986) Nature 322,652.
APPENDIX
This appendix presents a sketch of the proofs to the three lemmas in the text.
Proof of Lemma 1
This is a convex programming problem since the constraints arc linear in the p,, while the second derivative of the objective is diagonal with all negative entries on the diagonal (-l/p,) and is therefore negative definite. The Kuhn-Tucker conditions are therefore necessary and sufficient for global optimality and take the form
where we have used the fact that alap, of the normalization condition is 1. This leads to
*, = e-p-1 e-“P(i), (A.2)
Substituting this form ofp, into the normalization condition (15b), we find
,-ipcil pi=:.
x e-iQUl (A.31
Proof of Lemma 2 We first note that all categories i in a given class k have
the same value of Q(i) and hence the same probability as predicted in (A.3). Thus, the probability of observing any one of the members of this category is just the number of members times the probability of seeing any one of them. This is exactly what is expressed in equation (18).
Proof of Lomma 3
Since the py are constant, this problem is again a convex programming problem by the same argument as in the proof of Lemma 1. The Kuhn-Tucker conditions give
log’+ I +AQ(i)+p =O. PY
(A.4)
Solving for p1 and again eliminating p using the nomaliza- tion, we find
ppe-nqV) 64.5)
as required.