Embed Size (px)
Citation preview

A Matter of Life and Death:
Innovation and Firm Survival*
Elena Cefis♦ Utrecht School of Economics, Utrecht University
and University of Bergamo
Orietta Marsili
Rotterdam School of Management, Erasmus University Rotterdam
November 2004
Abstract
This paper examines the effects of innovation on the survival of manufacturing firms in the Netherlands. The demographics of firms according to their innovative performance and type of innovation are traced by using the Business Register population of all firms active in the Netherlands and the Community Innovation Survey. Through estimation of a parametric duration model, we observe that firms do benefit of an innovation premium that extends their life expectancy, independent of firm- specific traits such as age and size. Especially process innovation seems to have a distinctive effect on survival. Furthermore, our results confirm that survival chances increase with age and the growth rate of a firm, the latter representing a more crucial factor than the initial size. Finally, sectors at high intensity of technology, that is, science based and specialised suppliers are most favourable environments to the survival of firms. Keywords: Firm Survival; Innovation; Firms Exit; Duration models
JEL codes: L11; O30; D21; C14; L25
* The empirical part of this research has been carried out at the Centre for Research of Economic Microdata at Statistics Netherlands. The views expressed in this paper are those of the authors and do not necessarily reflect the policies of Statistics Netherlands. Elena Cefis gratefully acknowledges support by the University of Bergamo (grant ex 60%, n. 60CEFI04, Department of Economics). ♦ Corresponding author: Elena Cefis: Utrecht School of Economics, Utrecht University. Vredenburg 138, 3511 BG Utrecht, The Netherlands. Tel. +31 (0)30 2539856; Fax +31 (0)30 2537373 [email protected]
1. Introduction
Schumpeter argued that innovation plays a key role for the survival of firms; innovation
“strikes not at the margins of the profits and the outputs of the existing firms but at their
foundations and their very lives” (Schumpeter, 1942: 84). More recently this view has been
stated by Baumol (2002): “…under capitalism, innovative activity…becomes mandatory, a
life-and-death matter for the firm and innovation has replaced price as the name of the game
in a number of important industries” (Baumol, 2002: 1). Innovation matters for all different
types of firms, new as well as established firms. As Schumpeter emphasises, innovation is a
powerful vehicle for new firms to successfully enter the market and undermine the established
firms. As well, established organisations need innovating to maintain their competitive
position in the face of new and emerging or ‘disruptive’ technologies (Christensen, 1997).
Drawing from innovation theory, industrial economics and organisational ecology, we
investigate the impact on innovation on firm survival. The analysis is based on a combination
of two harmonised and comprehensive micro-economic data sets of manufacturing firms in
the Netherlands. The first dataset is the Community Innovation Survey and the second is the
annual Business Register of all firms operating in the Netherlands. By matching these
datasets, we are able to link innovation and survival at the firm level for more than 3000 firms
across the manufacturing sector. In the econometric analysis, we estimate different duration
models, exploring the factors that shape the survival of industrial organisations. In this
analysis, we extend the previous literature in two and important directions. First, whereas the
previous literature on survival focuses on the inputs into the innovation process, such as R&D
expenditure, we explore the impact of innovative performance on survival. Second, we
contrast the impact of different types of innovation on survival, distinguishing between
product and process innovation.
Like previous research, we find that the firm survival is influenced by age and size, with size
having decreasing returns on firm survival. In particular, we observe that it is the direction of
growth, more than the initial size of a firm that matters for survival. The nature of technology
also shapes the likelihood of survival, as revealed by a classification of firms according to
Pavitt’s taxonomy (Pavitt, 1984): firms in science based and specialised supplier sectors are
1
subjected to higher chances of survival than in other sectors. Having controlled for the above
firm- and technology-specific covariates, we find evidence of the existence of an “innovation
premium” in survival time: in general, over the period 1996-2003, the expected survival time
of an innovative firm is about 11 per cent higher than that of a non-innovative firm.
The paper is structured as follows. Section 2 discusses theoretical approaches and empirical
studies on the determinants of firm survival. Section 3 presents the data used in the empirical
analysis and the methodology applied for the survival analysis. We illustrate the results of the
analysis in Section 4. Section 5 is the conclusions.
2. Theoretical and empirical background
There are a number of competing explanations of survival of firms. In industrial economics,
structural factors, such as firm size and age, play a key role. The differentials in survival
probability among firms are seen as the outcome of the operating of a market selection
process on heterogeneous firms, in presence of imperfect information (Jovanovic, 1982), or
uncertainty due to R&D efforts (Ericson and Pakes, 1995). In Jovanovic’s model, as new
firms acquire experience by carrying out production and learn their specific, but unknown
levels of efficiency, they adapt their output to such ‘true’ level and in doing so reduce their
risk. This model predicts that the survival probability increases with age and with size
conditional on age (Pakes and Ericson, 1998). In other words, experience increases chances of
survival, indicating that survival probability thus increases over the lifecycle of a firm, along
with firm size.
These predictions find large support from the empirical studies in industrial economics.
Indeed, it is generally recognised as a “stylised fact” that the survival probability of a firm is
positively related to size and age (Geroski, 1995; Sutton, 1997; Caves, 1998). Some of these
studies focus on the link between survival and the current size of all firms (Evans, 1987; Hall,
1987; Doms, Dunne et al., 1995). These studies argue that small firms, which are more likely
to operate below the minimum efficient scale, are more exposed to the risk of exit. There is
also some evidence that the relatioship between survival and size is non-linear, as the survival
2
likelihood increases with the firm size, but at a decreasing rate (Evans, 1987; Hall, 1987).
Evans (1987) observes a non-monotonic effect also for the age of firm, as well as a negative,
interactive effect of size and age. The possible non-monotonic relationship between survival
and age is also confirmed by estimates of the hazard function of new firms. While the
instantaneous risk of failure often decreases monotonically with age (Baldwin and Gorecki,
1991; Mata and Portugal, 1994; Mata, Portugal et al., 1995), an inverted-U shaped function is
observed in some cases, with the hazard increasing soon after entry and then decreasing in
later years (Audretsch and Mahmood, 1994; Wagner, 1994).
It is well known that new firms are exposed to high mortality rates soon after entry and only
few survive the critical start-up period (Dunne, Roberts et al., 1988; Mata and Portugal, 1994;
Audretsch, 1995; Baldwin, 1995). Entering with a larger scale of production can thus
attenuate the risk of post-entry mortality. However, the empirical evidence on the effect of the
initial size on the (post-entry) survival probability is less robust than that of the current size.
Although the effect of initial size is positive in most cases (Mata and Portugal, 1994;
Audretsch and Mahmood, 1995) and persist for a number of years after entry (Geroski, Mata
et al., 2002), the significance, and even the sign of the relationship, can vary across cohorts of
entrants (Wagner, 1994) and stages of the product life cycle (Agarwal and Audretsch, 2001).
An interpretation is that it is the rate at which the new firms grow that does matter in shaping
the survival probability, more than the initial size. The latter may have a negative impact,
simply because, given a certain current size, those firms that entered smaller have grown more
rapidly and gained better chances to survive (Mata, Portugal et al., 1995). As a consequence,
there is a positive effect of the growth rate on the survival probability, which is also
confirmed in the empirical literature (Agarwal, 1997). Caves and Porter (1977) hold a
different view, stating that firm growth may not matter for the survival of small firms as long
as these are able to occupy strategic niches in the market. Small firms can choose not to
growth and yet they manage to survive. Finally, while firm size (and other firm-specific
attributes) has a long lasting effect after entry, industry factors, which may act as barriers to
survival (such as scale economies), seem to have little influence in the long run (Audretsch,
Houweling et al., 2000).
3
Another source of heterogeneity in firm survival pointed out by economists is the level of
intangible assets and the quality of the capital stock. For example, Hall (1987) relates the
survival probability to the technological capabilities of firms, measured by using R&D and
patent statistics. She argues that the R&D activities by the firm contribute to build a stock of
knowledge that increases the market value of the firm and consequently its likelihood of
survival. Hall (1987) finds that the survival probability increases with the share of
accumulated R&D expenditures on the total capital of a firm and this effect is more evident
for firms that do not have patents than for firms that do have patents. Indeed, these variables
have more explanatory power of survival probability than firm size. Other studies link
survival to capital quality and show that firms that adopt a range of advanced manufacturing
technologies have higher chances of survival (Doms, Dunne et al., 1995; Colombo and
Delmastro, 2001). The attempts to link survival to the technological capabilities of firms have
tended to focus on inputs into the innovation process (e.g. R&D or technology use) or
inventions (e.g. patents). To date, there have been few attempts to link survival with
innovative output or the ability of the firm to successfully commercialise a new innovation.
Alongside industrial economics, there is a rich tradition in organisational theory investigating
the factors that shape the survival of organisations. Organisational ecologists point out to a
number of liabilities to which new organisations are exposed and which affect the chances of
survival of firms. To begin with, organisations suffer of a “liability of newness” and young
organisations have higher risk of failure than older organisations (Stinchcombe, 1965). Young
firms lack of sufficient resources and have not yet established stable relationships, among
internal members as well as with outside suppliers and buyers. The hypothesis of ‘liability of
newness’ find empirical support in studies showing that the risk of failure decline
monotonically with firm age (Freeman, Carroll et al., 1983; Bruderl, Preisendorfen et al.,
1992). However, there is also some evidence on an inverted U-shaped pattern between risk of
failure and age, which suggests that a “liability of adolescence” is in place (Bruderl and
Schussler, 1990). The risk of failure is relatively low when firms are very young, while it
picks only later in the lifecycle. This is because new organisations are granted a ‘waiting for
success’ period in which decision makers do not make a final judgment on performance. The
effect, however, occurs quite early in the lifetime of a new organisation, between 6 and 9
months (Bruderl and Schussler, 1990). Last, new organisations are subjected to a ‘liability of
4
smallness’ and large new firms have better chances to survive than small new firms (see
Baum (1996) for a survey). A larger initial size reduces the risk of failure of a new firm in the
critical stage soon after entry (providing more financial resources to enable to sustain
themselves during early difficult periods of development).
Together with age and size, organisational ecology stresses the importance of organizational
strategies and environmental conditions in influencing the risk of failure. For example a
distinction is made between specialist organisations and generalist organisations, depending
on whether they aim at occupying a narrow or a broad niche in the market (Hannan and
Freeman, 1977). The effect of these strategies is mediated by environmental conditions, such
as the rate of environmental change. One of the few studies that account for innovation
strategies, do not find a significant effect on organisational survival (Bruderl, Preisendorfen et
al., 1992). In contrast, other organisational features, such as start-up size, age, and market
strategies play the most crucial role, also as compared to the effects of environmental
conditions (Bruderl, Preisendorfen et al., 1992).
There is very little empirical evidence on the relationship between the probability of survival
and the innovative activities carried out within the firm. The Product Life Cycle theory
suggests that in the early stages of an industry, new firms enter on the basis of product
innovation (Utterback, 1994). However, as the industry matures, process innovation becomes
dominant. In these later stages of the industry, there is a high rate of exit. This suggests that
early in the life an industry product innovation should be associated with survival and in later
stages of an industries development process innovation should associated with survival.
However, there is little empirical evidence about the importance of either type of innovation
for survival. In management studies have stressed the strategic role of innovation for firm
survival over time. For example, Christensen, Suarez and Utterback (1998) showed that the
combination of technological and market strategies are important predictors of a firm’s
probability of survival. In particular, they explored how different types of innovations,
architectural and components, and the timing of entry into a new market influence the
survival probability at different stages of evolution of a new technology, before and after the
emergence of a dominant design. Baum, Calabrese and Silverman (2000) show that among
small biotechnology start-ups, survival chances are enhanced by collaboration at the time of
5
founding, indicating that small firms should not ‘going alone’. Choonwoo, Kyungmook and
Pennings (2001) also indicate that technological capabilities (measured by patents) and
collaborations can play a positive role for start-up performance, although the latter effect
depends on the type of linkage. It is worth noting that the previous two studies of start-ups do
not measure directly the hazard rate or the survival probability, but use other measures of
performance. However, Baum, Calabrese and Silverman (2000) argue that for start-ups, the
measures of early performance can be used to extend an approach based on the hazard rate.
Innovation is important for survival, not only for new firms introducing new products or
creating new markets, but also for incumbent firms that need to continuously innovate to face
the threat of disruption from new technologies (Christensen, 1997). Banbury and Mitchell
(1995) show that in the established industry of cardiac peacemakers, the incumbent firms that
more frequently introduce incremental innovations, and are able to support them in the
market, have greater probability of survival. These studies, however, are based on specific
industries, especially high-technology industries, and they do not allow establishing more
general properties of the influence of innovation survival across the industries.
Despite this strong emphasis on innovation and survival in both industrial economics,
organisational theory and management, few attempts have been done in trying to estimate the
effect of the ability of firm to innovate on its own likelihood to survival. Indeed, Sorensen and
Stuart (2000) argue that the link between innovation and firm survival is an “unresolved” and
“largely undocumented” issue of empirical enquiry. In their study of the relationship between
the ageing of a firm and innovation (as measured by patents), they argue that this bears on
implications on firm survival, which need to be directly addressed. In industrial economics,
most of the literature looking at firm-specific determinants of survival focuses on the
structural features of the firm, such as its size and age. In organisational theory, the focus of
attention has been on the organisational ageing process, and the environmental features of
survival, and says little about innovation. The purpose of our study is to investigate how the
innovative performance of the firm influences its survival probability. We examine how
different types of innovation may also shape survival. In doing so, we control for the
influence of firm age, size and growth. Our goal is to develop a better understanding of how

6
innovation may condition survival. In particular, we try to see if innovation acts as a vaccine
allowing firms to increase their resistance to the liability of newness and smallness.
3. Data, variables and method
3.1. Data
The analysis uses two micro-economic databases collected from the Central Bureau of
Statistics Netherlands (CBS): the Business Register database and the Second Community
Innovation Survey (CIS-2) in the Netherlands. Using these datasets, we were able to integrate,
at the firm level, comprehensive data on innovation and exit. The Business Register database
consists of all the firms registered for fiscal purposes in the Netherlands in the period. The
database reports employment statistics, sector of activity at 6-digit of the Standard Industrial
Classification and the date (expressed in month) a firm was first included in the database and
the date a firm last appeared in the database. Because of the comprehensive nature of the
Business Register, these dates can be considered as close approximations of the actual date of
entry and exit of a firm in the population. From the Business Register we selected all
manufacturing firms present in the database at the year 1996. These are 61,177 firms. This
population includes also firms with zero employees, referred to as self-employment. We
selected the year 1996 for comparison with the CIS-2. For these firms we observe the data on
their existence in the period 1996 – 2003.
The second database we use in the analysis is the Second Community Innovation Survey
(CIS-2) in the Netherlands. The CIS-2 was held in 1996 and provides information on the
innovation process of firms in the Netherlands for the period 1994 – 96. The survey was
carried out in the entire private sectors for firms with at least 10 employees.1 This was a
stratified random sample drawn from the Business Register database at 1996, according to
size class, region and industrial sector at 2-digit level of the SIC code. In manufacturing, the
number of respondents to the CIS-2 was 3,299 firms, with a response rate of 71 per cent. Of
1 Among the European participants to the CIS, only the surveys for the UK and the Netherlands have set the threshold at 10 employees, while all the other countries have set it at 20 employees.
7
the respondents to the survey 3,275 firms could be matched with the firms from the Business
Register at 1996. Our analysis thus excludes 14 companies that could not be linked to the
Business Register dataset. These are large diversified companies for which the unit of
observation in the CIS survey does not coincide with the unit of observation in the Business
Register. As a whole we have an unbalanced panel of 3,275 firms, for which we know the
starting conditions at 1996 in terms of production and innovation statistics, and for which we
can trace the successive existence, month by month, up to December 2003. The dataset thus
covers 96 months of possible existence of a firm. It is worth noting that the definition of exit
includes both the event of death of a firm and the event of exit by merger and acquisition. As
pointed out by Agarwal and Audretsch (2001) this qualification of the data set is common to
almost every study that has examined firm exit and survival.
3.2. Variables
Dependent variable
Survival time. Our key variable is the survival time of a firm. The survival time is calculated
for all the firms that responded to the CIS-2. The analysis is thus not limited to new firms or
selected cohorts of entrants, but extends to all firms of different age and size (Evans, 1987;
Hall, 1987). As initial point for calculating the survival time we use January 1996, because
1996 is the year in which the CIS-2 was carried out, and we measure the survival time in
number of months. The survival time is therefore the spell between January 1996 and the
month in which the event of the exit of the firm occurred. This event is defined with respect to
the entire population of manufacturing firms in the Netherlands, including self-employment,
as identified in the Business Register. The survival time is censored to the right on December
2003, as the event of exit is not observed for the continuing firms.
Independent variables
Innovation. We relate the survival probability to a set of starting conditions for the individual
firms at 1996. Our main interest is on the innovation performance of a firm. On the basis of
the CIS-2 dataset, we define a dummy variable that is equal to 1 if a firm is an ‘innovator’ and
equal to 0, if the firm is a ‘non-innovator’. An innovator is a firm that has introduced either a
product innovation or a process innovation in the period 1994-1996. In the definition of ‘non-
8
innovators’ are thus included also those firms that have engaged in innovation projects, but
the projects were either unsuccessful or not completed in the considered period.
Innovation type. In addition, to account for the different type of innovation, we introduce two
other dummy variables: one for ‘product innovator’, equal to 1 if a firm has introduced a
product innovation in 1994-96 and equal to 0 otherwise, and another dummy for ‘process
innovator’, equal to 1 if the firm has introduced a process innovation in the same period. The
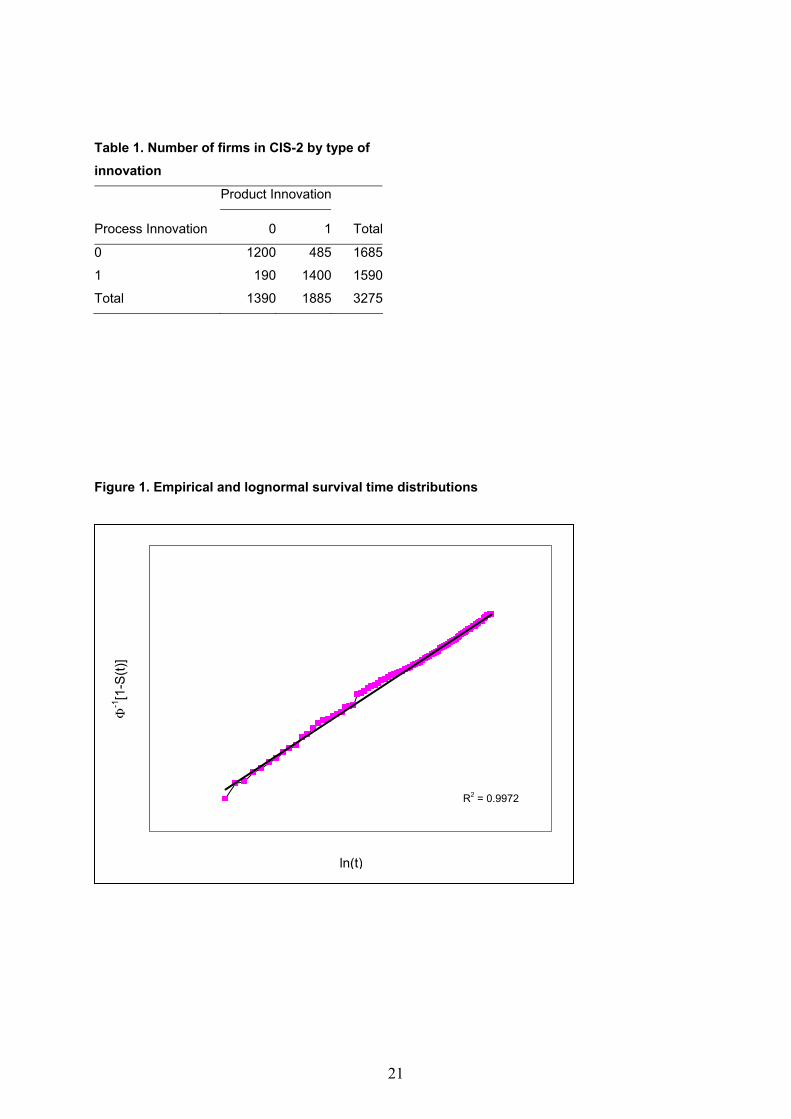
composition of firms in our sample, according to these definitions is reported in Table 1.
Insert Table 1.
Firm size. Firm size is one of the starting conditions that we want to control for. In particular
we use the current size of a firm (Evans, 1987; Hall, 1987) in the beginning of the period of
observation. The variable of firm size is derived from the Business Register and is measured
by the number of employees in the year 1996. In addition, to account for a non-linear
relationship between survival and firm size we also include the squared term of firm size in
the survival model (Evans, 1987; Hall, 1987).
Firm age. As for firm size, firm age is another initial condition, which has been found to
shape the survival probability. The age of a firm is calculated by using the date of entry of a
firm into the Business Register. The age 0 identifies those firms that have entered during the
year 1996. The firm age is calculated in months and its distribution is truncated at January
1901. Because of the evidence that the link between age and survival may follow an inverted-
U pattern (Evans, 1987; Bruderl and Schussler, 1990), we also enter in the model the squared
term of age (Evans, 1987). Last, as firm age and firm size may interact in shaping firm
survival we include the interaction term between the two variables (Evans, 1987).
Firm growth. Given a certain current size of a firm, the conditions for survival will be
different depending on whether the firm is growing in size or rather declining (Agarwal,
1997). We then calculate the rate of employment growth of a firm between 1994 and 1996,
using employment data from the Business Register.
9
Industrial classification. In order to control for differences in the nature of technology and
their influence on the survival of firms (Agarwal and Audretsch, 2001) we classify our firms
according to Pavitt’s taxonomy (Pavitt, 1984). As a result, we have four dummies, one for
each of the Pavitt’s categories of firms: science-based, supplier dominated, specialised
suppliers and scale intensive.
The analysis is carried out by using all the independent variables as “initial conditions”, that
is, they are observed in the year 1996 which is the starting point for the calculation of the
survival time.
3.3. Methodology
In our analysis we focus on the survival time of the firm, which is a duration variable. Let T
be the number of months that our firms have survived until December 2003. The cumulative
distribution function of the duration time T is denoted as F and is defined as
( ) ( ), 0F t P T t t= ≤ ≥ . (1)
This function gives the probability that the duration T is less than or equal to t. In our case, it
is the probability that a firm exits the population before t months after December 1995. The
value of t ranges between 0 and 96 months.
The survival function is defined as
( ) 1 ( ) ( )S t F t P T t= − = > , (2)
and this is the probability that a firm survives t months after December 1995.
We perform both a univariate and multivariate analysis in order to investigate the survival of
firms. As first step of the univariate analysis we calculate the empirical survival function by
using the life-table approach (Kalbfleish and Prentice 1980). The survival functions are
estimated for different categories of firms according to the innovative performance
10
(innovators and non-innovators) and the type of innovation (product and process innovator).
We then compare the estimated survival functions for the different categories of firms in order
to determine whether they have been generated by the identical theoretical survival function.
For this purpose, we use the log-rank test, the Wilcoxon test and the likelihood ratio test.2
However, the focus of this analysis is not limited to the evaluation of the differences in the
survival functions among categories of firms. Furthermore we want to assess the influence of
the covariates on the probability of firm survival. We then carry out a conditional or
multivariate analysis of the determinants of survival. As we want to use a semi-parametric
model, that is the proportional hazards Cox model, we begin testing for the necessary
assumption of the model. The Cox model is fairly robust, since it does not impose any
functional form on the distribution of survival times. However, it assumes a parametric form
for the effects of the covariates on the hazard rate, which requires that the hazard ratio for any
two observations with different covariate vectors is independent on the survival time. We test
for the proportionality of the hazard rates for all the covariates that we introduce in the model
(Hausman and Han, 1990, Meyer 1988).3 In our data, we found that the proportionality
assumption is violated in the case of the innovation variable. Since this is our main variable of
interest we cannot make a stratified analysis to solve the problem of non-proportionality.
Another way to handle this problem is to use parametric models of survival (or accelerated
time models). These models assume a linear form for the effects of the covariates on the
survival time (often in logarithm) and a parametric form, in contrast to the Cox model, also
for the underlying survival function. In order to be able to distinguish the most adequate
parametric model we apply a graphical analysis of the survival time distributions. As
suggested by Mattias and Sevestre (2nd edition, chapter 19, p. 515), we examine the Q-Q plots
between the empirical survival time distributions and different theoretical distributions,
namely the Weibull, exponential, lognormal and log-logistic. For testing the assumptions of
2 It is worth noting that the likelihood ratio test is based on an underlying exponential model whereas the other two tests are non-parametric. 3 In particular, we use a test based on time dependent covariates (Cox and Oakes, 1972). That is, we estimate the proportional hazards model by adding to all the covariates the interaction terms between these covariates and time. If the interaction term is not statistically significant, then it means that there is no adverse effect in the estimation due to the time dependency of the covariate.
11
the different theoretical distributions we have fitted the following transformations of the
survival functions on our empirical data:
Weibull: ln[ ln ( )] ln ln( )S t tα β− = +
Exponential: ln ( )S t ht= −
Lognormal: -1 1[1 ( )] ln( )S t tµσ σ
Φ − = − +
Log-logistic: 1ln 1 ln ln( )( )
tS t
α β − = +
where t is the survival time and Φ is the distribution function of the standardised normal
distribution and ,α β and h are parameter of the respective distributions..
By graphical examination of the Q-Q plots, we select the lognormal distribution and we
estimate the parametric model under this assumption. Figure 1 plots the empirical and
theoretical distributions of the survival time under the assumption of log-normality.
Insert Figure 1
The accelerated time model estimated with the survival time distributed as a lognormal is
given by:
ln( )T X β σε= + (3)
where T is the survival time and X the matrix of covariates, β the vector of unknown
coefficients, including an intercept term, σ the unknown scale parameter, and ε the vector of
errors assumed to be distributed according to a normal distribution. The coefficients β of the
model are semielasticies of the covariates on the expected survival time, or elasticities when
the covariates are expressed in logarithmic form. The semielasticity is the approximation of
the percentage change of expected value of the survival time (Wooldridge, 2002 p. 699).
12
That is, for the observation i, the residual wi fulfils the following conditions:
1 ( )
( )
i i iw y x
wG w
βσ
µσ
= −
− = Φ
where G(w) is the cumulative distribution function of the residuals.
The parameters are estimated by maximum likelihood.
4. Results
4.1. Descriptive statistics
In this section we compare the general characteristics of the different samples we have used in
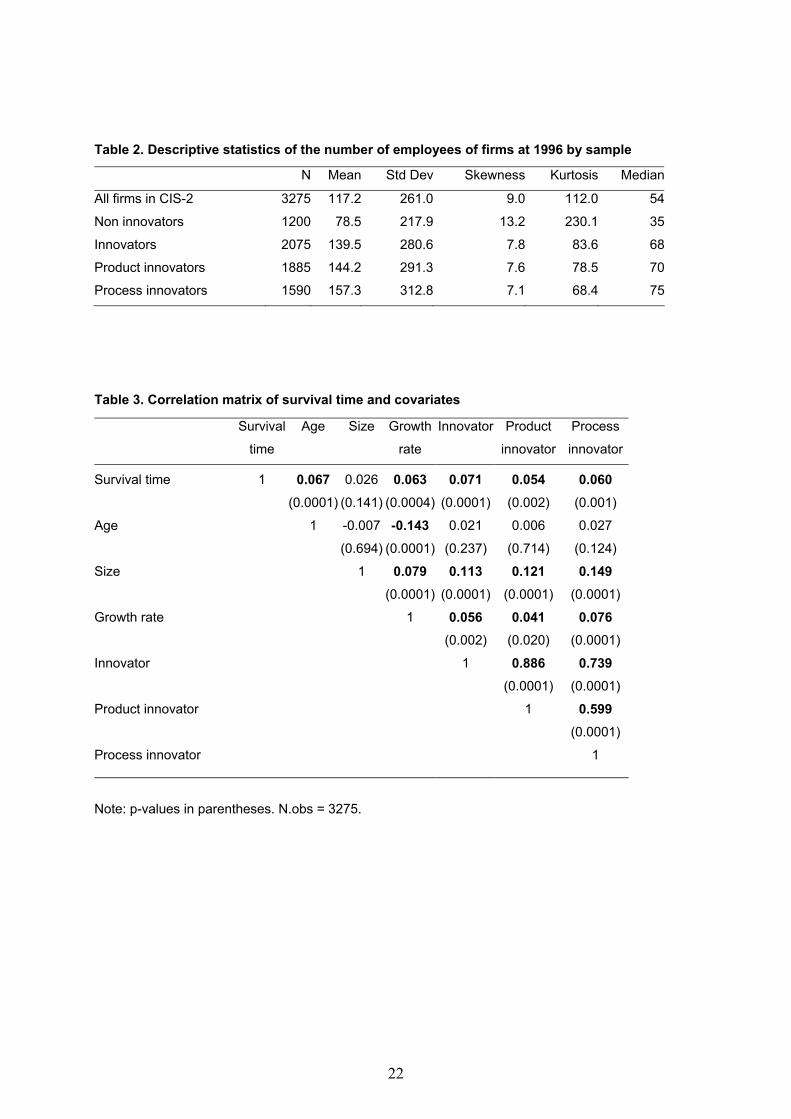
the analysis. Table 2 shows the descriptive statistics of the number of employees in the
different samples used in the analysis.
The CIS is a stratified random sample of firms with at least 10 employees. This implies that
very small firms are not included in the innovation surveys of the European Union.
Furthermore, within the threshold of 10 employees, the survey tends to capture the largest
firms (for a comparison with the population of firms in the Netherlands see Cefis and Marsili
(2003)). The average size of firms within the CIS is equal to 117.2 employees (see Table 2),
and innovative firms tend to be larger than non-innovative firms: their average size is
respectively equal to 139.5 and 78.5 employees. In turn, process innovators are on average
larger than product innovators. The average size of process innovators is equal to 157.3,
which is statistically higher than the average size of product innovators, equal to 144.2.
Moreover, the size distribution of process innovators seems to be more concentrated around
the central values than that of product innovators.
Insert Table 2
13
Table 3 reports the correlation matrix of the survival time (the number of months a firm
survives starting from January 1996 to December 2003), the innovation variables, and the
firm-specific control variables. As expected, age is positively correlated with survival, while
size is not significantly correlated with the survival time. The absence of significant positive
correlation between firm size and survival, which is generally observed in the literature, could
be due to the fact that the CIS does not include micro firms (below 10 employees) and tends
to over-represent relatively larger firms.
All the innovation variables are significantly and positively correlated with survival. It is
worth noting that the degree of correlation of the innovation variables with survival is of
comparable magnitude than that of firm age with survival. Age is one of the variables
generally regarded in the literature as the most important determinants of survival. The
correlation suggests that our variables of innovation do play a similar role. Given our
definition of the innovation variables, the matrix shoes an obviously high correlation between
the innovation dummy and the product and process innovation dummies. Nevertheless,
among these three variables, the innovation dummy remains the ones with the highest
correlation with the survival time.
4.2. Univariate and graphical analysis
In order to test for differences in the survival due to innovation, we compare the survival rates
of the groups of innovators, product innovators, and process innovators with respect to the
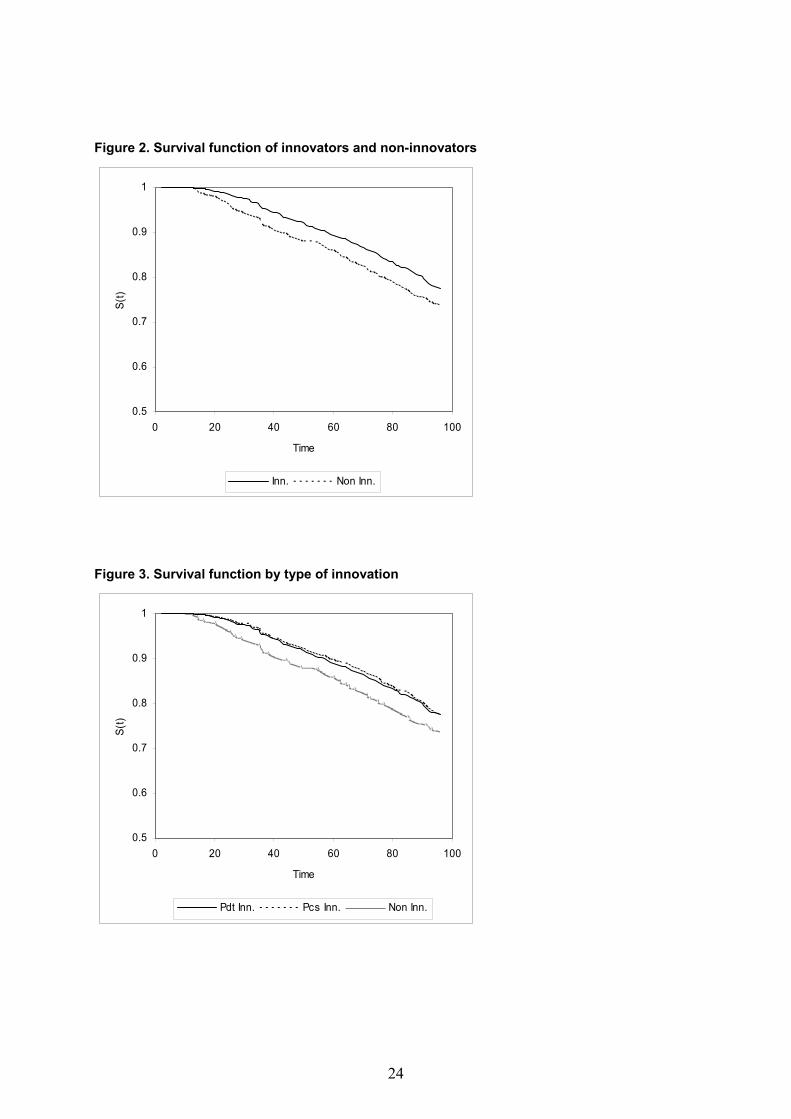
group of non-innovators (Table 4). In general, the survival rate decreases of about 25 percent
in the overall period of 8 years. Indeed, the percentage of firms that exit the market during
that period is equal to 26.2 per cent for non-innovators, 22.3 per cent for innovators. At the
end of the observation period, the survival rate of non-innovators is 5.2 percent lower than
innovators. For each year, the estimated survival rate is always lower for the non-innovators
than for the innovators. Over time, these differences increases as the survival rates of the two
groups follow divergent paths. This result is also shown in Figure 2, where the survival
functions are plotted for the different categories.
Insert Table 4
14
When distinguishing product from process innovators, we find that the survival rates are
almost identical between the two groups. Indeed, the plotted survival function in Figure 3
overlaps almost entirely.
Insert Figure 2 and 3
Overall the analysis of the survival functions show that the discriminating factor for survival
is being an innovator or a non-innovator, regardless of the type of innovation.
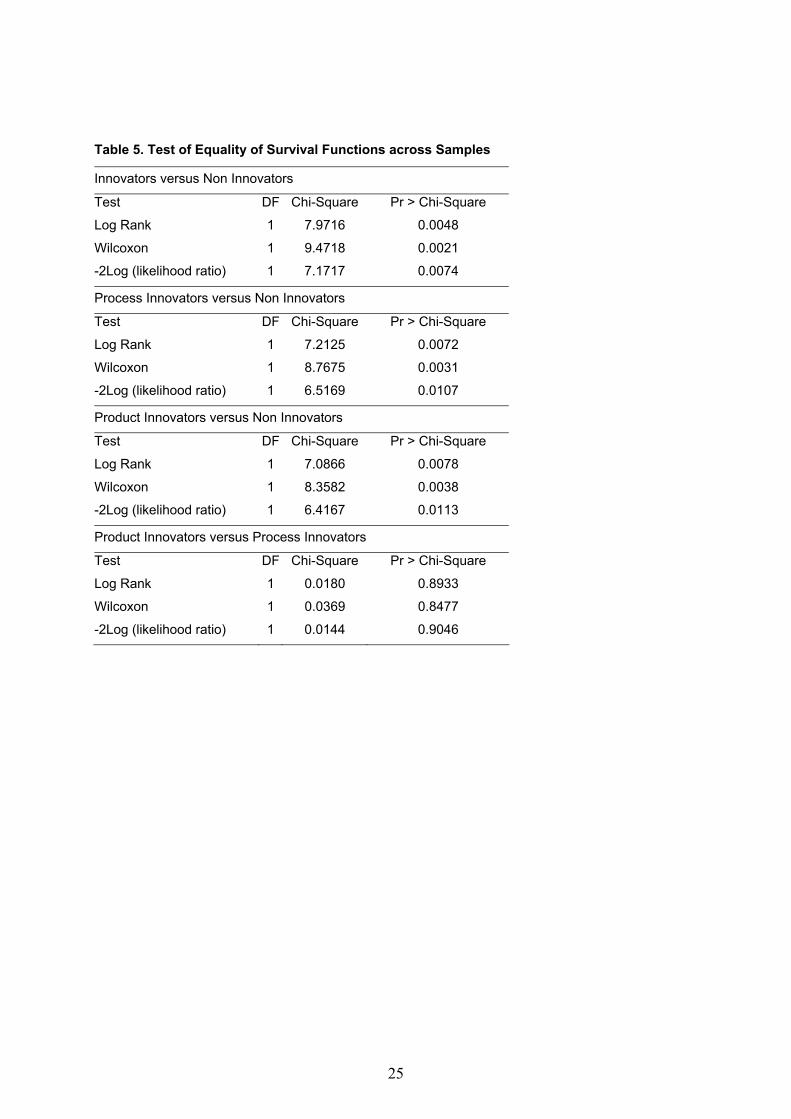
In order to investigate whether the differences between the survival functions are significant,
we test for equality of the functions using three statistical tests. Table 5 shows that according
to all the tests, the differences between non-innovators and innovators are statistically
significant at 1 per cent level. This holds for all the three innovation proxies. In addition, the
values of the statistics for product innovators and process innovators are once again very
similar, implying that the fact of being an innovator is what most matters. Indeed, the test
between product innovators and process innovators shows that the differences are not at all
significant.
Insert Table 5
4.3. Multivariate analysis
This section explores firm characteristics as determinants of firm survival. For this purpose
we apply a parametric survival model with lognormal distribution, relating a set of firm
specific covariates to the survival time of the firm. We have estimated different specifications
of the model following a hierarchical procedure in three stages. Our starting point is the base
model 1.A, in which we include as control variable the size and age of the firm and as proxy
of innovation the innovators dummy. At second stage, the model 1.B is constructed by adding
the square terms of size and age and the interaction variable between size and age to model A.
This allows us to account for non-linear effects of the control variables on the survival time.
These variables are added by using a stepwise procedure with a threshold of 0.10 significance.
15
At a third stage, we define a model 1.C by adding together with the previous non-linear terms
of age and size, also the firm rate of growth. We apply the same hierarchical procedure to a
different base model 2.A, in which we use the two dummies for product and process
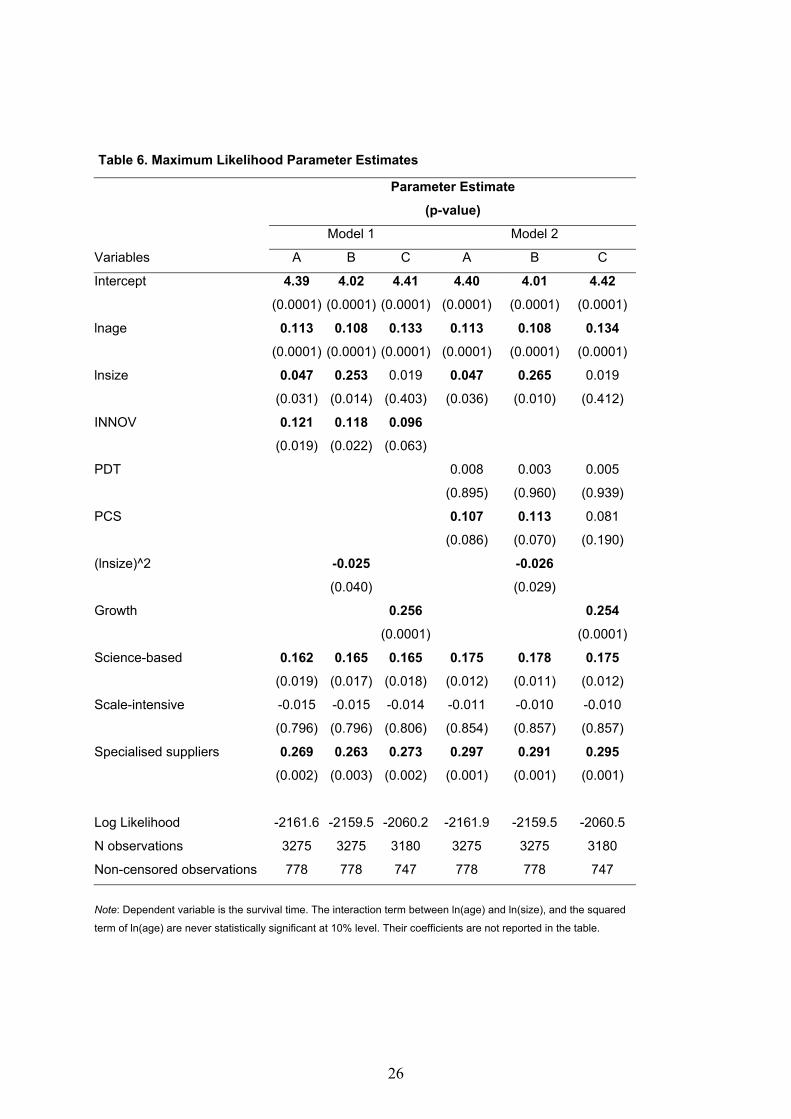
innovators as proxies of innovation. Table 6 reports the Maximum likelihood estimates of the
parameters of the model.
Insert Table 6
In general, we find that the two control variables of the square term of (log) age and the
interaction term between the (log) age and (log) size are not statistically significant in any of
the different specifications of the model. It is worth noting that all the control variables we
introduce follow a constant pattern across the different models. Age and size have always a
statistically significant and positive effect on survival, confirming previous findings in the
literature. In particular, age increases the expected survival time of a firm on average of about
12 per cent. The effect of size is significantly positive in models A and B, while in model C,
when we introduce the firm growth rate, firm size looses its significance. Firm growth appears
indeed to be an important determinant of firm survival: it increases the expected survival time
of 25 per cent, either in model 1 or in model 2. Our results confirm those found by Mata,
Portugal and Guimaraes (1995) and Agarwal (1997). The rate at which the firms grow does
matter in shaping the survival probability, more than the initial size. As a consequence the
initial size becomes non significant when also controlling for the direction of growth.
Looking at the categories of Pavitt’s taxonomy, the dummies that refer to namely science
based firms and specialised suppliers, exert a positive and statistically significant influence on
survival, regardless of the model. This result gives a first insight of the role of innovation for
firm survival. In fact these categories are composed of knowledge based firms that are also
major “producers” of innovations, both in products and processes, with comparison to the
other two categories of the taxonomy.
The direct effect of innovation on firm survival is expressed by the coefficient of three
different variables. Model 1 includes the dummy variable INNOV (innovators/non-
innovators), which is always statistically significant and with a positive effect. The magnitude
16
of the coefficient is approximately the same of those of firm age and science-based category.
Being an innovator enhances the expected time of survival of 11 per cent, with respect to non-
innovators. This result reflects the average influence of innovation on survival, since the
effect is estimated on the all CIS sample. This effect can vary drastically when estimated on
specific categories of firms defined according to basic firm characteristics, like age and size.
In fact, in a previous study we found that the impact of innovation on survival among young
and small firms increases up to 23 per cent (Cefis and Marsili, 2003).
Our next aim is to distinguish between the roles of different types of innovation. When we
introduce the product (PDT) and process (PCS) innovator dummies instead of the general
innovator variable, we observe that process innovation seems to capture the entire effect. For
the latter variable the coefficient is similar in all the three models (2.A, B, and C) to the
coefficient of the innovator dummy. In contrast, the coefficient for the product innovator is
not statistically different from zero.4 This result suggests that process innovation is the
innovative characteristic that distinguishes firms with respect to their likelihood to survive. It
seems that being a process innovator implies having higher innovative capabilities that enable
a firm to adapt to more radical changes. This enhanced ability to adapt to changes, in
technologies and markets, is the key factor for increasing the chances of survival.
5. Conclusions
In this paper, we analysed the relationship between innovation and survival of manufacturing
firms using micro-economic databases from two different sources: the Business Register of
the population of firms in the Netherlands and the Second Community Innovation Survey.
This paper contributes to a growing number of empirical studies that draw on the Community
Innovation Survey to examine the effects of innovation on a firm’s economic performance.
4 We are aware that the correlation between the product and process innovation dummies (0.599) is significant, given the fact that there is a partial overlapping between product and process innovators. However, the correlation is not so high to cause a serious problem of multicollinearity in the regression. For this reason, we decided to include contemporaneously the two variables in the models.
17
For this purpose we implement a survival analysis based on both non-parametric and
parametric methodology. Performing the univariate analysis of the survival functions, we
observe a marked difference between innovators and non-innovators, regardless of the type of
innovation. In the multivariate analysis, when we control for the effects of age, size, growth
and nature of technology, the role of innovation remains positive and well defined. Moreover,
we are able to detect that there is a distinctive difference between product and process
innovators. Firms that introduce new products do not have higher chances of survival than
non-innovators. In contrast, firms that can implement process innovation do benefit of higher
survival likelihood.
Our results are in line with the previous findings of the literature, confirming that age and size
positively affect firm survival (with decreasing returns of firm size on survival probability).
Furthermore, the firm growth rate appears to play a major role in shaping survival. The
nature of technology also shapes the conditions for firm survival, as technology intensive
sectors, like science based and specialised suppliers are more favourable to firm survival.
Overall, innovation increases the survival probability of firms of 11 percent. This effect is
comparable in scale to the effect of firm age, which has been traditionally found to be a key
determinant of firm survival. There is, therefore, an “innovation premium” than would
balance the “liabilities of newness” of a firm.
Our findings support Schumpeter and Baumol’s views that innovation does matter for the
very existence of a firm. This is so not only because of the nature of technology, affecting the
general conditions for firm survival in the market (Agarwal and Audretsch, 2001), but also
because of the firm- specific capabilities to deal with external changes (Christensen, 1997).
18
References Agarwal, R. (1997), 'Survival of firms over the Product Life Cycle', Southern Economic Journal, 63, 571-584. Agarwal, R. and D. B. Audretsch (2001), 'Does entry size matter? The impact of the life cycle and technology on firm survival', The Journal of Industrial Economics, 49, 21-43. Audretsch, D. B. (1995), 'Innovation, growth and survival', International Journal of Industrial Organization, 13, 441-457. Audretsch, D. B., P. Houweling and R. Thurik (2000), 'Firm survival in the Netherlands', Review of Industrial Organization, 16, 1-11. Audretsch, D. B. and T. Mahmood (1994), 'The rate of hazard confronting new firms and plants in U.S. manufacturing', Review of Industrial Organization, 9, 41-56. Audretsch, D. B. and T. Mahmood (1995), 'New firm survival: new results using a hazard function', Review of Economics and Statistics, 77, 97-103. Baldwin, J. R. (1995), The Dynamics of Industrial Competition. Cambridge University Press: Cambridge. Baldwin, J. R. and P. K. Gorecki (1991), 'Firm entry and exit in the Canadian manufacturing sector, 1970-1982', Canadian Journal of Economics, 24, 300-323. Banbury, C. M. and W. Mitchell (1995), 'The effects of introducing important incremental innovation on market share and business survival', Strategic Management Journal, 16, 161-182. Baum, J. A. C. (1996), 'Organizational ecology,' in S. Clegg, C. Hardy and W. Nord (eds.), Handbook of Organization Studies. Sage: London. Baum, J. A. C., T. Calabrese and B. S. Silverman (2000), 'Don't go it alone: Alliance network composition and startups' performance in Canadian biotechnology', Strategic Management Journal, 21, 267-294. Baumol, W. J. (2002), Free Market Innovation Machine: Analyzing the Growth Miracle of Capitalism. Princeton University Press. Bruderl, J., P. Preisendorfen and R. Ziegler (1992), 'Survival chances of newly founded business organizations', American Sociological Review, 57, 227-242. Bruderl, J. and R. Schussler (1990), 'Organizational mortality: the liabilities of newness and adolescence', Administrative Science Quarterly, 35, 530-547.
19
Caves, R. E. (1998), 'Industrial organization and new findings on the turnover and mobility of firms', Journal of Economic Literature, 36, 1947-1982. Cefis, E. and O. Marsili (2003), 'Survivor: The role of innovation in firm's survival', WP T. Koopmans Institute, USE, Utrecht University. No. 03-18. Choonwoo, L., L. Kyungmook and J. M. Pennings (2001), 'Internal capabilities, external networks and performance: A study on technology-based ventures', Strategic Management Journal, 22, 615-640. Christensen, C. M., F. F. Suarez and J. M. Utterback (1998), 'Strategies for survival in fast-changing industries', Management Science, 44, S207-S220. Christensen, M. C. (1997), The Innovator's Dilemma. Harvard Business School Press. Colombo, M. G. and M. Delmastro (2001), 'Technology use and plant closure', Research Policy, 30, 21-34. Cox, D. R. and D. Oakes (1972), Analysis of Survival Data. Chapman and Hall. Doms, M., T. Dunne and M. J. Roberts (1995), 'The role of technology use in the survival and growth of manufacturing plants', International Journal of Industrial Organization, 13, 523-542. Dunne, T., M. J. Roberts and L. Samuelson (1988), 'Patterns of firm entry and exit in the U.S. manufacturing industries', RAND Journal of economics, 19, 495-515. Ericson, R. and A. Pakes (1995), 'Markov-perfect industry dynamics: A framework for empirical work', Review of Economic Studies, 62, 53-82. Evans, D. S. (1987), 'The relationship between firm growth, size, and age: Estimates for 100 manufacturing industries', The Journal of Industrial Economics, 35, 567-581. Freeman, J., G. R. Carroll and M. T. Hannan (1983), 'The liability of newness: Age dependence in organizational death rates', Americal Sociological Review, 48, 692-710. Geroski, P. A. (1995), 'What do we know about entry?' International Journal of Industrial Organization, 13, 421-440. Geroski, P. A., J. Mata and P. Portugal (2002), 'Founding conditions and the survival of new firms'. Hall, B. H. (1987), 'The relationship between firm size and firm growth in the US manufacturing sector', The Journal of Industrial Economics, 35, 583-606. Hannan, M. T. and J. Freeman (1977), 'The population ecology of organization', American Journal of Sociology, 82, 929-964.
20
Jovanovic, B. (1982), 'Selection and the evolution of industry', Econometrica, 50, 649-670. Mata, J. and P. Portugal (1994), 'Life duration of new firms', The Journal of Industrial Economics, 42, 227-245. Mata, J., P. Portugal and P. Guimaraes (1995), 'The survival of new plants: Start-up conditions and post-entry evolution', International Journal of Industrial Organization, 13, 459-481. Pakes, A. and R. Ericson (1998), 'Empirical implications of alternative models of firm dynamics', Journal of Economic Theory, 79, 1-45. Pavitt, K. (1984), 'Sectoral patterns of technical change: towards a taxonomy and a theory', Research Policy, 13, 343-373. Schumpeter, J. A. (1942), Capitalism, Socialism and Democracy. Harper & Row: New York. Sorensen, J. B. and T. E. Stuart (2000), 'Aging, obsolescence, and organizational innovation', Administrative science quarterly, 45, 81-112. Stinchcombe, A. (1965), 'Social structures and organizations,' in J. G. March (ed.), Handbook of Organizations. Rand McNally: Chicago. Sutton, J. (1997), 'Gibrat's legacy', Journal of Economic Literature, 35, 40-59. Wagner, J. (1994), 'The post-entry performance of new small firms in German manufacturing industries', The Journal of Industrial Economics, 42, 141-154.
21
Table 1. Number of firms in CIS-2 by type of innovation
Product Innovation
Process Innovation 0 1 Total
0 1200 485 1685
1 190 1400 1590
Total 1390 1885 3275
Figure 1. Empirical and lognormal survival time distributions
Φ-1
[1-S
(t)]
ln(t)
R2 = 0.9972
22
Table 2. Descriptive statistics of the number of employees of firms at 1996 by sample
N Mean Std Dev Skewness Kurtosis Median
All firms in CIS-2 3275 117.2 261.0 9.0 112.0 54
Non innovators 1200 78.5 217.9 13.2 230.1 35
Innovators 2075 139.5 280.6 7.8 83.6 68
Product innovators 1885 144.2 291.3 7.6 78.5 70
Process innovators 1590 157.3 312.8 7.1 68.4 75
Table 3. Correlation matrix of survival time and covariates
Survival
time
Age Size Growth
rate
Innovator Product
innovator
Process
innovator
Survival time 1 0.067 0.026 0.063 0.071 0.054 0.060 (0.0001) (0.141) (0.0004) (0.0001) (0.002) (0.001)
Age 1 -0.007 -0.143 0.021 0.006 0.027
(0.694) (0.0001) (0.237) (0.714) (0.124)
Size 1 0.079 0.113 0.121 0.149 (0.0001) (0.0001) (0.0001) (0.0001)
Growth rate 1 0.056 0.041 0.076 (0.002) (0.020) (0.0001)
Innovator 1 0.886 0.739 (0.0001) (0.0001)
Product innovator 1 0.599 (0.0001)
Process innovator 1
Note: p-values in parentheses. N.obs = 3275.

23
Table 4. Survival rates by Sample
Year Non Innovators Innovators Process
Innovators Product
Innovators
0 100 100 100 100
1 99.9 99.9 99.9 100
2 96.4 98.6 98.7 98.6
3 91.7 95.4 95.6 95.4
4 88.5 92.4 92.6 92.2
5 85.9 89.1 89.7 88.9
6 81.4 85.7 86.4 85.6
7 77.3 82.0 82.6 82.0
8 73.7 77.7 77.6 77.5
Number of firms 1200 2075 1590 1885
% of failures 26.3 22.3 22.3 22.4
Note: Life-table estimates of survival rates
24
Figure 2. Survival function of innovators and non-innovators
0.5
0.6
0.7
0.8
0.9
1
0 20 40 60 80 100
Time
S(t)
Inn. Non Inn.
Figure 3. Survival function by type of innovation
0.5
0.6
0.7
0.8
0.9
1
0 20 40 60 80 100
Time
S(t)
Pdt Inn. Pcs Inn. Non Inn.
25
Table 5. Test of Equality of Survival Functions across Samples
Innovators versus Non Innovators
Test DF Chi-Square Pr > Chi-Square
Log Rank 1 7.9716 0.0048
Wilcoxon 1 9.4718 0.0021
-2Log (likelihood ratio) 1 7.1717 0.0074
Process Innovators versus Non Innovators
Test DF Chi-Square Pr > Chi-Square
Log Rank 1 7.2125 0.0072
Wilcoxon 1 8.7675 0.0031
-2Log (likelihood ratio) 1 6.5169 0.0107
Product Innovators versus Non Innovators
Test DF Chi-Square Pr > Chi-Square
Log Rank 1 7.0866 0.0078
Wilcoxon 1 8.3582 0.0038
-2Log (likelihood ratio) 1 6.4167 0.0113
Product Innovators versus Process Innovators
Test DF Chi-Square Pr > Chi-Square
Log Rank 1 0.0180 0.8933
Wilcoxon 1 0.0369 0.8477
-2Log (likelihood ratio) 1 0.0144 0.9046
26
Table 6. Maximum Likelihood Parameter Estimates
Parameter Estimate
(p-value)
Model 1 Model 2
Variables A B C A B C
Intercept 4.39 4.02 4.41 4.40 4.01 4.42
(0.0001) (0.0001) (0.0001) (0.0001) (0.0001) (0.0001)
lnage 0.113 0.108 0.133 0.113 0.108 0.134
(0.0001) (0.0001) (0.0001) (0.0001) (0.0001) (0.0001)
lnsize 0.047 0.253 0.019 0.047 0.265 0.019
(0.031) (0.014) (0.403) (0.036) (0.010) (0.412)
INNOV 0.121 0.118 0.096
(0.019) (0.022) (0.063)
PDT 0.008 0.003 0.005
(0.895) (0.960) (0.939)
PCS 0.107 0.113 0.081
(0.086) (0.070) (0.190)
(lnsize)^2 -0.025 -0.026
(0.040) (0.029)
Growth 0.256 0.254
(0.0001) (0.0001)
Science-based 0.162 0.165 0.165 0.175 0.178 0.175
(0.019) (0.017) (0.018) (0.012) (0.011) (0.012)
Scale-intensive -0.015 -0.015 -0.014 -0.011 -0.010 -0.010
(0.796) (0.796) (0.806) (0.854) (0.857) (0.857)
Specialised suppliers 0.269 0.263 0.273 0.297 0.291 0.295
(0.002) (0.003) (0.002) (0.001) (0.001) (0.001)
Log Likelihood -2161.6 -2159.5 -2060.2 -2161.9 -2159.5 -2060.5
N observations 3275 3275 3180 3275 3275 3180
Non-censored observations 778 778 747 778 778 747
Note: Dependent variable is the survival time. The interaction term between ln(age) and ln(size), and the squared
term of ln(age) are never statistically significant at 10% level. Their coefficients are not reported in the table.