Embed Size (px)
Citation preview
A MAtter of Degrees:The Effect of Educational Attainment on Regional Economic Prosperity
February 2013
Ross C. DeVol, I-Ling Shen, Armen Bedroussian, and Nan Zhang
reseArCH fINDINgs

On the WebData for each metro area can be found at www.matterofdegrees.net

1
exeCutIve suMMAry
What region wouldn’t want to be the next Silicon Valley or Research Triangle? It’s not an impossible goal with the right policies and investments in higher education. While it’s intuitive that an educated population, good jobs, and prosperity go hand-in-hand, this study proves the strong relationship between educational attainment and a region’s economic performance. The research is also original: We created a unique data set over time of educational attainment by occupation and industrial employment by occupation, which we linked together to examine these relationships, as measured by metropolitan statistical area (MSA) real wages and real gross domestic product (GDP) per capita. The purpose is to provide a blueprint for policymakers, educators, business executives, and civic leaders to follow in boosting education and skills training in their regions.
Key FindingsOur analysis clearly demonstrates that a region’s economic fortunes are closely tied to the quality of its workforce. Our major findings are:
----- Education increases regional prosperity: Adding one extra year to the average years of schooling among the employed in a metropolitan area is associated with an increase in real GDP per capita of 10.5 percent and an increase in real wages per worker of 8.4 percent. Take Danville, VA, for example. Average years of schooling in the metro rose 1.1 years to 13.18 from 1990 to 2010. This boosted real GDP per capita by 12.2 percent or $3,440.
----- Better educated, bigger benefits: The benefits of additional schooling to regional economies are even greater for better-educated workers. Adding one year of schooling to the average educational attainment among employed workers with at least a high school diploma is associated with an increase in real GDP per capita of 17.4 percent and an increase in real wages per worker of 17.8 percent. In contrast, an additional year of education for workers with just nine or 10 years of schooling has little effect on real GDP per capita and real wages per worker.
BACHELOR’SDEGREE
MASTER’SDEGREE
DOCTORATEDEGREE
+17.4%GDP PER CAPITA
Add one year of college to the region’s workforce, and
GDP per capita jumps 17.4%
2
A MAtter of Degrees
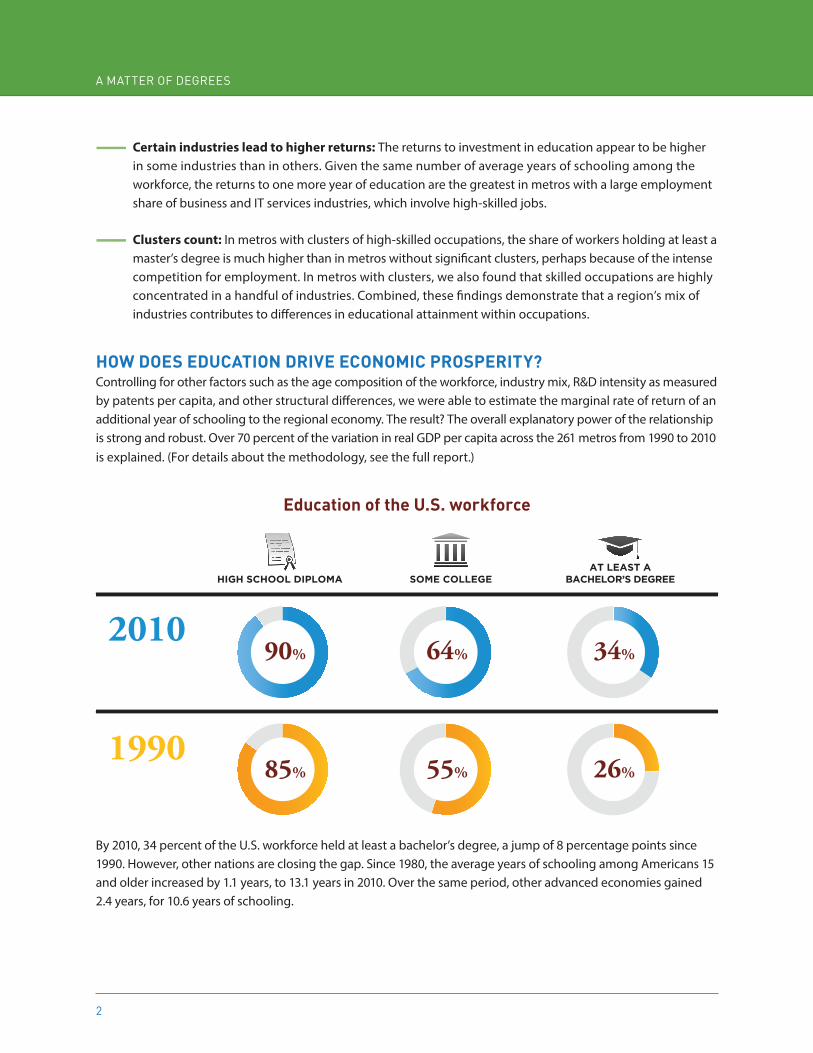
----- Certain industries lead to higher returns: The returns to investment in education appear to be higher in some industries than in others. Given the same number of average years of schooling among the workforce, the returns to one more year of education are the greatest in metros with a large employment share of business and IT services industries, which involve high-skilled jobs.
----- Clusters count: In metros with clusters of high-skilled occupations, the share of workers holding at least a master’s degree is much higher than in metros without significant clusters, perhaps because of the intense competition for employment. In metros with clusters, we also found that skilled occupations are highly concentrated in a handful of industries. Combined, these findings demonstrate that a region’s mix of industries contributes to differences in educational attainment within occupations.
How does education drive economic ProsPerity?Controlling for other factors such as the age composition of the workforce, industry mix, R&D intensity as measured by patents per capita, and other structural differences, we were able to estimate the marginal rate of return of an additional year of schooling to the regional economy. The result? The overall explanatory power of the relationship is strong and robust. Over 70 percent of the variation in real GDP per capita across the 261 metros from 1990 to 2010 is explained. (For details about the methodology, see the full report.)
education of the u.s. workforce
2010
1990
90%
HIGH SCHOOL DIPLOMA
85%
SOME COLLEGE
64%
55%
AT LEAST ABACHELOR’S DEGREE
26%
34%
By 2010, 34 percent of the U.S. workforce held at least a bachelor’s degree, a jump of 8 percentage points since 1990. However, other nations are closing the gap. Since 1980, the average years of schooling among Americans 15 and older increased by 1.1 years, to 13.1 years in 2010. Over the same period, other advanced economies gained 2.4 years, for 10.6 years of schooling.
3
executive summary
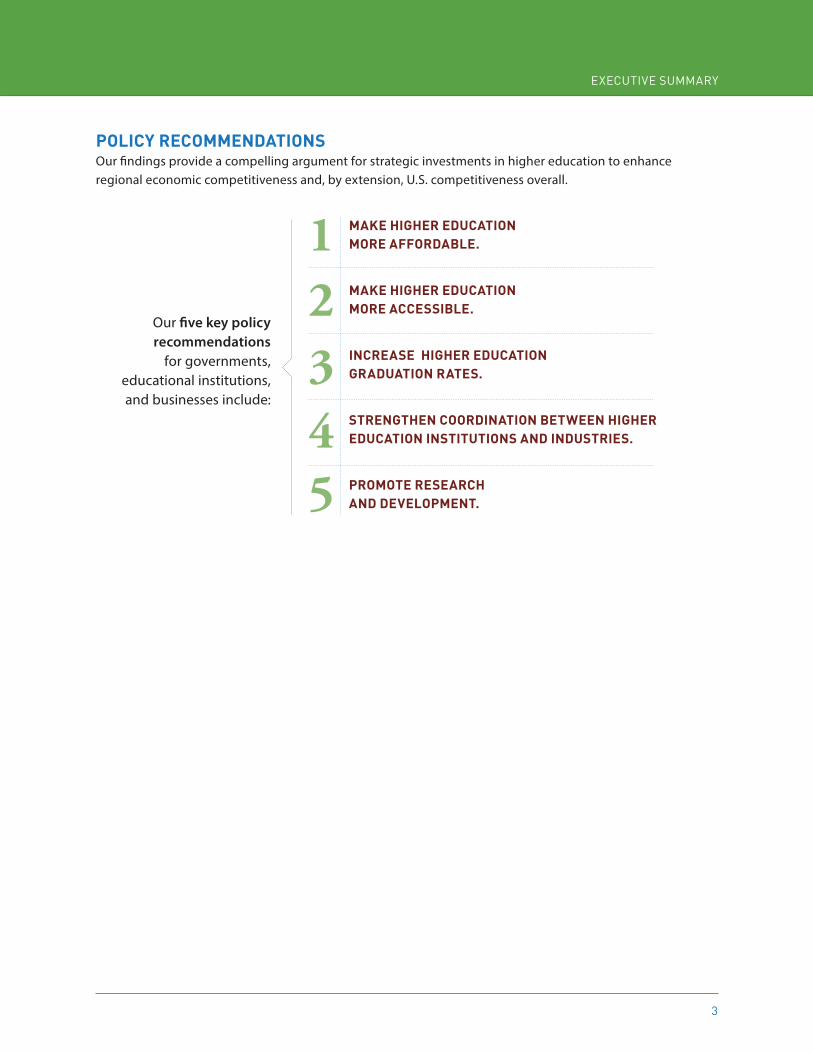
Policy recommendationsOur findings provide a compelling argument for strategic investments in higher education to enhance regional economic competitiveness and, by extension, U.S. competitiveness overall.
12345
maKe HigHer education more aFFordable.
maKe HigHer education more accessible.
increase HigHer education graduation rates.
strengtHen coordination between HigHer education institutions and industries.
Promote researcH and develoPment.
Our five key policy recommendations
for governments, educational institutions, and businesses include:

On the WebData for each metro area can be found at www.matterofdegrees.net
5
reseArCH fINDINgs
When it comes to education, a rising tide really does lift all boats. It is also a location’s most important source of sustainable competitive advantage.
It is conventional wisdom that an educated workforce is the key to a region’s economic prosperity. It’s why cities with excellent universities tend to have the most innovative companies. It’s why local governments eager to expand their tax base compete to draw tech-based businesses and the highly skilled people they employ. It’s why Northern California’s Silicon Valley, North Carolina’s Research Triangle, New York’s Silicon Alley, and San Diego’s Golden Triangle are the envy of every metropolitan area. But even if a region isn’t a tech powerhouse yet, education helps protect it from being arbitraged by those seeking lower costs in a globally interconnected world.
Less conventional is the idea that just occupying the same geographic space as those skilled workers can benefit the less-educated workforce. As others around you obtain more education, their wages rise—and yours do, too. Their productivity also increases, as does yours. In other words, as educated workers improve their lot in life, they bring their neighbors along with them. Or in the language of economics: As educational inputs increase, economic output per capita rises more than proportionately. Our research demonstrates that for each additional year of post-secondary schooling a region’s workforce obtains, real GDP per capita and real wages per worker jump by more than 17 percent.
That is just one of the findings to emerge from our study of the relationship between educational attainment and regional economic prosperity. The purpose of this study is to inform policymakers, educators, business executives, and civic leaders about the importance of boosting investment in education and skills training in their regions.
educational attainment in tHe u.s.To learn how the dynamics of human capital are changing the paradigm of regional economic performance, we developed a data set of educational attainment among the workforce in U.S. metropolitan areas broken out by occupation for 1990, 2000 and 2010.1 We used this data set to examine many facets of the statistical relationships linking the educational achievement of the workforce, a region’s occupational and industry composition, and overall regional economic prosperity, measured as real GDP per capita and real wages per worker.
1. Our supplementary webtool (available at www.matterofdegrees.net) provides complete educational profiles for the 50 most populous metropolitan areas and for more than 300 occupations.
6
A MAtter of DegreesA MAtter of Degrees
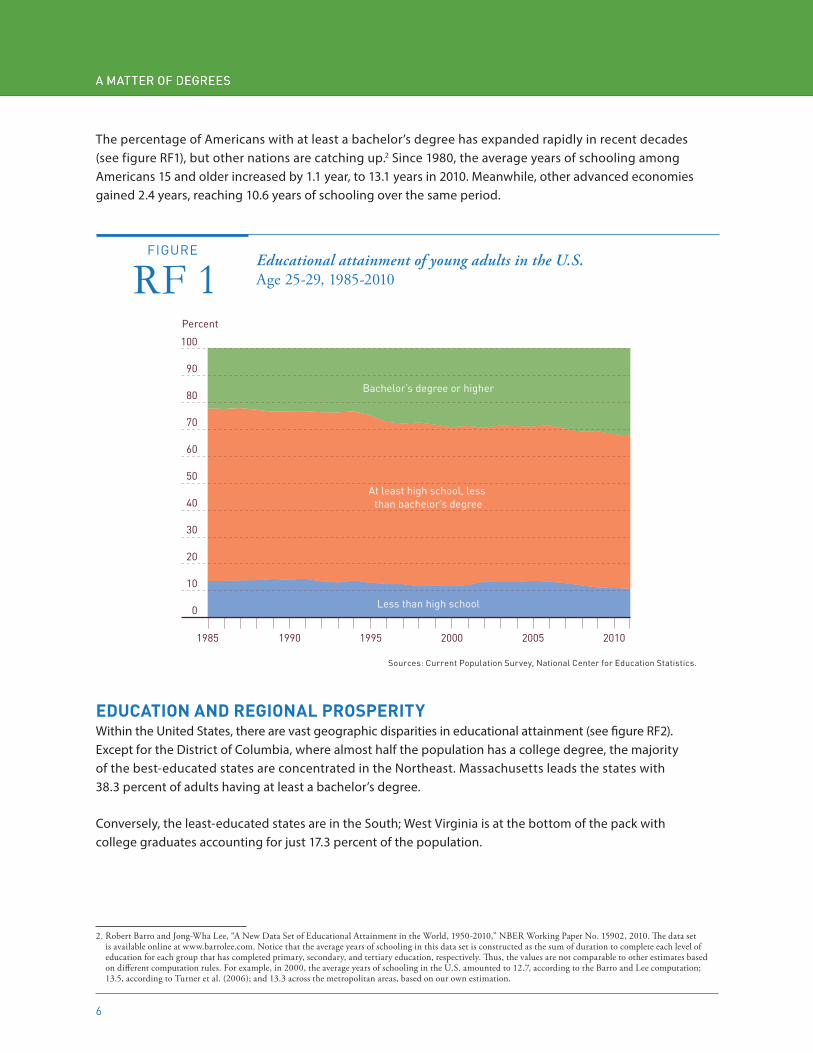
The percentage of Americans with at least a bachelor’s degree has expanded rapidly in recent decades (see figure RF1), but other nations are catching up.2 Since 1980, the average years of schooling among Americans 15 and older increased by 1.1 year, to 13.1 years in 2010. Meanwhile, other advanced economies gained 2.4 years, reaching 10.6 years of schooling over the same period.
FIGURE
RF 1Educational attainment of young adults in the U.S.Age 25-29, 1985-2010
Bachelor’s degree or higher
At least high school, less than bachelor’s degree
Less than high school
100
90
80
70
60
50
40
30
20
10
0
1985 1990 1995 2000 2005 2010
Percent
Sources: Current Population Survey, National Center for Education Statistics.
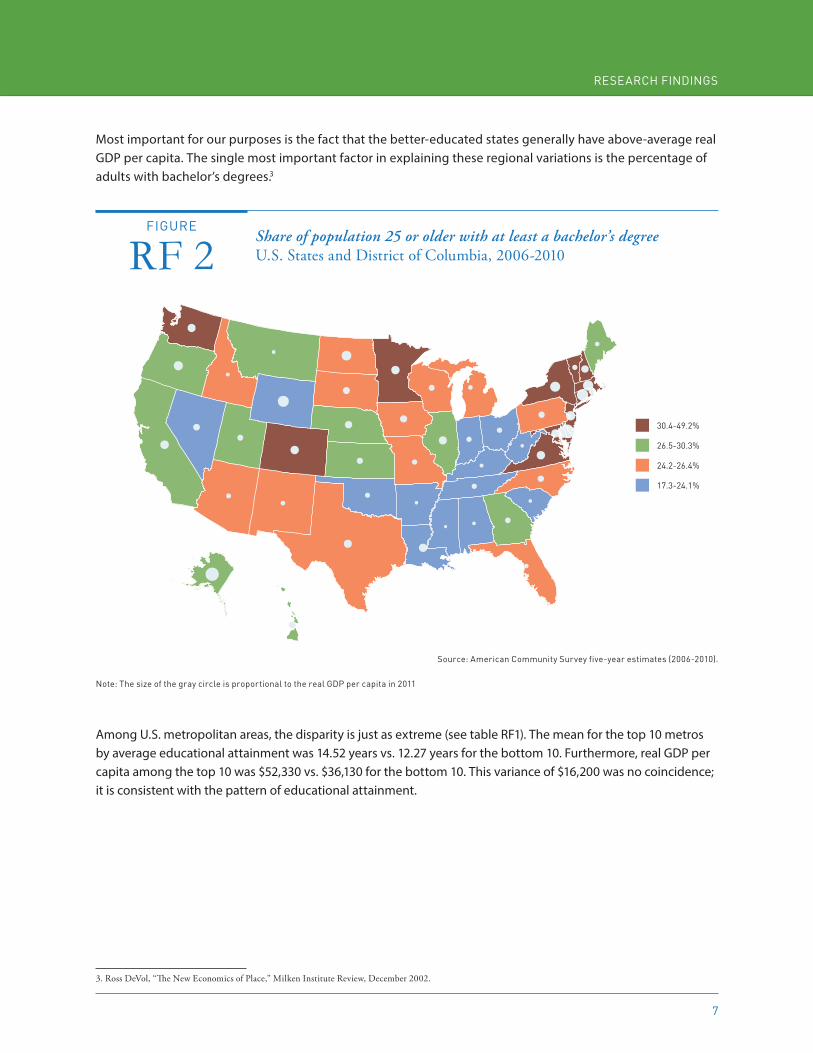
education and regional ProsPerityWithin the United States, there are vast geographic disparities in educational attainment (see figure RF2). Except for the District of Columbia, where almost half the population has a college degree, the majority of the best-educated states are concentrated in the Northeast. Massachusetts leads the states with 38.3 percent of adults having at least a bachelor’s degree.
Conversely, the least-educated states are in the South; West Virginia is at the bottom of the pack with college graduates accounting for just 17.3 percent of the population.
2. Robert Barro and Jong-Wha Lee, “A New Data Set of Educational Attainment in the World, 1950-2010,” NBER Working Paper No. 15902, 2010. The data set is available online at www.barrolee.com. Notice that the average years of schooling in this data set is constructed as the sum of duration to complete each level of education for each group that has completed primary, secondary, and tertiary education, respectively. Thus, the values are not comparable to other estimates based on different computation rules. For example, in 2000, the average years of schooling in the U.S. amounted to 12.7, according to the Barro and Lee computation; 13.5, according to Turner et al. (2006); and 13.3 across the metropolitan areas, based on our own estimation.
7
research findings
Most important for our purposes is the fact that the better-educated states generally have above-average real GDP per capita. The single most important factor in explaining these regional variations is the percentage of adults with bachelor’s degrees.3
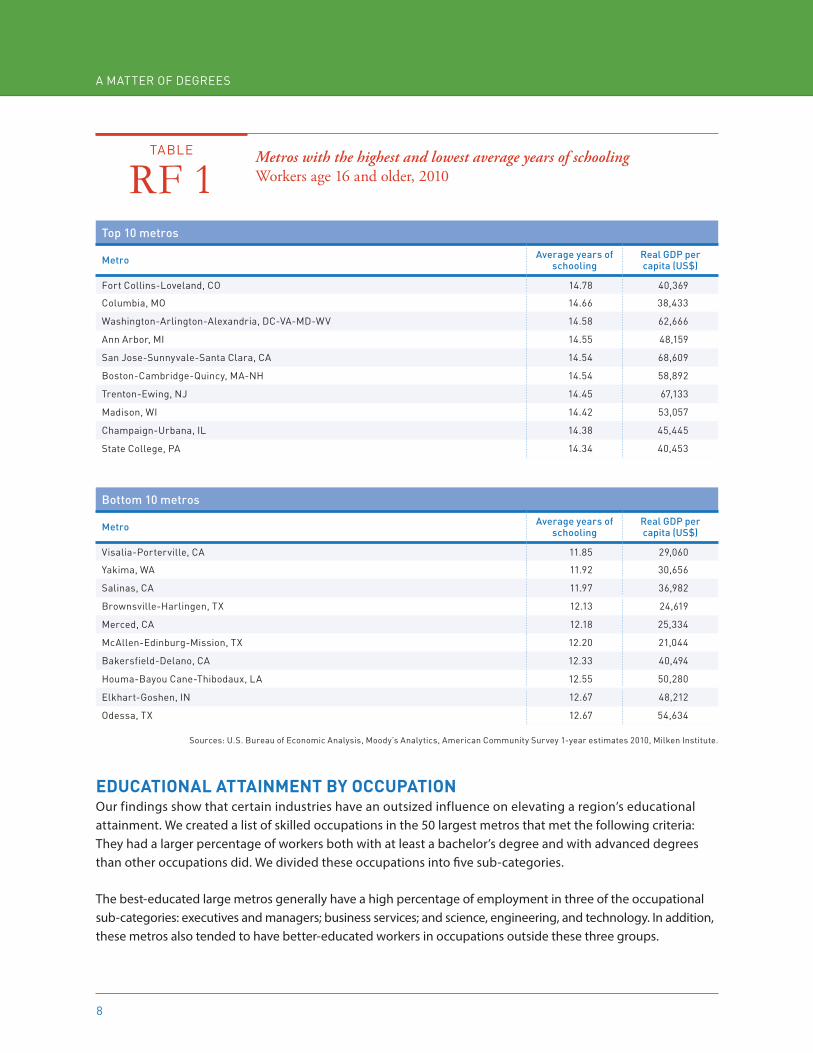
Among U.S. metropolitan areas, the disparity is just as extreme (see table RF1). The mean for the top 10 metros by average educational attainment was 14.52 years vs. 12.27 years for the bottom 10. Furthermore, real GDP per capita among the top 10 was $52,330 vs. $36,130 for the bottom 10. This variance of $16,200 was no coincidence; it is consistent with the pattern of educational attainment.
3. Ross DeVol, “The New Economics of Place,” Milken Institute Review, December 2002.
30.4-49.2%
26.5-30.3%
24.2-26.4%
17.3-24.1%
FIGURE
RF 2Share of population 25 or older with at least a bachelor’s degreeU.S. States and District of Columbia, 2006-2010
Source: American Community Survey five-year estimates (2006-2010).
Note: The size of the gray circle is proportional to the real GDP per capita in 2011
8
A MAtter of Degrees
top 10 metros
Metro Average years of schooling
real gDP per capita (us$)
Fort Collins-Loveland, CO 14.78 40,369
Columbia, MO 14.66 38,433
Washington-Arlington-Alexandria, DC-VA-MD-WV 14.58 62,666
Ann Arbor, MI 14.55 48,159
San Jose-Sunnyvale-Santa Clara, CA 14.54 68,609
Boston-Cambridge-Quincy, MA-NH 14.54 58,892
Trenton-Ewing, NJ 14.45 67,133
Madison, WI 14.42 53,057
Champaign-Urbana, IL 14.38 45,445
State College, PA 14.34 40,453
educational attainment by occuPationOur findings show that certain industries have an outsized influence on elevating a region’s educational attainment. We created a list of skilled occupations in the 50 largest metros that met the following criteria: They had a larger percentage of workers both with at least a bachelor’s degree and with advanced degrees than other occupations did. We divided these occupations into five sub-categories.
The best-educated large metros generally have a high percentage of employment in three of the occupational sub-categories: executives and managers; business services; and science, engineering, and technology. In addition, these metros also tended to have better-educated workers in occupations outside these three groups.
Bottom 10 metros
Metro Average years of schooling
real gDP per capita (us$)
Visalia-Porterville, CA 11.85 29,060
Yakima, WA 11.92 30,656
Salinas, CA 11.97 36,982
Brownsville-Harlingen, TX 12.13 24,619
Merced, CA 12.18 25,334
McAllen-Edinburg-Mission, TX 12.20 21,044
Bakersfield-Delano, CA 12.33 40,494
Houma-Bayou Cane-Thibodaux, LA 12.55 50,280
Elkhart-Goshen, IN 12.67 48,212
Odessa, TX 12.67 54,634
Sources: U.S. Bureau of Economic Analysis, Moody’s Analytics, American Community Survey 1-year estimates 2010, Milken Institute.
TABLE
RF 1Metros with the highest and lowest average years of schoolingWorkers age 16 and older, 2010
9
research findings
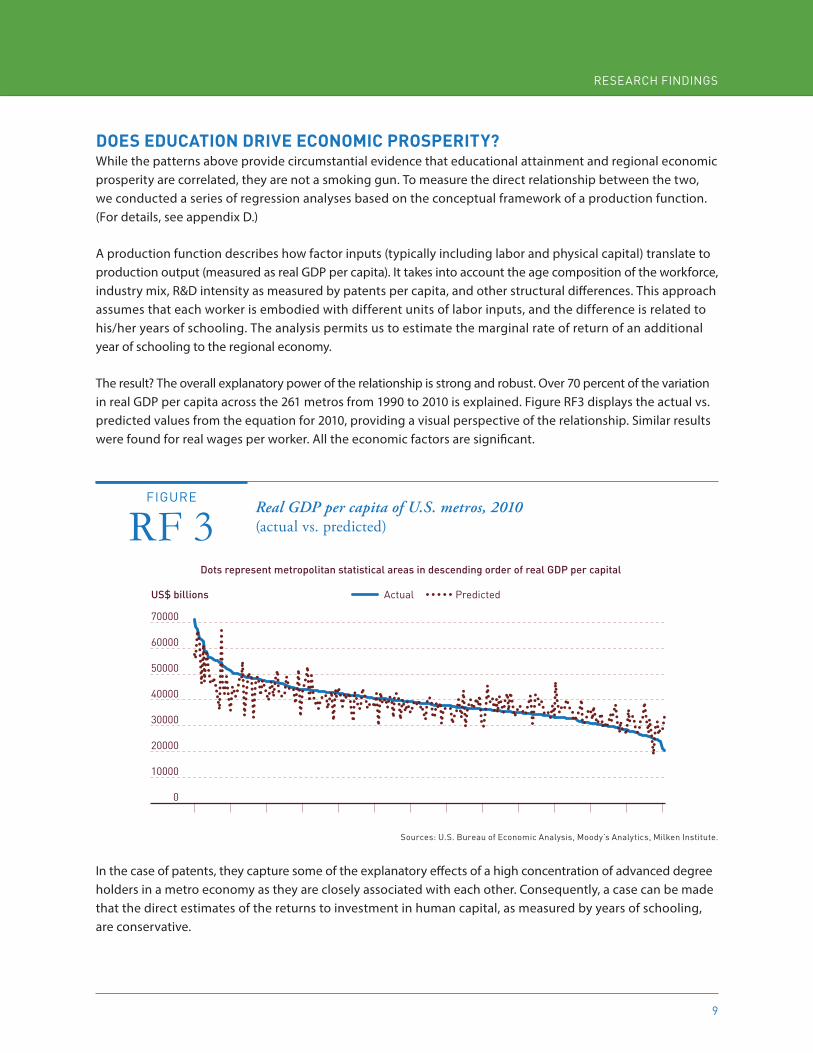
Does eDucation Drive economic ProsPerity? While the patterns above provide circumstantial evidence that educational attainment and regional economic prosperity are correlated, they are not a smoking gun. To measure the direct relationship between the two, we conducted a series of regression analyses based on the conceptual framework of a production function. (For details, see appendix D.)
A production function describes how factor inputs (typically including labor and physical capital) translate to production output (measured as real GDP per capita). It takes into account the age composition of the workforce, industry mix, R&D intensity as measured by patents per capita, and other structural differences. This approach assumes that each worker is embodied with different units of labor inputs, and the difference is related to his/her years of schooling. The analysis permits us to estimate the marginal rate of return of an additional year of schooling to the regional economy.
The result? The overall explanatory power of the relationship is strong and robust. Over 70 percent of the variation in real GDP per capita across the 261 metros from 1990 to 2010 is explained. Figure RF3 displays the actual vs. predicted values from the equation for 2010, providing a visual perspective of the relationship. Similar results were found for real wages per worker. All the economic factors are significant.
0
10000
20000
30000
40000
50000
60000
70000
Actual Predicted
Dots represent metropolitan statistical areas in descending order of real GDP per capital
US$ billions
Sources: U.S. Bureau of Economic Analysis, Moody’s Analytics, Milken Institute.
FIGURE
RF 3Real GDP per capita of U.S. metros, 2010(actual vs. predicted)
In the case of patents, they capture some of the explanatory effects of a high concentration of advanced degree holders in a metro economy as they are closely associated with each other. Consequently, a case can be made that the direct estimates of the returns to investment in human capital, as measured by years of schooling, are conservative.
10
A MAtter of DegreesA MAtter of Degrees
Key FindingsOur analysis clearly demonstrates that a region’s economic fortunes are closely tied to the quality of its workforce. Our major findings are:
----- Education increases regional prosperity: Adding one extra year to the average years of schooling among the employed in a metropolitan area is associated with an increase in real GDP per capita of 10.5 percent and an increase in real wages per worker of 8.4 percent. Take Los Angeles-Long Beach-Santa Ana, CA, for example. If its employed labor force had the same average years of schooling as that of Washington-Arlington-Alexandria, DC-VA-MD-WV, its real GDP per capita in 2010 would have increased to $59,428 from $51,959. A real-life example is Danville, VA. Average years of schooling in the metro rose 1.1 years to 13.18 from 1990 to 2010. This boosted real GDP per capita by 12.2 percent or $3,440 by 2010.
----- Better educated, bigger benefits: The benefits of additional schooling for regional economies are even greater for better-educated workers. Adding one year of schooling to the average educational attainment among employed workers with at least a high school diploma is associated with an increase in real GDP per capita of 17.4 percent and an increase in real wages per worker of 17.8 percent. In contrast, an additional year of education for workers with just nine or 10 years of schooling has little effect on real GDP per capita and real wages per worker. This finding accentuates the importance of investing in post-secondary education.
----- Certain industries lead to higher returns: The returns to investment in education appear to be higher in some industries than in others. Given the same number of average years of schooling among the workforce, the returns to one more year of education are the greatest in metropolitan areas with a large employment share of business and IT services industries, both of which involve high-skilled jobs.
----- Clusters count: A metro’s mix of industries may be a key factor in regional differences in educational attainment within occupations. In metros with clusters of high-skilled occupations (for example, the computer software developers, engineers, and management analysts that tend to gather in a limited number of regions that have clusters of technology), the share of workers holding at least a master’s degree is much higher than in metros without significant clusters. This could be because of the intense competition for employment. We also observed that in these metros skilled occupations are highly concentrated in a handful of major industries. It demonstrates that industry composition is a key factor that contributes to differences in educational attainment within occupations.
Policy recommendationsOur findings provide a compelling argument for strategic investments in higher education to enhance regional economic competitiveness and, by extension, the competitiveness of the U.S. overall. Our policy recommendations for governments, educational institutions, and businesses include:
1. Make higher education more affordable.
----- Governments: Provide financial incentives and support to individuals and institutions to increase educational choice. Governments should further develop educational funding options and incentives such as personal income tax credits, grants, and student loans to help individuals pursue programs that best address their personal learning needs. Federal and local governments should provide adequate financial support to the public higher education system and reduce barriers to private and for-profit educational options.
11
research findings
----- Educational institutions: Increase efficiency to reduce costs and improve affordability. Colleges and universities can do their part to make education more affordable by increasing operational efficiencies through technology and process improvements. Educational institutions should adopt best practices from the business community to increase cost-effectiveness and competitiveness.
----- Businesses: Offer various kinds of financial sponsorship and paid internships. Businesses could contribute to education by providing tuition assistance, scholarships, paid internships, and other types of sponsorships to help students learn the right skills to meet market demands. Microsoft, the Coca-Cola Company, and Edison International all provide significant scholarship funds.4 Companies such as AT&T, Walmart, Verizon, Cisco, and FedEx offer tuition assistance to encourage educational advancement.
2. Make higher education more accessible.
----- Governments: Remove barriers to educational choices. Government policies should promote student choice among diverse types of institutions and programs to meet individual needs. For example, technical and professional certification programs can be effective additions or alternatives to degree programs. To increase access, governments should provide funds to support educational technologies and programs that give students more flexibility and mobility.
----- Educational institutions: Provide flexible formats conducive to adult learning. Educational institutions should use more flexible program options and technology-enriched platforms that facilitate learning anytime, anywhere, especially for part-time students and working adults.
----- Businesses: Encourage employees to advance their education. Businesses should support employees’ professional growth by providing tuition assistance for work-related certifications and degrees. Employers can further encourage education through flexible work hours and rewards for academic progress.
3. Increase higher education graduation rates.
----- Governments: Track dropout rates effectively and minimize obstacles to completion. Governments should develop better tracking systems to identify patterns and causes of dropouts, then act to minimize the obstacles to degree completion. Governments can promote the best practices of colleges and universities with high completion rates to establish guidelines for increasing student success.
----- Educational institutions: Offer effective counseling systems and appropriate credit transfers. Universities and colleges should offer professional counseling and career services to better inform students about educational costs, processes, and job placement, and to help them complete the desired degree on time. Educational institutions could examine their policies on credit transfers to make sure coursework completed at other qualified institutions counts toward a degree.
----- Businesses: Create educational partnerships to demonstrate education’s value. Businesses should partner with educational institutions to provide work-study opportunities, internships, and job-entry programs to reinforce the relevance of education for career success.
4. Microsoft. http://careers.microsoft.com/careers/en/us/internships-scholarships.aspx#tab_urscholarship-1; Coca-Cola Company. www.coca-colacompany.com/citizenship/education.html; Edison International. https://www.scholarshipamerica.org/edisonscholars/ (accessed October 10, 2012).
12
A MAtter of DegreesA MAtter of Degrees
4. Strengthen coordination between higher education institutions and industries.
----- Governments: Promote cooperative educational programs and develop industries that require well-educated workers. Governments should promote work-study and internship programs in the public and private sectors, and should recognize and reward educational institutions that partner with businesses to increase educational and employment opportunities. In addition, local governments should encourage the development of industries that attract highly educated workers.
----- Educational institutions, businesses and industries: Collaborate on career pathway programs and discipline-specific sponsorships. Collaboration between educational institutions and local industries helps develop programs and career pathways to assist students’ transition into careers. Institutions should develop industry-specific certificate programs to promote skill development for specific jobs. Career services, workshops, job shadowing, and internships through business-education partnerships can increase students’ workforce readiness.
5. Promote research and development.
----- Governments: Provide sufficient research and development funds. Successful research and development (R&D) programs depend on highly educated human capital and play a critical role in accelerating economic growth. The federal government needs to provide sufficient basic R&D funding for the nation to be competitive. Making the federal R&D tax credit permanent would help provide some certainty to firms in planning their R&D investment and likely encourage more of it.5 The federal government should also set policies that support “technology transfer”—taking innovations developed by national labs to the industries that can commercialize them.
----- Educational institutions: Collaborate with industries. Educational institutions offer great facilities and experts for R&D, but lack the capacity to commercialize every potential innovation. Educational institutions should actively seek collaborations with industries and communities to transform research innovations into products more efficiently. 6 In addition, institutions should develop a pipeline of qualified graduates to meet the demand for future R&D opportunities in industry.
----- Businesses: Actively initiate innovative projects. The private sector is a large funder of R&D. Businesses should continue to take the lead by actively initiating innovative projects. Also, businesses should cooperate with educational institutions so the academics’ knowledge can be used to amplify economic returns and to ensure a steady pipeline of qualified graduates to meet future R&D needs.
5. Ross DeVol and Perry Wong, “Jobs for America: Investments and Policies for Economic Growth and Competitiveness,” Milken Institute, 2010, pp. 24-31.6. Ross DeVol and Armen Bedroussian, “Mind-to-Market,” Milken Institute, 2006, pp. 3-24.

13
research findings
©2013 Milken InstituteThis work is made available under the terms of the Creative Commons Attribution-NonCommercial-NoDerivs 3.0 Unported License, available at creativecommons.org/licenses/by-nc-nd/3.0/

1250 Fourth StreetSanta Monica, CA 90401Phone: 310-570-4600
E-mail: [email protected] • www.milkeninstitute.org
Washington office:1101 New York Avenue NW, Suite 620Washington, DC 20005Phone: 202-336-8930