Embed Size (px)
Citation preview

TECHNICALREPORTS: METHODS10.1002/2015GC006171
A MATLAB toolbox and Excel workbook for calculatingthe densities, seismic wave speeds, and major elementcomposition of minerals and rocks at pressureand temperatureGeoffrey A. Abers1 and Bradley R. Hacker2
1Department of Earth and Atmospheric Sciences, Cornell University, Ithaca, New York, USA, 2Department of Earth Science,University of California, Santa Barbara, California, USA
Abstract To interpret seismic images, rock seismic velocities need to be calculated at elevated pressureand temperature for arbitrary compositions. This technical report describes an algorithm, software, and datato make such calculations from the physical properties of minerals. It updates a previous compilation andExcelVR spreadsheet and includes new MATLABVR tools for the calculations. The database of 60 mineral end-members includes all parameters needed to estimate density and elastic moduli for many crustal andmantle rocks at conditions relevant to the upper few hundreds of kilometers of Earth. The behavior of aand b quartz is treated as a special case, owing to its unusual Poisson’s ratio and thermal expansion thatvary rapidly near the a-b transition. The MATLAB tools allow integration of these calculations into a varietyof modeling and data analysis projects.
1. Introduction
Seismic imaging provides a wealth of data on the subsurface at many scales primarily by in the form of Pand S wave speeds or their contrasts across interfaces. These data potentially provide information on thecomposition and mineralogy of the crust and mantle, which can vary considerably. The connection betweenseismic wave speeds and composition can be made in at least two ways. First, velocities can be measuredin the laboratory for natural rocks recovered from the field. However, retrogression and alteration ofexposed natural samples tend to reduce their wave speeds relative to the same rocks at depth [Carlson,2014] and accurate pressure and temperature derivatives are required to extrapolate to conditions at depth.Alternatively, seismic velocities can be predicted for any arbitrary rock composition if mineral abundancesare known and mineral elastic properties can be adequately described [e.g., Bina and Helffrich, 1992]. Thelatter approach is taken here.
This technical report updates Hacker and Abers [2004], a Microsoft ExcelVR worksheet, and macro for calculat-ing rock and mineral physical properties at pressure (P) and temperature (T) relevant to the Earth’s crustand mantle. Several improvements have been made to this rock velocity calculator from the 2004 version.First, the calculations have been rewritten as a suite of MATLABVR functions, allowing the user to rapidly con-struct complex calculations and create figures. An optional MATLAB graphical user interface (GUI) allowssimple calculations to be made in a manner suitable for classroom use. Second, the underlying mineraldatabase has been updated to include new mineral-physics data published over the last decade; a moreaccurate model for quartz elasticity is the biggest change. Third, the rock major element composition isnow calculated. Except for quartz, the underlying models of the temperature and pressure sensitivity ofdensity and elastic moduli remain the same, as does the multicomponent mixing approach; the reader isreferred to Hacker and Abers [2004] for specifics. An updated macro and spreadsheet is also included forusers who prefer to use Excel. The Excel spreadsheet continues to be the primary organizational tool for theunderlying mineral elasticity and composition database, and is exported for use by the MATLAB functions.This approach makes it easy for users to update the database and include other minerals as they see fit.
Although this approach has widespread application, it has shortcomings. One obvious limitation is the lackof any anelastic or physical dispersion effects for finite-frequency signals, which can be as important as
Key Points:� MATLAB toolbox and Excel workbook
calculates rock physical properties forany composition� Quartz has complex properties due
to highly unusual properties at thealpha-beta transition� Calculations of rock seismic velocities
from mineralogy can be integratedwith other effects
Supporting Information:� Supporting Information S1� Supporting Information S2
Correspondence to:G. A. Abers,[email protected]
Citation:Abers, G. A., and B. R. Hacker (2016), AMATLAB toolbox and Excel workbookfor calculating the densities, seismicwave speeds, and major elementcomposition of minerals and rocks atpressure and temperature, Geochem.Geophys. Geosyst., 17, 616–624,doi:10.1002/2015GC006171.
Received 4 NOV 2015
Accepted 25 JAN 2016
Accepted article online 28 JAN 2016
Published online 28 FEB 2016
VC 2016. American Geophysical Union.
All Rights Reserved.
ABERS AND HACKER MATLAB AND EXCEL TOOLS FOR ROCK WAVE SPEEDS 616
Geochemistry, Geophysics, Geosystems
PUBLICATIONS

anharmonic effects at mantle adiabatic conditions [Karato, 1993]. Unfortunately, anelasticity is well cali-brated for only a few minerals, principally olivine [e.g., Jackson and Faul, 2010], so we could not systemati-cally include these effects here. It is possible that generalizations of scaling laws may allow extrapolation toother mineral systems [McCarthy et al., 2011], should such extrapolations be sufficiently validated. A secondlimitation is the assumption of isotropy; the reader is referred to a variety of other toolboxes [e.g., Mainprice,1990; Walker and Wookey, 2012] for estimating elasticity in mineral aggregates with sufficient data. Third,these calculations deal with minerals, whereas in many situations, poroelastic effects can be important. Arich literature exists describing the effects of water and melt within pores in calculations of elastic moduli,including recipes and toolboxes for MATLAB [e.g., Mavko et al., 2009; Schmeling et al., 2012]. One advantageof the MATLAB toolbox provided here is that it may be easier to interface with calculations that take intoaccount some of these effects. Fourth, this toolbox includes mineral physics and compositional data foronly a small subset of natural minerals, most of which are end-member compositions. Data for many end-members are missing (e.g., Mn-garnet, K-amphibole, Na-mica, Cr-spinel, and Fe-pumpellyite), meaning thatthe effects of these minerals—in velocities, densities, and rock compositions—are ignored, and the relativeinfluence of other end-members enhanced. The reader is referred to Hacker and Abers [2004] for a discus-sion of other limitations.
We caution the user that this toolbox will calculate elastic properties for any chosen minerals and mineralcompositions, and it does not test whether the mineral assemblage is stable at the specified P and T (exceptfor the a-b quartz transition as discussed below)—or, indeed, at any P and T. This can be of great use, butcaution is warranted. Also, the end-member mineral names in the spreadsheets need not have a 1:1 correla-tion with minerals in rocks, so some understanding of mineral systematics is required. To give two commonexamples, (i) a plagioclase feldspar may contain K2O, in which case that part must be represented in thespreadsheet by orthoclase or sanidine and (ii) an orthopyroxene may contain CaO, in which case that partmust be represented in the spreadsheet by Ca-Tschermak or diopside.
2. Database
The database of thermoelastic properties for 60 minerals is similar to that in Hacker and Abers [2004], withupdated values from the literature, and a half a dozen new minerals. Supporting information Table S1 sum-marizes all of these references. Many recent experiments and ab initio calculations have improved the min-eral database. These new values and the related references are highlighted in red in the Excel spreadsheet,and the related references are noted in supporting information Table S1 by a ‘‘*.’’
3. Quartz
The updated algorithm pays particular attention to quartz because it is a common crustal mineral withunusual elastic properties (e.g., a Poisson’s ratio <0.1 at STP) requiring special treatment. In the lower crustof hot orogenic belts, a quartz should transform to the hexagonal, high-temperature polymorph b quartz[Shen et al., 1993]; the transition from a quartz to b quartz has a remarkable elastic signature [Ohno, 1995]that is expected to be visible in VP or VP/VS measurements [Mainprice and Casey, 1990; Mechie et al., 2004;Kuo-Chen et al., 2012; Sheehan et al., 2014]. As previous studies have emphasized, this elastic signature pro-vides one of the few ways to assess middeep crustal temperatures in active orogenic belts (Figure 1). Inspite of this potential, the elastic properties of quartz have not been measured at high P and high T, suchthat making a concrete link between seismic velocities and the a-b transition is somewhat speculative.
The a-b transition in quartz is a displacive transformation that is reversible at laboratory time scales [Buerger,1951; Keith and Tuttle, 1952; Ghiorso et al., 1979; Raz et al., 2002; Zappone and Benson, 2013]; it is not a recon-structive transformation or net-transfer reaction that requires significant catalysis to operate. Structuralchanges—in atomic positions, amplitudes of atomic vibration, bond angles, and the development ofDauphin�e twins—occur over tens of Kelvin below the transition [Young, 1962] and are mirrored by changesin volume, heat capacity, and elastic behavior [Ghiorso et al., 1979; Carpenter et al., 1998]. The transformationtemperature is affected by impurities, but typically by not more than a few Kelvin [Keith and Tuttle, 1952]. Insummary, the a-b transition is expected to occur in Earth under near-equilibrium conditions. For these rea-sons, the toolbox does not allow the user to specify the quartz polymorph, but calculates which polymorphis stable at the specified pressure and temperature.
Geochemistry, Geophysics, Geosystems 10.1002/2015GC006171
ABERS AND HACKER MATLAB AND EXCEL TOOLS FOR ROCK WAVE SPEEDS 617

The stiffness tensor, Cij, of quartz has been measured at elevated T and 1 atm, and at elevated P and 258C;VP and VS have also been measured in quartzite at elevated P and T. It is uncertain, however, how the valuesof Cij change with increasing P and T—for example, does the temperature dependence of the Cij simplyscale with DT from the a-b equilibrium boundary as the boundary shifts to higher temperature with increas-ing pressure? Below we summarize what is known.
3.1. Effect of Temperature on Quartz ElasticityThe stiffness tensor, Cij, of quartz single crystals has been measured in detail at 1 atm under increasing tem-perature, most recently using rectangular parallelepiped resonance [Ohno et al., 2006] and Brillouin spec-troscopy [Lakshtanov et al., 2007]. At standard temperature and pressure (STP), the bulk and shear moduliare K 5 37.9–38.2 GPa and G 5 44.9 GPa, corresponding to VP 5 6.1 km/s [Ohno et al., 2006; Lakshtanovet al., 2007]; note that K<G, which is quite unusual. The calculated values of the bulk and shear moduli as afunction of temperature differ by <1% between the two techniques—except for a narrow, <258C, intervaljust above the a-b transition, where the derived bulk moduli differ by up to 8%.
In quartz single crystals, the first 3008C of heating beyond STP induces a 3% decrease in VP—similar tosome other minerals. In the next 2008C—approaching the 1 atm a-b transition temperature of 5758C—VP
plummets an additional 14% to reach a minimum of 5.0 km/s [Ohno et al., 2006; Lakshtanov et al., 2007].Inside the b quartz stability field, VP rebounds rapidly with temperature, reaching 7 km/s at 7008C, andthen—in contrast to nearly all other minerals—continues to increase up to at least 10508C [Ohno et al.,2006; Lakshtanov et al., 2007], partly because the thermal expansivity of b quartz is weakly negative [Welcheet al., 1998].
This unusual elastic behavior is also evident in Poisson’s ratio. The calculated Poisson’s ratio for an a quartzcrystal is very unusual at STP—0.08 (VP/VS 5 1.48)—but gets even stranger with increasing temperature,reaching a minimum of 20.27 (VP/VS 5 1.27) at �5708C, just below the a-b transition. At temperaturesabove the a-b transition, quartz starts to behave more normally, and by 7008C at 1 atm, b quartz approachesa typical Poisson solid (VP/VS 5 1.72). Novaculites (fine-grained quartzose rocks) display similarly unusualbehavior across the a-b transition, indicating that the behavior is not unique to single crystals [McKnight
Figure 1. Predicted quartz properties across the a-b quartz transition along a hot (red) and moderate (blue) continental geotherm. Geotherms calculated for exponentially decayingcrustal heat production with depth [Turcotte and Schubert, 2002] for a 20 km e-folding production depth, mantle heat input of 20 mW/m2, thermal conductivity of 2.5 W m21 K21, andsurface heat flow of 90 or 120 mW m2. (a) VP or VS velocity as labeled. (b) VP/VS ratio; VP/VS 5 1.414 corresponds to a Poisson’s ratio of zero. (c) Impedance as product of VP and density,changes in which scale to reflection amplitude. (d) Geotherms used for the two models, labeled with surface heat flow (mW m22) along with a-b quartz transition (dashed).
Geochemistry, Geophysics, Geosystems 10.1002/2015GC006171
ABERS AND HACKER MATLAB AND EXCEL TOOLS FOR ROCK WAVE SPEEDS 618

et al., 2008]; in novaculite and quartzite, the magnitude of the changes is muted (relative to single crystals)by the different orientations of the grains.
3.2. Effect of Pressure on Quartz ElasticityThe pressure dependence of the bulk modulus has been measured in quartz single crystals compressed in adiamond-anvil cell using X-ray diffraction [Angel et al., 1997], and the complete stiffness tensor, Cij, of quartzhas been measured in a hydraulic press to 1 GPa using ultrasonic travel times [Calderon et al., 2007] and byBrillouin spectroscopy along with the pressure derivatives [Wang et al., 2014]. Cij have also been calculatedat high pressure using density functional theory [Kimizuka et al., 2007]. These methods obtained slightlydifferent results, but the 1 GPa values for the bulk modulus for all the studies are relatively similar—40.4[Calderon et al., 2007], 41.3 GPa [Angel et al., 1997; Kimizuka et al., 2007], and 43.4 GPa [Wang et al., 2014].
Experiments have also been conducted on quartzite at 258C and pressures to 1 GPa using the pulse-transmission technique [Christensen, 1965, 1966, 1996; Musacchio et al., 1997]. The application of modestpressure is required to close cracks in polycrystalline materials; measured elastic properties above �200MPa show the expected linear dependence on pressure [Christensen, 1965; Kern et al., 2008].
3.3. Effect of Pressure and Temperature on Quartz ElasticityThere has been minimal investigation of the elastic properties of quartz at high pressure and tempera-ture—in fact, 0.2 GPa is the highest pressure at which elevated-temperature measurements have beendone, and only on quartzite [Fielitz, 1971; Christensen, 1979; Kern, 1979; Lu and Jackson, 1998]. At 0.2 GPa,thermally induced cracks in quartzite are closed [e.g., Lu and Jackson, 1998], and the a-b transition induces areduction in VP [Fielitz, 1971; Christensen, 1979; Kern, 1979] identical to that seen in quartz single crystals.One set of experiments on a metasedimentary rock with 36% quartz demonstrated that the acousticchanges associated with the a-b transition at 1 atm are also seen at temperatures appropriate for the a-btransition pressures of 200–400 MPa [Zappone and Benson, 2013].
3.4. SummaryNone of this unusual elastic behavior of quartz is well fit by the standard thermal expansion models usedfor other minerals. For these reasons, the algorithm included in this toolbox handles the elastic propertiesof a and b quartz independently from the primary calculation framework used for other minerals [Hackerand Abers, 2004], through a series of functional regressions on density, bulk, and shear modulus data(Figure 1). We assume, after Zappone and Benson [2013], that the elastic behavior of the a-b transition atelevated pressure is identical to that at 1 atm. Specifically, we assume that the temperature dependences ofthe elastic properties scale with the difference in temperature from the a-b transition, matching Ohno et al.[2006] at zero pressure and shifting to higher temperatures as the transition temperature increases withpressure [Shen et al., 1993]. The elastic moduli also increase with pressure as indicated by variable-pressurestudies at room temperature [Angel et al., 1997; Calderon et al., 2007; Kimizuka et al., 2007; Wang et al.,2014]; we assume that the pressure variations are independent of temperature except in defining the tem-perature of the a-b transition. These assumptions remain to be tested by experiments—beyond Zapponeand Benson [2013]—that measure the elastic properties of quartz at elevated P and T.
4. Excel Workbook
The Excel workbook is similar to the 2004 version, with the following changes: (a) the mineral-physics datain the ‘‘database’’ sheet has been updated, (b) the bulk-rock major element composition is now calculatedand reported in the ‘‘rocks’’ page, and (c) more accurate elastic properties of quartz are now calculated inthe code. Supporting information Table S1 describes codes for all references from which properties arederived, and supporting information Table S2 lists notes on database parameters not described previously[Hacker and Abers, 2004]. The workbook was tested under Microsoft Excel 2003 and 2010 for Windows.
5. Using the MATLAB Toolbox
To use the MATLAB toolbox, place the directory containing all.m code files and.txt database tables on yourMATLAB search path, e.g., via the ‘‘addpath’’ function. In the compressed supporting information file
Geochemistry, Geophysics, Geosystems 10.1002/2015GC006171
ABERS AND HACKER MATLAB AND EXCEL TOOLS FOR ROCK WAVE SPEEDS 619

distributed with this paper, this directory is called ‘‘ABERSHACKER16.’’ All of the files are described belowand summarized in Table 1. The codes were tested under MATLAB 2014a.
5.1. Data FilesThe distribution file includes the following data tables in plain-text format:
A. AbersHackerMacroJan2016.txtB. mindict_AbersHackerMacroJan2016.txt
The first file compiles the elasticity and thermodynamic data for each mineral, whereas the second includesa dictionary of mineral names and compositions, and a suite of model rock compositions. Both can beregenerated from the Excel spreadsheets if the user changes the primary values in the spreadsheets. To doso, open Excel and save (i) the ‘‘database’’ worksheet and (ii) the ‘‘rock mineral modes’’ worksheet, as ‘‘sepa-rate files of Windows Formatted Text (.txt).’’ The filenames can be changed, although the second filenamemust be the same as the first with ‘‘mindict_’’ prepended. As a caution, we found that Excel only exportsnumerical values to text files at the precision shown on the screen, so that severe roundoff errors can occurduring generation of text files with insufficient precision. To generate the.txt tables provided here, we savedtables with six digits after the decimal for elastic moduli and oxide weights and with four digits for mostother parameters, leading to consistency between Excel and MATLAB calculations better than one partin 1026.
5.2. MATLAB Function FilesThe MATLAB code distributed in the supporting information data includes the following MATLAB functions.The exact syntax for each can be obtained from standard help commands, and the comments at the startof each file.
A. ah16_loaddb.m: this function reads the two data files and creates MATLAB structures for use else-where. The input parameter is the filename of the primary thermoelastic database. Files are firstsearched for in the user’s current directory, and then in the directory where this routine is located (e.g.,ABERSHACKER16). Output includes a structure ‘‘minpropar’’ with physical properties for each mineraland a structure ‘‘compar’’ with compositional data for each mineral; both are keyed to a 2–5 letter codefor each mineral. Optional output includes ‘‘mindict’’ a dictionary providing an explanation of themineral code (full name, composition, and mineral family), and tables of model rock compositions‘‘rocknames’’ and ‘‘rockmodes’’ providing a short name and mineral modes for those compositions.Unless otherwise stated, these rock names and modes correspond to the mafic and ultramafic composi-tions described in Hacker et al. [2003].
B. ah16_minervel.m: calculates elastic properties for a single mineral at elevated T and P. Input parame-ters are T, P, and a MATLAB structure of mineral properties of the same form as minpropar above, but forone mineral. Quartz is handled by an internal function in this file. Outputs include scalar density, elasticmoduli, and velocities for the mineral at the specified P and T.
C. ah16_rockvel.m: calculates physical properties for a mineral composite (rock) at elevated tempera-ture and pressure. Input parameters are T, P, the minpropar structure, and a list of minerals and theirmodal abundances in the rock of interest. Creates a structure with the elastic moduli, velocities, and
Table 1. Functions, Files, and Databases
File Description
ah16_loaddb.m Loads database files into MATLAB structuresah16_minervel.m Calculates properties for all minerals at P, Tah16_rockvel.m Calculates physical properties for composites (rocks)ah16_rockcomp.m Major element compositions for rocksah16_hsvbounds.m Hashin-Shtrikman-Walpole bounds on elastic moduliah16_guidriver.m Creates graphical user interfacerockvelcalculate.m Example script demonstrating calculationstest_quartz.m Example script that created Figure 1AbersHackerMacroJan2016.xls Excel spreadsheetAbersHackerMacroJan2016.txt Thermal-elastic databasemindict_AbersHackerMacroJan2016.txt Mineral names and rock compositions
Geochemistry, Geophysics, Geosystems 10.1002/2015GC006171
ABERS AND HACKER MATLAB AND EXCEL TOOLS FOR ROCK WAVE SPEEDS 620

Figure 2. Snapshot of the GUI.
Geochemistry, Geophysics, Geosystems 10.1002/2015GC006171
ABERS AND HACKER MATLAB AND EXCEL TOOLS FOR ROCK WAVE SPEEDS 621
densities for the rock at the specified P and T, as well as structures with Hashin-Shtrikman bounds andVoigt-Reuss bounds on elasticity. Optionally, this routine also calculates major element oxide abundan-ces (wt %).
D. ah16_rockcomp.m: calculates the major element compositions for a rock. The input is an array of min-eral compositions (i.e., compar from ah16_loaddb) and an array of mineral modal abundances in vol%. Output is a structure like compar with aggregate rock composition as wt % oxides. Primarily usedthrough calls to ah16_rockvel.
E. ah16_hswbounds.m: calculates the Hashin-Shtrikman-Walpole bounds on the elastic moduli of a com-posite material [Berryman, 1995]. Primarily used through calls to ah16_rockvel.
5.3. MATLAB GUIThe function ‘‘ah16_guidriver.m’’ generates a simple graphical user interface (GUI) to allow quick calcula-tion for a single rock (Figure 2). To use the calculator, enter P (GPa) and T (8C), enter the volume-fraction modeof each mineral in the ‘‘Mode’’ column, and press the ‘‘Go’’ button. The calculated physical properties (density,moduli, wave speeds, Poisson’s ratio, and major element composition) appear in tables. Clicking on a mineralcode in the left column of the ‘‘Mineral Mode’’ table generates a popup showing the full mineral name,chemical formula, and mineral family. The ‘‘Min. Dict.’’ button provides the same information for all miner-als. The ‘‘Sum:’’ textbox at the bottom of the ‘‘Mineral Mode’’ table shows the sum of the mineral modes;these are renormalized to 100% prior to calculation. The ‘‘Rock Menu’’ button allowing users to select mineralmodes for a predefined rock composition from the ‘‘mindict’’ table; users can add frequently used rocks ascolumns to this table. Data in the output tables can be copied and pasted into other windows or applications.
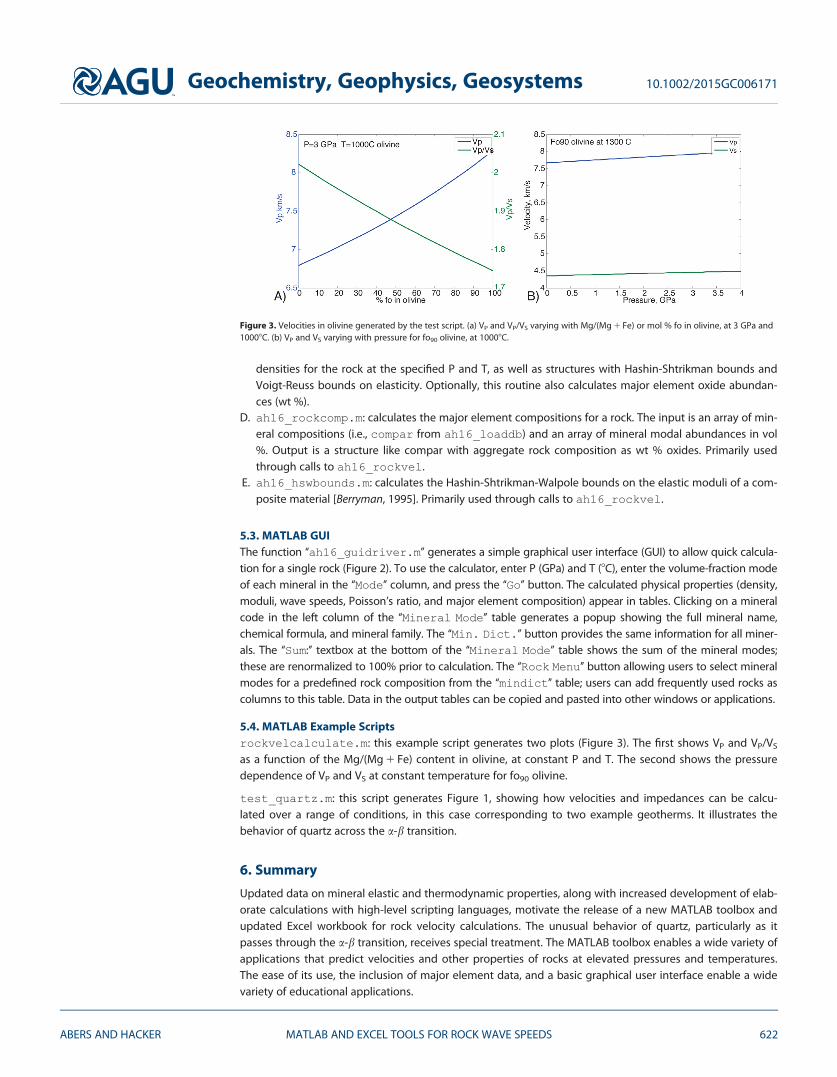
5.4. MATLAB Example Scriptsrockvelcalculate.m: this example script generates two plots (Figure 3). The first shows VP and VP/VS
as a function of the Mg/(Mg 1 Fe) content in olivine, at constant P and T. The second shows the pressuredependence of VP and VS at constant temperature for fo90 olivine.
test_quartz.m: this script generates Figure 1, showing how velocities and impedances can be calcu-lated over a range of conditions, in this case corresponding to two example geotherms. It illustrates thebehavior of quartz across the a-b transition.
6. Summary
Updated data on mineral elastic and thermodynamic properties, along with increased development of elab-orate calculations with high-level scripting languages, motivate the release of a new MATLAB toolbox andupdated Excel workbook for rock velocity calculations. The unusual behavior of quartz, particularly as itpasses through the a-b transition, receives special treatment. The MATLAB toolbox enables a wide variety ofapplications that predict velocities and other properties of rocks at elevated pressures and temperatures.The ease of its use, the inclusion of major element data, and a basic graphical user interface enable a widevariety of educational applications.
Figure 3. Velocities in olivine generated by the test script. (a) VP and VP/VS varying with Mg/(Mg 1 Fe) or mol % fo in olivine, at 3 GPa and10008C. (b) VP and VS varying with pressure for fo90 olivine, at 10008C.
Geochemistry, Geophysics, Geosystems 10.1002/2015GC006171
ABERS AND HACKER MATLAB AND EXCEL TOOLS FOR ROCK WAVE SPEEDS 622

ReferencesAngel, R. J., D. R. Allan, R. Miletich, and L. W. Finger (1997), The use of quartz as an internal pressure standard in high-pressure crystallogra-
phy, J. Appl. Crystallogr., 30, 461–466.Berryman, J. G. (1995), Mixture theories for rock properties, in Rock Physics and Phase Relations: AGU Reference Shelf, vol. 3, edited by
T. J. Ahrens, pp. 205–228, AGU, Washington, D. C.Bina, C. R., and G. R. Helffrich (1992), Calculation of elastic properties from thermodynamic equation of state principles, Annu. Rev. Earth
Planet. Sci., 20, 527–552.Buerger, M. J. (1951), Crystallographic aspects of phase transformations, in Phase Transformations in Solids, edited by R. Smoluchowski,
J. E. Mayer and W. A. Weyl, pp. 183–211, Wiley, N. Y.Calderon, E., M. Gauthier, F. Decremps, G. Hamel, G. Syfosse, and A. Polian (2007), Complete determination of the elastic moduli of
a-quartz under hydrostatic pressure up to 1 GPa: An ultrasonic study, J. Phys. Condens. Matter, 19, 436228, doi:10.1088/0953-8984/19/43/436228.
Carlson, R. L. (2014), The effects of alteration and porosity on seismic velocities in oceanic basalts and diabases, Geochem. Geophys.Geosyst., 15, 4589–4598, doi:10.1002/2014GC005537.
Carpenter, M. A., E. K. H. Salje, A. Graeme-Barber, B. Wruck, M. T. Dove, and K. S. Knight (1998), Calibration of excess thermodynamic proper-ties and elastic constant variations associated with the a$ b phase transition in quartz, Am. Mineral., 83, 2–22.
Christensen, N. I. (1965), Compressional wave velocities in metamorphic rocks at pressures to 10 kilobars, J. Geophys. Res., 70, 6147–6164.Christensen, N. I. (1966), Shear wave velocities in metamorphic rocks at pressures to 10 kilobars, J. Geophys. Res., 71, 3549–3556.Christensen, N. I. (1979), Compressional wave velocities in rocks at high temperatures and pressures, critical thermal gradients, and crustal
low-velocity zones, J. Geophys. Res., 84, 407–412.Christensen, N. I. (1996), Poisson’s ratio and crustal seismology, J. Geophys. Res., 101, 3139–3156.Fielitz, K. (1971), Elastic wave velocities in different rocks at high pressure and temperature up to 7508C, Z. Geophys., 37, 943–956.Ghiorso, M. S., I. S. E. Carmichael, and L. K. Moret (1979), Inverted high-temperature quartz unit cell parameters and properties of the a-b
inversion, Contrib. Mineral. Petrol., 68, 307–323.Hacker, B. R., and G. A. Abers (2004), Subduction factory 3. An Excel worksheet and macro for calculating the densities, seismic wave
speeds, and H2O contents of minerals and rocks at pressure and temperature, Geochem. Geophys. Geosyst., 5, Q01005, doi:10.1029/2003GC000614.
Hacker, B. R., G. A. Abers, and S. M. Peacock (2003), Subduction factory 1: Theoretical mineralogy, density, seismic wavespeeds, and H2Ocontent, J. Geophys. Res., 108(B1), 2029, doi:2010.1029/2001JB001127.
Jackson, I., and U. H. Faul (2010), Grainsize-sensitive viscoelastic relaxation in olivine: Toward a robust laboratory-based model for seismo-logical application, Phys. Earth Planet. Inter., 183, 151–163.
Karato, S. (1993), Importance of anelasticity in the interpretation of seismic tomography, Geophys. Res. Lett., 20, 1623–1626.Keith, M. L., and O. F. Tuttle (1952), Significance of variation in the high-low inversion of quartz, Am. J. Sci., Bowen Volume, 203–280.Kern, H. (1979), Effect of high-low quartz transition on compressional and shear wave velocities in rocks under high pressure, Phys. Chem.
Miner., 4, 161–171.Kern, H., T. I. Ivankina, A. N. Nikitin, T. Lokaj�ıcek, and Z. Pros (2008), The effect of oriented microcracks and crystallographic and shape pre-
ferred orientation on bulk elastic anisotropy of a foliated biotite gneiss from Outokumpu, Tectonophysics, 457, 143–149.Kimizuka, H., S. Ogata, J. Li, and Y. Shibutani (2007), Complete set of elastic constants of a-quartz at high pressure: A first-principles study,
Phys. Rev. B, 75, 054109.Kuo-Chen, H., F. T. Wu, D. M. Jenkins, J. Mechie, S. W. Roecker, C.-Y. Wang, and B.-S. Huang (2012), Seismic evidence for the a-b quartz tran-
sition beneath Taiwan from Vp/Vs tomography, Geophys. Res. Lett., 39, L22302, doi:10.1029/2012GL053649.Lakshtanov, D. L., S. V. Sinogeikin, and J. D. Bass (2007), High-temperature phase transitions and elasticity of silica polymorphs, Phys. Chem.
Miner., 34(1), 11–22.Lu, C., and I. Jackson (1998), Seismic-frequency laboratory measurements of shear mode viscoelasticity in crustal rocks II: Thermally
stressed quartzite and granite, Pure Appl. Geophys., 153, 441–473.Mainprice, D. (1990), A FORTRAN program to calculate seismic anisotropy from the lattice preferred orientation of minerals, Comput.
Geosci., 16, 385–393.Mainprice, D., and M. Casey (1990), The calculated seismic properties of quartz mylonites with typical fabrics: Relationship to kinematics
and temperature, Geophys. J. Int., 103, 599–608.Mavko, G., T. Mukerji, and J. Dvorkin (2009), The Rock Physics Handbook: Tools for Seismic Analysis of Porous Media, 2nd ed., Cambridge
Univ. Press, N. Y.McCarthy, C., Y. Takei, and T. Hiraga (2011), Experimental study of attenuation and dispersion over a broad frequency range: 2. The univer-
sal scaling of polycrystalline materials, J. Geophys. Res., 116, B09207, doi:10.1029/2011JB008384.McKnight, R. E. A., T. Moxon, A. Buckley, P. A. Taylor, T. W. Darling, and M. A. Carpenter (2008), Grain size dependence of elastic anomalies
accompanying the a-b phase transition in polycrystalline quartz, J. Phys. Condens. Matter, 20, 075229, doi:10.1088/0953-8984/20/7/075229.
Mechie, J., S. V. Sobolev, L. Ratschbacher, A. Y. Babeyko, G. Bock, A. G. Jones, K. D. Nelson, K. D. Solon, L. D. Brown, and W. Zhao (2004),Precise temperature estimation in the Tibetan crust from seismic detection of the alpha-beta quartz transition, Geology, 32(7), 601–604,doi:10.1130/g20367.1.
Musacchio, G., W. D. Mooney, J. H. Luetgert, and N. I. Christensen (1997), Composition of the crust in the Grenville and Appalachian Provin-ces of North America inferred from Vp/Vs ratios, J. Geophys. Res., 102, 15,225–15,241.
Ohno, I. (1995), Temperature variation of elastic properties of a-quartz up to the a-b transition, J. Phys. Earth, 43, 157–169.Ohno, I., K. Harada, and C. Yoshitomi (2006), Temperature variation of elastic constants of quartz across the a-b transition, Phys. Chem.
Miner., 33, 1–9.Raz, U., S. Girsperger, and A. B. Thompson (2002), Thermal expansion, compressibility and volumetric changes of quartz obtained by single
crystal dilatometry to 7008C and 3.5 kilobars (0.35 GPa), Schweiz. Mineral. Petrogr. Mitt., 82, 561–574.Schmeling, H., J. P. Kruse, and G. Richard (2012), Effective shear and bulk viscosity of partially molten rock based on elastic moduli theory
of a fluid filled poroelastic medium, Geophys. J. Int., 190, 1571–1578, doi:10.1111/j.1365-246X.2012.05596.x.Sheehan, A. F., T. L. de la Torre, G. Monsalve, G. A. Abers, and B. R. Hacker (2014), Physical state of Himalayan crust and uppermost mantle:
Constraints from seismic attenuation and velocity tomography, J. Geophys. Res. Solid Earth, 119, 567–580, doi:10.1002/2013JB010601.
AcknowledgmentsThis work was funded by NSF awardOCE-1446970 (G.A.) and EAR-1249703(B.H.). All data used in this paper aretaken from the references listed insupporting information Table S1. Wethank the Associate Editor, C.-T. Lee,and the reviewer, M. Behn, for theirconstructive comments andsuggestions. MATLAB is a registeredtrademark of The MathWorks, Inc.Excel is a registered trademark ofMicrosoft, Inc.
Geochemistry, Geophysics, Geosystems 10.1002/2015GC006171
ABERS AND HACKER MATLAB AND EXCEL TOOLS FOR ROCK WAVE SPEEDS 623

Shen, A. H., W. A. Bassett, and I. M. Chou (1993), The alpha-beta quartz transition at high temperatures and pressures in a diamond-anvilcell by laser interferometry, Am. Mineral., 78(7–8), 694–698.
Turcotte, D., and G. Schubert (2002), Geodynamics, 456 pp., edited, Cambridge Univ. Press, N. Y.Walker, A. M., and J. Wookey (2012), MSAT—A new toolbox for the analysis of elastic and seismic anisotropy, Comput. Geosci., 49, 81–90.Wang, J., Z. Mao, F. Jiang, and T. S. Duffy (2014), Elasticity of single-crystal quartz to 10 GPa, Phys. Chem. Miner., 42, 203–212.Welche, P. R. L., V. Heine, and M. T. Dove (1998), Negative thermal expansion in beta-quartz, Phys. Chem. Miner., 26, 63–77.Young, R. A. (1962), Mechanism of the Phase Transition in Quartz, final report, 156 pp., Report No. AD276235, Air Force Off. Sci. Res., Wash-
ington, D. C.Zappone, A. S., and P. M. Benson (2013), Effect of phase transitions on seismic properties of metapelites: A new high-temperature labora-
tory calibration, Geology, 41, 463–466.
Geochemistry, Geophysics, Geosystems 10.1002/2015GC006171
ABERS AND HACKER MATLAB AND EXCEL TOOLS FOR ROCK WAVE SPEEDS 624