Embed Size (px)
Citation preview
A MATERIALS MANAGEMENT INFORMATION SYSTEM
(MMIS) IN A STEEL INDUSTRY - A CASE STUDY
By
MARGARETHA SUSANNA VAN DER WALT
MINI THESIS
submitted in partial fulfillment of the requirements for the degree
MAGISTER INGENERIAE
in
ENGINEERING MANAGEMENT
at the
RAND AFRIKAANS UNIVERSITY
Supervisor: Prof L Pretorius
NOVEMBER 1998
Summary
Purchasing/procurement, materials management, supply chain management and logistics are
strategic elements linking customer requirements with the possibilities of the market. Purchasing is
establishing itself as a center of competence for the strategic alliances and development
partnerships with suppliers, for the continual process of improvement and for strategic cost
management in product development.
Materials Management within the Steel Industry is primarily concerned with the planning,
acquisition, conversion, flow, and distribution of raw materials to finished goods. Through the use of
Materials Management techniques, a company can initiate cost reduction programs. These can
include lower stock levels, reduction in number of vendors used, better quality of goods used,
integration of supply chain into company's own value chain, etc.
As such, it is important to have an integrated, supporting information system, which can supply
valid, up-to-date information as and when required. This thesis investigates whether it is necessary
or more advantageous to buy a ready-to-use system, or to write a custom system, to fulfil the before
mentioned requirement.
New technologies create the opportunity to do business more effectively. Managers must however,
take responsibility for participating in the planning and design of the information systems. Many
computer-generated reports are designed to enable managers to keep track of day-to-day
operations and to monitor the use of resources. Through effective design these reports can help
manage not only the use of resources, but also the total cost of ownership.
Decision support systems are designed to support semi-structured and unstructured decisions in
situations in which information is incomplete. They are developed to support decisions that are so
different each time that it would be hard to develop a standard set of procedures for programming
them. Such decisions may be specific and may relate to a one-time-only situation. A decision
support system should enable the decision-maker to apply the right decision rule to a problem,
rather than using standard rules that may not apply because of changing conditions.

In order to link the process to the Steel Industry, a short summary was given of current economic
trends and forecasts for the rest of the year.
A system was designed by using Microsoft Access 97. This package ensures readily available
support form Microsoft and is not unduly expensive. The system provides for information to be
stored in a database, with access to various reports and graphs. All of the main activities and
functions of Materials Management was incorporated into the system. The ready-to-use system
compared to the above mentioned one is SAP, and specifically the LIS module.
The impact of this investigation is that the outcome may influence future decisions regarding
whether to buy any commercially available software packages, or to write a custom system
reflecting the unique characteristics found in any business environment.
Through following the business research process, measurement instruments were designed, as well
as the appropriate scales, sampling methods and sample size. It was decided to use a
questionnaire to test the custom written system within Materials Management, at a Steel center.
After a sample group tested the custom software system and completed the questionnaires, the
information was summarised. The most important conclusion is that while the smaller, custom
written system is not ideally suited for every application within a larger company, it will be ideal for a
smaller company. Ease of adaptation and the financial impact also influences the final decision,
where the easier to adapt, 'cheaper' custom system is more suitable to a small company.
Finally, although certain rough conclusions can be drawn from this study, it is necessary to do a
more detailed investigation, using a larger sample group, to ascertain whether buying decisions in
larger companies should be rethought, in any case as far as expensive software systems are
concerned.
TABLE OF CONTENTS
Summary
Chapter one Introduction
Chapter two Materials Management 3
2.1 Primary Function 3
2.2 Reducing Costs through Materials Management 5
2.3 The Supply Chain 6
2.4 Commodity Management within Materials Management 8
2.5 Conclusion 10
Chapter three Information Systems 11
3.1 How Information Technology Supports Business Activities 11
3.2 A Managers View of Information Systems 14
3.3 Managerial Decision Support Systems 18
3.4 Systems Development Life Cycle 19
3.5 Systems Planning 21
3.6 Systems Analysis 26
3.7 Systems Design 30
3.8 Systems Implementation 32
3.9 Systems Support 34
3.10 Conclusion 35
Chapter four Characteristics of the Steel Industry 36
4.1 Basic Iron and Steel Industry 36
4.2 Structural Metal Industry 36
4.3 Prospects For the Local Steel Market 37
4.4 South African Steel Imports 37
4.5 Domestic Market 37
4.6 International Market 38
4.7 Conclusion 38
Chapter five Business Research 40
5.1 The Nature of Research 40
5.2 Measurement 41
5.3 Data Collection 47
5.4 Conclusion 51
Chapter six Case Study 52
6.1 Opportunity 52
6.2 Project Scope and Exclusions 54
6.3 Definition of Solution 54
6.4 Systems Benefits 55
6.5 Systems Risks and Concerns 56
6.6 Impact and Dependencies 57
6.7 Key Assumptions 58
6.8 Systems Diagrams 58
6.9 Programming Reports 58
6.10 Conclusion 59

Chapter seven Case Study Results 60
7.1 The Management Question 60
7.2 The Research Question 61
7.3 The Investigative Question 63
7.4 The Measurement Question 64
7.5 Further Comments 64
7.6 Conclusion 65
Chapter eight Conclusion 66
Chapter nine Bibliography 68
LIST OF FIGURES
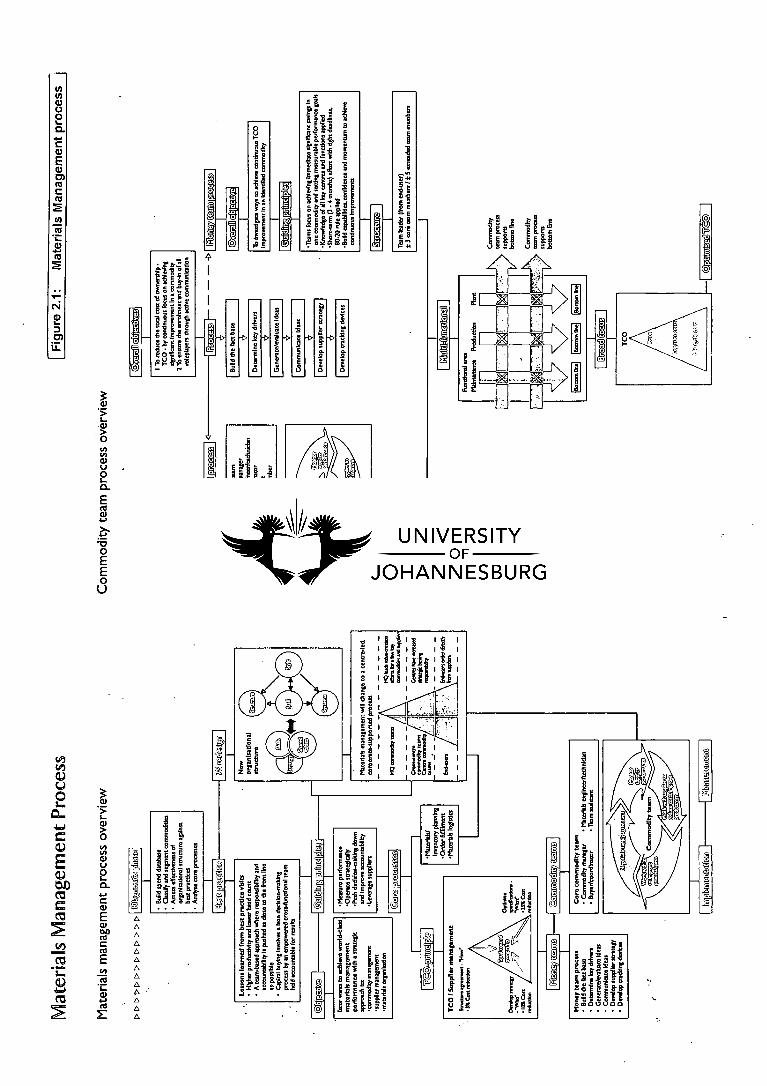
Figure 2.1: Materials Management process
Figure 3.1: Value activities
Figure 3.2: Support activities
Figure 3.3: The value system
Figure 3.4: Activities of an organisation
Figure 3.5: A Framework for information systems
Figure 3.6: A summary of characteristics of information systems
Figure 3.7: Types of decisions and decision structure
Figure 3.8: Types of analysis in decision support systems
Figure 3.9: The classical and modern SDLF
Figure 3.10: Life cycle diagram of Systems Planning
Figure 3.11: Study phase activities
Figure 3.12: Context model
Figure 3.13: Problem/opportunity survey matrix
Figure 3.14: Systems models (p273 &283)
Figure 6.1: Process flow chart
Figure 7.1: Representation of response to management question
Figure 7.2: Distribution of opinions on SAP costs
Figure 7.3: Acceptability of SAP costs
Figure 7.4: Distribution of decision between SAP and MMIS
Figure 7.5: Ease of SAP implementation
Figure 7.6: Response on availability of information
LIST OF TABLES
Table 2.1: Guiding principles within Materials Management
Table 4.1: Movement expected in the steel sector i.r.o. 3rd quarter 1998
Table 5.1: Types of scale
Table 5.2: Development of research instrument
Table 5.3: Research questions
Table 6.1: Characteristics of MMIS and SAP
Table 6.2: Systems Benefits
Table 6.3: Systems Risks and Concerns
Table 7.1: Reasons for choice between MMIS and SAP
LIST OF APPENDICES
Appendix 5.1: Questionnaire
Appendix 6.1: Product Solution: Microsoft Access
Appendix 6.2: Low-level Systems Diagrams
Appendix 6.3: Systems characteristics
Appendix 6.4: User Manual
ACRONYMS
Acronym Page Description
MMIS 1, 27,
32, 33,
30, 31,
34, 37
Materials Management Information System
JIT 3 Just In Time system for procurement of goods, varying form
raw materials to spares and consumables
ABC
analysis
4 The Management Principle of Materiality, where items is
classified on the basis of relative importance
POS 5 Point Of Sale information
TCO 6, 33 Total Cost of Ownership
SDLC 14 Systems Development Life Cycle
CEO 16 Chief Executive Officer
BAA 17 Business Area Analysis Phase of Systems Planning
IS 18 Information Systems
RFQ 22,30, 41 Request For Quotation
RFP 22 Request For Proposal
RDP
Projects
27 Reconstruction and Development Plan for South Africa
US 29 United States
SAP (LIS) 30, 31,
43
33,
••
34, Logistics Information System within the SAP software system
ERD 35 Entity Relationship Diagram
DFD 36 Data Flow Diagram
MIS 36 Management Information System
CHAPTER ONE
Introduction
In the growing complexities of civilisation new problems develop more rapidly than the old ones are
solved. Since a problem is a doubtful code or question difficult to solve [14], it is necessary to
understand the relevant facts in order to solve the problem. To accomplish this the problem must
be carefully defined.
The aim of this study is to answer the question whether it is better to buy a commercially available
software system off the shelve, or to design a custom written system for the business. The
advantages and disadvantages of each will be investigated and discussed.
The research objective of this study can therefor be defined as follows:
To plan, analyse, design, implement and test, a small custom written Materials
Management Information System (MMIS), within a Steel Industry.
To compare a smaller, custom written Management Information System (MIS) software
system with a commercially available system.
To investigate the possible advantages and disadvantages of a commercial system in
comparison with a custom written system.
In order to arrive at these objectives, the study was divided into four parts. The first part gives
supporting and background information, the second part discusses the research process, the third
discusses the computer system used in the case study and the fourth the findings from the case
study as well as the final conclusion.
Part one consists of a discussion of supporting information regarding the environment in which the
study took place and the role of information systems in management. It can be summarised as
follows:
Materials Management (Chapter 2). This chapter looks at the primary function of Materials
Management, advantages of the process to a company, and the role of the supply chain
within a company's processes.
A MMIS in a Steel Industry — A Case Study 1

Information Systems (Chapter 3). A manager's view of information systems is discussed,
as well as the support information systems provide for the business processes. The
systems development life cycle is given in order to provide a backdrop for the system
discussed in part three.
Lastly the characteristics of the Steel Industry (Chapter 4) is discussed, as this is part of the
environment in which the case study took place.
Part two consists of:
Describing the research process (Chapter 5). The discussion is done at this stage to
provide the basis for part three. Although the mini thesis as a whole is a research study,
this chapter discusses the methods used during the process to -arrive at the findings and
final conclusion.
Part three consists of:
Describing the computer system programmed (Chapter 6). This chapter is the focal point of
the research objectives, as it describes the design of the system, as well as the advantages
and disadvantages as compared with a commercial system.
Part four consists of:
Stating research outcomes, i.e. the findings (Chapter 7). In this chapter is stated the
findings of the research as conducted within the described environment.
Drawing a conclusion from before mentioned outcomes (Chapter 8). The chapter ends the
mini thesis by summarising the outcomes and presenting the answer to the research
objectives.
A MMIS in a Steel Industry — A Case Study 2
CHAPTER TWO
Materials Management
This chapter aims to give background information regarding the Materials Management function in
general, as well as specifically in the Steel Industry. Materials Management has evolved from
being purely a purchasing function, into a department that adds value to the company through its
various processes and functions. Refer to Figure 2.1.
2.1
Primary function
Purchasing and materials management is primarily concerned with the planning, acquisition,
conversion, flow, and distribution of goods from the raw materials to finished goods. The
purchasing department in a typical organization is responsible for securing all necessary raw
materials, supplies, capital goods, and services at the best terms possible. The materials
management function typically coordinates the major activities contributing to materials costs and
availability including purchasing, warehousing, and distribution [27].
In a typical company, approximately 50% of all sales rands are being spent on purchased items or
services. The importance of the purchasing and materials management function in an
organisation can therefor not be overemphasized. Together, these trends have created an
environment where customers in all segments of the market face at least one common imperative -
the need to increase the efficiency of their operations. Similar trends in other sectors of the
economy gave rise to management techniques, which are now gaining acceptance in the life
sciences, market. The emergence of storerooms is but one example of these techniques [27].
Materials Management offers the following principal benefits [29]:
Enhances inventory control enabling stock holdings to be kept at an optimum economic
level;
Enhances service levels by providing on line access to purchasing and requisitioning to all
users;
A MMIS in a Steel Industry — A Case Study 3
2 w bo A
A al V) C A
al A c3 E A
•.... In A 6= CP 71 A
.37 A 4,..) & CZ .1,, A
2 (2 A A
Mat
eria
ls M
anag
emen
t p
roce
ss
1
C) LL
L a) 0
0 L 0
E
0 E E 0 U

❖ Increases labor productivity by automating routine tasks, for example, items not requiring
special attention can be automatically provisioned;
Can lower costs and improve consistency of supply through the use of forward purchase
agreements;
Reduced cost of supply, improved warehouse use, optimised staff productivity and better
management information gives a better bottom line result.
2.2
Reducing Costs through Materials Management
Improving efficiency and reducing costs can be achieved in many ways, from reductions in staff to
elimination programs. One of the greatest cost drivers in any organization is the cost of supplies.
The cost of supplies is not limited to the price of an item [23]. Administrative and other overhead
costs are also incurred in selecting vendors, ordering, accounting, shipping, receiving, and storing
supplies. A growing appreciation of the extent of these costs has made their reduction a prime
focus of all organizations' cost reduction efforts. This holds true in academic, industrial, and
government accounts. One of the keyways to reduce supply costs is through a discipline widely
referred to as "materials management."
Analyses show that sophisticated materials management is already the norm in large industrial
accounts, and their success is likely to influence the purchasing practices of smaller companies as
well. Progressive government laboratories are also moving in this direction. It is a given that as
materials management techniques gain acceptance it will increasingly be applied to the
procurement of products and supplies [27].
Many organizations in all segments of the market have experimented with a number of these
enhanced strategies, programs and concepts. As the organization gains experience, and begin to
realize the benefits of integrated materials management, prime-vendor programs are commonly
found. Organisations seeking even greater results have pursued more creative approaches in
concert with their vendors. In fact, many of these programs have been conceived, packaged and
proposed by vendors as part of their effort to provide value-added services and to either enhance
or maintain their market share and profitability [1]. These techniques are commonly referred to as
Just-In-Time (JIT) or "stockless" programs.
A MMIS in a Steel Industry — A Case Study 5
Simply stated, JIT means that supplies are ordered to arrive just before they are actually needed
[7]. Thus, frequent deliveries are made directly to the production line and virtually no inventories
are maintained in a warehouse or storeroom. Organizations, which successfully implement JIT,
have found this concept has improved efficiency, reduced costs and increased profits. One of the
guiding principles of a JIT program is the need to dramatically reduce the organisation's number of
suppliers. Vendors must adapt to the changing business environment, or find they are competing
for a smaller share of the market segment populated by small volume accounts.
2.3
The Supply Chain
A lot of companies have been restructured, reorganized, and reengineered, downsized, rightsized,
and horisontally organized. As mentioned, attention is given to methods like ABC analysis, and
JIT [18]. The company is lean and mean, and the people are feeling empowered. The next
question is, is the supply chain up to the task of supporting the company's growth? If work has
been done to streamline and integrate the company's supply chain, the answer is likely to be
positive. If, on the other hand, these initiatives have gotten in the way of developing an agile and
responsive supply chain, the answer could be more negative.
An integrated supply chain is linked organisationally and coordinated with information flows, from
raw materials to on-time delivery of finished goods to customers. Partnering-oriented business
relationships are established between and among all supply chain members -to facilitate -
coordination of supply chain activities. What is partnering? Partnering or partnership sourcing can
be described as follow [9]: "... Is where customer and supplier develop such a close and long-term
relationship that the two work together as partners. It isn't philanthropy: the aim is to'secure the
best possible commercial advantage. The principle is that teamwork is better than combat. If the
end-customer is to be best served, then the parties to a deal must work together — and both must
win. Partnership sourcing works because both parties have an interest in each other's success."
It is important to link customer/seller interface in the value and supply chain. The issue of what the
customer actually requires must be addressed. The needs of the customer must therefor be linked
to the buyer/seller relationship where the focus is on value adding benefits in the supply chain.
A MMIS in a Steel Industry — A Case Study 6

Supply chain development can help a company [9]:
Achieve world-class quality standards
Plan better through long-term, information rich relationships with customers and suppliers
Innovate through better information from customers and suppliers, and access to the
technical resources of both.
Similarly, supply chain processes within the company are managed across the company to
minimise unnecessary handoffs, silo behavior (vertical thinking and behavior within a business
unit), uncertainty, and delays. The entire supply chain is linked by information about anticipated
and actual demand, supply, and movement. This information is used to coordinate the activities of
all supply chain partners. Integrated "super organisations" with coordinated supply chains are
extremely responsive, and can react quickly to support a partner company's rapid growth. All
supply chain partners share in business planning, forecasting point-of-sale (POS) information,
inventory status, and other activities and information related to coordinating the flow of products.
When everyone plays from the same sheet music, uncertainty and delays are minimized.
Suppliers know when to begin production, carriers can plan when to provide additional equipment,
and distributors can offer added just-in-time throughput capacity. Products speed through the
supply chain, unimpeded by uncertainty, start-up inertia, excessive handoffs, flow interruptions or
paperwork delays [18].
The nimbleness of a supply chain, and its capability to support anticipated growth, can be
assessed by answering the following questions:
Is timely POS information used to provide early warning of rapid shifts in demand?
Are agreed-upon, accurate demand forecasts used to "pull" products through the supply
chain - from raw materials through manufacturing to distribution to customers - in the right
amounts and in the right assortments, when needed?
Do the company's major customers regularly provide their demand projections and plans
for growth?
Does the company regularly give major suppliers its business plan and demand
projections?
Does purchasing, manufacturing, product flow, inventory, and transaction information move
seamlessly throughout the supply chain?
Is the company linked electronically with all its major customers, suppliers and
transportation carriers?
A MMIS in a Steel Industry — A Case Study 7
Have service and performance measurements been implemented between each stage of
the supply chain to monitor overall performance?
Are supply chain processes coordinated and managed horizontally across the organization
to minimize handoffs and reduce cycle times?
Information delays, multiple handoffs, suppliers' inability to quickly begin production, difficulty in
obtaining carrier equipment and a myriad of other problems will impede the company's ability to
respond quickly to growth triggers. If this is the case, it's time to improve the company's supply
chain efficiency and performance [18].
2.4
Commodity Management within Materials Management
Materials Management focuses on four core processes:
Total cost of ownership (TCO) / Supplier management — Achieve continuous reductions in
TCO
Materials/ Inventory planning — Optimise inventory levels within and across centers
Order fulfillment — Improve service levels and reduce the administrative burden.
Materials logistics — Optimise logistical flows, and ensure inventory integrity.
The above mentioned is executed by way of Commodity Management. Where the traditional
focus in Materials Management would be the achievement in savings on price only, Commodity
Management examines specification optimisation and commodity usage to achieve greater
savings [22]. Individual industrial goods or services are called commodities. Some examples are
electricity, mechanical spares, lubricants, and tires.
The savings are realised by way of Money teams and Commodity teams. Money teams are used
to achieve rapid change. A Money team focuses on achieving significant savings in one
commodity in a short period of time (3 — 4 months) with tight deadlines, during which the 80-20 rule
or Pareto concept apply. During this process the team identifies and tracks the key measures of
performance. A Money team is appointed for each commodity when required and consists of
representatives from Materials Management, Production, Maintenance and Finance.
A MMIS in a Steel Industry — A Case Study 8
A Commodity team consists of a commodity manager, a buyer/co-ordinator and a materials
engineer or technician. The manager will be responsible for obtaining commodities at the best
prices and making sure they are used effectively so that the total cost of ownership is reduced.
The buyer/co-ordinator will manage tenders, place high-value orders and make sure there is
neither too much nor too little stock. The materials engineer or technician will use his technical
expertise to make sure that commodities are used effectively by working closely with the suppliers
outside Iscor and the users in Iscor.
Total cost of ownership means all the money that a company spends to own the materials, goods
and services that are used to produce its products. This includes the purchase price, the amount
that is used, as well as the costs to keep it in the stores before it is used [22]. The guiding
principles within Materials Management can be summarised in the following table [23]:
Table 2.1: Guiding principles within Materials Management
Measure performance •
•
Measure performance against aggressive
targets.
Reward high performance
Operate strategically • Segment and classify commodities.
• Focus on commodities, not contracts.
a Keep systems and processes simple and
easy to manage.
• Manage commodities by total cost of
ownership, not by price.
Delegate decision making to the • Decentralise unless there is a compelling
lowest level to improve reason for centralisation
accountability • Empower people to make decisions and
hold them accountable for the results
Leverage suppliers • Work with suppliers to drive performance
improvement
• Consolidate supplier base
• Employ suppliers in non-strategic functions
A MMIS in a Steel Industry — A Case Study 9

2.5
Conclusion
As can be seen in the above, Materials Management has become an integral part of any cost
reduction- and efficiency improvement plans a company might have. Through compliance with
these principles as discussed in the chapter, Materials Management can render a service, which
fits the end-user needs. To accomplish all of the objectives, it is necessary to have timely,
trustworthy information, in a format that is useful. That is then the focus of the next chapter.
A MMIS in a Steel Industry — A Case Study 10
CHAPTER THREE
Information Systems
To be a successful manager, one must be able to recognise the information systems needed,
understand how new technologies create opportunities to do business more effectively, and accept
responsibility for participating in the planning and design of information systems. This ties directly
to the Materials Management principle of measuring performance, and operating strategically.
Many computer-generated reports are designed to enable managers to keep track of day-to-day
operations and to monitor the use of resources. Through effective design these reports can help
manage not only the use of resources, but also the total cost of ownership as defined in the
previous chapter.
3.1
How Information Technology Supports Business Activities
One of the first challenges to managers is to understand how information technology can be used
to support business activities, and therefor Materials Management activities. The concept of the
value chain helps explain which business activities can be analysed and perhaps transformed
through the use of information technology [15]. The value chain divides the company's activities
into value activities, that is the distinct activities it must perform to do business. Refer to
Figure 3.1.
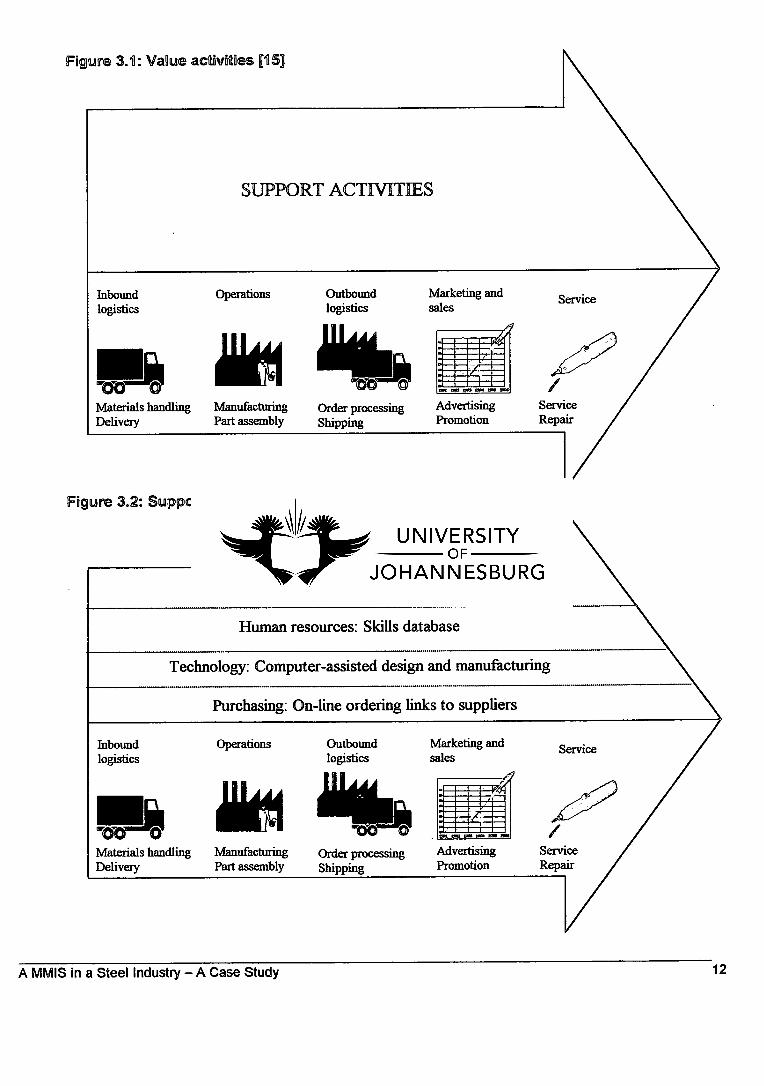
Value activities consist of primary and support activities. Primary activities include inbound
logistics, operations, outbound logistics, marketing and service. Supporting activities include
delivery and handling of incoming materials. Figure 3.2 shows some support activities. The firm's
organisation [15], which includes activities such as general management, legal work, and
accounting, supports the entire value chain.
A system developed for an organisation should support primary activities in the value chain,
thereby providing a competitive edge in the market. The support activities can also be reinforced
A MMIS in a Steel Industry — A Case Study 11
SUPPORT ACTIVITIES
Inbound
Operations
Outbound
Marketing and logistics
logistics sales
w0-0 0 illl Materials handling Manufacturing Delivery Part assembly
Order processing Shipping
Advertising Promotion
Figure 3.1: Value activities E15]
Figure 3.2: Supp rt activities 05]
Organisation: Office automation
Human resources: Skills database
Technology: Computer-assisted design and manufacturing
Purchasing: On-line ordering links to suppliers
Service Inbound
Operations
Outbound
Marketing and logistics
logistics sales
al Materials handling Manufacturing Delivery Part assembly
wtY0 0
Order processing Shipping
Advertising Promotion
/ Service Repair
12 A MMIS in a Steel Industry — A Case Study
Supplier Firm Channel Buyer value value value value
by the use of information technology. For example, the management of human resources can be
supported by the design of a skills database.
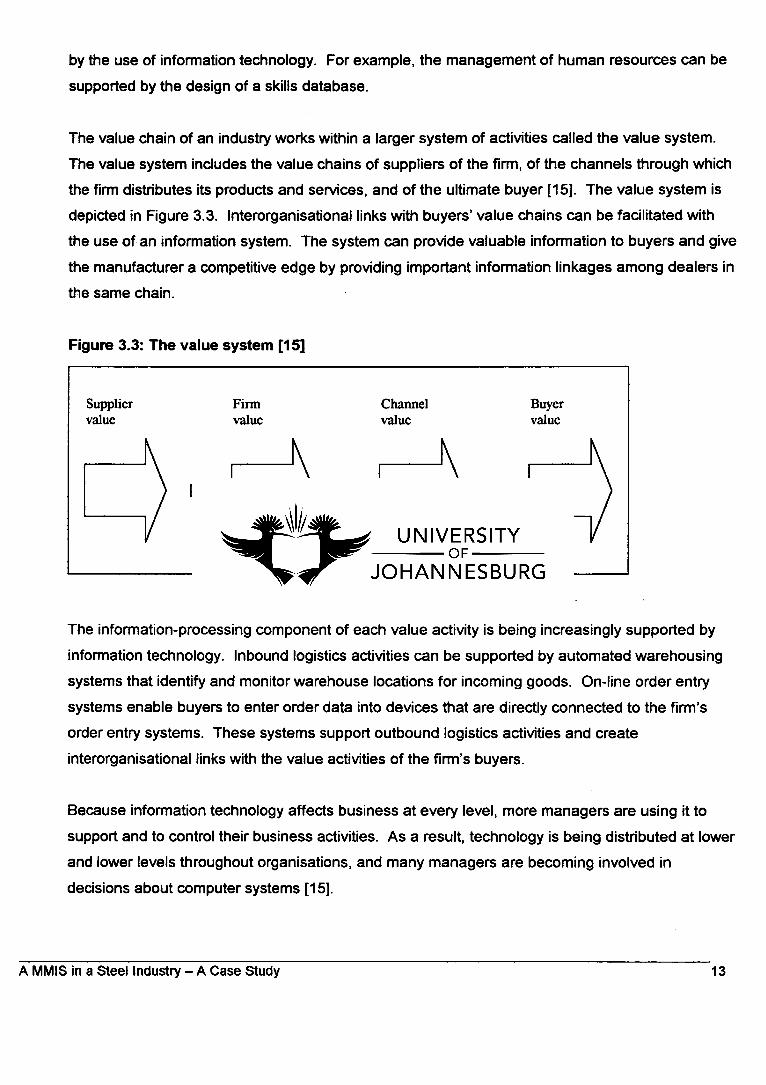
The value chain of an industry works within a larger system of activities called the value system.
The value system includes the value chains of suppliers of the firm, of the channels through which
the firm distributes its products and services, and of the ultimate buyer [15]. The value system is
depicted in Figure 3.3. Interorganisational links with buyers' value chains can be facilitated with
the use of an information system. The system can provide valuable information to buyers and give
the manufacturer a competitive edge by providing important information linkages among dealers in
the same chain.
Figure 3.3: The value system [15]
The information-processing component of each value activity is being increasingly supported by
information technology. Inbound logistics activities can be supported by automated warehousing
systems that identify and monitor warehouse locations for incoming goods. On-line order entry
systems enable buyers to enter order data into devices that are directly connected to the firm's
order entry systems. These systems support outbound logistics activities and create
interorganisational links with the value activities of the firm's buyers.
Because information technology affects business at every level, more managers are using it to
support and to control their business activities. As a result, technology is being distributed at lower
and lower levels throughout organisations, and many managers are becoming involved in
decisions about computer systems [15].
A MMIS in a Steel Industry — A Case Study 13
Long-range plans
Strategic planning
Tactical
Operational
Budgets Tactical plans
Day-to-day transactions
Information technology can create competitive advantage by reducing the cost of value activities,
by effectively differentiating products and services to a firm's customers, and by enabling the firm
to expand its competitive scope.
3.2
A Manager's View of Information Systems
The process of management involves planning, organising, directing and controlling people and
activities. At each level of management, the responsibilities for handling these tasks differ. Top-
level managers are responsible for establishing organisational objectives. Middle-level managers
organise and control the organisation's resources to achieve these objectives, and lower-level
managers supervise day-to-day activities. Each of these three levels of management has different
information system needs. First-line supervisors need feedback about day-to-day activities,
middle-level managers need information regarding resources, and top-management use external
information to identify new business opportunities and to establish goals for the firm [15].
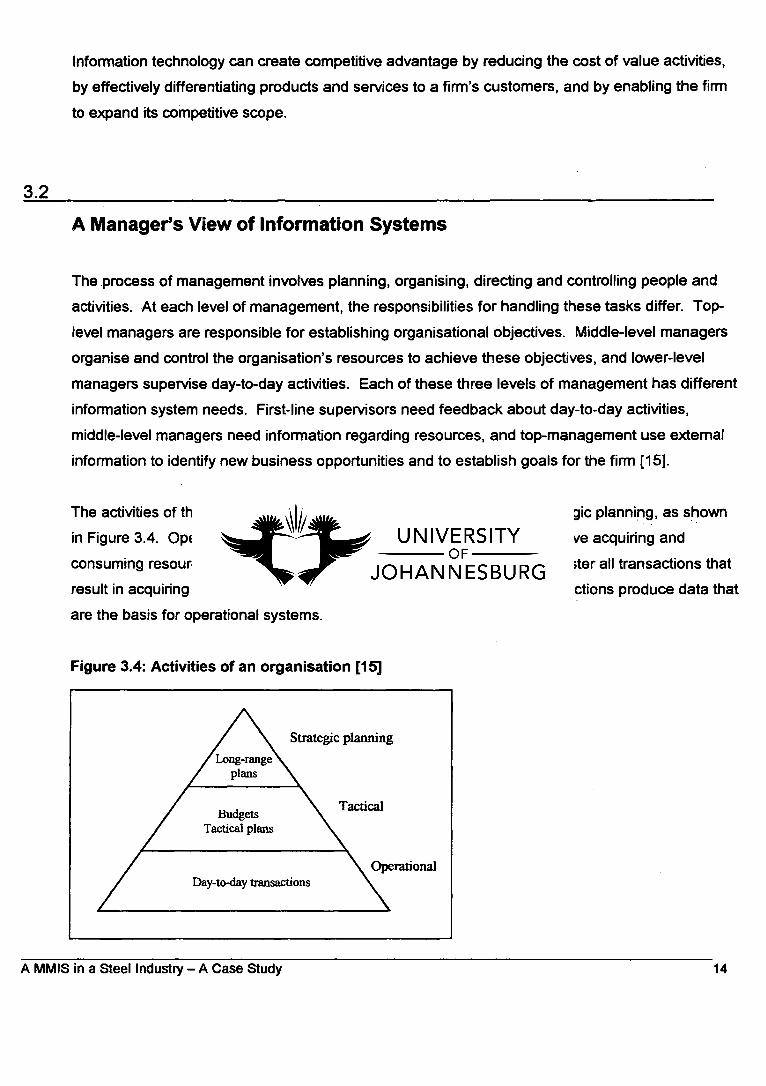
The activities of the firm are of three kinds: operational, tactical, and strategic planning, as shown
in Figure 3.4. Operations are the day-to-day activities of the firm that involve acquiring and
consuming resources. First-line supervisors must identify, collect and register all transactions that
result in acquiring or expending these resources. These day-to-day transactions produce data that
are the basis for operational systems.
Figure 3.4: Activities of an organisation [15]
A MMIS in a Steel Industry — A Case Study 14
STRATEGIC PLANNING 1==> Support for decisions
TACTICAL Demand reports
Special requests
Information needs
Payroll, Accounts receivable, Accounts payable, Inventory control, Billing, Scheduling, Sales order entry, Engineering
OPERATIONAL Scheduled
reports
Transaai ns
The tactical function is the responsibility of the middle-level managers. The time frame for tactical
activities may be month-to-month, or year-to-year. For example, orders for raw materials might be
monitored monthly, productivity might be assessed quarterly, and departmental budgets might be
reviewed annually. Data that can be used to predict future trends can be useful in helping
managers make these resource allocation decisions.
The top management of an organisation carries out strategic planning. They need to set the
organisation's long-range goals. In order to make these decisions, they need to know the activities
of competing firms, interest rates, and trends in government regulation.
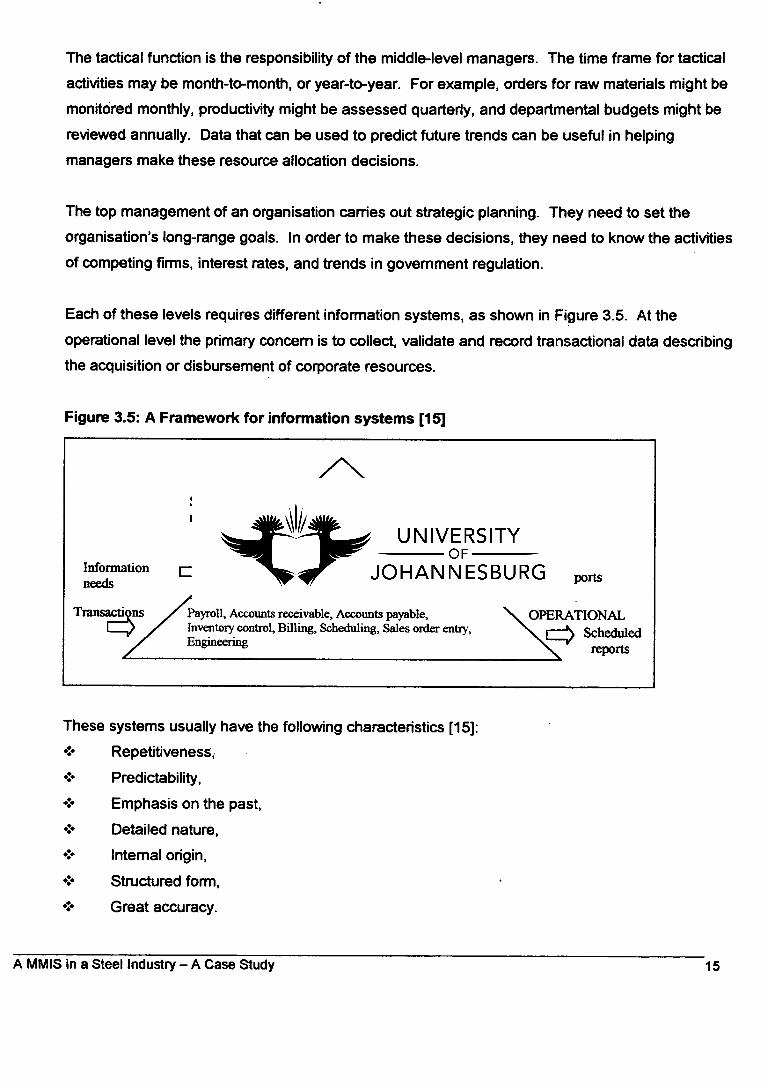
Each of these levels requires different information systems, as shown in Figure 3.5. At the
operational level the primary concern is to collect, validate and record transactional data describing
the acquisition or disbursement of corporate resources.
Figure 3.5: A Framework for information systems [15]
These systems usually have the following characteristics [15):
Repetitiveness ;
Predictability,
Emphasis on the past,
Detailed nature,
Internal origin,
Structured form,
Great accuracy.
A MMIS in a Steel Industry — A Case Study 15
Tactical systems provide middle-level managers with the information they need to monitor and
control operations and to allocate resources more effectively. Transaction data are summarised,
aggregated or analysed. The characteristics are as follow [15]:
Periodic nature,
Unexpected findings,
Comparative nature,
Summary form,
Both internal and external sources.
The third level in the framework for information systems is strategic planning. Strategic planning-
level information systems are designed to provide top management with information that assists
them in making long-range planning decisions for the organisation. The systems often have these
characteristics [15]:
Ad hoc basis,
Unexpected information,
Predictive nature,
Summary form,
External data,
Unstructured format,
Subjectivity.
A summary of the characteristics of information systems is shown in Figure 3.6.
The base of operational systems has to be in place before tactical systems can be built. This is
because the data input into operational systems become the source of data for tactical systems.
However, tactical systems do not necessarily have to be in place for strategic planning systems to
be developed. This is because the latter rely heavily on external data sources [15].
A MMIS in a Steel Industry — A Case Study 16
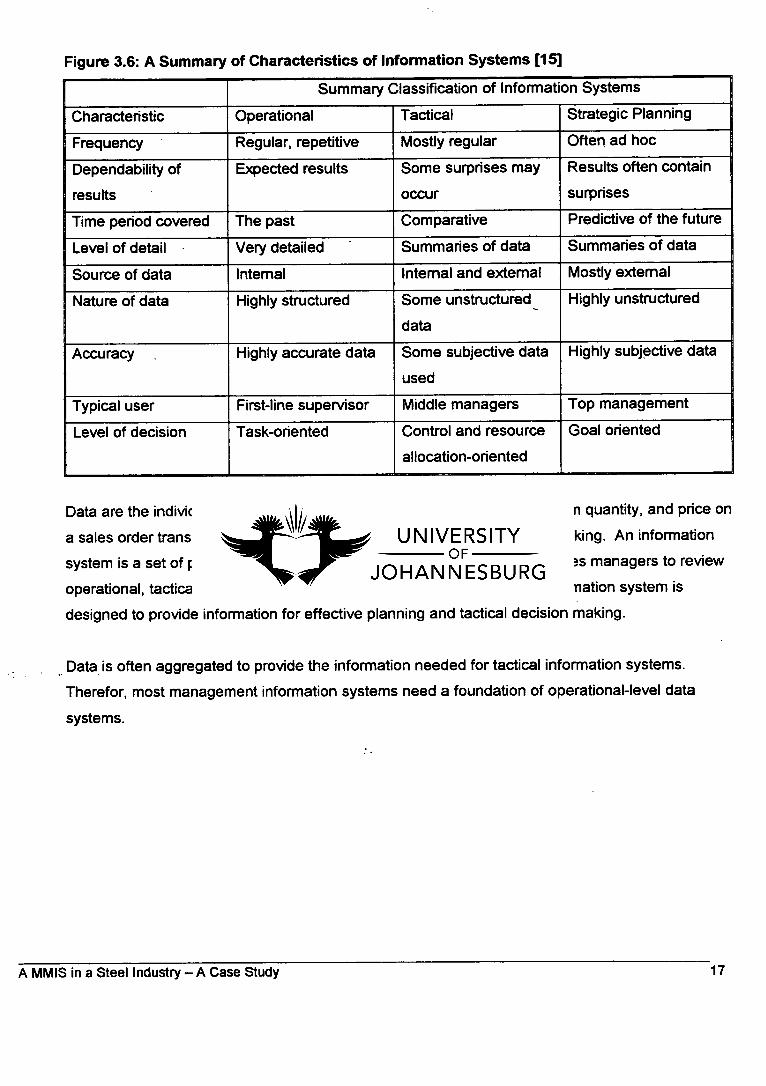
Figure 3.6: A Summary of Characteristics of Information Systems [15]
Summary Classification of Information Systems
Characteristic Operational Tactical Strategic Planning
Frequency Regular, repetitive Mostly regular Often ad hoc
Dependability of
results
Expected results Some surprises may
occur
Results often contain
surprises
Time period covered The past Comparative Predictive of the future
Level of detail Very detailed Summaries of data Summaries of data
Source of data Internal Internal and external Mostly external
Nature of data Highly structured Some unstructured
data
Highly unstructured
Accuracy . Highly accurate data Some subjective data
used
Highly subjective data
Typical user First-line supervisor Middle managers Top management
Level of decision Task-oriented Control and resource
allocation-oriented
Goal oriented
Data are the individual elements of a transaction, such as item number, item quantity, and price on
a sales order transaction. Information is data with meaning for decision making. An information
system is a set of procedures organised to generate information that enables managers to review
operational, tactical, and strategic planning activities. A management information system is
designed to provide information for effective planning and tactical decision making.
Data is often aggregated to provide the information needed for tactical information systems.
Therefor, most management information systems need a foundation of operational-level data
systems.
A MMIS in a Steel Industry — A Case Study 17
3.3
Managerial Decision Support Systems
Decision support systems are designed to support semi-structured and unstructured decisions in
situations in which information is incomplete. They are developed to support decisions that are so
different each time that it would be hard to develop a standard set of procedures for programming
them. Such decisions may be specific and may relate to a one-time-only situation. A decision
support system should enable the decision-maker to apply the right decision rule to a problem,
rather than using standard rules that may not apply because of changing conditions. An effective
decision support system needs to incorporate the following features [15]:
Support of unstructured decisions. Figure 3.7 describes the types of decisions and degree
of decision structure for both structured and unstructured decisions.
Support for database access and modeling. Ideally, a decision support system should
have a database that serves as a repository of data for easy access and change. The
following step is to determine the type of access and the analysis needed. Refer to
Figure 3.8.
Support for all phases of the decision-making process. An effective support system should
support the three phases of the decision process: intelligence, design, and choice. At each
stage different operations occur. During the intelligence phase, data are collected as a
basis for diagnosing a problem or a situation requiring a decision. When alternatives are
weighed during the design phase, data may be manipulated or values may be assigned to
each alternative. A simulation of the results of the alternatives or statistics describing them
may be useful operations for choosing the best option.
Support for communications among decision-makers.
Availability of memory aids. In making decisions, managers constantly have to recall
information on the results of operations conducted ate previous times. Decision support
systems should provide these triggers.
Availability of control aids for decision making.
A MMIS in a Steel Industry — A Case Study 18
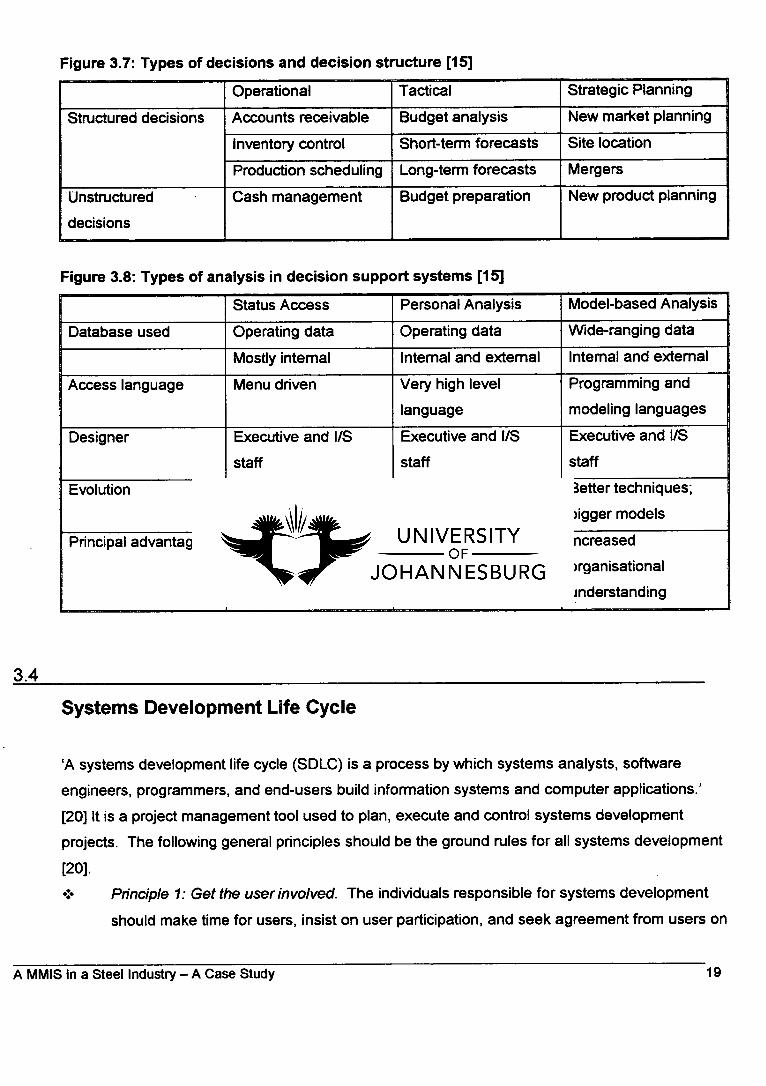
Figure 3.7: Types of decisions and decision structure [15]
Operational Tactical Strategic Planning
Structured decisions Accounts receivable Budget analysis New market planning
Inventory control Short-term forecasts Site location
Production scheduling Long-term forecasts Mergers
Unstructured
decisions
Cash management Budget preparation New product planning
Figure 3.8: Types of analysis in decision support systems [15]
Status Access Personal Analysis Model-based Analysis
Database used Operating data Operating data Wide-ranging data
Mostly internal Internal and external Internal and external
Access language Menu driven Very high level
language
Programming and
modeling languages
Designer Executive and I/S
staff
Executive and I/S
staff
Executive and I/S
staff
Evolution More reports Deeper analyses;
more data
Better techniques;
bigger models
Principal advantages Easy to use; quick
solution
Increased analytical
capability
Increased
organisational
understanding
3.4
Systems Development Life Cycle
`A systems development life cycle (SDLC) is a process by which systems analysts, software
engineers, programmers, and end-users build information systems and computer applications.'
[20] It is a project management tool used to plan, execute and control systems development
projects. The following general principles should be the ground rules for all systems development
[20].
40, Principle 1: Get the user involved. The individuals responsible for systems development
should make time for users, insist on user participation, and seek agreement from users on
A MMIS in a Steel Industry — A Case Study 19

all decisions that may affect them. Misunderstandings continue to be a significant problem
in systems development, however user involvement can help minimise these and help win
user acceptance for new ideas.
Principle 2: Use a problem solving approach. The SDLC is first and foremost a problem
solving approach to building systems. The classical problem solving approach is as
follows:
Identify the problem.
Understand the problem's environment and the problem's causes and effects.
Define the requirements of a suitable solution.
Identify alternative solutions.
Select the best solution.
Design and implement the solution.
Observe and evaluate the solution's impact. Refine the solution accordingly.
The idea is that all systems analysts should approach their projects using a problem solving
approach.
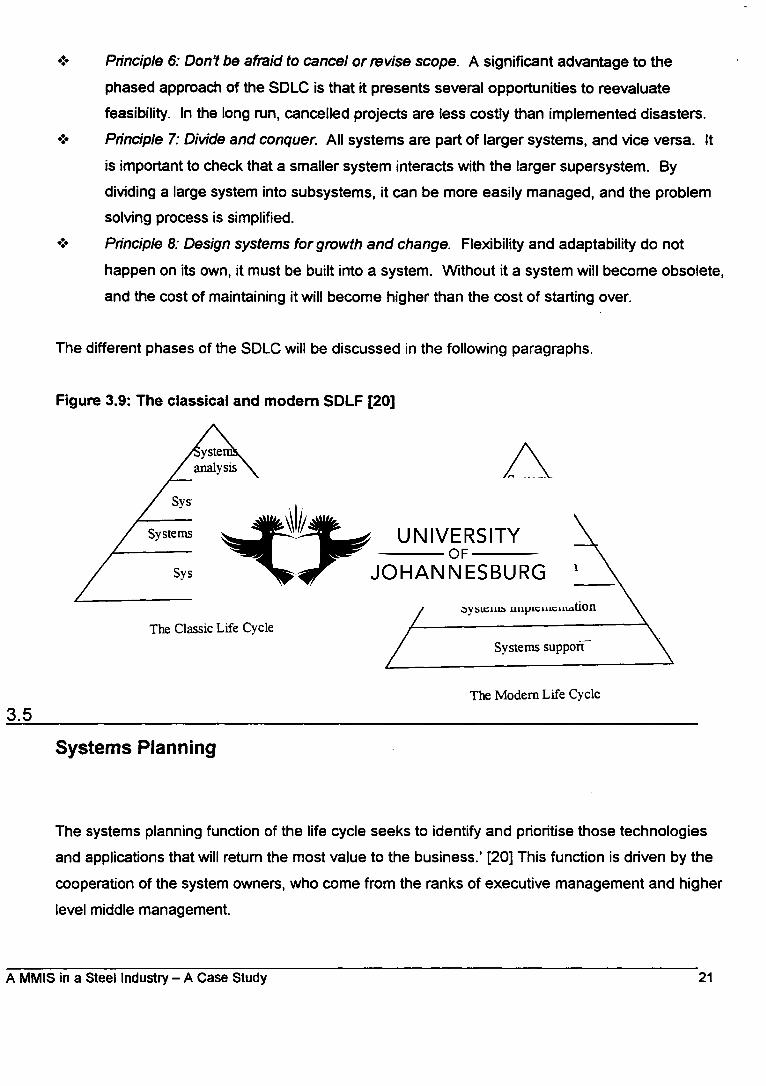
Principle 3: Establish phases and activities. In its simplest, classical form the SDLC
consists of four phases: systems analysis, systems design, systems implementation and
systems support. Modem variations added another phase, systems planning. Refer to
Figure 3.9. The phases are usually broken down into tasks that can be more easily
managed and accomplished.
Principle 4: Establish standards for consistent development and documentation. If no one
standard exists and analysts/programmers come and go, chaos would exist. In order to
promote good communication between this constantly changing base of users and
professionals there must be set standards. These standards usually describe activities,
responsibilities, documentation guidelines, and quality checks. Documentation should be a
working by-product of the entire systems development effort. Documentation stimulates
user involvement and reassures management about progress.
Principle 5: Justify systems as capital investments. When considering a capital investment,
two issues must be addressed. First, for any problem, there are likely to be several
possible solutions. The analyst should not accept the first one that comes to mind.
Second, each possible solution should be evaluated for feasibility, especially for cost-
effectiveness.
A MMIS in a Steel Industry — A Case Study 20
Principle 6: Don't be afraid to cancel or revise scope. A significant advantage to the
phased approach of the SDLC is that it presents several opportunities to reevaluate
feasibility. In the long run, cancelled projects are less costly than implemented disasters.
Principle 7: Divide and conquer. All systems are part of larger systems, and vice versa. It
is important to check that a smaller system interacts with the larger supersystem. By
dividing a large system into subsystems, it can be more easily managed, and the problem
solving process is simplified.
Principle 8: Design systems for growth and change. Flexibility and adaptability do not
happen on its own, it must be built into a system. Without it a system will become obsolete,
and the cost of maintaining it will become higher than the cost of starting over.
The different phases of the SDLC will be discussed in the following paragraphs.
Figure 3.9: The classical and modern SDLF [20]
yste analysis
Syste planning
Systems design
Systems analysis
Systems implementation
Systems support Systems design
Systems implementation
The Classic Life Cycle Systems support—
The Modem Life Cycle
3.5
Systems Planning
The systems planning function of the life cycle seeks to identify and prioritise those technologies
and applications that will return the most value to the business.' [20] This function is driven by the
cooperation of the system owners, who come from the ranks of executive management and higher
level middle management.
A MMIS in a Steel Industry — A Case Study 21
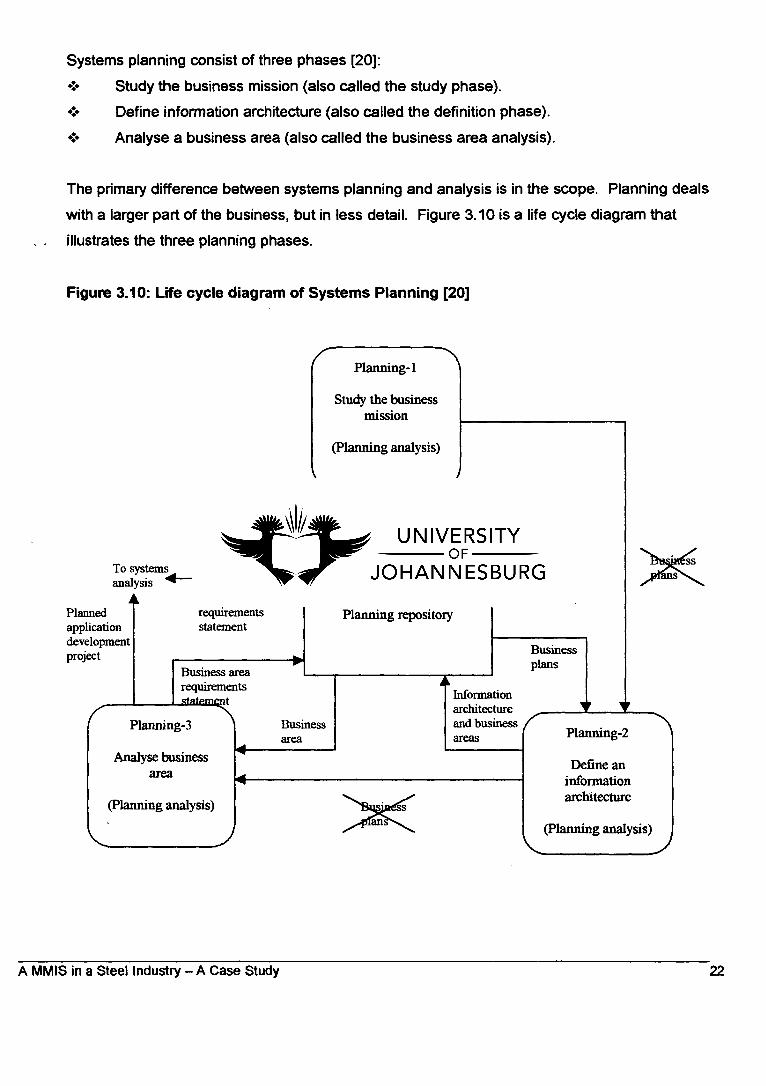
Systems planning consist of three phases [20]:
Study the business mission (also called the study phase).
Define information architecture (also called the definition phase).
Analyse a business area (also called the business area analysis).
The primary difference between systems planning and analysis is in the scope. Planning deals
with a larger part of the business, but in less detail. Figure 3.10 is a life cycle diagram that
illustrates the three planning phases.
Figure 3.10: Life cycle diagram of Systems Planning [20]
Planning-1
Study the business mission
(Planning analysis)
To systems analysis • •
Planned application development project
Any documentation from systems support
Business area requirements
t
Planning-3
Analyse business area
(Planning analysis)
Business requirements statement
Business area
V
Business plans
Information architecture and business areas
Business plans
Planning-2
Define an information architecture
(Planning analysis))
SS
Planning repository
A MMIS in a Steel Industry — A Case Study 22
The study phase. If information systems are to truly return value to the business, they need
to be aligned with the business mission. The fundamental objectives of the phase are :
To establish the mandate for strategic systems planning.
To build a working partnership between information systems management and top
business management.
To analyse enterprise strategies that may affect information systems.
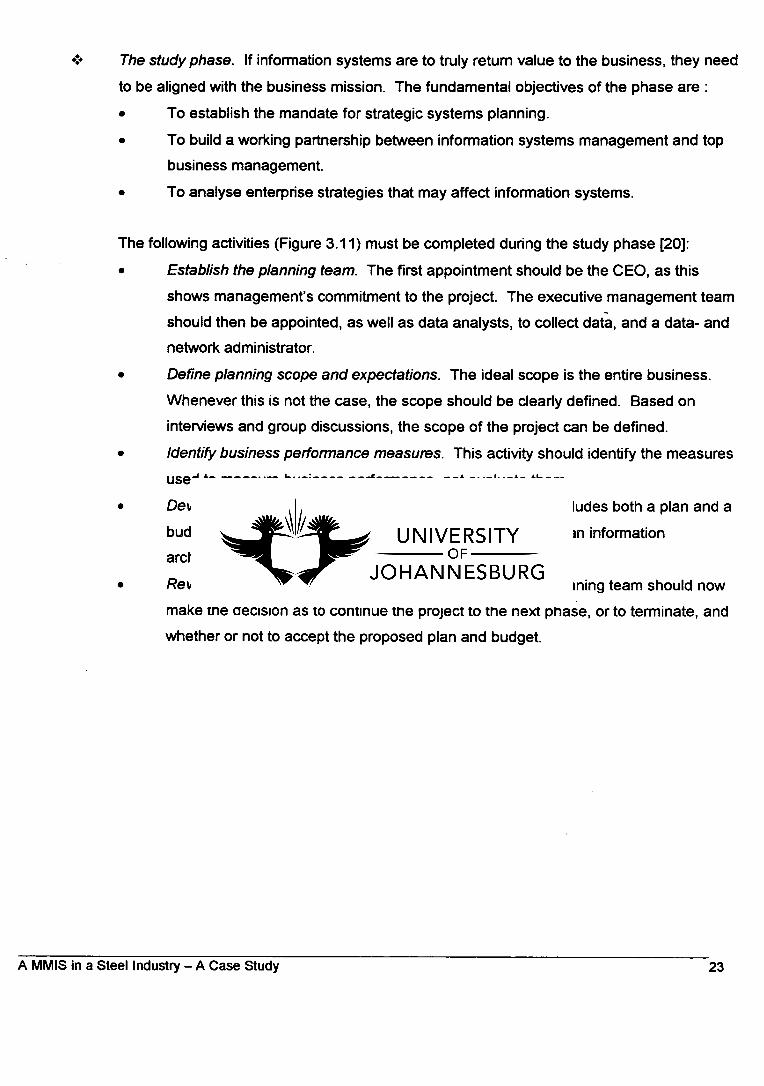
The following activities (Figure 3.11) must be completed during the study phase [20]:
Establish the planning team. The first appointment should be the CEO, as this
shows management's commitment to the project. The executive management team
should then be appointed, as well as data analysts, to collect data, and a data- and
network administrator.
Define planning scope and expectations. The ideal scope is the entire business.
Whenever this is not the case, the scope should be clearly defined. Based on
interviews and group discussions, the scope of the project can be defined.
Identify business performance measures. This activity should identify the measures
used to measure business performance, not evaluate them.
Develop a project plan. This is based on the scope, and includes both a plan and a
budget for completing the next phase of the project (define an information
architecture).
Review findings and communicate planning vision. The planning team should now
make the decision as to continue the project to the next phase, or to terminate, and
whether or not to accept the proposed plan and budget.
A MMIS in a Steel Industry — A Case Study 23
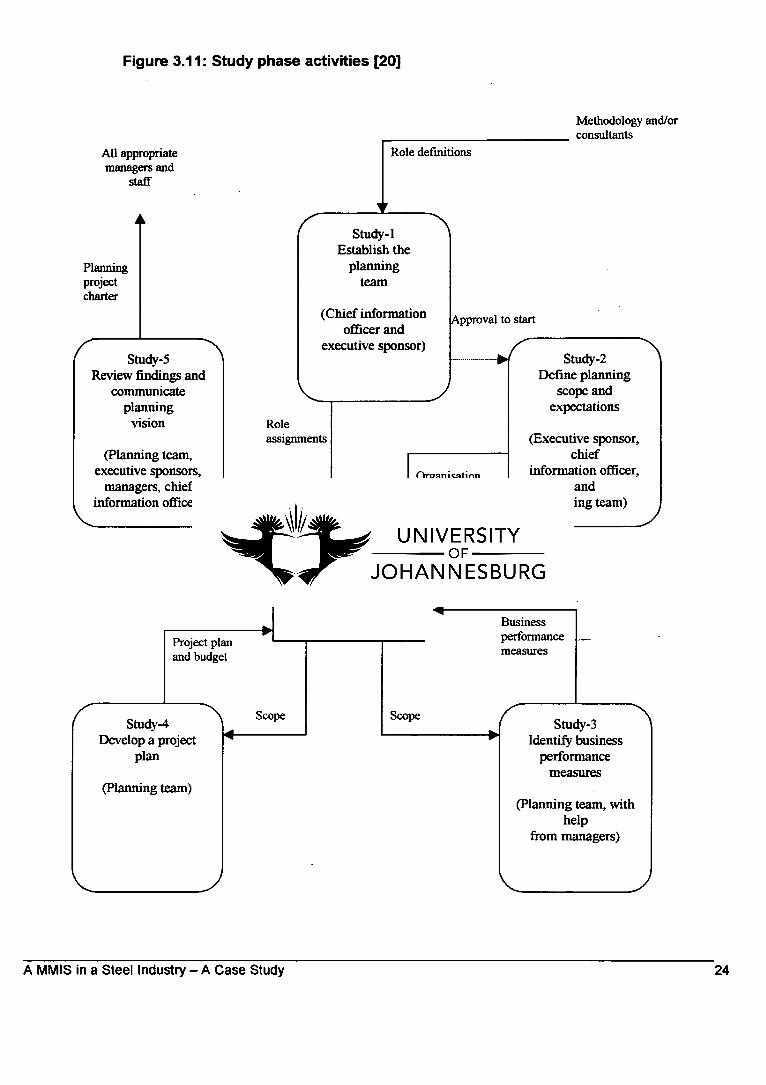
Figure 3.11: Study phase activities [20]
All appropriate managers and
staff
Methodology and/or consultants
Role definitions
Planning project charter
( tudy-5 Review findings and
communicate planning
vision
(Planning team, executive sponsors,
managers, chief information officer)
...„Appropriate documentation
Study-1 Establish the
planning team
(Chief information officer and
executive sponsor)
Approval to start
Study-2 Define planning
scope and expectations
Organisation charts, context models, scope descriptions
(Executive sponsor, chief
information officer, and
planning team)
Role assignments
Planning repositories
Business performance measures
Project plan and budget
Scope 41--
Scope Study 4
Develop a project plan
(Planning team)
Study-3 Identify business
performance measures
(Planning team, with help
from managers)
A MMIS in a Steel Industry — A Case Study 24

❖ The definition phase. During this phase the information architecture must be defined. That
is, the vision and plan for using information technology and developing information systems
needed to support a business's mission. The fundamental objectives of the phase are:
To define a data-, application-, network-, information services-, and technology
infrastructure for future information systems.
To identify and prioritise logical business areas for further planning, or to identify
and prioritise application development projects.
The definition phase is triggered by the authority and funding to continue the planning
project from the study phase. These activities are [20]:
Model the enterprise. The enterprise model consists of people, activities, data and
networks.
Assess current business strategies. These include critical success factors for the
business, goals and objectives, who is responsible for the above-mentioned, etc.
Assess current information services and strategies.
Identify and prioritise business areas. After the business areas are identified, they
should be-ranked using the business and information systems assessments from
activity 2 and 3. Rankings should reflect business areas' relative importance to the
business as a whole, using the performance measures identified in the study phase.
Complete the new information architecture. Based on the proposed business areas,
the enterprise models should be subdivided into models that reflect those areas.
This includes information regarding data, activities, networks, technology and
people.
Identify and plan subsequent projects. Projects are now either sent to systems
development for systems analysis and design, or for business area analysis.
Review findings and approve the plan. A decision must be made to either continue
with the project, or make changes to the scope or budget.
❖ The business area analysis (BAA) phase. The purpose is to devise a plan that will lead to
highly integrated information systems applications for a business area. The fundamental
objectives are:
To identify business-level requirements for a shared database for the business
area.
To identify business-level requirements for a shared network for the business area.
A MMIS in a Steel Industry — A Case Study 25

To refine technical requirements for the business area database and networks.
To identify high-level business requirements for integrated applications in the
business area.
The typical activities of the phase is as follow [20]:
Establish the analysis team. The team must be cross-functional, consisting of
managers and/or supervisors from each relevant organisational unit.
Identify business area performance measures.
Model the business area. The enterprise models must now be expanded and
refined. These models will serve as a starting point for applications development.
Assess current business area and Information Systems (IS) performance.
Identify and prioritise development projects. The analysis team simply identifies or
partitions appropriate development projects on the models and prioritise them into a
sequence.
Plan application development strategy and projects. The plan includes a general
schedule for all development projects in the business area.
Review findings and approve the plan. As in the previous phase, findings and
recommendations should be reviewed.
3.6
Systems Analysis
`Systems analysis is the study of a current business and information system application and the
definition of user requirements and priorities for a new or improved application.' [20] Systems
analysis also consists of three phases:
Survey project feasibility (the survey phase).
Study and analyse the current system (the study phase).
Define and prioritise users' requirements (the definition phase).
The survey phase. This phase answers the question 'Is this project worth looking at?' The
fundamental objectives of the phase are:
A MMIS in a Steel Industry — A Case Study 26
J
Purchase order
Purchase order database (Read only)
Receiving notice 00.
Computer based
accounts payable
Supplier
Packing
Purchasing department
V C \
Freight receiving
system Purchase order
To identify problems, opportunities and/or directives that initiated the project
request.
To determine whether solving the problems, exploiting the opportunities and/or
satisfying the directives will benefit the business.
To achieve these objectives, one needs a very general understanding of the current
system. The survey phase is usually initiated by an unplanned application development
project from a system owner or system user. The following activities must be completed
[20]:
Conduct initial interview. The interview is with the project requester, and aims to
answer questions about the existing system, the objective for the new system, who
the end-users will be, the types of data necessary, etc.
Define project scope. One of the easiest ways to define scope is to draw context
models, which reflect the boundaries and scope of the system. Refer to Figure 3.12
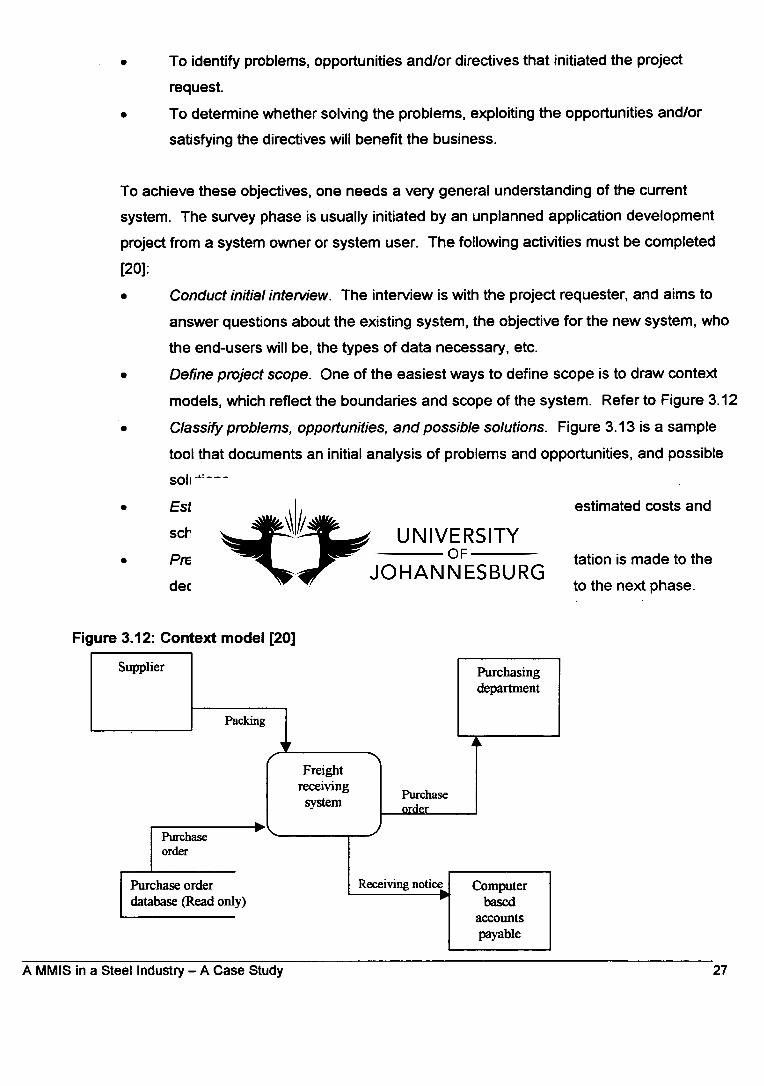
Classify problems, opportunities, and possible solutions. Figure 3.13 is a sample
tool that documents an initial analysis of problems and opportunities, and possible
solutions.
Establish a proposed project plan. The plan should include estimated costs and
schedules.
Present survey findings and recommendations. The presentation is made to the
decision-making body for approval to continue the project into the next phase.
Figure 3.12: Context model [20]
A MMIS in a Steel Industry — A Case Study 27
Figure 3.13: Problem/opportunity survey matrix [20]
Problem/Opportunity Urgency Visibility Annual
benefits
Priority Solution
1 Response time to bid on sporting
events is excessive. We lose a lot of
possible contracts.
Fix within
six months
High $250,000 2 New development
2 Number of potential events is growing
faster than our ability to bid on those
events. The opportunity to bid on
additional, profitable events exists.
Fix within
one year
Medium $125,000 6 New development
3 Difficult to calculate estimated costs for
a bid. If you underestimate a bid, you
cannot charge the customer for excess
costs.
Fix within
three
months
High $50,000 4 Enhancement, then
new development
4 There is no historical database on
which to base future estimates.
Fix within
six months
Low $20,000 5 New development
5 We have recently purchased a
competitor, however, we have since
discovered fundamental
incompatibilities between our
respective eventschediiling data and
systems.
Need
immediate
fix, if
possible
High $75,000 1 Quick fix, then new
development
6 We have overbooked vehicles and
equipment for events and subsequently
incurred costly rental expenses to
legally cover obligations.
Need within
six months
High $2,500 3 Leave well enough
alone
7 We have occasionally booked events
only to discover that we didn't have the
'properly skilled' staff matched to the
obligations.
Need within
two years
Medium $10,000 7 New development
❖ The study phase. The phase answers the questions 'Are the problems really worth
solving?' and 'Is a new system really worth building?' The fundamental objectives of the
phase are as follows:
To understand the business environment of the system.
To understand the underlying causes and effects of problems.
To understand the benefits of exploiting opportunities.
To understand the implications of noncompliance with directives.
A MMIS in a Steel Industry — A Case Study
28
The following activities must be completed [20]:
Assign project roles.
Learn about the current system.
Model the current system. Data models, such as entity-relationship diagrams,
should be used, as well as process, people and network models.
Analyse problems and opportunities. The aim should be to find the problems, in
order to analyse it for cause and effect. This can be used to establish new and
revised objectives for a new and improved system.
Establish the new system's objectives. Objectives should be precise, measurable
statements of business performance that define the expectations for the new
system.
Modify project scope and plan (according to the above).
Review findings and recommendations.
A decision must be made to continue the project as is, to adjust the scope, cost or
schedule, or to cancel the project due to various reasons.
❖ The definition phase. The definition phase answers the question 'What does the user need
and want from a new system?' The fundamental objectives are:
To define business requirements that address problems identified with the current
system.
To define business requirements that exploit opportunities identified with the current
system.
To define business requirements that fulfills directives.
To offer system designers' absolute flexibility with regard to upcoming design
choices.
The following activities must be completed [20]:
Identify requirements.
Model system requirements. Once again, four different models are required,
people, data, activities and networks. Refer to Figure 3.14.
Build discovery prototypes (if necessary).
Prioritise business requirements.
Modify project plan and scope.
Review requirement specifications.
A MMIS in a Steel Industry — A Case Study 29
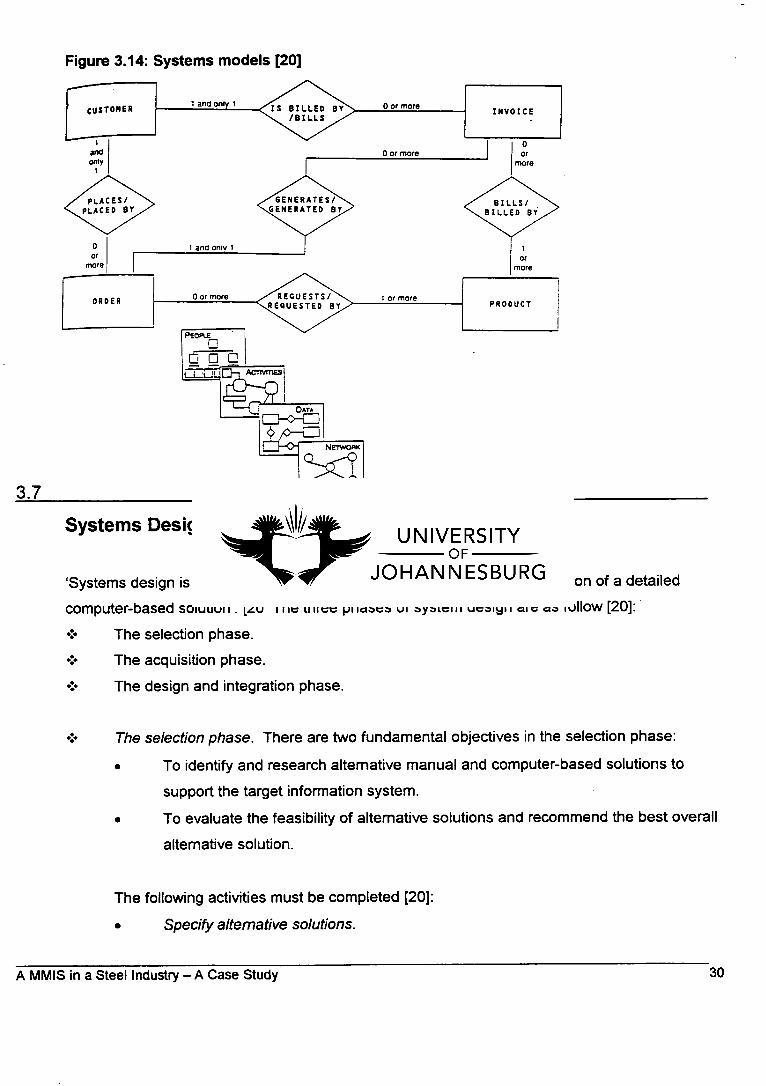
Figure 3.14: Systems models [20]
Systems Design
'Systems design is the evaluation of alternative solutions and the specification of a detailed
computer-based solution'. [20 The three phases of system design are as follow [20]:
The selection phase.
The acquisition phase.
The design and integration phase.
The selection phase. There are two fundamental objectives in the selection phase:
To identify and research alternative manual and computer-based solutions to
support the target information system.
To evaluate the feasibility of alternative solutions and recommend the best overall
alternative solution.
The following activities must be completed [20]:
Specify alternative solutions.
A MMIS in a Steel Industry — A Case Study 30
Analyse feasibility of alternative solutions. Feasibility analyses should not be limited
to costs and benefits. Most analysts use four sets of criteria: technical -, operational
-, economic -, and schedule feasibility. A matrix allows for a side-by-side
comparison of the different analyses of the candidates.
Recommend a system solution. A formal proposal must include project plans, size
estimates, candidate solutions and feasibility analysis.
The acquisition phase. The acquisition of software and hardware is not necessary for all
new systems. When it is necessary it is usually a difficult process. There are four
fundamental objectives:
To identify and research specific products that could support the recommended
solution for the target information system.
To solicit, evaluate and rank vendor proposals.
To select and recommend the best vendor proposal.
To establish requirements for integrating the awarded vendors products.
The activities necessary for this phase [20] are as follow:
Research technical criteria and options.
Solicit proposals from vendors. This requires the preparation of one of two
documents: a request for quotations (RFQ) or a request for proposals (RFP). The
RFQ is used when the choice about a specific product has already been made, and
the RFP when several products exist and competitive proposals and quotes are
invited.
Validate vendor claims and performance.
Evaluate and rank vendor proposals.
Award contract and debrief losing vendors.
Establish integration requirements.
The design and integration phase. This phase involves developing technical design
specifications. The objective of the phase is twofold:
To design a system that both fulfill requirements and are user-friendly.
To present clear and complete specifications to the computer programmers and
technicians.
The specific activities to be completed during this phase are:
A MMIS in a Steel Industry — A Case Study 31
Analyse and distribute data. The data model already developed during systems
analysis must now be refined, in order to have a model that will allow the
development of ideal file and database solutions.
Analyse and distribute processes.
Factor into design units. The above data and process models must be factored into
smaller pieces so that one individual can easily complete the design details.
Design computer files and/or databases.
Design computer outputs and inputs.
Design on-line user interfaces.
Present and review design.
Given the finished design units, two more components must be prepared:
An implementation plan that presents a proposed schedule for the construction and
delivery phase.
A final cost-benefit analysis that determines if the design is still feasible.
3.8
Systems Implementation
'Systems implementation is the construction of the new system and the delivery of that system into
production' [20] The trigger for systems implementation is the technical design statement. The
typical phases of systems implementation are:
❖ To build (or modify) and test networks phase. The fundamental objectives of the phase are
as follows:
To build (or modify) and test networks.
To build (or modify) and test unpopulated databases.
Figure 3.32 shows the activities to be completed [20].
Build and test networks (if necessary).
Build and test databases (if necessary).
A MMIS in a Steel Industry — A Case Study 32
To build and test programs phase. The fundamental objectives of the phase are as follow:
To develop a detailed plan to guide the development and testing of new or revised
computer programs.
To develop computer programs that accurately fulfills business process
requirements.
The most commonly performed activities are as follow [20]:
Plan for programming. The plan should include a review of the design
specifications, organisation of the programming team, and a detailed programming
plan.
Write and test new programs.
To install and test new system phase. The fundamental objectives are:
To install and test new software packages acquired from system vendors.
To conduct a complete system test to ensure the custom-built software and
acquired software packages work together properly.
To develop a detailed plan for converting from the old system to the new system.
The activities are [20]:
Install new software package (if necessary).
Test package (if necessary).
Conduct system test (if necessary).
Prepare conversion plan.
To deliver the new system into operation phase. The following objectives must be
accomplished:
Install files and/ or databases to be used by the new system.
Provide training and documentation for individuals that will be using the new
system.
Convert from the old system to the new system.
Evaluate the project and final system.
The activities are as follow [20]:
Install files and/or databases.
Train system users.
A MMIS in a Steel Industry — A Case Study 33
Convert to new system.
Evaluate project and system.
3.9
Systems Support
'Systems support is the on-going maintenance of a system after it has been placed into operation.
This includes program maintenance and system improvements.' [20] Systems support consists of
four on-going activities [20]:
Correct errors (also called maintenance).
Recover the system.
Assist users of the system.
Adapt the system to new requirements (also called re-engineering) [3].
Systems maintenance. The fundamental objectives are:
To make predictable changes to existing programs to correct errors that were made
during systems design and implementation.
To preserve those aspects of the programs that were already correct.
The steps that must be completed are [20]:
Define and validate the problems.
Benchmark the programs and application.
Understand the application and its programs.
Edit and test the programs.
Update documentation.
System recovery.
The occurrence of a system failure is inevitable. It generally results in an aborted program
and possible loss of data. The systems analyst usually fixes the program or acts as
intermediary between the end-user and those that can fix the problem.
A MMIS in a Steel Industry — A Case Study 34
❖ End-user assistance.
Users will always require additional assistance, no matter how well they have been trained.
The systems analyst will routinely observe the use of the system, conduct user-satisfaction
surveys and meetings, and log enhancement ideas and requests.
• Systems enhancement and reengineering. The objective is to modify or expand the
application system in response to constantly changing requirements. The activities to be
completed are [20]:
Analyse enhancement request.
Write simple, new programs.
Restructure files or databases.
Analyse program library and maintenance costs.
Reengineer and test programs.
3.10
Conclusion
Systems development is not a mechanical activity. There are no magic secrets for success, no
perfect rolls, techniques or methods. Systems analysis is the most critical part of information
systems development. It is during systems analysis that the existing business systems are
investigated, problems understood, and objectives, priorities and business requirements defined.
The quality of any subsequent systems design, implementation and support is dependent on good
systems analysis.
The systems life cycle in the context of this study will take place in a Steel industry. It is therefor
important to understand the industry and the characteristics thereof. The focus of the next chapter
is then the Steel industry and its characteristics.
A MMIS in a Steel Industry — A Case Study 35
CHAPTER FOUR
Characteristics of the Steel Industry
In the previous two chapters both Materials management and Information Systems have been described.
As the MMIS used in the case study is rooted in the Steel Industry, a quick review of the current market
trends and figures will be presented in this chapter. It is important to understand the background against
which Materials Management in this type of environment functions, as the current market trends exert
enormous pressure on continuous improvement capabilities and projects.
4.1
Basic Iron and Steel Industry
During the second quarter of 1998 a decline in the demand for steel products was experienced,
which is expected to continue during the third quarter [24]. During the third quarter, export efforts
will however be supported by the decline in the external value of the Rand. The increase in
interest rates during June 1998 is expected to take a heavy toll on total dispatches by the industry.
4.2
Structural Metal Industry
•:- Pipe Industry
The realisation of certain RDP projects is currently supporting the demand for small bore
pipe, although provincial governments may delay some of their spending due to budgetary
constraints. The absence of major construction projects is expected to curtail the demand
for large bore pipe during the third quarter [24].
❖ Plate and sheet metal works
In the immediate short term, a further decline in the demand for plate and sheet material
can be expected. As activities in this industry are sensitive to high interest rates, the
A MMIS in a Steel Industry — A Case Study 36
demand for drums, barrels, gas cylinders, water tanks, pressure vessels and earthmoving
equipment can only be expected to improve towards the middle of 1999.
4.3
Prospects for the Local Steel Market
A general improvement in total steel demand, within the South African industry, is only expected
towards the latter half of 1999 as high interest rate levels are expected to prevail during the
remainder of 1998. The Asian crisis will be having a severe impact on local steel demand during
the remainder of 1998 [24].
4.4
South African Steel Imports
Steel imports into South Africa increased to 111 770 tons during the first quarter of 1998, and are
expected to remain at a high level during the second quarter. The effects of a weakening and
volatile Rand on imported steel are likely to come into effect during the fourth quarter of this year,
and consequently third quarter imports are also expected to be relatively high [24].
4.5
Domestic Market
The domestic market is characterised by the following [26]:
A continuance of the decline in the demand for steel products from the mining sector for
the short-term.
A decline in the total dispatches to the manufacturing industry.
Punitive interest rates are curtailing activities in the building and construction sectors.
Steel imports remain on high levels.
Total steel demand is expected to decline further.
A MMIS in a Steel Industry — A Case Study 37
Business and consumer confidence is being impeded by the instability of the financial
markets, and therefor an improvement in total steel demand is only expected during the
latter half of 1999.
4.6
International Market
The international markets are however characterised by the following [26]:
The US economy is in its seventh consecutive year of expansion.
The European Union countries are experiencing relatively buoyant conditions in steel
consuming sectors.
The Asian steel prices continue to decline.
The Steel demand in South American countries is also under pressure.
4.7
Conclusion
As can be seen in Table 4.1 [26], the trend in the steel markets for the near future is not going
upwards, but will be decreasing. This chapter focussed on giving information regarding the steel
industry, its current trends, and characteristics. In the context of the study, what is important, is
that the economic situation of most company's within this industry will be of such a nature that
expensive computer systems may be placed on the back burner. The importance of relatively
cheaper systems, still delivering the same information and service, will be rising.
The next chapter describes the research process followed during the case study. It is important to
emphasize that the mini thesis as a whole is a research project, but that the next chapter provides
the guidelines for the specific case study done, as well as research in general.
A MMIS in a Steel Industry — A Case Study 38
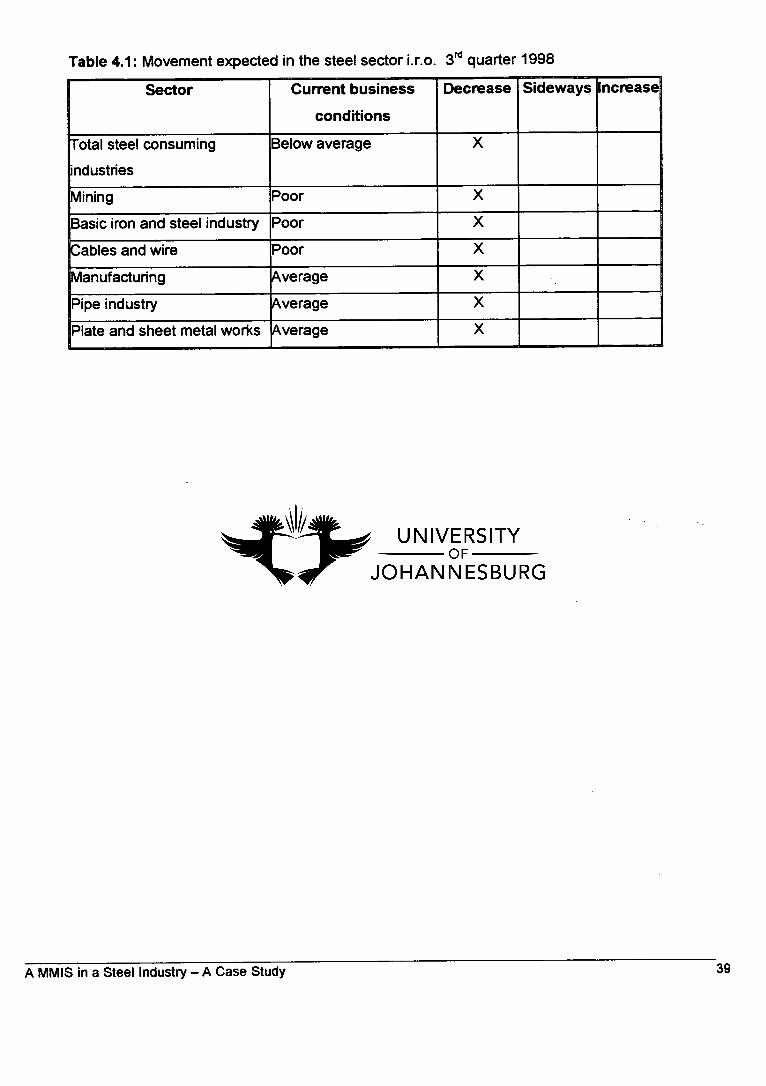
Table 4.1: Movement expected in the steel sector i.r.o. 3 NI quarter 1998
Sector Current business
conditions
Decrease Sideways increase
Total steel consuming
industries
Below average X
Mining Poor X
Basic iron and steel industry Poor X
Cables and wire Poor X
Manufacturing Average X
Pipe industry Average X
Plate and sheet metal works Average X
A MMIS in a Steel Industry — A Case Study 39
CHAPTER FIVE
Business Research
The aim of this chapter is twofold. Firstly to form the basis for chapter six, the case study, and
secondly, to answer the question 'What is research?' and 'How is it done?' In Chapter one the
research objectives for the mini thesis were stated, as well as the plan to arrive at these objectives.
This chapter explains the actual process of doing business research, that it should be properly
planned and executed in order to gain insight into the research objective, and to arrive at a usable
answer. Be that that it is necessary to do more research, or to come to an effective conclusion to
the research question asked.
Where the rest of this mini thesis is investigative research, supplying background information and
sketching the larger picture, this chapter focuses on the actual process followed to evaluate the
system design, as well as making the comparison between the two systems.
5.1
The Nature of Research
The main question in the context of this study is 'What is research in a management setting?' [5] It
can be defined as any organised inquiry carried out to provide information for the solution of a
problem, or, '... is a careful inquiry or examination to discover new information or relationships and
to expand and to verify existing knowledge. It is the manipulation of things, concepts, or symbols
for the purpose of generalising and to extend, correct, or verify knowledge aids in the construction
of a theory or in the practice of an art.' [14]
Research contributes to more effective decisions in all functional areas of business. In research
facts and assumptions are assembled into a basis, for prediction of the outcomes of various
courses of action. The objective may also be to explain the forces that account for a certain
phenomenon. Research opportunities are found in all functional areas of business.
A MMIS in a Steel Industry — A Case Study 40
Applied research has value only to the extent that it assists management to make better decisions
[6]. It is the objective of this study to make a contribution to any manager's/decision maker's task
of choosing between a custom- or commercial MIS system.
The broadening of interest in more scientific decision making has been fostered by two factors:
The manager's increased need for more and better information, and
The availability of imported techniques to meet this need.
All managers face a 'make or buy' research situation from time to time. They often are ill equipped
to either [6]
Perform the data gathering and analysis job themselves, or to
Judge whether good value is received from the research.
For either situation a manager needs an understanding of the process of research design and
implementation.
5.2
Measurement
Measurement is the process by which hypothesis and theories are tested [6]. From a hypothesis is
deduced that certain conditions should exist in the real world, thereafter a measurement must be
put in place to ascertain whether these conditions do exist. If the conditions are found, they lend
support to the hypothesis, if not, the hypothesis is proved false. An important question is 'Just
what does one measure?'
Concepts used in research may be classified into objects and properties. Objects include the
'things' of ordinary experience, such as tables. People, books. Objects also include things, which
are not so concrete, such as attitudes, neurons and peer group pressures. Properties, on the
other hand, are the characteristics of the objects. For example, a man's physical properties may
be stated in terms of his weight, height and posture.
These and many other properties can be of measurement interest in a research study. Not only is
it a challenge to measure such constructs, but the researcher may find little agreement that the
A MMIS in a Steel Industry — A Case Study 41
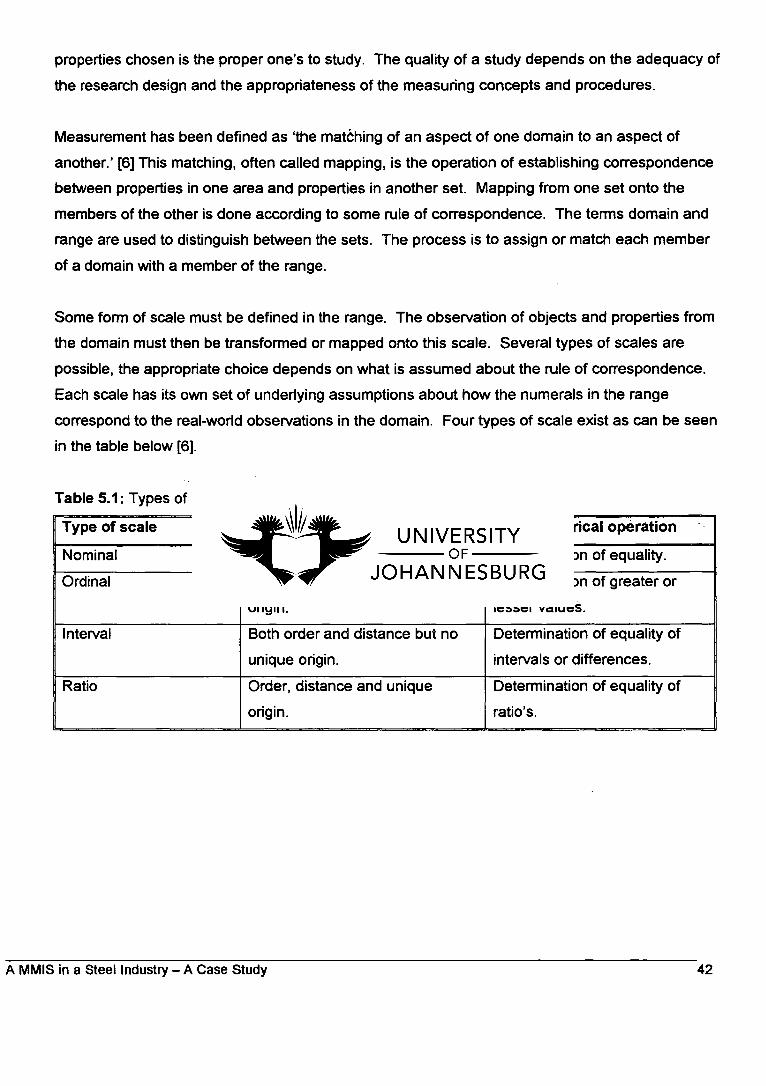
properties chosen is the proper one's to study. The quality of a study depends on the adequacy of
the research design and the appropriateness of the measuring concepts and procedures.
Measurement has been defined as 'the matching of an aspect of one domain to an aspect of
another.' [6] This matching, often called mapping, is the operation of establishing correspondence
between properties in one area and properties in another set. Mapping from one set onto the
members of the other is done according to some rule of correspondence. The terms domain and
range are used to distinguish between the sets. The process is to assign or match each member
of a domain with a member of the range.
Some form of scale must be defined in the range. The observation of objects and properties from
the domain must then be transformed or mapped onto this scale. Several types of scales are
possible, the appropriate choice depends on what is assumed about the rule of correspondence.
Each scale has its own set of underlying assumptions about how the numerals in the range
correspond to the real-world observations in the domain. Four types of scale exist as can be seen
in the table below [6].
Table 5.1: Types of scale
Type of scale Characteristics of scale Basic empirical operation
Nominal No order, distance or origin. Determination of equality.
Ordinal Order but no distance or unique
origin.
Determination of greater or
lesser values.
Interval Both order and distance but no
unique origin.
Determination of equality of
intervals or differences.
Ratio Order, distance and unique
origin.
Determination of equality of
ratio's.
A MMIS in a Steel Industry — A Case Study
42
The ideal study should be designed and controlled for precise and unambiguous measurement of
the variables of interest. Since attainment of this ideal is unlikely, the sources of potential error
must be recognised and an attempt made to eliminate, neutralise or otherwise deal with it. Any
variation of score among the respondents should reflect true differences in their opinions.
However, four major error sources may contaminate the results [6].
The respondent as an error source
Opinion differences will come from certain characteristics of the respondent, such as
employee status, social class, traumatic experiences, reluctance to express negative
feelings, fatigue, boredom, etc.
Situational factors
Any condition that places a strain on the study can have serious effects on the outcome. If
the respondent feels that anonymity is not assured, a reluctance to express negative
feelings may be experienced.
The measurer as an error source
Careless mechanical processing — checking of the wrong response — can distort findings.
Incorrect coding, careless tabulation, and faulty statistical calculation can all have an
influence.
The measurement instrument as an error source
First it can be too confusing and ambiguous. The use of complex syntax and words
beyond comprehension is typical. A second deficiency is poor sampling of the universe of
items of concern. Seldom does the instrument explore all of the important issues.
What are the characteristics of a good measurement tool? It should be [6]:
An accurate counter or indicator of what is being measured.
Easy and efficient to use.
That is, it should be valid, reliable and practical.
A MMIS in a Steel Industry — A Case Study 43
Validity
This is the ability of a measurement tool to measure what is supposed and designed to measure.
It is the extent to which differences found with a measuring tool reflect true differences among
those being tested. This is difficult to ascertain as the differences are not known, which is the
precise reason for it being measured. One way to approach this question is to organise the
answer according to types of validity: content, criterion-related and construct.
Content validity is the extent to which it provides adequate coverage of the topic under study. If
the instrument contains a representative sample of the universe of subject matter of interest, then
content validity is good.
Criterion-related validity reflects the success of measures used for some empirical estimating
purposes. An opinion questionnaire, which correctly forecasts the outcome of an event, has
predictive validity.
Construct validity measures the presence of abstract characteristics for which no empirical
validation seems possible. In attempting to determine construct validity a set of other propositions
are associated with the results from measuring tool under consideration. If the measurements
correlate with each other, there is construct validity.
Reliability
A measure is reliable to the degree that it supplies consistent results. Reliability is concerned with
estimates of the degree to which a measurement is free of random or unstable error. It is not as
valuable as validity, but is much easier to assess. It is also frequently the only characteristic that
can be assessed.
Practicality
The scientific requirements of a project call for the measurement process to be reliable and valid,
while the operational requirements call for it to be practical.
The task facing the researcher is to arrive at an understanding of the major concepts of the study
and to measure their existence in some acceptable way. This calls for operational definitions of
these concepts and the translation into effective measurement procedures. This process consist
of four steps [6]:
A MMIS in a Steel Industry — A Case Study 44

Concept development.
Dimension specification.
Selection of observable indicators.
Combination of these indicators into indexes.
Concept development
Before a measurement tool can be developed, there must first be decided what it is that must be
measured. The concept to be measured, in the context of this study, is the list of features, which
should be included in an effective management information system, as described in paragraph 3.3.
Refer to Table 5.1, column 1.
Dimension specification
The various dimensions of the concepts under study should be specified either by empirical
correlation, or through deduction. Factor analysis or other statistical techniques may also be used
to determine concept components. Refer to Table 5.1, column 2.
Selection of indicators
Once the dimensions have been settled, indicators must be developed to measure each concept
element. Indicators are particular questions, scales, statistical measures, or other devices by
which the study concepts can be measured. For this study indicators must be selected to express
how the personnel working in the Industry section view the information system available versus the
custom system on test. Refer to Table 5.1, column 3.
Formation of indexes
When there are several dimensions of a concept, or different measures of a dimension, they
should be combined into an index. Use of more than one indicator lends stability to the scores and
improves the validity. Refer to Table 5.1, column 4.
A MMIS in a Steel Industry — A Case Study 45
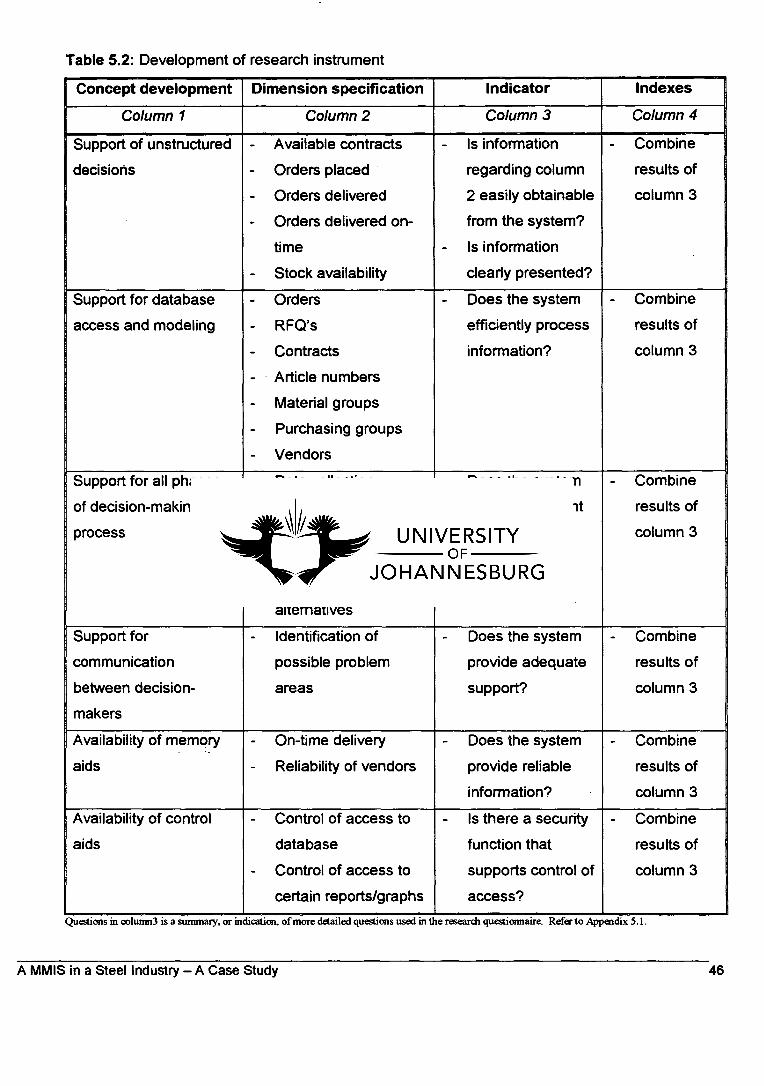
Table 5.2: Development of research instrument
Concept development Dimension specification Indicator Indexes
Column 1 Column 2 Column 3 Column 4
Support of unstructured
decisions
- Available contracts
- Orders placed
- Orders delivered
- Orders delivered on-
time
- Stock availability
- Is information
regarding column
2 easily obtainable
from the system?
- Is information
clearly presented?
- Combine
results of
column 3
Support for database
access and modeling
- Orders
- RFQ's
- Contracts
- Article numbers
- Material groups
- Purchasing groups
- Vendors
- Does the system
efficiently process
information?
- Combine
results of
column 3
Support for all phases
of decision-making
process
- Data collection
- Choosing between
alternatives
- Simulation of results
of weighing of
alternatives
- Does the system
provide sufficient
graphs and
reports?
- Combine
results of
column 3
Support for
communication
between decision-
makers
- Identification of
possible problem
areas
- Does the system
provide adequate
support?
- Combine
results of
column 3
Availability of memory
aids
- On-time delivery
- Reliability of vendors
- Does the system
provide reliable
information?
- Combine
results of
column 3
Availability of control
aids
- Control of access to
database
- Control of access to
certain reports/graphs
- Is there a security
function that
supports control of
access?
- Combine
results of
column 3
Questions in column3 is a summary, or indication, of more detailed questions used in the research questionnaire. Refer to Appendix 5.1.
A MMIS in a Steel Industry — A Case Study 46
5.3
Data Collection
Sampling
The basic idea in sampling is that the analysis of some of the elements in a population provides
useful information on the entire population [6]. An element is the subject on which the
measurement is being taken, it is the unit of study. The population is the total collection of
elements about which inferences are made.
Sampling is based on two premises [6]. One is that there is enough similarity among the elements
in a population that a few of these elements will adequately represent the characteristics of the
total population.
Deming argues that the quality of a study is often better with sampling than with a census. He
suggests that 'Sampling possesses the possibility of better interviewing (testing), more thorough
investigation of missing, wrong or suspicious information, better supervision, and better processing
than is possible with complete coverage' [6]
Sampling also provides much quicker results than does a census. The speed of execution
minimises the time between the recognition of a need for information and the availability of that
information. Then, too, some situations require sampling. For example, when materials must be
destroyed in order to be tested. Sampling is also the only procedure possible if the population is
infinite.
Members of a sample may not fully represent the population, and values calculated from sample
data may vary from the population values. While some sample items underestimate the
parameter, others overestimate it. When the sample is drawn properly, variations in item values
tend to counteract each other. This counteraction results in a statistic (sample value) that is
generally close to the parameter (population value). For this effect, however, it is necessary:
That there be enough members in the sample, and
They must be drawn in a way to favor neither the overestimating nor the underestimating
tendencies.
A MMIS in a Steel Industry — A Case Study 47
The ultimate test of a sample design is how well it represents the characteristics of the population
it represents. In measurement terms the sample must be valid. Validity of a sample depends
upon two considerations [6]:
Accuracy. This is defined as the degree to which bias is absorbed from the sample. The
variance in measures due to some known or unknown influences that cause the score to
lean in some direction more than another has been counteracted in an accurate sample.
Precision. A second criterion of a good sample is precision of estimate. No sample will
fully represent its population in all respects. A sample statistic may be expected to differ
from its parameter as a result of random fluctuations inherent in the sampling process. It is
however desirable that the sample design produce a minimum error of estimate.
Sample size can be determined in two ways, neither of which will be discussed in full. One way is
to choose some sample size on a judgmental basis and then determine how much precision is
secured. A second approach is to determine the acceptable degree of precision and from that
determine the necessary size of sample.
Cost considerations are also often incorporated into the sample size decision.
The sample group used to test the MMIS, also has access to SAP, and uses the LIS module on a
regular basis. The sample group comes from the Materials Management environment within a
steel industry. This group is not representative of the entire steel industry, and does not cover any
other industry. The reason for exclusion is that the thesis concentrates on the specific part of an
industry. A questionnaire was supplied with the software, which everyone in the group had to
complete.
Survey Instrument Design
There are three strategic decisions that strongly affect the design of a survey instrument [6]:
The communication method chosen by which to conduct the questioning.
The degree of structure that is imposed on the questioning and response processes.
The degree to which the objectives of the study are to be disguised.
A MMIS in a Steel Industry - A Case Study 48

Communication method. Communication interactions between researcher and respondent are
either personal, impersonal or mixed in nature. The personal mode involves a one-on-one
relationship between interviewer and interviewee, where questions are asked and answered in a
structured way and recorded as such. In the impersonal mode the researcher depends upon a
printed instrument to carry the communication task. This instrument, a questionnaire, carries both
the instructions and questions to respondents, and provides space for them to complete their
answers. In the mixed mode, both of the above are utilised. In this project the questionnaire will
be used to gather information.
Process structure. With structured questioning the interviewer asks questions in a standardised
format and sequence. This makes it easier to develop a standard line of questioning that builds on
prior responses. In this study the process of questions and answers will be structured by the fact
that the questionnaire is prepared in advance and distributed with the program to the team
members.
Objective disguise. The decision to disguise the objective of a study depends on the type of
information required. When information is asked for at a conscious level, it is not necessary to
disguise the objective. When someone is asked for information which they are unwilling to
provide, it is necessary to disguise the questions and objective.
Instrument development process. The process of moving from the general management objective
or problem to specific measurement questions goes through four major question levels:
The management question — that problem which the manager must answer.
The research question — that basic information question(s) which the researcher must
answer in order to contribute to the solution of the management question.
The investigative questions — those specific questions which the researcher must ask
herself in order to answer the research question. There may be several levels of questions,
ranging from general to specific.
The measurement questions — those questions which respondents must answer if the
researcher is to gather the needed information.
These questions, as used in the research questionnaire, Appendix 5.1, can be summarised as
follow [6]:
A MMIS in a Steel Industry — A Case Study 49
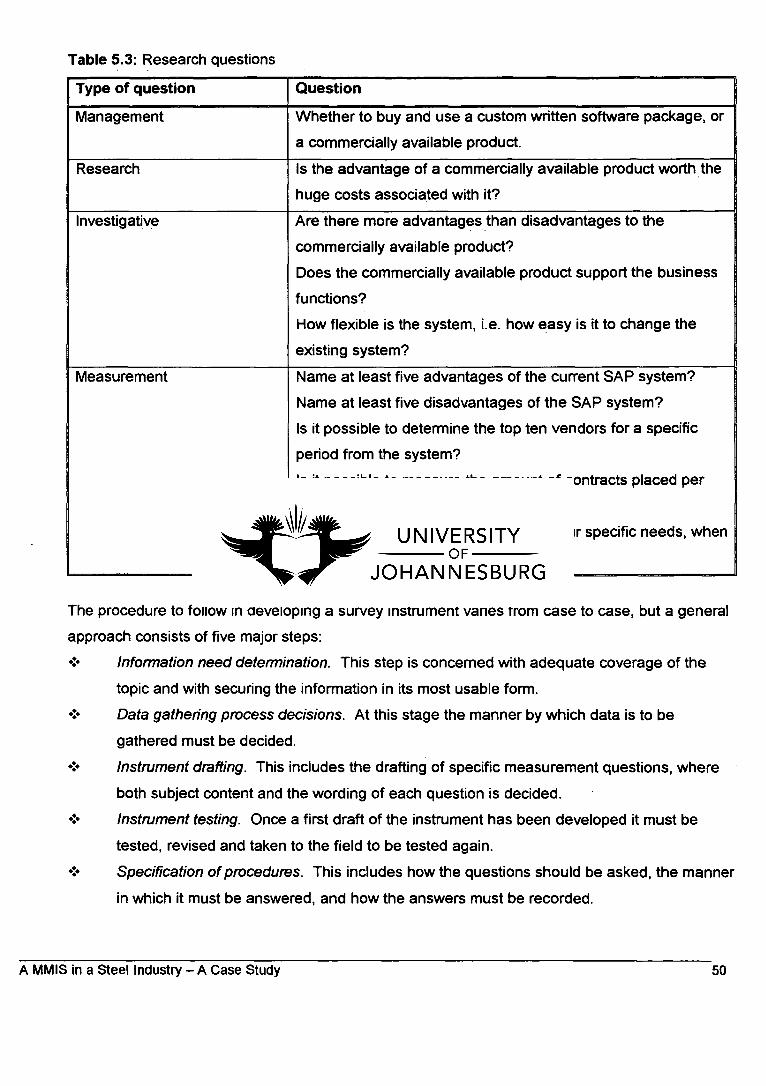
Table 5.3: Research questions
Type of question Question
Management Whether to buy and use a custom written software package, or
a commercially available product.
Research Is the advantage of a commercially available product worth the
huge costs associated with it?
Investigative Are there more advantages than disadvantages to the
commercially available product?
Does the commercially available product support the business
functions?
How flexible is the system, i.e. how easy is it to change the
existing system?
Measurement
L
Name at least five advantages of the current SAP system?
Name at least five disadvantages of the SAP system?
Is it possible to determine the top ten vendors for a specific
period from the system?
Is it possible to measure the amount of contracts placed per
buyer for a period?
Has the system been adapted to suit your specific needs, when
required to?
The procedure to follow in developing a survey instrument vanes from case to case, but a general
approach consists of five major steps:
Information need determination. This step is concerned with adequate coverage of the
topic and with securing the information in its most usable form.
Data gathering process decisions. At this stage the manner by which data is to be
gathered must be decided.
Instrument drafting. This includes the drafting of specific measurement questions, where
both subject content and the wording of each question is decided.
Instrument testing. Once a first draft of the instrument has been developed it must be
tested, revised and taken to the field to be tested again.
Specification of procedures. This includes how the questions should be asked, the manner
in which it must be answered, and how the answers must be recorded.
A MMIS in a Steel Industry — A Case Study 50

5.4
Conclusion
Business research is a set of conceptual tools and techniques that enables a manager or
researcher to plan and execute a research project. This chapter aimed to give a broad outline of
these tools and techniques that were used to arrive at the research objective, as well as the
research questionnaire. In the following chapter the system created and written will be discussed,
where after the findings will be presented in chapter seven.
A MMIS in a Steel Industry — A Case Study 51
CHAPTER SIX
Case Study
The previous chapters described and gave detailed information regarding Materials Management,
Information Systems, the Steel industry, and methods of Business Research. This chapter will focus on
how they combine when a Materials Management Information System (MMIS) is investigated. The
knowledge gained from the previous chapters is applied in a production environment, especially the
systems development life cycle, as explained in Chapter 3. The results of the case study design are
presented in this chapter.
6.1
Opportunity
It is important that managers have access to timely and correct information. Within Materials
Management it is necessary to have information regarding vendors, the total quantity of orders
placed, invoice value of these orders, contracts being entered into and stock value. Materials
Management main activities can be broken down into the following subdivisions:
Order placement (including the issuing RFQ's);
Contract allocation;
Stock control;
Receiving of goods ordered;
Issuing of goods to end-users;
Vendor management;
Measurement of all of the above.
Materials Management needs to ask questions regarding all of the above, and the MMIS must be
able to answer them effectively and efficiently. The following is a summation of the relevant main
characteristics of the MMIS system and the SAP (LIS) system.
A MMIS in a Steel Industry — A Case Study 52
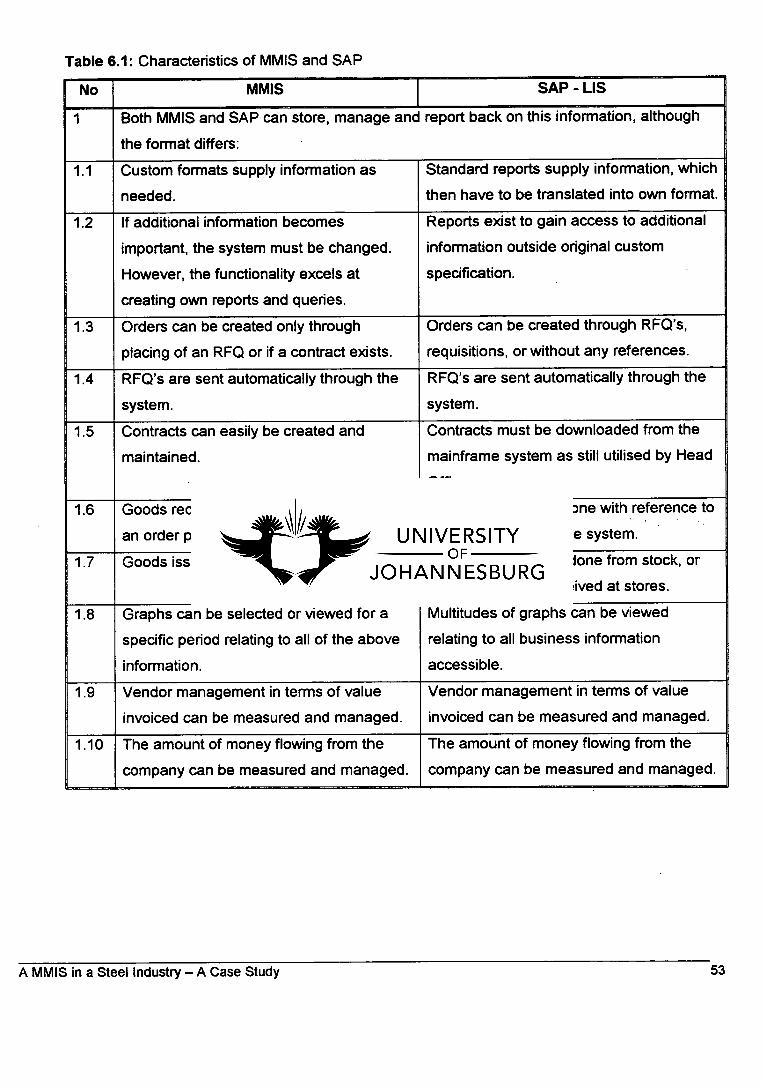
Table 6.1: Characteristics of MMIS and SAP
No MMIS SAP - LIS
1 Both MMIS and SAP can store, manage and report back on this information, although
the format differs:
1.1 Custom formats supply information as
needed.
Standard reports supply information, which
then have to be translated into own format.
1.2 If additional information becomes
important, the system must be changed.
However, the functionality excels at
creating own reports and queries.
Reports exist to gain access to additional
information outside original custom
specification.
1.3 Orders can be created only through
placing of an RFQ or if a contract exists.
Orders can be created through RFQ's,
requisitions, or without any references.
1.4 RFQ's are sent automatically through the
system.
RFQ's are sent automatically through the
system.
1.5 Contracts can easily be created and
maintained.
Contracts must be downloaded from the
mainframe system as still utilised by Head
Office.
1.6 Goods receipts are done with reference to
an order placed on the system.
Goods receipts are done with reference to
an order placed on the system.
1.7 Goods issue is done from stock in store. Goods issue can be done from stock, or
direct purchases received at stores.
1.8 Graphs can be selected or viewed for a
specific period relating to all of the above
information.
Multitudes of graphs can be viewed
relating to all business information
accessible.
1.9 Vendor management in terms of value
invoiced can be measured and managed.
Vendor management in terms of value
invoiced can be measured and managed.
1.10 The amount of money flowing from the
company can be measured and managed.
The amount of money flowing from the
company can be measured and managed.
A MMIS in a Steel Industry — A Case Study
53
6.2
Project/Case Study Scope and Exclusions
Scope
The MMIS, as written, is not intended for full-time use in a production environment. The
system is solely for comparison with the commercial system already in use. Both systems
will be subjected to the same set of standards and objectives, and a conclusion derived.
Exclusions
Tracking system for TCO models not included in scope of project. Furthermore the cost
code analysis was excluded as not being part of Materials Management's core business.
Relationship between problem and solution
The 'problem' or 'opportunity' as defined in paragraph 4.2 centers around whether
management must make a decision to:
Buy a commercially available system at an enormous cost, but with the
accompanying benefits and risks, or
Write a custom software system at a lower cost, but with its accompanying benefits
and risks.
The measurement devices must be of such a nature that the outcome enables
management to make a decision, or must at least show that no appreciable difference
exists.
6.3
Definition of Solution
Product Solution
A system was designed by using Microsoft Access 97. This package ensures readily
available support form Microsoft and is not unduly expensive. The system provides for
information to be stored in a database, with access to various reports and graphs. Seen
against the background of the main Materials Management activities, the system makes
A MMIS in a Steel Industry — A Case Study 54
provision to either place an order through issuing an RFQ, or through an existing supply
contract. Stock control is exercised by drawing a report showing all stocks available in the
store, which is updated as goods are received or issued. Using a detailed report can
separately monitor the receiving of goods, and the subsequent issuing thereof. Vendor
management and control is made possible by a report showing the top five vendors, as
measured by amount paid out to them during the month. A complete set of measurement
graphs is available to supply control aids for the responsible managers.
Refer to Appendix 6.1 for a detailed discussion, as well as Appendix 6.4 for user manual.
Process Solution
The low-level flow charts, Figure 6.1, show the process followed in the programming.
IT Technical Solution
It is not necessary to invest in a large network or hardware in order to implement the
software. Current computers and networks that are available and running on Windows and
Office can be utilised.
6.4
Systems Benefits
The benefits of the two systems can be seen summarised in Table 6.4. Although some are mutual
to both systems, quite a lot can only be seen as an advantage of one of the systems. Where the
smaller system may be easier to implement, the larger system supports the total business
requirement, etc.
A MMIS in a Steel Industry — A Case Study 55
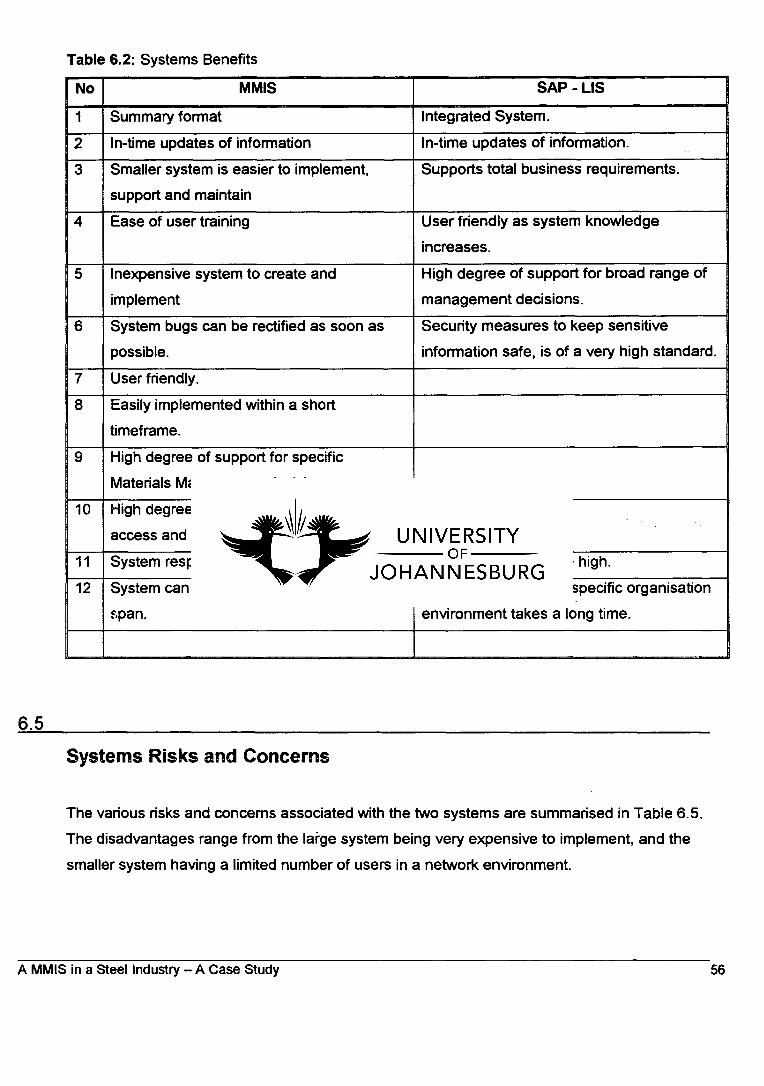
Table 6.2: Systems Benefits
No MMIS SAP - LIS
1 Summary format Integrated System.
2 In-time updates of information In-time updates of information.
3 Smaller system is easier to implement,
support and maintain
Supports total business requirements.
4 Ease of user training User friendly as system knowledge
increases.
5 Inexpensive system to create and
implement
High degree of support for broad range of
management decisions.
6 System bugs can be rectified as soon as
possible.
Security measures to keep sensitive
information safe, is of a very high standard.
7 User friendly.
8 Easily implemented within a short
timeframe.
9 High degree of support for specific
Materials Management decisions
10 High degree of support for database access and —modeling.
11 System response time high. System response time high.
12 System can be developed in a short time
span.
System adaptation to specific organisation
environment takes a long time.
6.5
Systems Risks and Concerns
The various risks and concerns associated with the two systems are summarised in Table 6.5.
The disadvantages range from the large system being very expensive to implement, and the
smaller system having a limited number of users in a network environment.
A MMIS in a Steel Industry — A Case Study
56
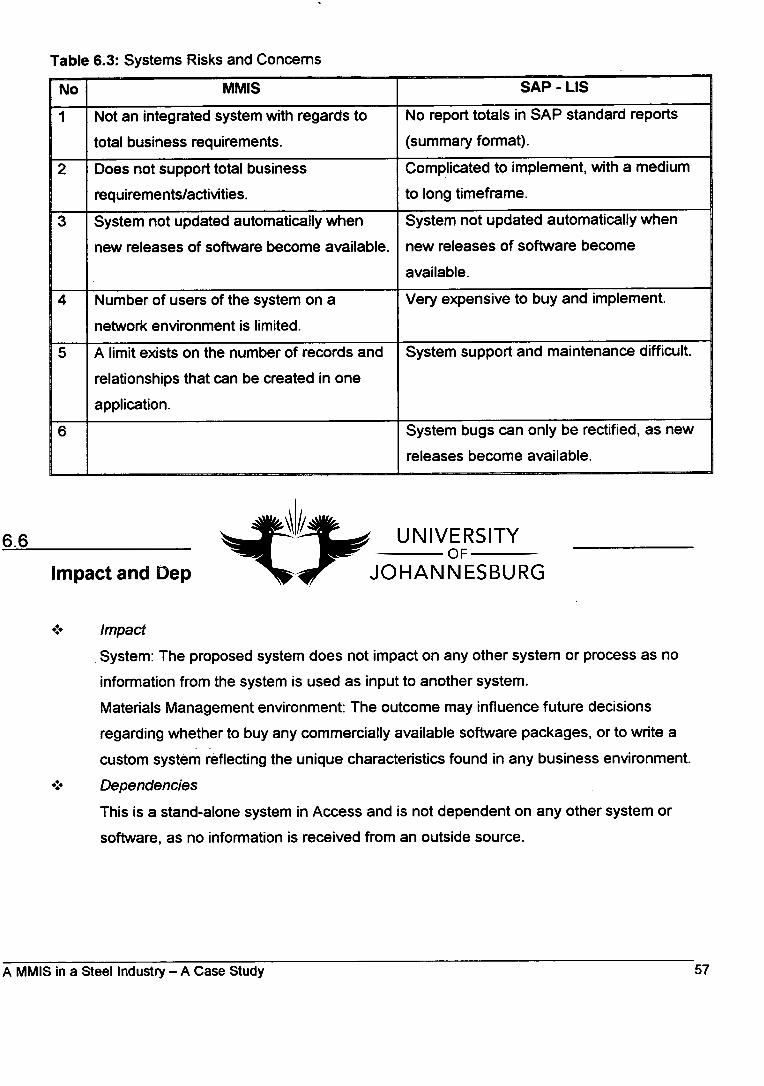
Table 6.3: Systems Risks and Concerns
No MMIS SAP - LIS
1 Not an integrated system with regards to
total business requirements.
No report totals in SAP standard reports
(summary format).
2 Does not support total business
requirements/activities.
Complicated to implement, with a medium
to long timeframe.
3 System not updated automatically when
new releases of software become available.
System not updated automatically when
new releases of software become
available.
4 Number of users of the system on a
network environment is limited.
Very expensive to buy and implement.
5 A limit exists on the number of records and
relationships that can be created in one
application.
System support and maintenance difficult.
6 System bugs can only be rectified, as new
releases become available.
6.6
Impact and Dependencies
Impact
System: The proposed system does not impact on any other system or process as no
information from the system is used as input to another system.
Materials Management environment: The outcome may influence future decisions
regarding whether to buy any commercially available software packages, or to write a
custom system reflecting the unique characteristics found in any business environment.
Dependencies
This is a stand-alone system in Access and is not dependent on any other system or
software, as no information is received from an outside source.
A MMIS in a Steel Industry — A Case Study 57
6.7
Key Assumptions
To simplify the process, for first-order analysis purposes, Materials Management is seen as an
independent module, whereas in the business environment there is definitely interaction with
Finance, Production and Marketing.
6.8
Systems Diagrams
'Data modeling is a technique for organising and documenting a system's data' [20]. There are
numerous data modeling tools, an example is entity relationship diagrams. An entity relationship
diagram (ERD) is 'a data modeling tool that depicts the associations among different categories of
data within an information system' [20]. ERD's describe the logical requirements for a system.
These models are analysed to structure data so that it is flexible, non-redundant, and easy to
understand. Refer to Appendix 6.2 for low-level diagrams of the MMIS system.
6.9
Systems Characteristics
As described in Appendix 6.1 the system consists of various databases, forms, tables, queries and
reports. All of these are interrelated to each other, and updates information as new inputs are
made into the system. Refer to Appendix 6.3 for an example as was used in the MMIS system.
A MMIS in a Steel Industry — A Case Study 58

6.10
Conclusion
Taken into account the business environment, and the research objective, a syttem was
developed within certain limits. This chapter described the scope, exclusions, and the system
solution devised. This system was used in the research to ascertain whether future Materials
Management systems should be bought ready to use, custom written, or if the question requires
further research.
A MMIS in a Steel Industry — A Case Study 59
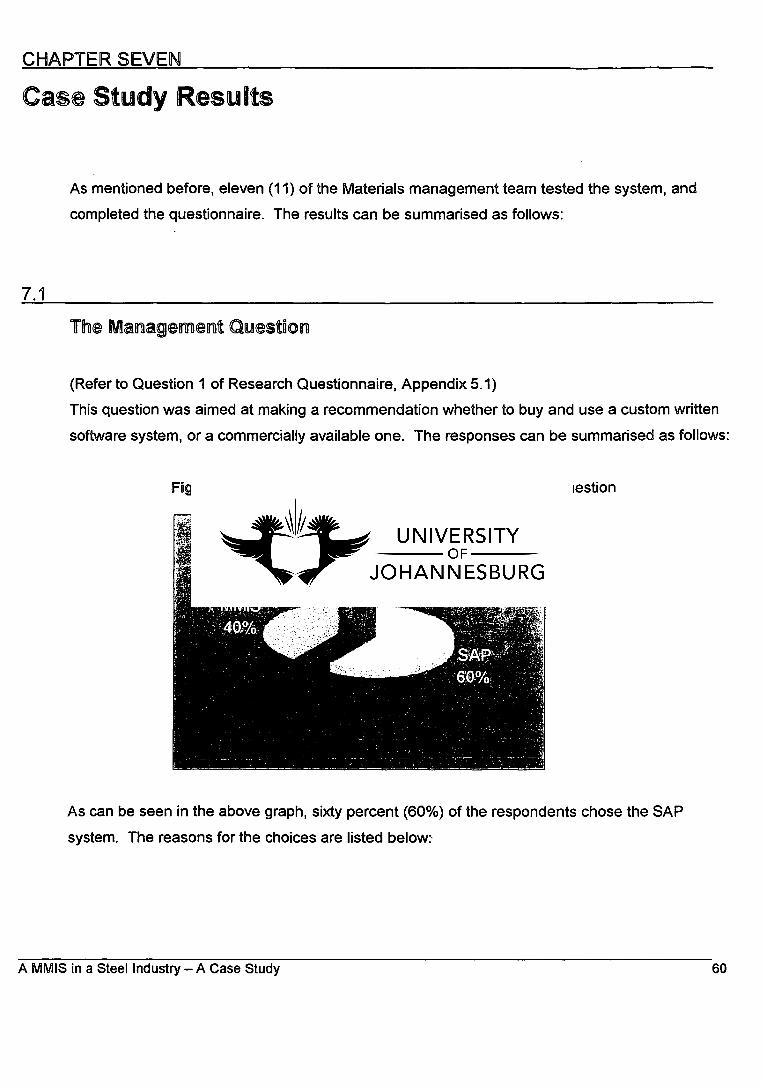
CHAPTER SEVEN
Ca Study esults
As mentioned before, eleven (11) of the Materials management team tested the system, and
completed the questionnaire. The results can be summarised as follows:
7.1
The Management 41)
111
(Refer to Question 1 of Research Questionnaire, Appendix 5.1)
This question was aimed at making a recommendation whether to buy and use a custom written
software system, or a commercially available one. The responses can be summarised as follows:
Figure 7.1: Representation of response to management question
As can be seen in the above graph, sixty percent (60%) of the respondents chose the SAP
system. The reasons for the choices are listed below:.
A MMIS in a Steel Industry — A Case Study 60
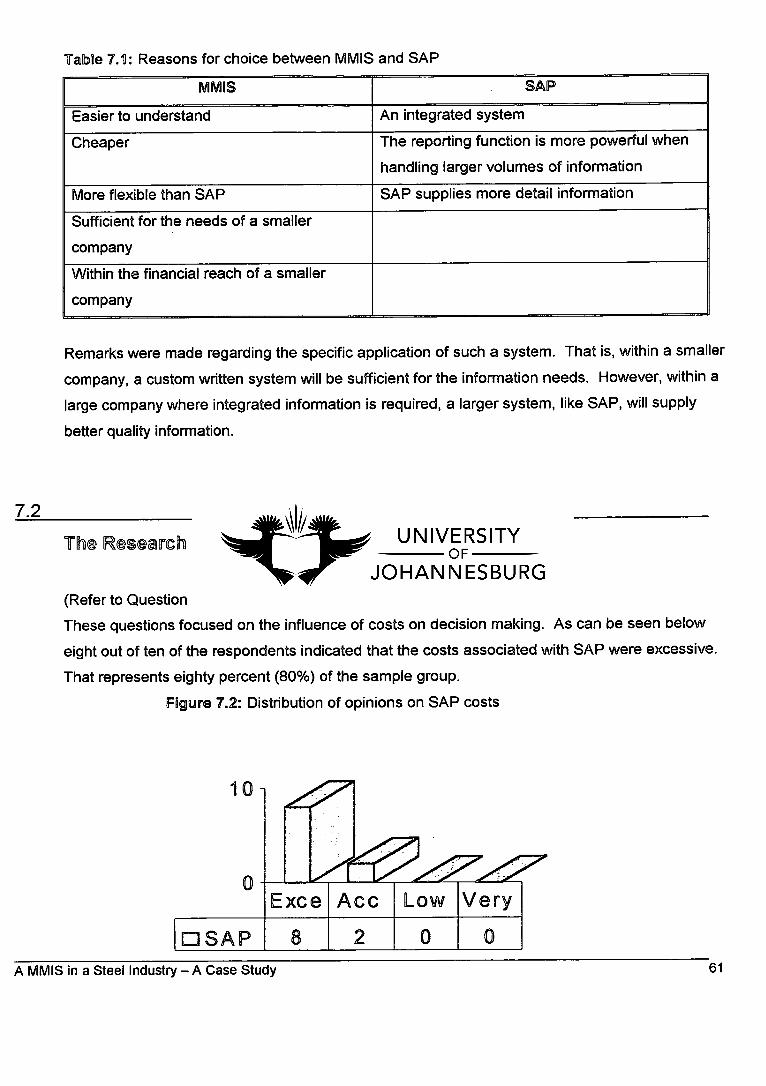
Table 7.1: Reasons for choice between MMIS and SAP
MMIS SAP
Easier to understand An integrated system
Cheaper The reporting function is more powerful when
handling larger volumes of information
More flexible than SAP SAP supplies more detail information
Sufficient for the needs of a smaller
company
Within the financial reach of a smaller
company
Remarks were made regarding the specific application of such a system. That is, within a smaller
company, a custom written system will be sufficient for the information needs. However, within a
large company where integrated information is required, a larger system, like SAP, will supply
better quality information.
7.2
The Research Chilesbon
(Refer to Question 14 and 15 of Research Questionnaire, Appendix 5.1)
These questions focused on the influence of costs on decision making. As can be seen below
eight out of ten of the respondents indicated that the costs associated with SAP were excessive.
That represents eighty percent (80%) of the sample group.
Figure 7.2: Distribution of opinions on SAP costs
A MMIS in a Steel Industry — A Case Study 61
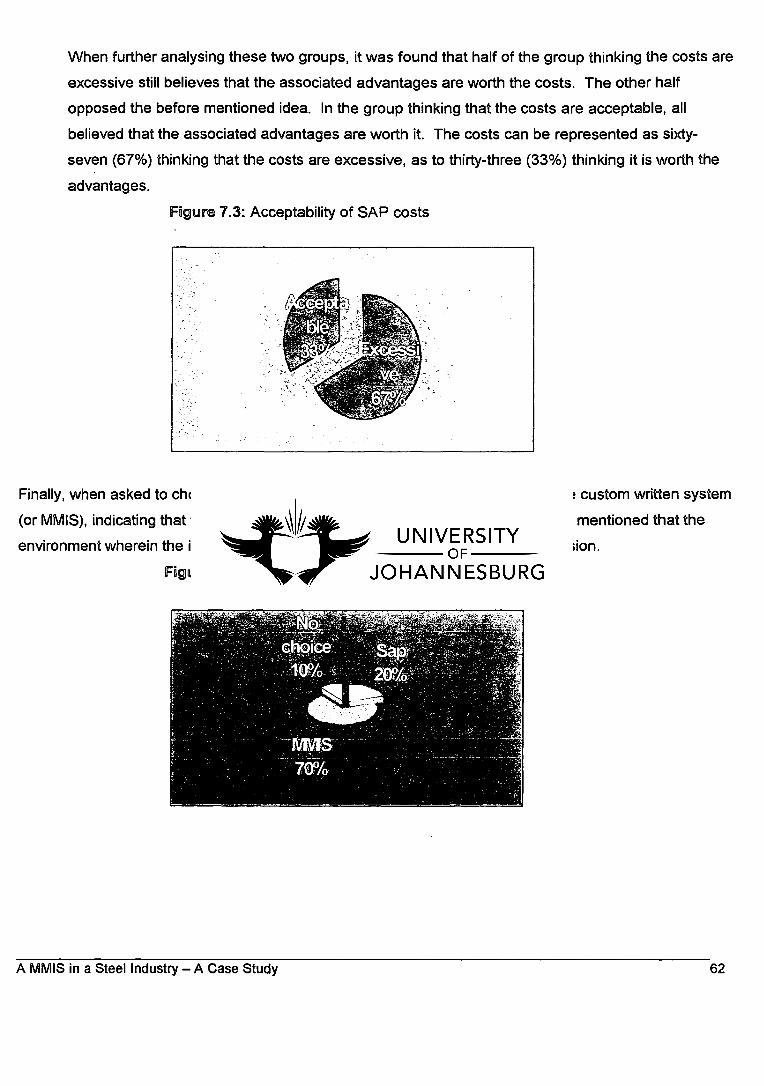
When further analysing these two groups, it was found that half of the group thinking the costs are
excessive still believes that the associated advantages are worth the costs. The other half
opposed the before mentioned idea. In the group thinking that the costs are acceptable, all
believed that the associated advantages are worth it. The costs can be represented as sixty-
seven (67%) thinking that the costs are excessive, as to thirty-three (33%) thinking it is worth the
advantages.
Figure 7.3: Acceptability of SAP costs
Finally, when asked to choose between the two systems, seventy (70%) chose the custom written system
(or MMIS), indicating that the costs play a role in the decision process. It was also mentioned that the
environment wherein the information is used is an important influence on the decision.
Figure 7.4: Distribution of decision between SAP and MMIS
A MMIS in a Steel Industry — A Case Study 62
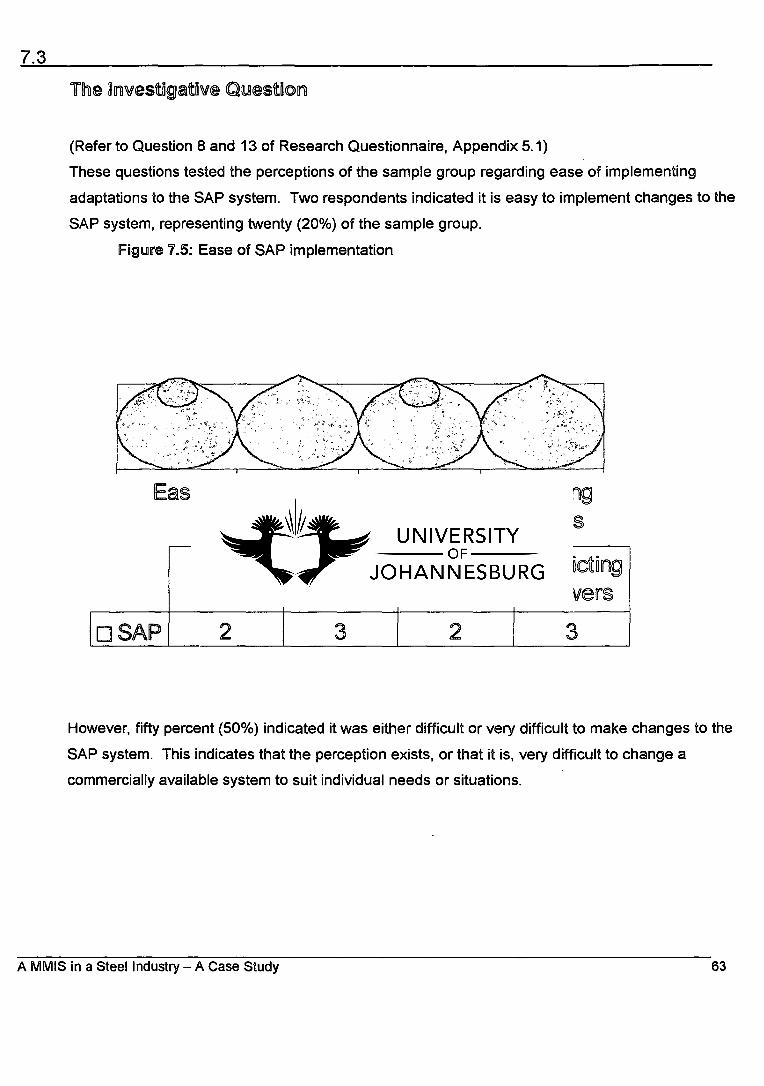
Very difficult
Conflicting ns ers
E Sy Difficult
p SAP 2 3 2 3
7.3
The investigative Question
(Refer to Question 8 and 13 of Research Questionnaire, Appendix 5.1)
These questions tested the perceptions of the sample group regarding ease of implementing
adaptations to the SAP system. Two respondents indicated it is easy to implement changes to the
SAP system, representing twenty (20%) of the sample group.
Figure 7.5: Ease of SAP implementation
E sy
Difficult
Very Conflicting difficult ans ers
However, fifty percent (50%) indicated it was either difficult or very difficult to make changes to the
SAP system. This indicates that the perception exists, or that it is, very difficult to change a
commercially available system to suit individual needs or situations.
A MMIS in a Steel Industry — A Case Study 63
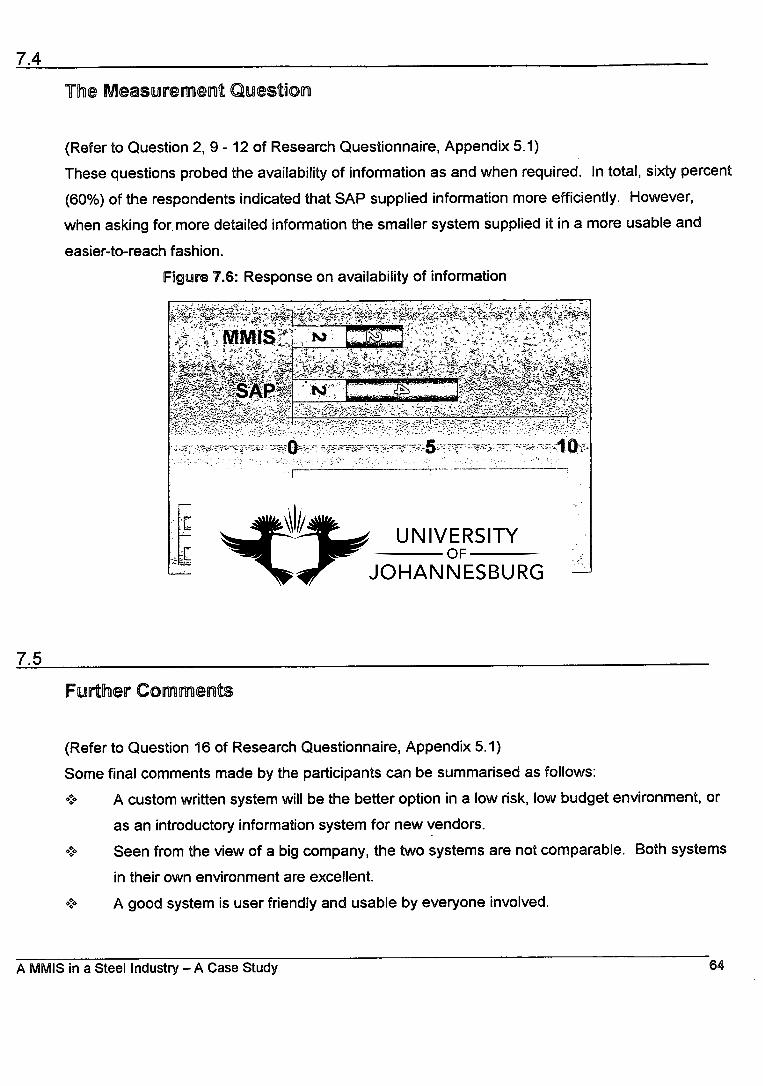
ow.
7.4
The easurement Question
(Refer to Question 2, 9 - 12 of Research Questionnaire, Appendix 5.1)
These questions probed the availability of information as and when required. In total, sixty percent
(60%) of the respondents indicated that SAP supplied information more efficiently. However,
when asking for. more detailed information the smaller system supplied it in a more usable and
easier-to-reach fashion.
Figure 7.6: Response on availability of information
7.5
Further Comments
(Refer to Question 16 of Research Questionnaire, Appendix 5.1)
Some final comments made by the participants can be summarised as follows:
A custom written system will be the better option in a low risk, low budget environment, or
as an introductory information system for new vendors.
Seen from the view of a big company, the two systems are not comparable. Both systems
in their own environment are excellent.
A good system is user friendly and usable by everyone involved.
A MMIS in a Steel Industry — A Case Study 64

7.6
Conclusion
The most important conclusion is that while the smaller, custom written system is not ideally suited
for every application within a larger company, it will be well suited to a smaller company with less
integrated system needs.
The financial considerations also play a large role as it definitely influences the final decision: The
smaller system will suit a smaller company and so also the commercially available system a larger
company.
Ease of adaptation is definitely in favor of the smaller system, and detailed information on certain
subjects is more easily available on these types of systems.
A MMIS in a Steel Industry — A Case Study 65
CHAPTER EIGHT
Conclusion
In the first chapter a problem was defined that had to be solved during the ensuing investigation.
The question was defined as being whether it is better to buy a commercially available software
system off the shelve, or to design a custom written system for the business.
In order to solve this question research was done regarding materials management, the steel
industry, systems development and business research methods. It is shown that Materials
Management has become an integral part of any cost reduction- and efficiency improvement plans
a company might have. It is, however, necessary to have timely, trustworthy information, in a
format that is useful.
Systems development is shown not to be a mechanical activity. There are no magic secrets for
success, no perfect rolls, techniques or methods. Systems analysis is the most critical part of
information systems development. It is during systems analysis that the existing business systems
are investigated, problems understood, and objectives, priorities and business requirements
defined. The quality of any subsequent systems design, implementation and support is dependent
on good systems analysis.
The systems life cycle in the context of this study will take place in a Steel industry. It is therefor
important to understand the industry and the characteristics thereof. The trend in the steel
markets for the near future is not going upwards, but will be decreasing. What is important, is that
the economic situation of most company's within this industry will be of such a nature that
expensive computer systems may be placed on the back burner. The importance of relatively
cheaper systems, still delivering the same information and service, will be rising.
Business research is a set of conceptual tools and techniques that enables a manager or
researcher to plan and execute a research project. This chapter aimed to give a broad outline of
these tools and techniques that were used to arrive at the research objective, as well as the
research questionnaire.
A MMIS in a Steel Industry — A Case Study 66

Taken into account the business environment, and the research objective, a system was
developed within certain limits. This system was used in the research to ascertain whether future
Materials Management systems should be bought ready to use, custom written, or if the question
requires further research.
In summary the research objectives were defined as being threefold. The first, to program an
information system, was accomplished successfully as can be seen in a chapter six. The program
was implemented and tested by a sample of Materials Management personnel. The most important
conclusion is that while the smaller, custom written system is not ideally suited for every application
within a larger company, it will be well suited to a smaller company with less integrated system
needs. The financial considerations also play a large role whereas the smaller system will suit a
smaller company and so also the commercially available system a larger company. Ease of
adaptation is definitely in favor of the smaller system, and detailed information on certain subjects
is more easily available on these types of systems.
The findings also document the comparison between the two types of systems as defined in the
second research objective. These findings show that the information system should suit the
application and the environment in which it is used.
These findings are only an indication of possible behavior and outcomes within a certain
environment. Further study in this field would be possible to ascertain within a larger sample size if
the outcomes stay the same.
A MMIS in a Steel Industry - A Case Study 67
CHAPTER NINE
Bibliography
Akacum, A, Dale, BG, Winter 1995, "Supplier Partnering: Case Study Experiences", International
Journal of Purchasing and Materials Management, p 38 — 44.
Arangies, J, 1996, "Leweransiersverhoudings", Supply Chain, vol. 2 no 1, p 19 — 27.
Conger, Sue, 1994, The New Software Engineering, Wadsworth Publishing Company.
Deming, WE, 1960, Sample Design In Business Research, John Wiley.
Elman, Donald, 1994, Microsoft Access 2 For Windows — Step by Step, Microsoft Press
Emory, C William, 1980, Business Research Methods, Richard D Irwin.
Fogarty, Donald W, Blackstone, John H, Hoffmann, Thomas R, 1991, Production and Inventory
Management, South-Western Publishing Co.
Gitlow, H, Gitlow, S, Oppenheim, A, Oppenheim, R, 1989, Tools and Methods for the Improvement
of Quality, Irwin.
Macbeth, DK, Ferguson, N, 1994, Partnership Sourcing — An Integrated Supply Chain Approach,
Pitman Publishing.
Matthews, DQ, 1971, The Design of the Management Information System, Auerbach Publishers.
Mellville, Stuart, Goddard, Wayne, Research Methodology: An Introduction for Science and
Engineering Students, Juta and Co.
Miller, I, Freund, John E, Johnson, Richard A, 1990, Probability and Statistics for Engineers,
Prentice-Hall International Editions.
Murdick, Robert G, Ross, Joel E, 1974, Information Systems For Modem Management, Prentice-
Hall.
Rummel, J Francis, Ballaine, Wesley C, 1963, Research Methodology in Business, Harper and
Row
Schultheis, R, Sumner, M, 1989, Management Information Systems: A Manager's View, Irwin.
Sloman, Morris, 1994, Network and Distributed Systems Management, Addison-Wesley.
Stallings, William, 1993, Computer Organisation and Architecture, Macmillan Publishing Company.
Stuart, F Ian, McCutcheon, David, Winter 1995, "Problem Sources in Establishing Strategic
Supplier Alliances", International Journal of Purchasing and Materials Management, p 3 — 8.
Van Biljon, Ernst GB, 1996, "Partnerships Between Your Procurement Department and Suppliers",
Supply Chain, vol. 2 no 1, p 15 — 18.
A MMIS in a Steel Industry — A Case Study 68

Whitten, Jeffrey, Bentley, Lonnie, Barlow, Victor, Systems Analysis and Design Methods, Richard
D
http://mm&[email protected]
http://infodeli.iscorltd.co.za/materials/comman.htm
http://infodeli.iscorltd.co.za/materials/guiding.htm
http://www.iscorltd.co.za/brief/steeldom.htm
http://www.iscorltd.co.za/brief/steelint.htm
http://www.iscorltd.co.za/brief/steel.htm
http://www.mincom.com/mims/product/material.html
http://w3c//dtd.html
http://www.cba.bgsu.edu/html/purch.html
A MMIS in a Steel Industry — A Case Study 69
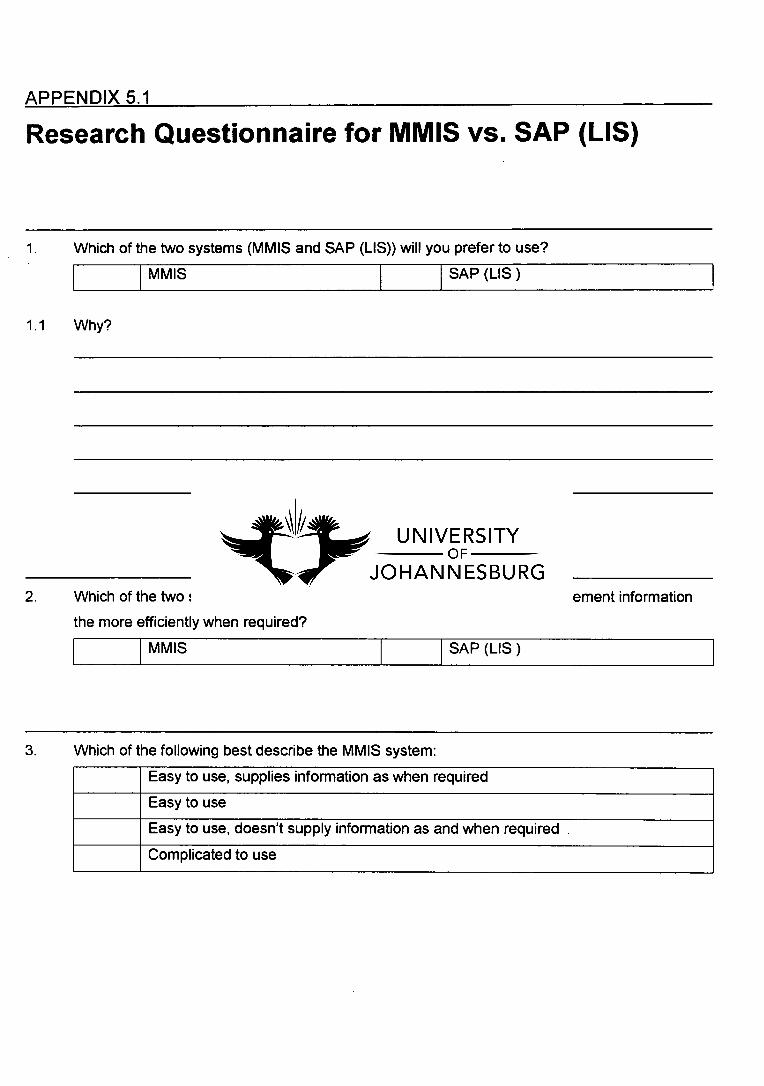
APPENDIX 5.1
Research Questionnaire for MMIS vs. SAP (LIS)
Which of the two systems (MMIS and SAP (LIS)) will you prefer to use?
MMIS
SAP (LIS )
1.1 Why?
Which of the two systems (MMIS and SAP (LIS)) supplies Materials Management information
the more efficiently when required?
MMIS
SAP (LIS )
Which of the following best describe the MMIS system:
Easy to use, supplies information as when required
Easy to use
Easy to use, doesn't supply information as and when required
Complicated to use
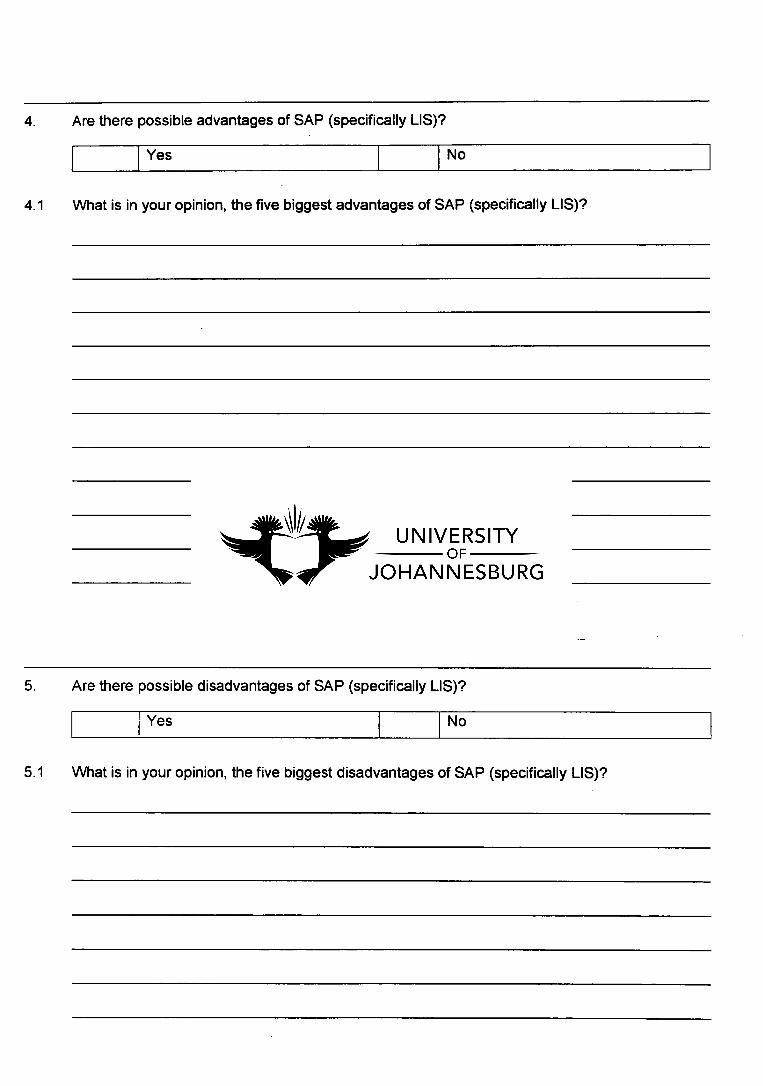
4.
4.1
Are there possible advantages of SAP (specifically LIS)?
Yes No
What is in your opinion, the five biggest advantages of SAP (specifically LIS)?
5. Are there possible disadvantages of SAP (specifically LIS)?
Yes
No
5.1 What is in your opinion, the five biggest disadvantages of SAP (specifically LIS)?

6.1
Are there possible advantages of MMIS?
Yes No
What is in your opinion, the five biggest advantages of MMIS?
7.1
Are there possible disadvantages of MMIS?
Yes No
What is in your opinion, the five biggest disadvantages of MMIS?
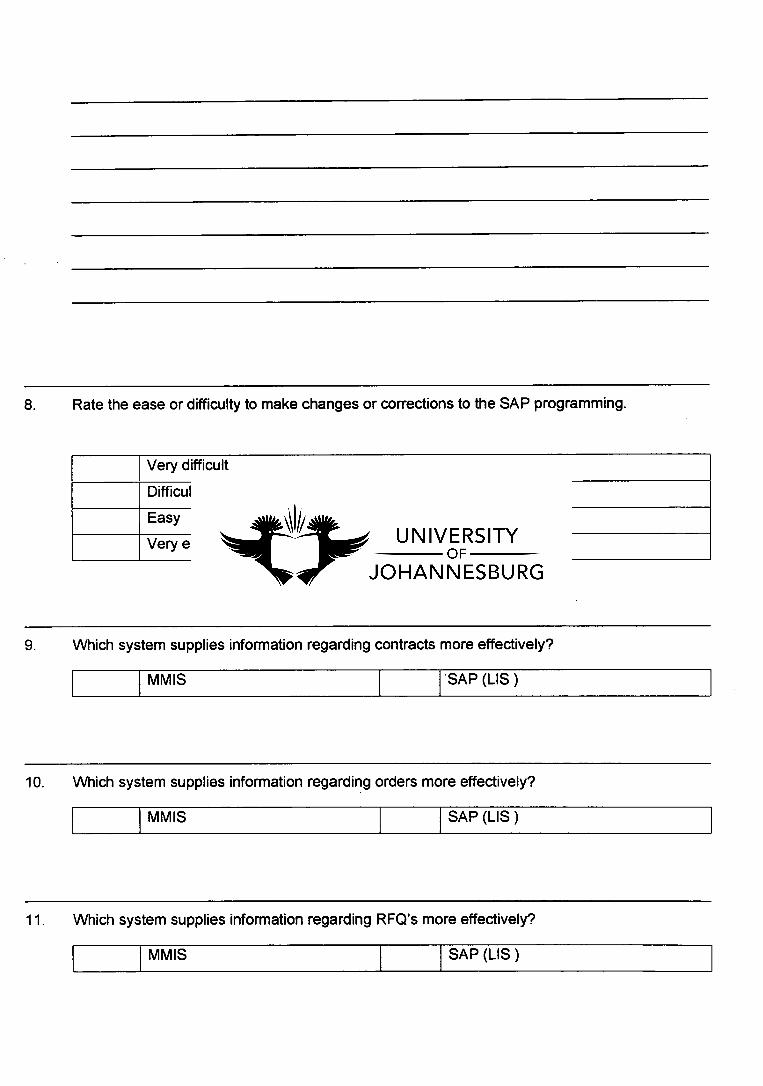
Which system supplies information regarding contracts more effectively?
Which system supplies information regarding orders more effectively?
Very difficult
Difficult
Easy
Very easy
MM IS
'SAP (LIS )
MM IS
SAP (LIS )
8. Rate the ease or difficulty to make changes or corrections to the SAP programming.
Which system supplies information regarding RFQ's more effectively?
M MIS
SAP (LIS )
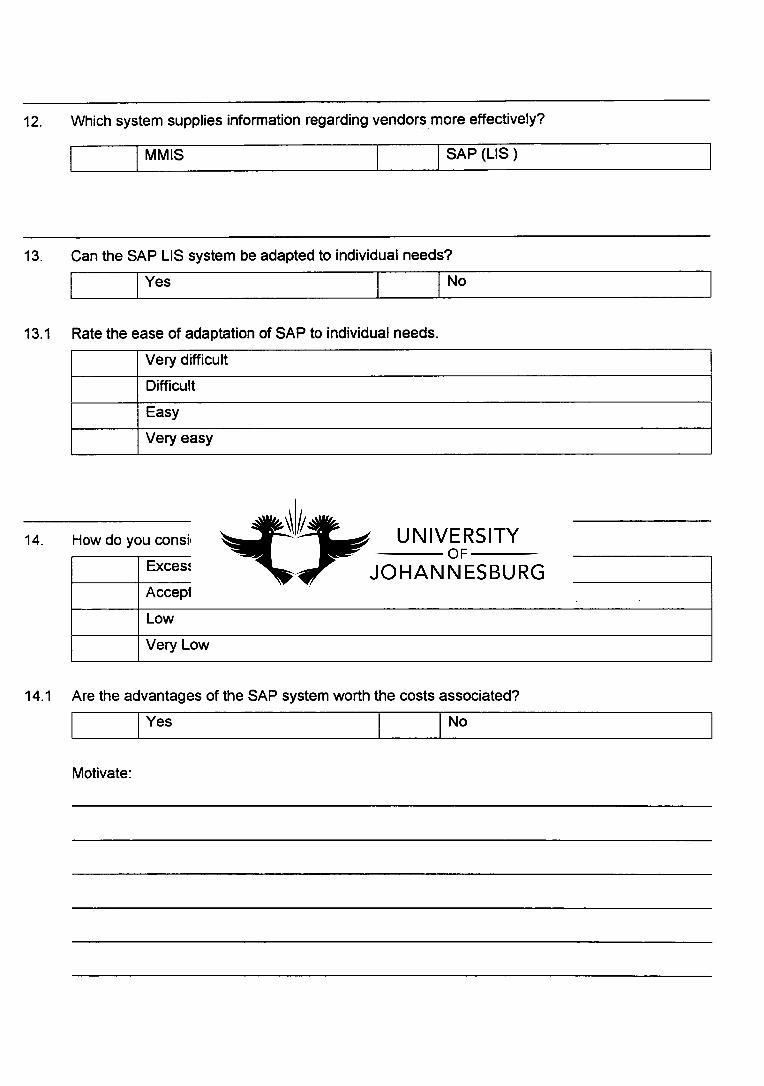
Which system supplies information regarding vendors more effectively?
MMIS
SAP (LIS )
Can the SAP LIS system be adapted to individual needs?
Yes
No
13.1 Rate the ease of adaptation of SAP to individual needs.
Very difficult
Difficult
Easy
Very easy
How do you consider the costs associated with the introduction of SAP:
Excessive
Acceptable
Low
Very Low
14.1 Are the advantages of the SAP system worth the costs associated?
Yes
No
Motivate:
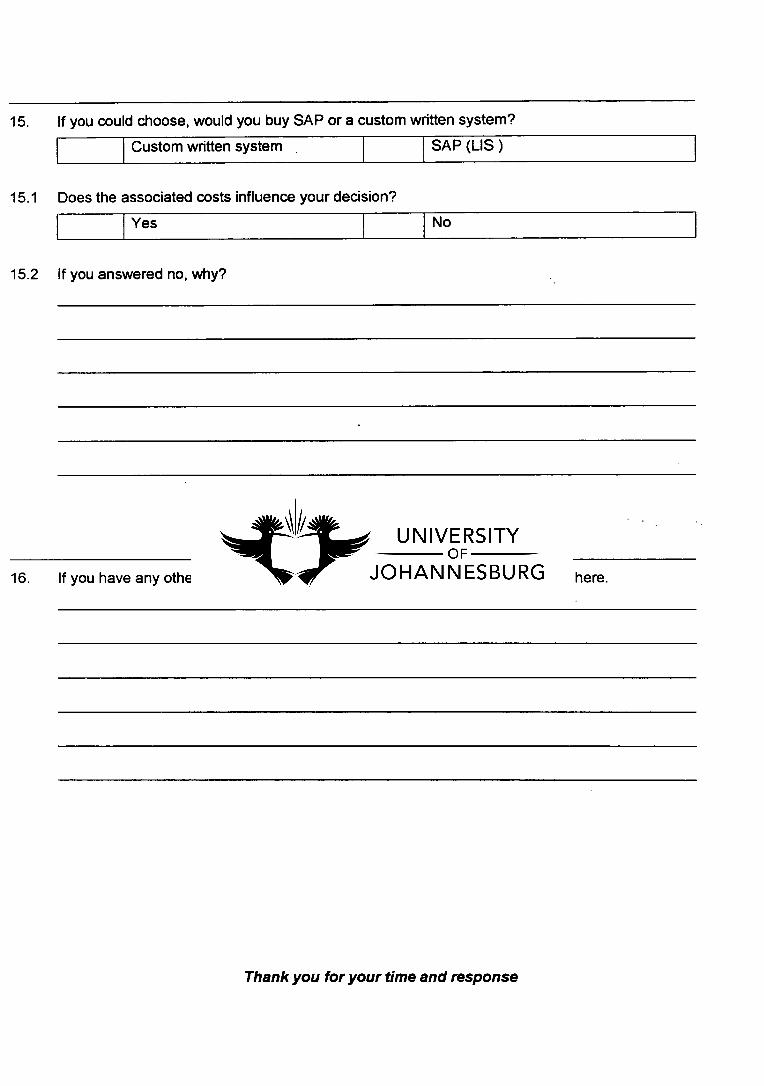
15.
15.1
15.2
If you could choose, would you buy SAP or a custom written system?
Custom written system SAP (LIS )
Does the associated costs influence your decision?
Yes No
If you answered no, why?
16. If you have any other comments on the two systems, please write them down here.
Thank you for your time and response
APPENDIX 6.1
Product Solution Microsoft Access
As mentioned before, Microsoft Access was used to program an MMIS system, which can
be used in the Materials Management environment. The following is a brief description of
how Microsoft Access functions, and how it was used in this project.
1.1
What is Microsoft Access?
Microsoft Access is a database management system for Windows, which is used to organise and
manage information [5]. Custom applications can be built in an effective way in order for
information to be extracted and viewed.
Microsoft Access uses tables to store information, and relationships, queries, forms and reports to
organise, view and manipulate information.
1.2
Why Use MS Access?
Microsoft Access is an excellent tool for [5]:
database management, that is, storing information in an orderly fashion,
extracting information in a format usable to a user (manager).
It is also easy to use, is Windows compatible, and can therefor be operated on any computer that
supports Windows.
The Visual Basic for Access (VBA) programming language is used to create an application that
utilises a graphical user interface. Powerful, full-featured applications can be created that exploit
the key features of Microsoft Windows.
1.3
What Is a Database?
A Database is a collection of information that is related to a particular topic or purpose [5]. The
key to efficient storage and retrieval in a database is to plan the process beforehand. It is
important to identify what the database must be able to do, in order to create the best solution.
The following questions must be considered:
•:. Which information must be retrieved from the database?
Which separate subject areas exist for which information must be stored?
How are these subjects related?
Which facts must be stored for each subject?
1.4
Database for the MMIS
Information regarding Materials Management objectives must be stored and retrieved form the
database. This includes Request For Quotations (RFQ), contracts, orders, goods received,
goods issued and stock. These subjects are all interrelated through the fact that they follow
sequentially on each other.
A RFQ must be issued whenever a new order must be generated. This triggers the vendor to
issue a price quotation for a specific article. When the RFQ is received back, using the RFQ
number and typing in the relevant information can generate an order. An order tells the vendor
when the specific article must be delivered. When delivery takes place, the article is received by
using the goods received function.
Thereafter it is issued to the end-user through goods issued. Stock is the result of more receipts
than issues.
1.5
Forms
Data is information the user wants to store and refer to again. In Microsoft Access, data can be
text, numbers, dates, and pictures. The easiest way to enter data is through the use of forms.
The user enters the data in a textbox, which is then stored in a table.
A record is a set of information that belongs together, such as all the information on an order. A
database consists of tables that hold many records.
Microsoft Access creates forms that can do calculations, look up information, and send a warning
message when information entered is wrong [5].
For example:
Delivery date on order > Current date
Positive quantity
Contract end date > Contract start date
Positive quantity
1.6
Tables
A database table is a collection of data with the same subject or topic [5]. One table contains for
example, information regarding articles, such as for instance article number, description, and unit
size. A MS Access database is a collection of tables, with related information stored in each. A
table consists of both fields and records. A field appears as a column in the table and contains a
category of information, such as the article number or description. Each record appears as a row
in the table and contains all the information about a specific article.
For example:
Order table contains information related to orders — order number, article number, vendor,
unit (quantity).
1.7
Queries
After creating the database and storing the information, the user would like to extract it in a useful
manner. A query defines a group of records that the programmer wants to work with [5]. A query
is a request for a particular collection of data, and the answer is called a dynaset. The records in
a dynaset can include fields from one or more tables. A query can be used to sort data or to view
a subset of all the data in a database. It can also be used to view the same information in
different ways. Four different types of queries exist: update, select, delete and cross tab.
For example:
Recordset for Report to define view per buyer shows number of orders for certain period
and the value of the orders.
1.8
Reports
Although the information in a table or query can be printed directly, a report presents the
information in an easier:to-read, more professional looking format. A report can combine data
into groups, and calculate totals, displays headers and footers [5].
For example:
Total number of RFQ's sent out per buyer per period
Total number of contracts per buyer per period
Number of orders outstanding per buyer per period.
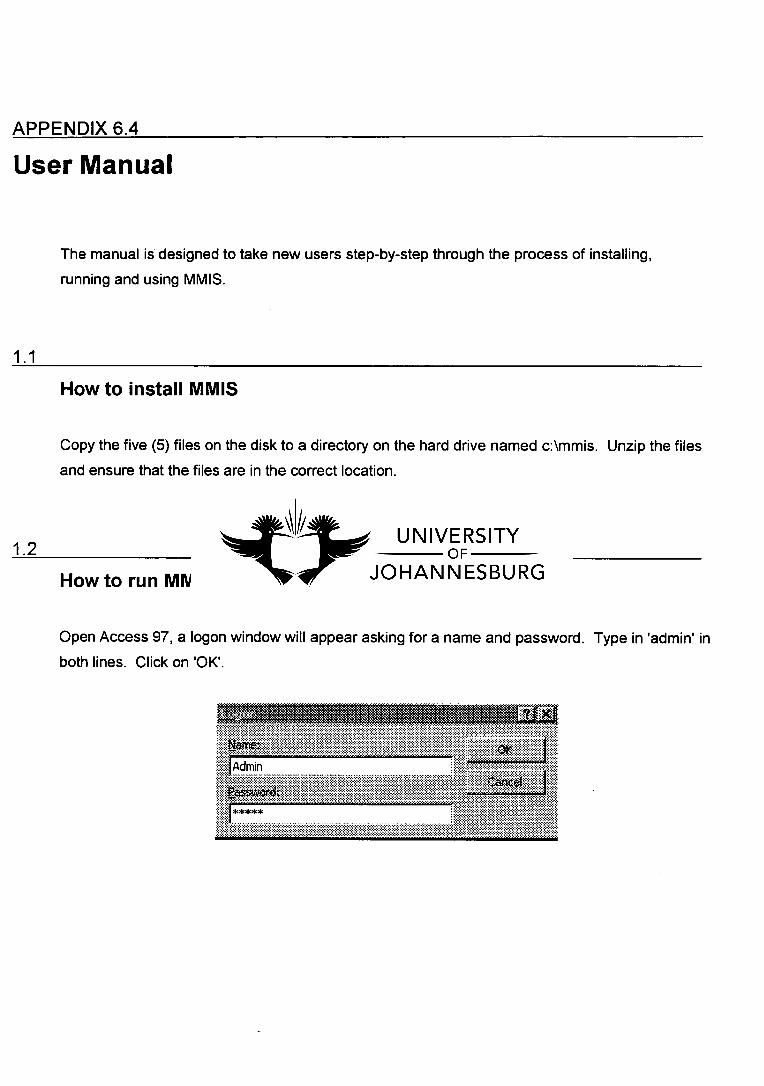
APPENDIX 6.4
User Manual
The manual is designed to take new users step-by-step through the process of installing,
running and using MMIS.
1.1
How to install MMIS
Copy the five (5) files on the disk to a directory on the hard drive named c:\mmis. Unzip the files
and ensure that the files are in the correct location.
1.2
How to run MMIS
Open Access 97, a logon window will appear asking for a name and password. Type in 'admin' in
both lines. Click on 'OK'.
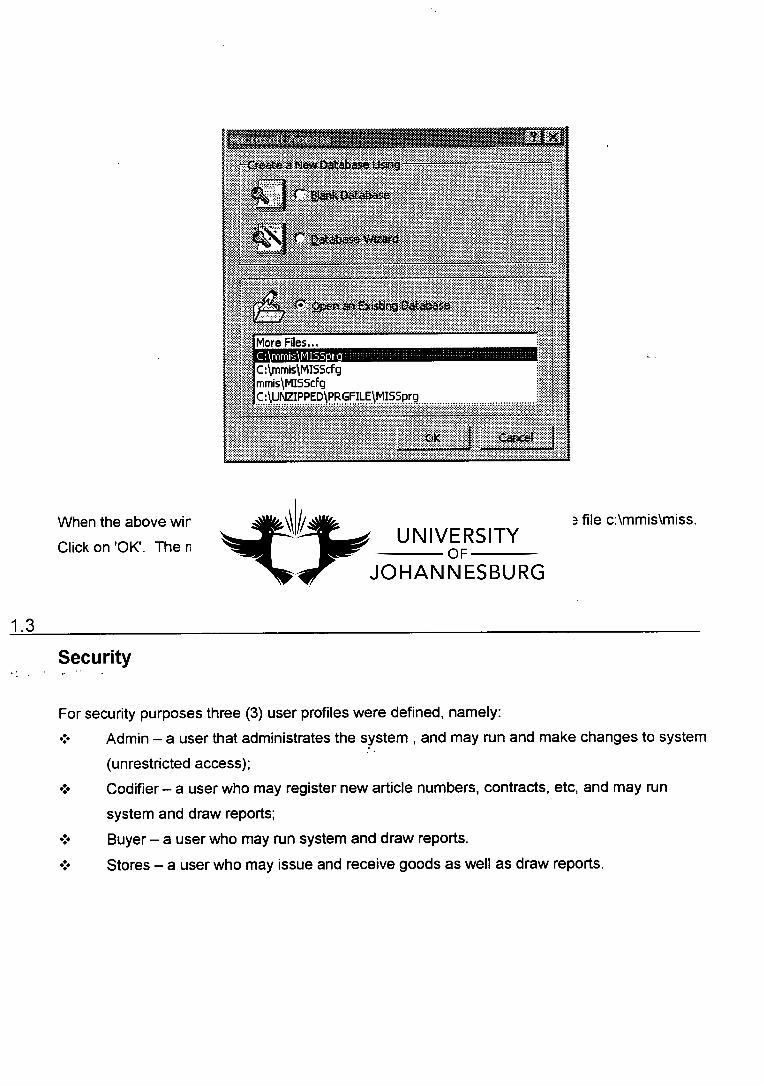
rornis) MISS irg C:),mmis‘MI55cfg mmisV4155cfg C: ‘UNZIPPEIVRGFILE‘MI55prg
MO.
When the above window appears, choose 'open an existing database' and the file c:\mmis\miss.
Click on 'OK'. The main menu will appear.
1.3
Security
For security purposes three (3) user profiles were defined, namely:
Admin — a user that administrates the system , and may run and make changes to system
(unrestricted access);
Codifier — a user who may register new article numbers, contracts, etc, and may run
system and draw reports;
Buyer — a user who may run system and draw reports.
Stores — a user who may issue and receive goods as well as draw reports.
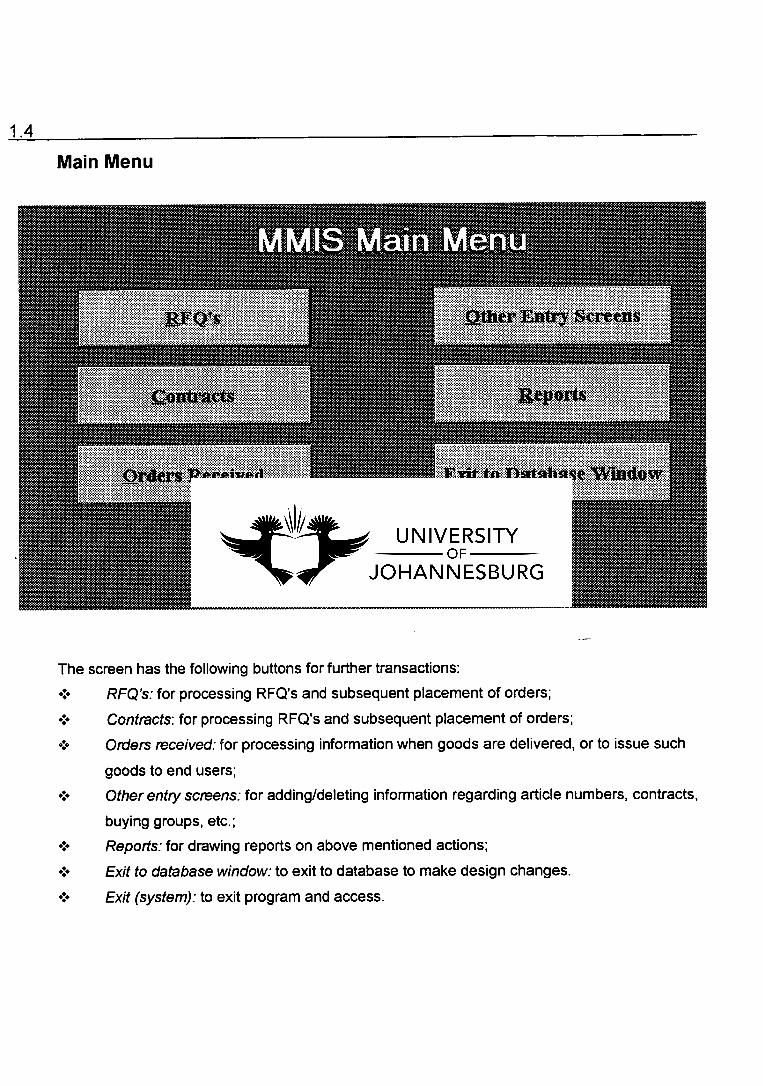
1.4
Main Menu
The screen has the following buttons for further transactions:
RFQ's: for processing RFQ's and subsequent placement of orders;
Contracts: for processing RFQ's and subsequent placement of orders;
Orders received: for processing information when goods are delivered, or to issue such
goods to end users;
Other entry screens: for adding/deleting information regarding article numbers, contracts,
buying groups, etc.;
Reports: for drawing reports on above mentioned actions;
Exit to database window: to exit to database to make design changes.
Exit (system): to exit program and access.
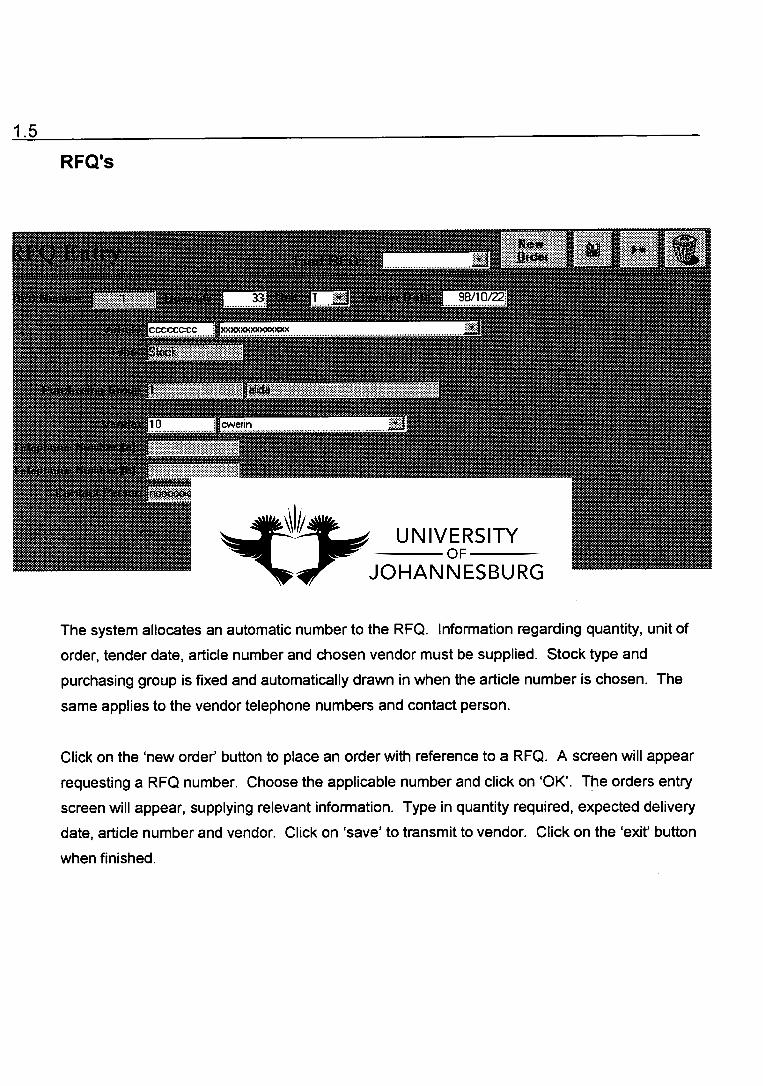
1.5
RFQ's
The system allocates an automatic number to the RFQ. Information regarding quantity, unit of
order, tender date, article number and chosen vendor must be supplied. Stock type and
purchasing group is fixed and automatically drawn in when the article number is chosen. The
same applies to the vendor telephone numbers and contact person.
Click on the 'new order' button to place an order with reference to a RFQ. A screen will appear
requesting a RFQ number. Choose the applicable number and click on 'OK'. The orders entry
screen will appear, supplying relevant information. Type in quantity required, expected delivery
date, article number and vendor. Click on 'save' to transmit to vendor. Click on the 'exit' button
when finished.
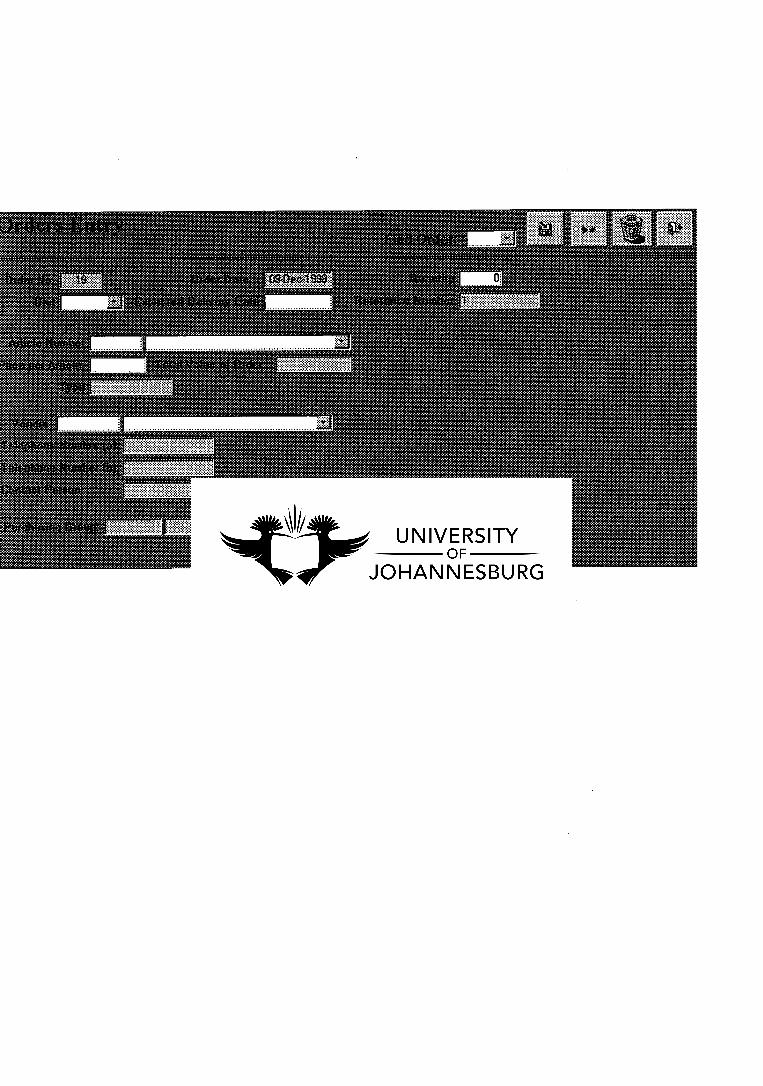
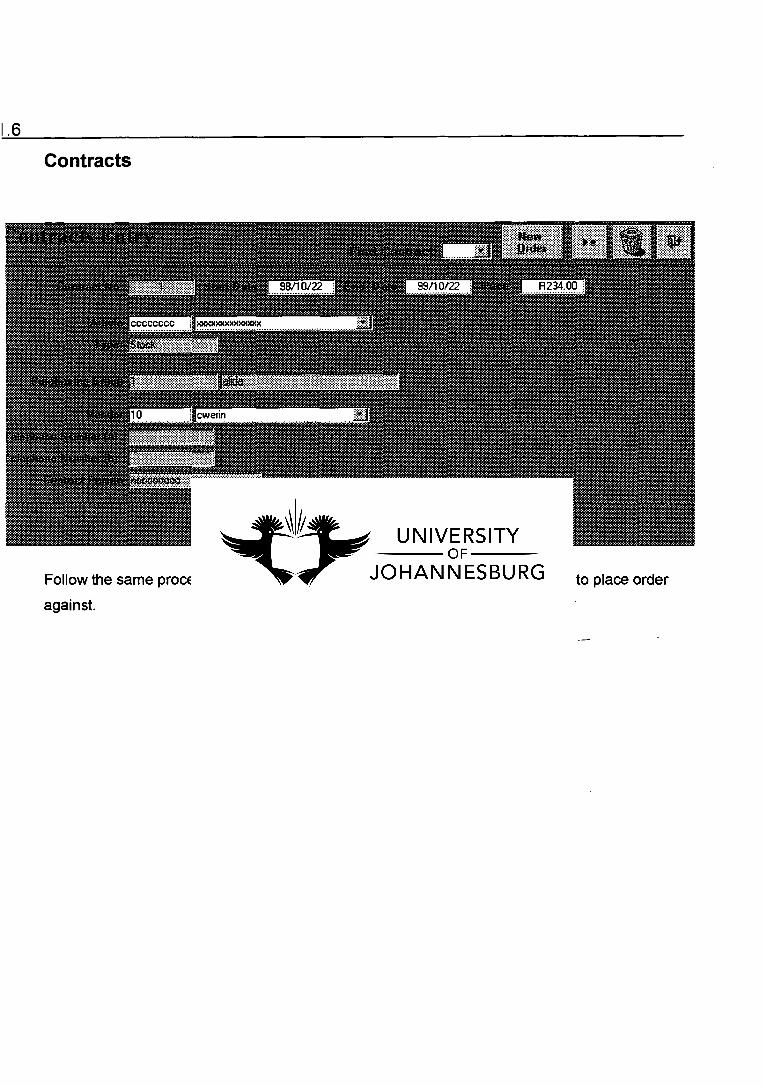
1.6
Contracts
Follow the same procedure as described in 1.4, only selecting relevant contract to place order
against.
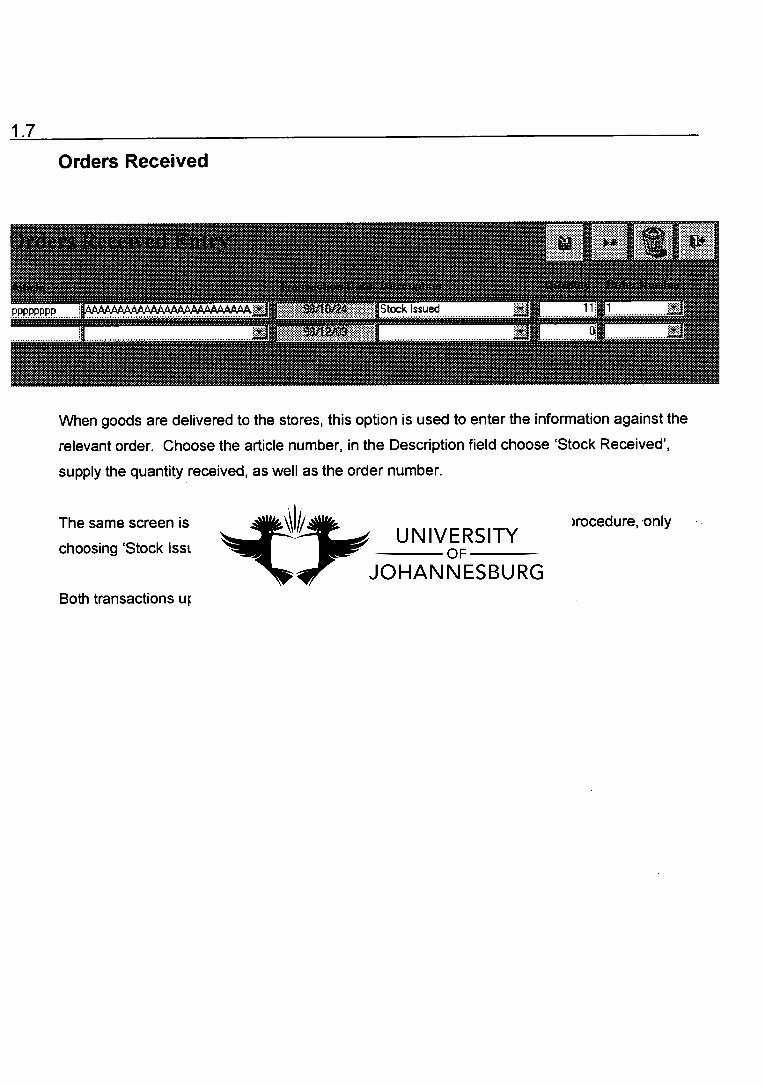
1.7
Orders Received
When goods are delivered to the stores, this option is used to enter the information against the
relevant order. Choose the article number, in the Description field choose 'Stock Received',
supply the quantity received, as well as the order number.
The same screen is used to issue goods to the end users. Follow the same procedure, only
choosing 'Stock Issued' in the Description field.
Both transactions update the stock value.
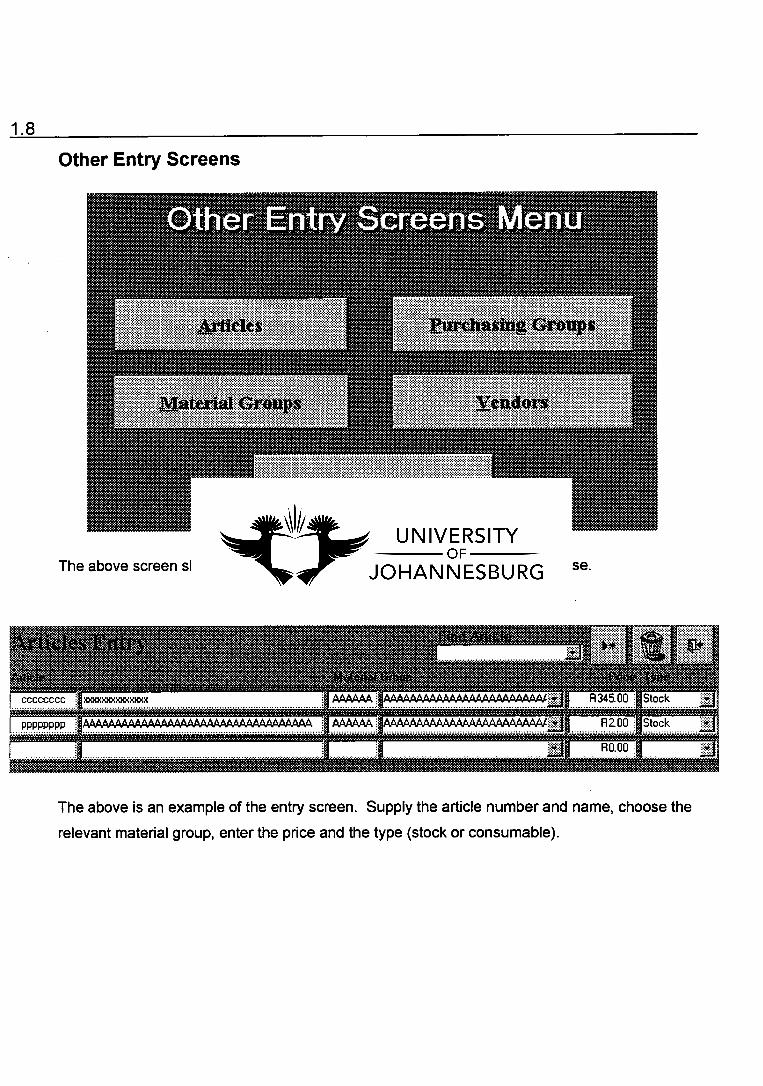
Stock R345.00 ••••••••• •• • • •• • •••• • a • •
, . . Stock
XXXXXXKXXXXXXX
R0.00
cccccccc
1.8
Other Entry Screens
The above screen shows the various inputs that can be made into the database.
The above is an example of the entry screen. Supply the article number and name, choose the
relevant material group, enter the price and the type (stock or consumable).
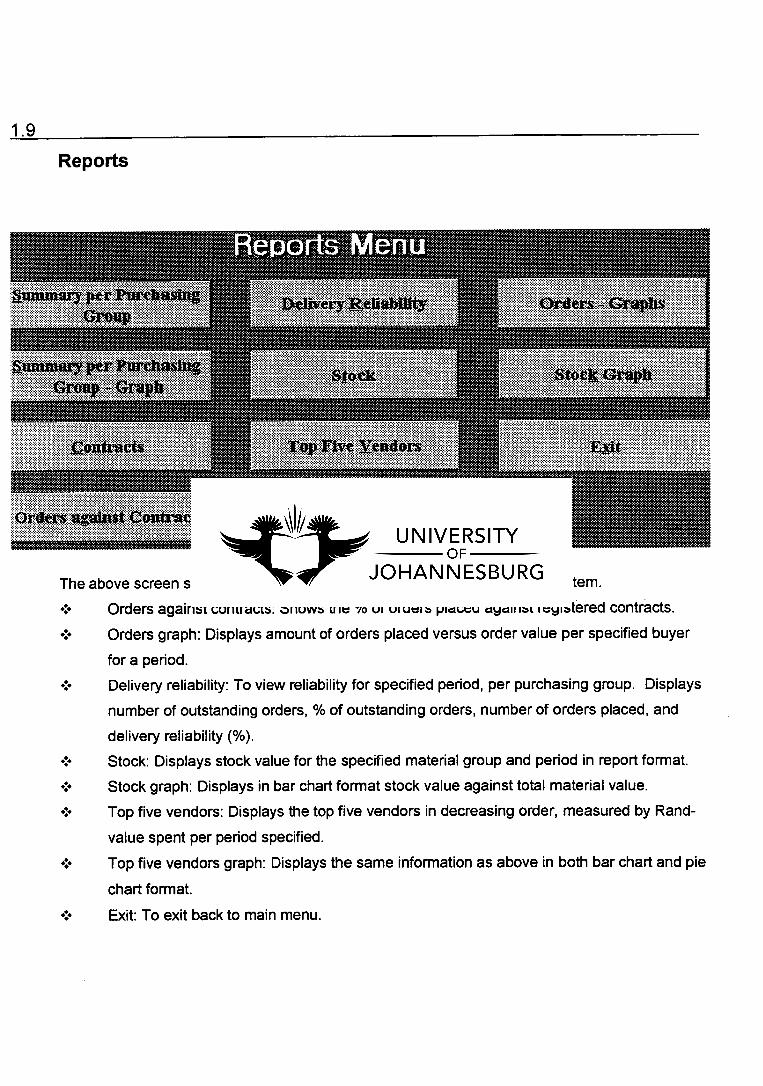
a •
w„,...,....„...
1.9
Reports
The above screen shows the possible reports that can be drawn from the system.
Orders against contracts: Shows the % of orders placed against registered contracts.
Orders graph: Displays amount of orders placed versus order value per specified buyer
for a period.
Delivery reliability: To view reliability for specified period, per purchasing group. Displays
number of outstanding orders, % of outstanding orders, number of orders placed, and
delivery reliability (%).
Stock: Displays stock value for the specified material group and period in report format.
Stock graph: Displays in bar chart format stock value against total material value.
Top five vendors: Displays the top five vendors in decreasing order, measured by Rand-
value spent per period specified.
Top five vendors graph: Displays the same information as above in both bar chart and pie
chart format.
Exit: To exit back to main menu.

1.10
Exit
Click on this button to exit the system.
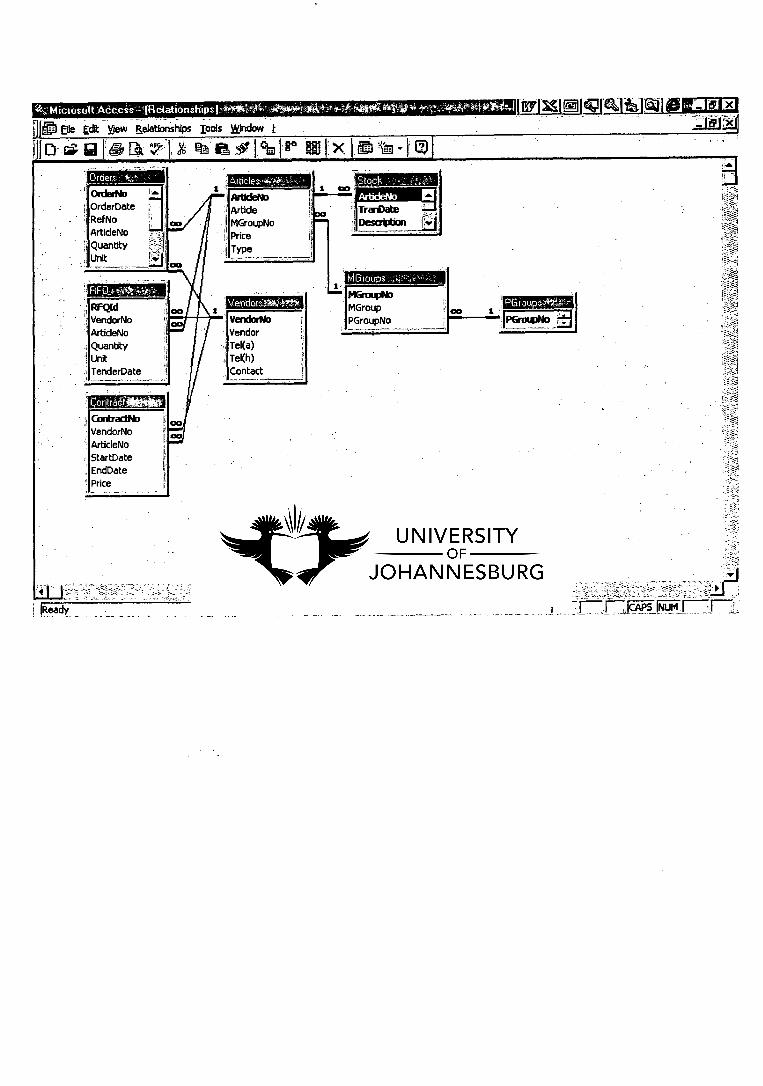
1 CO
Veridorart4,
"'Microsoft Adeess - - (Relationships ) .00101111, ..C‘~
111D Elle edit view aelationshiPs Dols Window t
ID- Ur. [ ffi tb 1, 19n
Articles •~
Artidefto Article MGroupNo Price Type
OrderNo OrderDate Ref No ArticleNo Quantity Unit
PCitoupvIlt-
VendorNo Vendor Tel(a) Tel(h) Contact
ortraOljeitft
Contractrdo VendorNo ArticleNo StartDate EndDate Price
RFQId VendorNo ArtideNo Quantity Unit TenderDate
1-7 1-7171cAPs mErm.1-71-1_
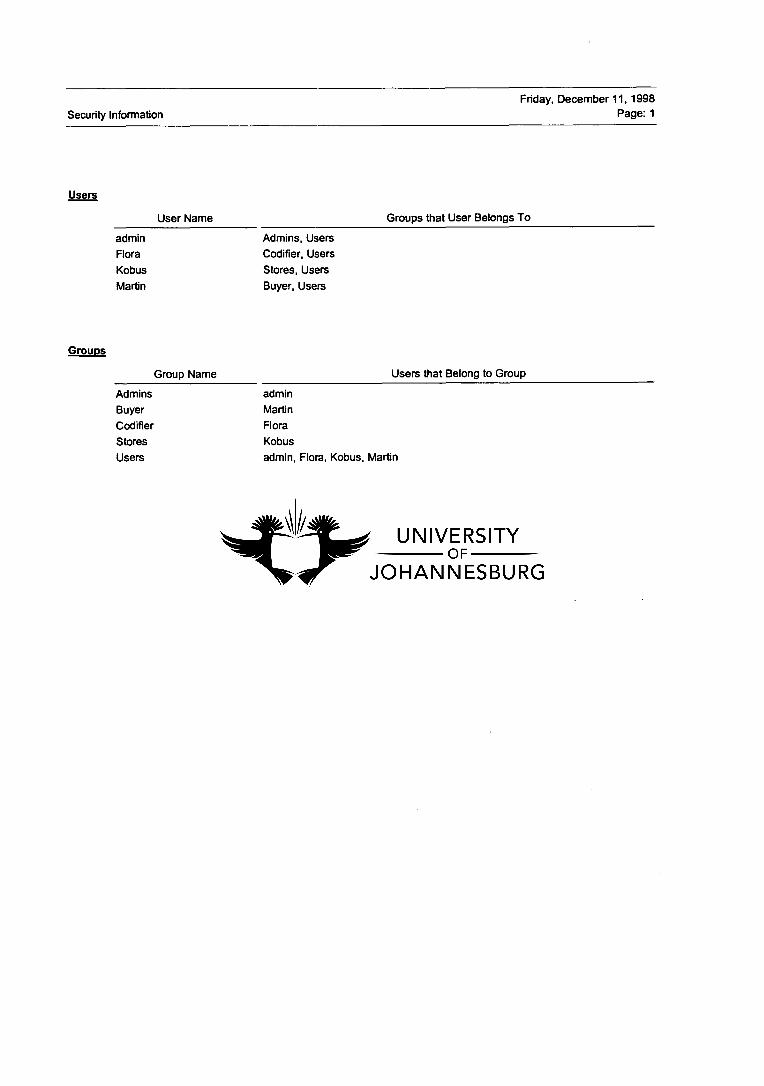
Friday, December 11, 1998
Security Information Page: 1
Users
User Name Groups that User Belongs To
admin Admins, Users
Flora Codifier, Users
Kobus Stores, Users
Martin Buyer, Users
Groups
Group Name Users that Belong to Group
Admins admin
Buyer Martin
Codifier Flora
Stores Kobus
Users admin, Flora, Kobus, Martin
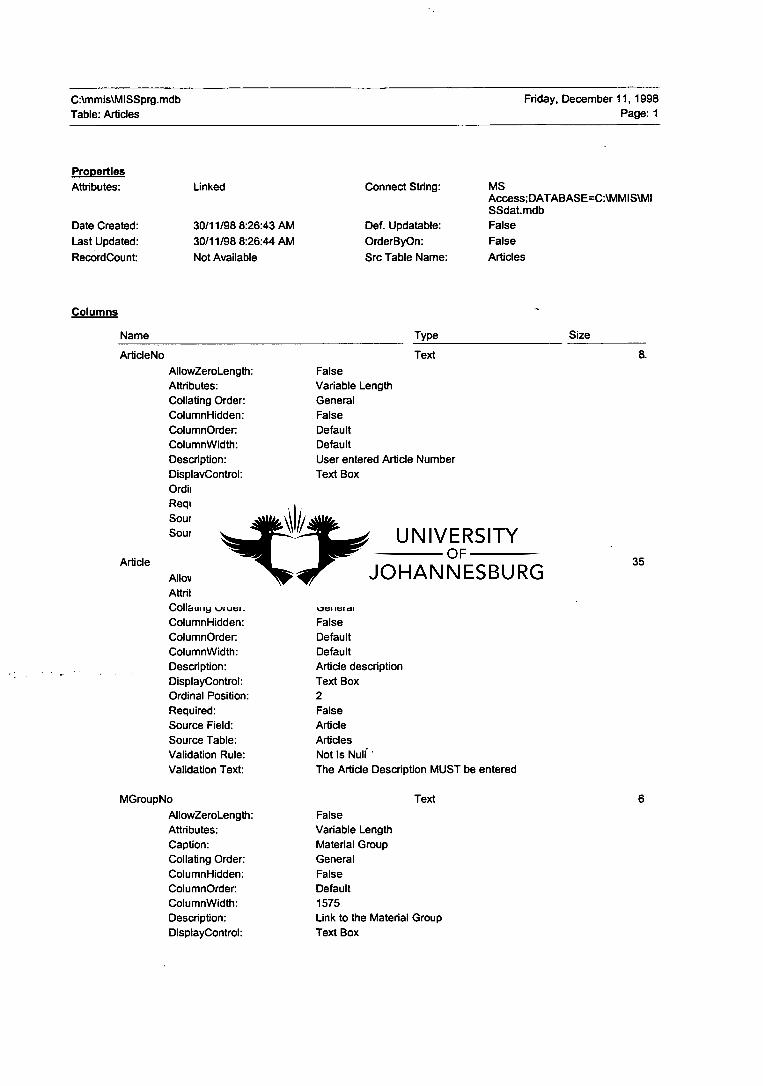
C:\mmis\MISSprg.mdb
Table: Articles
Friday, December 11, 1998 Page: 1
Properties
Attributes: Linked Connect String: MS Access;DATABASE=CAMMIS\MI SSdat.mdb
Date Created: 30/11/98 8:26:43 AM Def. Updatable: False
Last Updated: 30/11/98 8:26:44 AM OrderByOn: False
RecordCount: Not Available Src Table Name: Articles
Columns
Name Type
Size
ArticleNo Text
8.
AllowZeroLength: False Attributes: Variable Length
Collating Order: General
ColumnHidden: False
ColumnOrder: Default
ColumnWidth: Default
Description: User entered Article Number
DisplayControl: Text Box
Ordinal Position: 1
Required: False
Source Field: ArticleNo
Source Table: Articles
Article
Text 35
AllowZeroLength: False
Attributes: Variable Length Collating Order: General
ColumnHidden: False
ColumnOrder: Default
ColumnWidth: Default
Description: Article description
DisplayControl: Text Box Ordinal Position: 2
Required: False
Source Field: Article
Source Table: Articles
Validation Rule: Not Is Null. •
Validation Text: The Article Description MUST be entered
MGroupNo Text 6
AllowZeroLength: False
Attributes: Variable Length
Caption: Material Group
Collating Order: General
ColumnHidden: False
ColumnOrder. Default
ColumnWidth: 1575
Description: Link to the Material Group
DisplayControl: Text Box
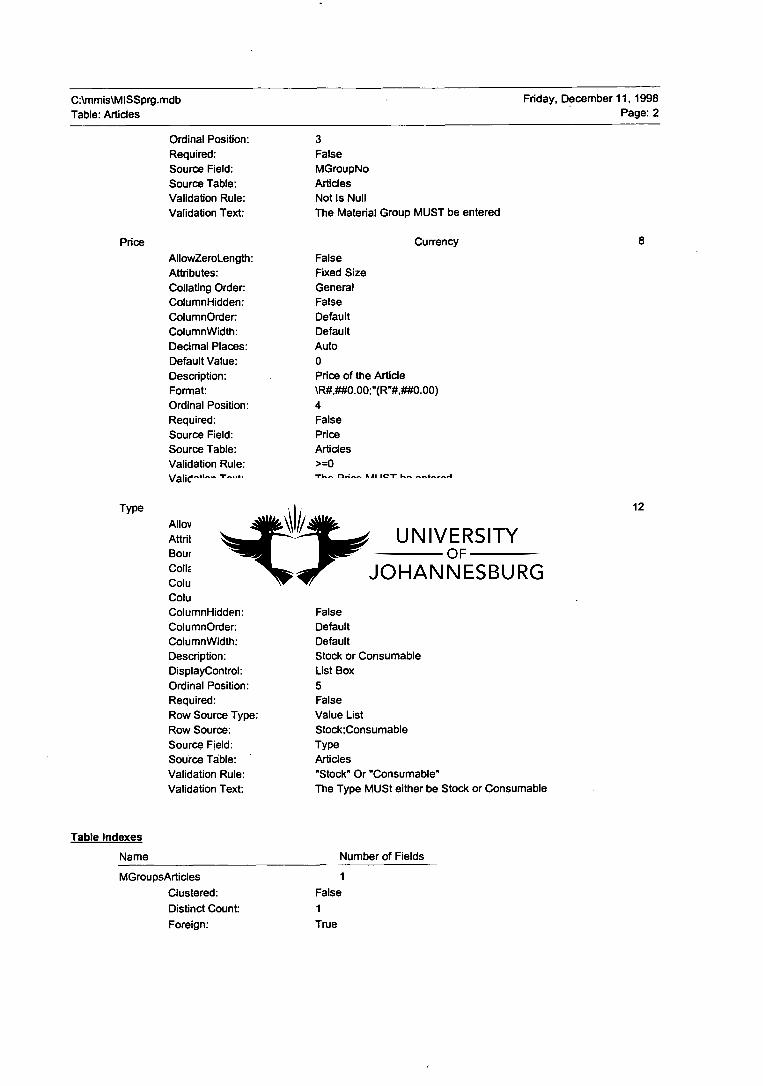
C:\mmis\MISSprg.mdb Friday, December 11, 1998
Table: Articles Page: 2
Ordinal Position: 3
Required: False
Source Field: MGroupNo
Source Table: Articles
Validation Rule: Not Is Null
Validation Text: The Material Group MUST be entered
Price
Currency 8
AllowZeroLength: False
Attributes: Fixed Size
Collating Order: General
ColumnHidden: False
ColumnOrder: Default
ColumnWidth: Default
Decimal Places: Auto
Default Value: 0
Description: Price of the Article
Format: \R#00.00;"(R"#,##0.00)
Ordinal Position: 4
Required: False
Source Field: Price
Source Table: Articles
Validation Rule: >=0
Validation Text: The Price MUST be entered
Type
Text 12
AllowZeroLength: False
Attributes: Variable Length
Bound Column: 1
Collating Order: General
Column Count: 1
Column Heads: False
ColumnHidden: False
ColumnOrder: Default
ColumnWidth: Default
Description: Stock or Consumable
DisplayControl: List Box
Ordinal Position: 5
Required: False
Row Source Type: Value List
Row Source: Stock;Consumable
Source Field: Type
Source Table: Articles
Validation Rule: "Stock" Or "Consumable"
Validation Text: The Type MUSt either be Stock or Consumable
Table Indexes
Name
Number of Fields
MGroupsArticles 1
Clustered: False
Distinct Count: 1
Foreign: True
C:\mmis\MISSprg.mdb Friday, December 11, 1998
Table: Articles Page: 3
Ignore Nulls: False
Name: MGroupsArticles
Primary: False
Required: False
Unique: False
Fields: MGroupNo, Ascending
PrimaryKey 1
Clustered: False
Distinct Count: 1
Foreign: False
Ignore Nulls: False
Name: PrimaryKey
Primary: True
Required: True
Unique: True
Fields: ArticleNo, Ascending
User Permissions
admin
Flora
Kobus
Martin
Group Permissions
Admins
Buyer
Codifier
Stores
Users
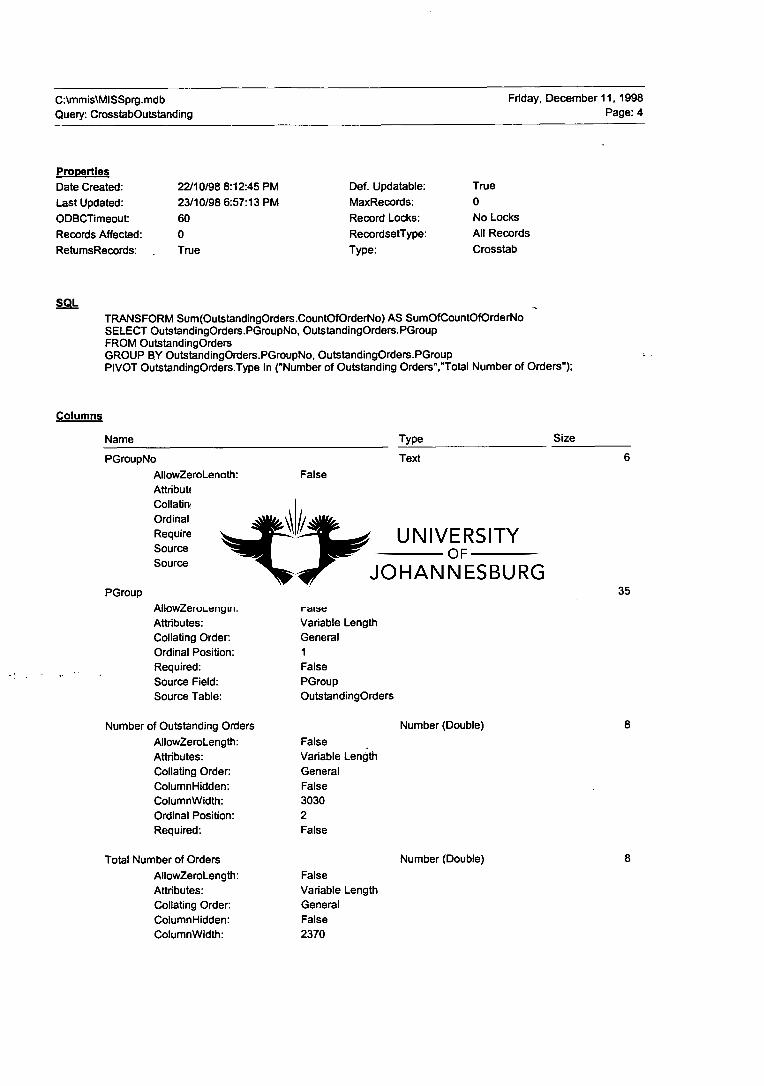
C:\mmis\MISSprg.mdb Friday, December 11, 1998
Query: CrosstabOutstanding Page: 4
Properties Date Created: 22/10/98 8:12:45 PM Def. Updatable: True
Last Updated: 23/10/98 6:57:13 PM MaxRecords: 0
ODBCTimeout 60 Record Locks: No Locks
Records Affected: 0 RecordsetType: All Records
RetumsRecords: True Type: Crosstab
TRANSFORM Sum(OutstandingOrders.CountOfOrderNo) AS SumOfCountOfOrderNo SELECT OutstandingOrders.PGroupNo, OutstandingOrders.PGroup FROM OutstandingOrders GROUP BY OutstandingOrders.PGroupNo, OutstandingOrders.PGroup PIVOT OutstandingOrders.Type In ("Number of Outstanding Orders","Total Number of Orders");
Columns
Type Size Name
PGroupNo Text 6
AllowZeroLength: False Attributes: Variable Length Collating Order: General Ordinal Position: 0 Required: False Source Field: PGroupNo Source Table: OutstandingOrders
PGroup Text 35
AllowZeroLength: False Attributes: Variable Length Collating Order: General Ordinal Position: 1 Required: False
Source Field: PGroup Source Table: OutstandingOrders
Number of Outstanding Orders Number (Double) 8
AllowZeroLength: False Attributes: Variable Length Collating Order: General ColumnHidden: False ColumnWidth: 3030 Ordinal Position: 2 Required: False
Total Number of Orders Number (Double) 8
AllowZeroLength: False Attributes: Variable Length Collating Order: General ColumnHidden: False ColumnWidth: 2370

C:\mmis\MISSprg.mdb Friday, December 11, 1998
Query: CrosstabOutstanding Page: 5
Ordinal Position: 3
Required: False
User Permissions
admin
Flora
Kobus
Martin
Group Permissions
Admins
Buyer
Codifier
Stores
Users
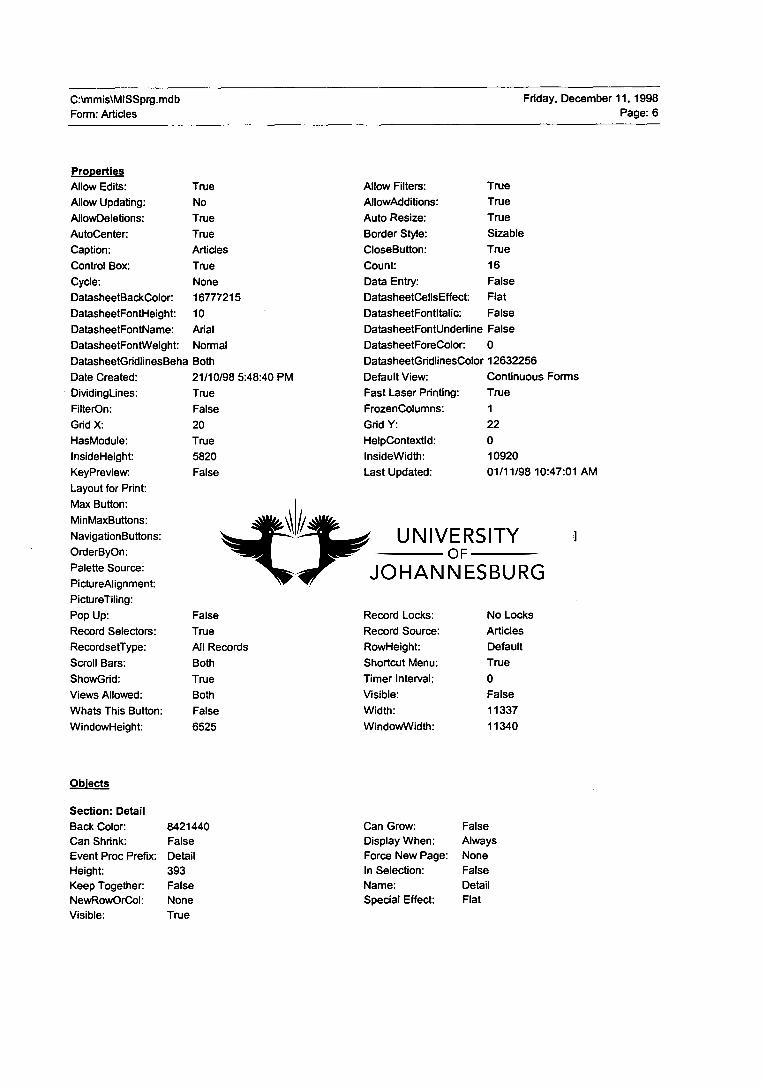
Allow Filters:
True
AllowAdditions:
True
Auto Resize:
True
Border Style:
Sizable
CloseButton:
True
Count:
16
Data Entry:
False
DatasheetCellsEffect: Flat
DatasheetFontltalic: False
DatasheetFontUnderline False
DatasheetForeColor: 0
DatasheetGridlinesColor 12632256
Default View:
Fast Laser Printing:
FrozenColumns:
Grid Y:
HelpContextld:
InsideWidth:
Last Updated:
LogicalPageWidth:
Min Button:
Modal:
On Delete:
Owner:
Picture:
PictureSizeMode:
PictureType:
Record Locks:
Record Source:
RowHeight:
Shortcut Menu:
Timer Interval:
Visible:
Width:
WindowWidth:
Continuous Forms
True
1
22
0
10920
01/11/98 10:47:01 AM
9360
True
False
[Event Procedure]
admin
(none)
Clip
0
No Locks
Articles
Default
True
0
False
11337
11340
CAmmis\MISSprg.mdb Friday, December 11, 1998
Form: Articles Page: 6
Properties
Allow Edits: True
Allow Updating: No
AllowDeletions: True
AutoCenter: True
Caption: Articles
Control Box: True
Cycle: None
DatasheetBackColor: 16777215
DatasheetFontHeight: 10
DatasheetFontName: Anal
DatasheetFontWeight: Normal
DatasheetGridlinesBeha Both
Date Created: 21/10/98 5:48:40 PM
DividingLines: True
FilterOn: False
Grid X: 20
HasModule: True
InsideHeight: 5820
KeyPreview: False
Layout for Print: False
Max Button: True
MinMaxButtons: 3
NavigationButtons: True
OrderByOn: False
Palette Source: (Default)
PictureAlignment: Always
PictureTiling: False
Pop Up: False
Record Selectors: True
RecordsetType: All Records
Scroll Bars: Both
ShowGrid: True
Views Allowed: Both
Whats This Button: False
WindowHeight: 6525
Obiects
Section: Detail
Back Color: Can Shrink:
Event Proc Prefix:
Height:
Keep Together: NewRowOrCol:
Visible:
8421440
False
Detail
393
False None
True
Can Grow:
Display When:
Force New Page:
In Selection:
Name:
Special Effect:
False Always
None
False
Detail Flat
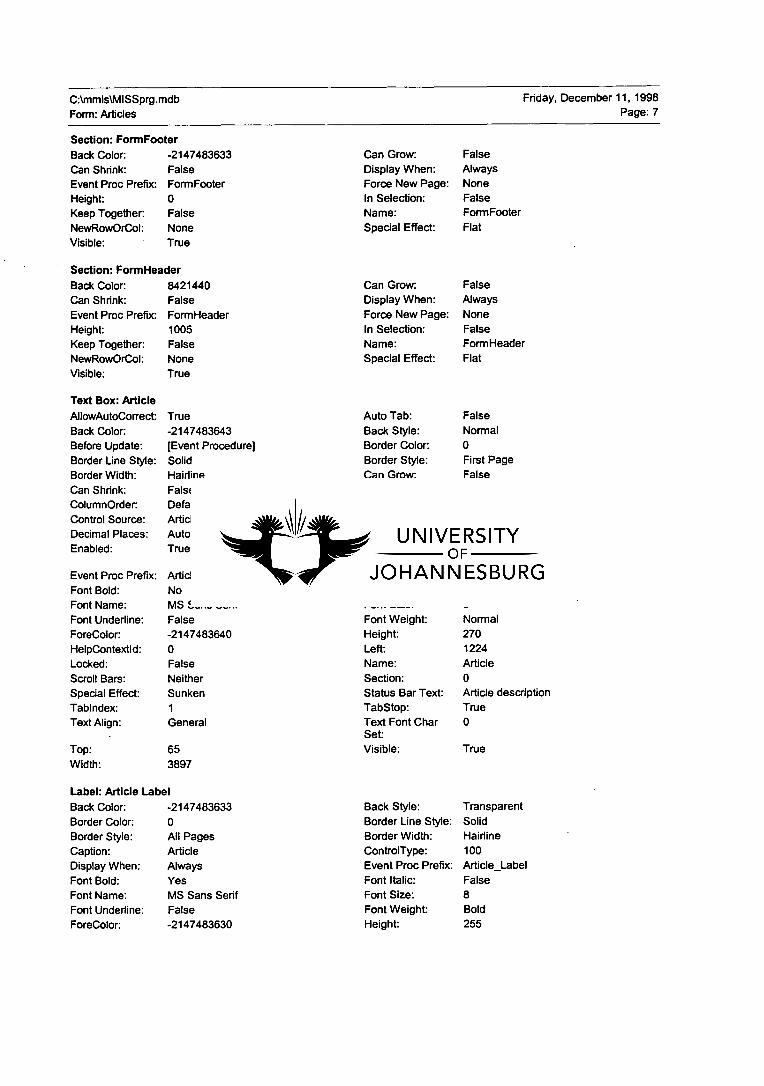
C:\mmis\MISSprg.mdb Friday, December 11, 1998
Form: Articles Page: 7
Section: FormFooter Back Color: -2147483633
Can Shrink:
False Event Proc Prefix: FormFooter Height:
0 Keep Together:
False
NewRowOrCol:
None Visible:
True
Section: FormHeader Back Color:
8421440 Can Shrink:
False
Event Proc Prefix: FormHeader Height:
1005 Keep Together:
False NewRowOrCol:
None Visible:
True
Can Grow: Display When: Force New Page: In Selection: Name:
Special Effect:
Can Grow: Display When:
Force New Page: In Selection: Name: Special Effect:
False Always None False FormFooter
Flat
False Always
None False FormHeader Flat
Text Box: Article AllowAutoCorrect:
Back Color: Before Update: Border Line Style: Border Width:
Can Shrink: ColumnOrder:
Control Source: Decimal Places: Enabled:
Event Proc Prefix:
Font Bold: Font Name: Font Underline:
ForeColor: HelpContextld:
Locked: Scroll Bars: Special Effect: TabIndex: Text Align:
Top:
Width:
True -2147483643 [Event Procedure]
Solid Hairline
False Default
Article Auto True
Article
No MS Sans Serif False -2147483640
0 False
Neither Sunken
1 General
Auto Tab:
Back Style: Border Color:
Border Style: Can Grow: ColumnHidden: ColumnWidth: ControlType: Display When: Enter Key Behavior: FilterLookup:
Font Italic: Font Size:
Font Weight: Height: Left: Name: Section: Status Bar Text: TabStop: Text Font Char Set: Visible:
False
Normal 0 First Page False
False 1935 109 Always False
1
False 8 Normal 270 1224 Article
0 Article description
True 0
True 65 3897
Label: Article Label Back Color: Border Color: Border Style: Caption: Display When:
Font Bold: Font Name: Font Underline:
ForeColor:
-2147483633
0 All Pages Article Always Yes MS Sans Serif False -2147483630
Back Style: Border Line Style: Border Width: ControlType: Event Proc Prefix:
Font Italic: Font Size: Font Weight: Height:
Transparent
Solid Hairline
100 Article_Label
False 8 Bold 255
C:\mmis\MlSSprg.mdb Form: Articles
Friday, December 11, 1998 Page: 8
HelpContextld: 0 Left: 72
Name: Article Label Section: 1
Special Effect: Flat Tag: DetachedLabel
Text Align: Left Text Font Char 0 Set:
Top: 720 Visible: True
Width: 3087
Text Box: ArticleNo AllowAutoCorrect: True Auto Tab: False
Back Color: -2147483643 Back Style: Normal
Before Update: [Event Procedure] Border Color: 0
Border Line Style: Solid Border Style: First Page
Border Width: Hairline Can Grow: False
Can Shrink: False ColumnHidden: False
ColumnOrder: Default ColumnWidth: 750
Control Source: ArticleNo ControlType: 109
Decimal Places: Auto Display When: Always
Enabled: True Enter Key False Behavior:
Event Proc Prefix: ArticleNo FilterLookup: 1
Font Bold: No Font Italic: False
Font Name: MS Sans Serif Font Size: 8
Font Underline: False Font Weight: Normal
ForeColor: -2147483640 Height: 270
HelpContextld: 0 Left: 72
Locked: False Name: ArticleNo
Scroll Bars: Neither Section: 0
Special Effect: Sunken Status Bar Text: User entered Article Number
Tablndex: 0 TabStop: True
Text Align: Center Text Font Char 0 Set:
Top: 65 Visible: True
Width: 1089
Label: ArticleNo_ Label Back Color: -2147483633 Back Style: Transparent
Border Color: 0 Border Line Style: Solid
Border Style: All Pages Border Width: Hairline
Caption: Find Article ControlType: 100
Display When: Always Event Proc Prefix: ArticleNo_Label
Font Bold: Yes Font Italic: False
Font Name: MS Sans Serif Font Size: 10
Font Underline: False Font Weight: Bold
ForeColor: -2147483630 Height: 270
HelpContextld: 0 Left: 6912
Name: ArticleNo_Label Section: 1
Special Effect: Flat Text Align: General
Text Font Char 0 Top: 65 Set: Visible: True Width: 1725
Combo Box: cboMGroup AllowAutoCorrect: True Auto Expand: True
Back Color: -2147483643 Back Style: Normal
Border Color: 0 Border Line Style: Solid
C:\mmis\MISSprg.mdb Form: Articles
Friday, December 11, 1998 Page: 9
Border Style: First Page Border Width: Hairline
Bound Column: 2 Column Count: 2 Column Heads: False Column Widths: 1440;720
ColumnHidden: False ColumnOrder. Default ColumnWidth: Default Control Source: MGroupNo ControlType: 111 Decimal Places: Auto Display When: Always Enabled: True Event Proc Prefix: cboMGroup Font Bold: No Font Italic: False Font Name: MS Sans Serif
Font Size: 8 Font Underline: False Font Weight: Normal ForeColor: -2147483640 Height: 270 HelpContextld: 0 Left: 6051 Limit To List: True List Rows: 8 List Width: 0 Locked: False Name: cboMGroup Row Source Type: Table/Query Row Source: SELECT MGroups.MGroup,
MGroups.MGroupNo FROM MGroups; Section: 0 Special Effect: Sunken Status Bar Text: Link to the MAterial Group TabIndex: 3 TabStop: True Text Align: General Text Font Char 0 Top: 65 Set: Visible:
Command Button:
True
cmdClose
Width: 2871
Auto Repeat: False Cancel: False Caption: Command15 ControlTipText: &Exit
ControlType: 104 Default: False Display When: Always Enabled: True Event Proc Prefix: cmdClose Font Bold: No Font Italic: False Font Name: MS Sans Serif Font Size: 8 Font Underline: False Font Weight: Normal ForeColor: 0 Height: 591 HelpContextld: 0 Left: 10728 Name: cmdClose On Click: [Event Procedure] Picture: (bitmap)
PictureType: 0 Section: 1 TabIndex: 1 TabStop: True Text Font Char 0 Top: 65 Set: Transparent: False Visible: True Width: 576
Command Button: cmdDel
Auto Repeat: False Cancel: False Caption: Command14 ControlTipText: &Delete ControlType: 104 Default: False Display When: Always Enabled: True Event Proc Prefix: cmdDel Font Bold: No Font Italic: False Font Name: MS Sans Serif
Font Size: 8 Font Underline: False Font Weight: Normal ForeColor: 0 Height: 591 HelpContextld: 0 Left: 10020 Name: cmdDel
On Click: [Event Procedure) Picture: (bitmap)
C:\rnmis\MISSprg.mdb
Friday, December 11, 1998
Form: Articles
Page: 10
PictureType: 0 Section: 1 TabIndex: 0 TabStop: True Text Font Char 0 Top: 65 Set: Transparent: False Visible: True Width: 636
Command Button: cmdNew
Auto Repeat: False - Cancel: False
Caption: Command16 ControlTipText: &New
ControlType: 104 Default: False
Display When: Always Enabled: True
Event Proc Prefix: cmdNew Font Bold: No Font Italic: False Font Name: MS Sans Serif Font Size: 8 Font Underline: False Font Weight: Normal ForeColor. 0
Height: 591 HelpContextld: 0
Left: 9360 Name: cmdNew On Click: [Event Procedure] Picture: (bitmap)
PictureType: 0 Section: 1
TabIndex: 2 TabStop: True
Text Font Char 0 Top: 65 Set: Transparent: False Visible: True Width: 576
Combo Box: Combol7
After Update: [Event Procedure] AllowAutoCorrect: True
Auto Expand: True Back Color: -2147483643
Back Style: Normal Border Color: 0 Border Line Style: Solid Border Style: First Page
Border Width: Hairline Bound Column: 1 Column Count: 1 Column Heads: False
Column Widths: 1152 ColumnHidden: False ColumnOrder: Default ColumnWidth: Default
ControlType: 111 Decimal Places: Auto
Display When: Always Enabled: True
Event Proc Prefix: Combol7 Font Bold: No
Font Italic: False Font Name: MS Sans Serif Font Size: 8 Font Underline: False Font Weight: Normal ForeColor. -2147483640
Height: 262 HelpContextld: 0
Left: 6912 Limit To List: False
List Rows: 8 List Width: 1440
Locked: False Name: Combol7
Row Source Type: Table/Query Row Source: SELECT DISTINCTROW Articles.ArticleNo FROM Articles ORDER BY Articles.ArticleNo;
Section: 1 Special Effect: Sunken Tablndex: 3 TabStop: True Text Align: General Text Font Char 0
Set: Top: 327 Visible: True Width: 2304
Label: Labell0
Text Box: MGroupNo
After Update: [Event Procedure] Auto Tab: False Back Style: Normal Border Line Style: Solid Border Width: Hairline Can Shrink: False ColumnOrder: Default Control Source: MGroupNo Decimal Places: Auto Enabled: True
Event Proc Prefix: Font Bold: Font Name: Font Underline: ForeColor: HelpContextld: Locked: Scroll Bars: Special Effect: Tablndex: Text Align:
Top: Width:
MGroupNo No MS Sans Serif False -2147483640 0 False Neither Sunken 2 Center
65 786
C:\mmis\MISSprg.mdb Friday, December 11, 1998
Form: Articles Page: 11
Back Color: Border Color: Border Style: Caption: Display When: Font Bold: Font Name: Font Underline: ForeColor: HelpContextld: Name: Special Effect: Text Font Char Set: Visible:
-2147483633 0 All Pages Articles Entry Always Yes Times New Roman False -2147483630 0 Labe110 Flat 0
True
Back Style: Border Line Style: Border Width: ControlType: Event Proc Prefix: Font Italic: Font Size: Font Weight: Height: Left: Section: Text Align: Top:
Width:
AllowAutoCorrect: Back Color: Border Color: Border Style: Can Grow: ColumnHidden: ColumnWidth: ControlType: Display When: Enter Key Behavior: FilterLookup: Font Italic: Font Size: Font Weight: Height: Left: Name: Section: Status Bar Text: TabStop: Text Font Char Set: Visible:
Transparent Solid Hairline 100 Label() False 18 Bold 515 72 1 Left 65
2527
True -2147483643 0 First Page False False 600 109 Always False
1 False 8 Normal 270 5184 MGroupNo 0 Link to the MAterial Group True 0
True
Label: MGroupNo
Back Color: Border Color: Border Style: Caption: Display When: Font Bold: Font Name: Font Underline: ForeColor: HelpContextld: Name:
Label
-2147483633 0 All Pages Material Group Always Yes MS Sans Serif False -2147483630 0 MGroupNo Label
Back Style: Border Line Style: Border Width: ControlType: Event Proc Prefix: Font Italic: Font Size: Font Weight: Height: Left: Section:
Transparent Solid Hairline 100 MGroupNo_Label False 8 Bold 285 5256 1
C:\mmis\MISSprg.mdb Friday, December 11, 1998
Form: Articles Page: 12
Special Effect: Text Align:
Top: Width:
Flat Left
720 3666
Tag: Text Font Char Set: Visible:
DetachedLabel
0
True
Text Box: Price
After Update: Auto Tab: Back Style: Border Line Style: Border Width: Can Shrink: ColumnOrder: Control Source: Decimal Places: Enabled:
Event Proc Prefix: Font Bold: Font Name: Font Underline: ForeColor: Height: Left: Name: Section: Status Bar Text: TabStop: Text Font Char Set: Visible:
Label: Price Label
Back Color: Border Color: Border Style: Caption: Display When: Font Bold: Font Name: Font Underline: ForeColor: HelpContextld: Name: Special Effect: Text Align:
Top: Width:
[Event Procedure] False Normal Solid Hairline False Default Price Auto True
Price No MS Sans Serif False -2147483640 270 9000 • Price 0 Price of the Article True 0
True
-2147483633 0 All Pages Price Always Yes MS Sans Serif False -2147483630 0 Price Label Flat Right
AllowAutoCorrect: Back Color: Border Color: Border Style: Can Grow: ColumnHidden: ColumnWidth: ControlType: Display When: Enter Key Behavior: FilterLookup: Font Italic: Font Size: Font Weight: Format: HelpContextld: Locked: Scroll Bars: Special Effect: Tablndex: Text Align: Top:
Width:
Back Style: Border Line Style: Border Width: ControlType: Event Proc Prefix: Font Italic: Font Size: Font Weight: Height: Left: Section: Tag: Text Font Char Set: Visible:
True -2147483643
0 First Page False False 2310 109 Always False
1 False 8 Normal Currency 0 False Neither Sunken 4 Right 65
1062
Transparent Solid Hairline 100 Price_Label False 8 Bold 285 9000 1 DetachedLabel 0
True 720 1092
Combo Box: Type AllowAutoCorrect: True
Auto Expand: True
Back Color: -2147483643
Back Style: Normal
Border Color: 0
Border Line Style: Solid
Border Style: First Page
Border Width: Hairline
C:\mmis\MISSprg.mdb Friday, December 11, 1998
Form: Articles Page: 13
Bound Column: Column Heads: ColumnOrder. Control Source: Decimal Places: Enabled: Font Bold: Font Name: Font Underline: ForeColor. HelpContextld: Limit To List: List Width: Name: Row Source: Special Effect: TabIndex: Text Align:
Top: Width:
Label: Type Label
Back Color: Border Color: Border Style: Caption: Display When: Font Bold: Font Name: Font Underline: ForeColor: HelpContextld: Name: Special Effect: Text Align:
Top: Width:
1 False Default Type Auto True No MS Sans Serif False -2147483640 0 False 0 Type Stock;Consumable Sunken 5 Left
65 1179
-2147483633 0 All Pages Type Always Yes MS Sans Serif False -2147483630 0 Type Label Flat Left
Column Count ColumnHidden: ColumnWidth: ControlType: Display When: Event Proc Prefix: Font Italic: Font Size: Font Weight:
Height: Left: List Rows: Locked: Row Source Type: Section: Status Bar Text: TabStop: Text Font Char Set: Visible:
Back Style: Border Line Style: Border Width: ControlType: Event Proc Prefix: Font Italic: Font Size: Font Weight: Height: Left: Section: Tag: Text Font Char Set: Visible:
1 False 2310 111 Always Type False 8 Normal 270 10158 8 False Value List 0 Stock or Consumable True 0
True
Transparent Solid Hairline 100 Type_Label False 8 Bold 255 10158 1 DetachedLabel 0
True 720 1164
Code 1 Attribute VB_Name = "Form Articles"
2 Attribute VB_Creatable = True
3 Attribute VB_PredeclaredId = True
4 Attribute VBExposed = False
5 Option Compare Database
6 Option Explicit
7
8 Private Sub Article_BeforeUpdate(Cancel As Integer)
9 If DCount("Article", "Articles", "Article
'" & Article & "'") = 1 Then
10 MsgBox "An Article with this Description has already been entered.", vbExclamation, "Duplicate Article Description"
C:\mmis\MISSprg.mdb Friday, December 11, 1998
Form: Articles Page: 14
11 DoCmd.RunMacro "Hockey"
12 Cancel . True
13 End If
14 End Sub
15
16 Private Sub ArticleNo_BeforeUpdate(Cancel As Integer)
17 If DCount("ArticleNo", "Articles", "ArticleNo = 1 " & ArticleNo & n") = 1 Then
18 MsgBox °An Article with this Number has already been entered.", vbExclamation, "Duplicate Article Number°
19 Cancel . True
20 End If
21 End Sub
22
23 Private Sub Form_Delete(Cancel As Integer)
24 If DCount("ArticleNo", "Orders°, "ArticleNo = '" & ArticleNo & "'") > 0 Then
25 MsgBox "This Article is already linked to an Order and can not be Deleted!", vbCritical, "Invalid Delete Action"
26 Cancel = True
27 ElseIf DCount("ArticleNo", "RFQ", "ArticleNo = '" & ArticleNo & "'") > 0 Then
28 MsgBox "This Article is already linked to a RFQ and can not be Deleted!", vbCritical, "Invalid Delete Action"
29 Cancel = True
30 ElseIf DCount("ArticleNo", "Contracts", "ArticleNo = '" & ArticleNo & "'") > 0 Then
31 MsgBox "This Article is already linked to a Contract and can not be Deleted!", vbCritical, "Invalid Delete Action"
32 Cancel = True
33 End If
34 End Sub
35
36 Private Sub MGroupNo_AfterUpdate()
37 If DCount("MGroupNo", "MGroups", "MGroupNo = 1 " & MGroupNo & "'") = 0 Then
38 MsgBox "Please select a valid Material Group from the list.", vbExclamation, "Invalid Matertial Group"
39 DoCmd.RunMacro "Esckey"
40 End If
41 End Sub
42
43 Private Sub Price_AfterUpdate()
44 If Price <= 0 Then
45 MsgBox "Please enter a amount greater than zero.", vbExclamation, "Invalid Price"
46 DoCmd.RunMacro "Esckey", 2
47 End If
48 End Sub
49 Private Sub amdDel_Click()
50 On Error Resume Next
51 DoCmd.DoMenuItam acFormBar, acEditMenu, 8, acMenuVer70
52 DoCmd.DoMenuItem acFormBar, acEditMenu, 6, , acMenuVer70
53 End Sub
54 Private Sub amdClose_Click()
55 On Error Resume Next
56 DoCmd.Close
C:\rnmis\MISSprg.mdb Form: Articles
Friday, December 11, 1998 Page: 15
57
58
End Sub
Private Sub cmdNew_Click()
59 On Error Resume Next
60 DoCmd.OoToRecord , acNewRec
61 ArticleNo.SetFocus
62 End Sub
63 Sub Combol7_AfterUpdate()
64 ' Find the record that matches the control.
65 Me.RecordsetClone.FindFirst "[ArticleNo] I U & Mel[Combo17] & OtU
66 Me.Bookmark Me.RecordeetClone.Bookmark
67 ArticleNo.SetFocus
68 End Sub
69
User Permissions
admin
Flora
Kobus Martin
Group Permissions
Admins
Buyer
Codifier Stores
Users
Display When: Height: Name:
Visible:
Display When:
Height: Name: Visible:
Always
300 PageFooter
True
Always
840 PageHeader
True
C:\mmis\MlSSprg.mdb Friday, December 11, 1998
Report: OutstandingOrders Page: 16
Properties
Caption:
Date Created:
Fast Laser Printing:
Grid X:
GrpKeepTogether:
HelpContextld:
Layout for Print:
Max Button:
OrderByOn:
Page Footer:
Palette Source:
PictureAlignment:
PictureSizeMode:
PictureType:
Record Source:
Width:
InfoPerPGroup
22/10/98 8:06:26 PM
True
24
1
0
True
True
False
All Pages
(Default)
Always
Clip
0
CrosstabOutstanding
9300
Count:
DateGrouping:
FilterOn:
Grid Y:
HasModule:
Last Updated:
LogicalPageWidth:
Min Button:
Owner:
Page Header:
Picture:
PicturePages:
PictureTiling:
Record Locks:
Visible:
19
Use System Settings
False
24
False
01/11/98 1:37:45 PM
9360
True
admin
All Pages
(none)
Form.
False
No Locks
True
Objects
Group Level 0
Control Source: GroupHeader: GroupOn: SortOrder:
Section: Detail
Back Color: Can Shrink: Event Proc Prefix: Height: Keep Together:
NewRowOrCol: Visible:
PGroupNo False Each Value False
16777215 False Detail
360
True None True
GroupFooter: Groupinterval: Keep Together:
Can Grow: Display When:
Force New Page: In Selection:
Name: Special Effect:
False 1 No
False Always
None False
Detail Flat
Section: PageFooter
Back Color: 16777215 Event Proc Prefix: PageFooter '
In Selection: False Special Effect: Flat
Section: PageHeader
Back Color: 16777215 Event Proc Prefix: PageHeader In Selection: False
Special Effect: Flat
Section: ReportFooter
Back Color: 16777215
Can Shrink: False
Can Grow:
False
Display When:
Always
C:\mmis\MISSprg.mdb Friday, December 11, 1998 Report: OutstandingOrders Page: 17
Event Proc Prefix: Height: Keep Together: NewRowOrCol: Visible:
Image: Image5
Back Color: Border Color: Border Style: ControlType: Height: ImageWidth: Name: PictureAlignment: Section: Special Effect: Visible:
Label: Labell3 Back Color: Border Color: Border Style: Caption: Event Proc Prefix: Font Italic: Font Size: Font Weight: Height: Name: Special Effect: Text Font Char Set: Visible:
Label: Label27 Back Color: Border Color: Border Style: Caption: Event Proc Prefix: Font Italic: Font Size: Font Weight: Height: Name:
ReportFooter 0 True None True
16777215 0 All Pages 103 1320 14384 Image5 Always 1 Flat True
16777215 0 All Pages Purchasing Group Labell3 False 10 Bold 300 Labell3 Flat 0
True
16777215 0 All Pages No. of Outstanding Orders Label27 False 10 Bold 840 Label27
Force New Page: In Selection: Name: Special Effect:
Can Grow: Display When: Force New Page: In Selection: Name: Special Effect:
Back Style: Border Line Style: Border Width: Event Proc Prefix: ImageHeight: Left: Picture: PictureType: Size Mode: Top: Width:
Back Style: Border Line Style: Border Width: ControlType: Font Bold: Font Name: Font Underline: ForeColor: Left: Section: Text Align: Top:
Width:
Back Style: Border Line Style: Border Width: ControlType: Font Bold: Font Name: Font Underline: ForeColor. Left: Section:
None False ReportFooter Flat
False Always None False ReportHeader Flat
Transparent Solid Hairline Image5 10784 7140 CAMMIS\arrow2.GIF 0 Stretch 0 2044
Transparent Solid Hairline 100 Yes Times New Roman False 0 0 3 Left 180
4320
Transparent Solid Hairline 100 Yes Times New Roman False 0 4320 3
Section: ReportHeader Back Color: 16777215 Can Shrink: False Event Proc Prefix: ReportHeader Height: 1860 Keep Together: True NewRowOrCol: None Visible: True
C:\mmis\MlSSprg.mdb Friday, December 11, 1998
Report: OutstandingOrders Page: 18
Special Effect: Flat Text Align: Center
Text Font Char 0 Top: 0 Set: Visible: True Width: 1200
Label: Label28
Back Color: 16777215 Back Style: Transparent
Border Color: 0 Border Line Style: Solid
Border Style: All Pages Border Width: Hairline
Caption: Total No. of Orders ControlType: 100
Event Proc Prefix: Labe128 Font Bold: Yes
Font Italic: False Font Name: Times New Roman
Font Size: 10 Font Underline: False
Font Weight: Bold ForeColor: 0
Height: 780 Left: 7140
Name: Labe128 Section: 3
Special Effect: Flat Text Align: Left
Text Font Char 0 Top: 0 Set: Visible: True Width: 900
Label: Label35
Back Color: 16777215 Back Style: Transparent
Border Color: 0 Border Line Style: Solid
Border Style: All Pages Border Width: Hairline
Caption: % of Outstanding Orders ControlType: 100
Event Proc Prefix: Label35 Font Bold: Yes
Font Italic: False Font Name: Times New Roman
Font Size: 10 Font Underline: False
Font Weight: Bold ForeColor: 0
Height: 840 Left: 5760
Name: Label35 Section: 3
Special Effect: Flat Text Align: Center
Text Font Char 0 Top: 0 Set:
Visible: True Width: 1140
Label: Label36
Back Color: 16777215 Back Style: Transparent
Border Color: 0 Border Line Style: Solid
Border Style: All Pages Border Width: Hairline
Caption: Delivery Reliability ControlType: 100
Event Proc Prefix: Label36 Font Bold: Yes
Font Italic: False Font Name: Times New Roman
Font Size: 10 Font Underline: False
Font Weight: Bold ForeColor. 0
Height: 840 Left: 8280
Name: Label36 Section: 3
Special Effect: Flat Text Align: Left
Text Font Char 0 Top: 0 Set: Visible: True Width: 960
Label: Label37
Back Color: 16777215 Back Style: Transparent
Border Color: 0 Border Line Style: Solid
CAmmis\MISSprg.mdb Friday, December 11, 1998
Report: OutstandingOrders Page: 19
Border Style: Caption: Event Proc Prefix: Font Italic: Font Size: Font Weight: Height: Name: Special Effect: Text Font Char Set: Visible:
Line: Linel2
Border Color: Border Style: ControlType: Height: Line Slant: Section: Top: Width:
Line: Line32
Border Color: Border Style: ControlType: Height: Line Slant: Section: Top: Width:
Line: Line38 Border Color: Border Style: ControlType: Height: Line Slant: Section: Top: Width:
Text Box: PGroup Back Color: Border Color: Border Style: Can Grow: Control Source: Decimal Places: Font Bold: Font Name: Font Underline: ForeColor: Hide Duplicates:
All Pages Delivery Reliability Label37 False 26 Bold 720 Label37 Flat 0
True
0 First Page 102 0 False 4 0 9240
0 First Page 102 0 False 3 840 9240
0 First Page 102 0 False 3 0 9300
16777215 0 All Pages False PGroup Auto No Times New Roman False 0 False
Border Width: ControlType: Font Bold: Font Name: Font Underline: ForeColor. Left: Section: Text Align:
Top:
Border Line Style: Border Width: Event Proc Prefix:
Left: Name: Special Effect: Visible:
Border Line Style: Border Width: Event Proc Prefix: Left: Name: Special Effect: Visible:
Border Line Style: Border Width: Event Proc Prefix: Left: Name: Special Effect: Visible:
Back Style: Border Line Style: Border Width: Can Shrink: ControlType: Event Proc Prefix: Font Italic: Font Size: Font Weight: Height: Left:
Hairline 100 Yes Times New Roman False 0 60 1 Left 0
Solid 3 pt Line12 0 Line12 Flat True
Solid 3 pt Line32 0 Line32 Flat True
Solid 3 pt Line38 0 Line38 Flat True
Transparent Solid Hairline False 109 PGroup False 10 Normal 240 600
Width: 6660
CAmmisWISSprg.mdb Friday, December 11, 1998
Report: OutstandingOrders Page: 20
Name:
PGroup
Running Sum:
No
Section:
0
Special Effect:
Flat
Text Align:
General
Text Font Char
0 Set:
Top:
60
Visible:
True
Width:
3720
16777215
0 All Pages False =11ftlsNull([bdPerc]),1,([1xtTotal]-[txtOut])/[bdTotal])
2 No Anal
False
Top:
Width:
Text Box: Text10
Back Color: Border Color: Border Style: Can Grow: Control Source: Decimal Places:
Font Bold: Font Name: Font Underline:
ForeColor: Hide Duplicates:
Name: Section: Text Align:
Top: Width:
Text Box: Text34
Back Color: Border Color: Border Style:
Can Grow: Control Source:
Decimal Places: Font Bold: Font Name: Font Underline:
Back Style: Border Line Style: Border Width: Can Shrink: ControlType: Event Proc Prefix: Font Italic:
Font Size: Font Weight:
Height: Left: Running Sum: Special Effect: Text Font Char Set: Visible:
Back Style: Border Line Style:
Border Width: Can Shrink: ControlType: Event Proc Prefix: Font Italic: Font Size: Font Weight:
Height:
Left: Running Sum: Special Effect: Text Font Char Set:
Visible:
Back Style: Border Line Style:
Border Width: Can Shrink:
ControlType:
Event Proc Prefix: Font Italic: Font Size: Font Weight:
Transparent
Solid Hairline
False 109 PGroupNo False 10 Normal
240 0 No Flat 0
True
Transparent
Solid Hairline
False 109 Text10
True 9 Bold
300 4680 No Flat
0
True
Transparent
Solid Hairline
False 109
Text34 False 10 Normal
Text Box: PGroupNo
Back Color:
16777215
Border Color:
0 Border Style:
All Pages
Can Grow:
False Control Source:
PGroupNo
Decimal Places:
Auto Font Bold:
No
Font Name:
Times New Roman
Font Underline:
False
ForeColor:
0 Hide Duplicates:
False
Name:
PGroupNo
Section:
0 Text Align:
Left
60
540
16777215
0 All Pages False =Page " & [Page] & " of " & [Pages] Auto Yes Times New Roman
False
0 False Text10
4 Right
0 4560
CArnmis\MISSprg.mdb Friday, December 11, 1998
Report: OutstandingOrders Page: 21
ForeColor: Height: Left: Running Sum: Special Effect: Text Font Char Set: Visible:
0 240 8280 No Flat 0
True
Format: Hide Duplicates: Name: Section: Text Align: Top:
Width:
Percent False Text34 0 Center 60
900
Text Box: Text35
Back Color: 16777215 Border Color: 0 Border Style: All Pages Can Grow: False Control Source: ="Period: " &
Format([Forms]![DateDialog]![Startdate ],"dd-mmm-yyyy") & " to " & Format([Forms]![DateDialog]![EndDate] ,"dd-mmm-yyyy") Auto Yes Times New Roman False 0 False Text35 1 Left
Back Style: Border Line Style: Border Width: Can Shrink: ControlType:
Event Proc Prefix: Font Italic: Font Size: Font Weight: Height: Left: Running Sum: Special Effect: Text Font Char Set: Visible:
Transparent Solid Hairline False 109
Text35 False 12 Bold 300 60 No Flat 0
True
Decimal Places: Font Bold: Font Name: Font Underline: ForeColor: Hide Duplicates: Name: Section: Text Align:
Top: Width:
960 5100
Text Box: Text9
Back Color: Border Color: Border Style: Can Grow: Control Source: Decimal Places: Font Bold: Font Name: Font Underline: ForeColor: Height: Left: Running Sum: Special Effect: Text Font Char Set: Visible:
16777215 0 All Pages False =Now() Auto Yes Times New Roman False 0 300 0 No Flat 0
True
Back Style: Border Line Style: Border Width: Can Shrink: ControlType: Event Proc Prefix: Font Italic: Font Size: Font Weight: Format: Hide Duplicates: Name: Section: Text Align: Top:
Width:
Transparent Solid Hairline False 109 Text9 True 9 Bold Long Date False Text9 4 Left 0
4560
Text Box: txtOut
Back Color: Border Color: Border Style: Can Grow:
16777215 0 All Pages False
Back Style: Transparent Border Line Style: Solid Border Width: Hairline Can Shrink: False
CAmmis\MISSprg.mdb Friday, December 11, 1998
Report: OutstandingOrders Page: 22
Control Source: Decimal Places: Font Bold: Font Name: Font Underline: ForeColor: Hide Duplicates: Name: Section: Text Align:
Top: Width:
Text Box: txtPerc Back Color: Border Color: Border Style: Can Grow: Control Source: Decimal Places: Font Bold: Font Name: Font Underline: ForeColor: Height: Left: Running Sum: Special Effect: Text Font Char Set: Visible:
Number of Outstanding Orders Auto No Mal False 0 False txtOut 0 Center
60 1200
16777215 0 All Pages False =[txtOut]/[txtTotal] Auto No Arial False 0 240 5760 No Flat 0
True
ControlType: Event Proc Prefix: Font Italic: Font Size: Font Weight: Height: Left: Running Sum: Special Effect: Text Font Char Set: Visible:
Back Style: Border Line Style: Border Width: Can Shrink: ControlType: Event Proc Prefix: Font Italic: Font Size: Font Weight: Format: Hide Duplicates: Name: Section: Text Align: Top:
Width:
109 txtOut False 10 Normal 240 4320 No Flat 0
True
Transparent Solid Hairline False 109 txtPerc False 10 Normal Percent False txtPerc 0 Center 60
1140
Text Box: txtTotal
Back Color: 16777215 Border Color: Border Style: Can Grow: Control Source: Decimal Places: Font Bold: Font Name: Font Underline: ForeColor: Hide Duplicates: Name: Section: Text Align:
Top: Width:
0 All Pages False Total Number of Orders Auto No Arial False 0 False txtTotal 0 Center
60 900
Back Style: Border Line Style: Border Width: Can Shrink: ControlType: Event Proc Prefix: Font Italic: Font Size: Font Weight: Height: Left: Running Sum: Special Effect: Text Font Char Set: Visible:
Transparent Solid Hairline False 109 txtTotal False 10 Normal 240 7140 No Flat 0
True
User Permissions

C:\mmis\MlSSprg.mdb Friday, December 11, 1998
Report: OutstandingOrders Page: 23
admin
Flora
Kobus
Martin
Group Permissions
Admins
Buyer
Codifier
Stores
Users
C:\mmis'MlSSprg.mdb Friday, December 11, 1998 Macro: Autoexec Page: 24
Properties
Date Created:
17/07/98 2:02:45 PM
Last Updated: 10/08/98 12:59:22 PM
Owner:
admin
Actions
Name Condition Action Argument Value
ShowToolbar Toolbar Name: User Toolbar
Show: Yes User Toolbar
Echo
Echo On:
No
Status Bar Text: Hide results of macro running
SetWamings Warnings On: No Turn system messages off
User Permissions
admin
Flora
Kobus
Martin
Group Permissions
Admins
Buyer
Codifier
Stores
Users
C:\mmis\MISSprg.mdb Friday, December 11, 1998 Macro: EscKey Page: 25
Properties
Date Created:
17/07/98 2:02:45 PM
Last Updated: 17/07/98 2:02:45 PM
Owner: admin
Actions
Name Condition Action Argument Value
SendKeys Keystrokes: {ESC}
Wait: No Press the Escape Key
User Permissions
admin
Flora
Kobus
Martin
Group Permissions
Admins
Buyer
Codifier
Stores
Users
C:\mmis\MISSprg.mdb Friday, December 11, 1998
Macro: Find Page: 26
Properties
Date Created:
17/07/98 2:02:45 PM
Last Updated: 17/07/98 2:02:45 PM
Owner: admin
Actions
Name Condition Action Argument Value
Course
GoToControl Control Name: CourseNo Go to course no
FindRecord Find What: =[FindCourse]
Match: Whole Field
Match Case: No
Search: Down
Search As Formatted: No
Only Current Field: Yes
Find First: Find student matching input
Employee
GoToControl Control Name: EmployeeNo Employee No
FindRecord Find What: =[FindEmployee]
Match: Whole Field
Match Case: No
Search: Down
Search As Formatted: No
Only Current Field: Yes
Find First:
GoToControl Control Name: EmpName
EmpName
Centre
GoToControl Control Name: CentreNo Centre No
FindRecord Find What: =[FindCentrej
Match: Whole Field
Match Case: No
Search: Down
Search As Formatted: No
Only Current Field: Yes
Find First:
GoToControl Control Name: CentreName

C:\mmis\MISSprg.mdb Friday, December 11, 1998
Macro: Find Page: 27
Centre Name
User Permissions
admin
Flora
Kobus
Martin
Group Permissions
Admins
Buyer
Codifier
Stores
Users
C:\rnmis\MISSprg.mdb Friday, December 11, 1998
Macro: MenuBarHide Page: 28
Properties
Date Created:
10/07/98 9:30:42 AM
Last Updated: 10/07/98 9:30:42 AM
Actions
Name Condition Action Argument Value
Echo
Echo On:
Yes
Status Bar Text: Hides Menu
User Permissions
admin
Flora
Kobus
Martin
Group Permissions
Admins
Buyer
Codifier
Stores
Users
C:\mmis\MISSprg.mdb Friday, December 11, 1998
Module: Utilities Page: 29
Properties
Date Created:
17/07/98 2:02:46 PM
Last Updated: 12/10/98 8:50:40 AM
Owner: admin
Code 1 Attribute VB_Name . "Utilities"
2 Option Compare Database 'Use database order for string comparisons
3 Option Explicit
4
5 Function AreTablesAttached() As Integer
6 ' Update connection information in attached tables.
7
8 ' Number of attached tables for progress meter.
9 Const MAXTABLES = 18
10 Const NONEXISTENT TABLE = 3011
11 Const FliC_NOT_FOUND = 3024
12 Const ACCESS_DENIED = 3051
13 Const READ_ONLY_DATABASE = 3027
14
15 Dim DBASE As String
16 Dim TableCount As Integer
17 Dim filename As String, SearchPath As String, Temp As String
18 Dim ReturnValue As Variant, AccDir As String, i As Integer
19 Dim Start As Integer
20 Dim MyName As String
21 Dim Location As String
22 Dim Paths As String
23 Dim MyTable As TableDef
24 Dim MyWs As Workspace
.25 Dim MyDB As Database, MyRecords As Recordset
26 Set MyDB = DBEngine.Workspaces(0).Databases(0)
27
28 MyName = MyDB.Name
29 Start = InStr(1, MyName, "MISSprg.mdb", vbTextCompare) - 1
30 Location = Left$(MyDB.Name, Start)
31 Paths = Location & "MISScfg.mdb"
32
33 AreTablesAttached = True
34 Set MyTable = MyDB.TableDefs("Config")
35 MyTable.Connect = ";DATABASE=" & Paths
36 MyTable.RefreshLink
37
38 Paths = DLookup("DataLocation", "Config")
39
40 ' Initialize progress meter.
41 ReturnValue = SysCmd(SYSCMD_INITMETER, "Attaching tables", MAXTABLES)
C:\mmis\MISSprg.mdb Friday, December 11, 1998 Module: Utilities Page: 30
42
43 ' Loop through all tables, reattaching those with nonzero-length Connect strings.
44 TableCount . 1 ' Initialize TableCount for status meter.
45 For i = 0 To MyDB.TableDefs.Count - 1
46 Set MyTable = MyDB.TableDefs(i)
47 If MyTable.Connect <> °" Then
48 Select Case MyTable.SourceTableName
49 Case °Config°
50 GoTo 100
51 Case Else
52 MyTable.Connect = ";DATABASE=" & Paths & "\MISSdat.mdb;PWD=MISS"
53 End Select
54 If MyTable.SourceTableName = "Config" Then GoTo 100
55 Err = 0
56 MyTable.RefreshLink
57 If Err <> 0 Then
58 If Err . NONEXISTENT_TABLE Then
59 MsgBox "File & filename & "' does not contain required table '" & MyTable.SourceTableName & °'", 16, "Can't Run Solutions"
60 ElseIf Err . FHC_NOT_FOUND Then
61 MsgBox "You can't run FHC until you locate MISSDat.MDB", 16, "Can't Run Conf"
62 ElseIf Err = ACCESS_DENIED Then
63 MsgBox "Couldn't open " & filename & " because it is read- only or it is located on a read-only share.", 16, "Can't Run Solutions"
64 ElseIf Err = READ_ONLY_DATABASE Then
65 MsgBox °Can't reattach tables because MISSdat.MDB is read- only or is located on a read-only share.", 16, "Can't Run Solutions"
66 Else
67 MsgBox Error, 16, "Can't Attach"
68 End If
69 AreTablesAttached = False
70 GoTo Exit_Final
71 End If
72 TableCount = TableCount + 1
73 ReturnValue = SysCmd(SYSCMD_UPDATEMETER, TableCount)
74 End If
75 100 Next i
76
77 GoTo Exit_Final
78
79 Exit_Failed:
80 MsgBox "You can't run MISS until you locate MISSdat.MDB", 16, "Can't Run MISS"
81 AreTablesAttached = False
82
83 Exit_Final:
84 ReturnValue = SysCmd(SYSMD_REMOVEMETER)
85
86 End Function
87
C:\mmis\MlSSprg.mdb Friday, December 11, 1998
Module: Utilities Page: 31
88
89
90
91 Function IsLoaded(MyFormName)
92 ' Accepts: a form name
93 ' Purpose: determines if a form is loaded
94 ' Returns: True if specified the form is loaded;
95 ' False if the specified form is not loaded.
96 ' From: User's Guide Chapter 25
97
98 Dim i
99
100 IsLoaded . False
101 For i = 0 To Forms.Count - 1
102 If Forms(i).FormName = MyFormName Then
103 IsLoaded = True
104 Exit Function ' Quit function once form has been found.
105 End If
106 Next
107
108
109 End Function
110
111 Function RIsLoaded(MyReportName)
112 ' Accepts: a form name
113 ' Purpose: determines if a form is loaded
114 ' Returns: True if specified the form is loaded;
115 ' False if the specified form is not loaded.
116 ' From: User's Guide Chapter 25
117
118 Dim i As Integer
119
120 RIsLoaded = False
121 For i = 0 To Reports.Count - 1
122 If Reports(i).Name = MyReportName Then
123 RIsLoaded = True
124 Exit Function ' Quit function once form has been found.
125 End If
126 Next i
127
128 End Function
User Permissions
admin
Flora
Kobus Martin

C:\mmis\MISSprg.mdb Friday, December 11, 1998
Module: Utilities Page: 32
Group Permissions
Admins
Buyer Codifier
Stores
Users