Embed Size (px)
Citation preview

A Market Feasibility Study for an Independent Senior Rental Development
in Lexington, Minnesota
Prepared for:
Anoka County Housing and Redevelopment Authority Anoka, MN December 2010
615 First Avenue NE Suite 500 Minneapolis, MN 55413 612.338.0012

December 10, 2010 Mr. Tim Yantos Executive Director 2100 3rd Avenue Anoka, MN 55303 Dear Mr. Yantos: We are pleased to present our study titled “A Market Feasibility Study for an Independent Senior Rental Housing Project in Lexington, Minnesota.” The study quantifies the market potential for market rate and affordable independent rental housing by examining demographic growth trends and characteristics and the competitive market conditions for rental properties in the Study Area, evaluating the appropriateness of the subject Site for additional senior housing, and assessing the potential for the Site to capture a portion of market demand. The study found support for up to 70 independent rental units in the Lexington Market Area. Detailed recommendations and absorption projections can be found in the Conclusions and Recommendations section of this report. We have enjoyed completing this study and are available should you have any further questions or require additional information. Sincerely, MAXFIELD RESEARCH INC.
Mary Bujold Amanda Janzen President Research Analyst Attachment
612-338-0012 (fax) 612-904-7979 615 First Avenue NE, Suite 500, Minneapolis, MN 55413
www.maxfieldresearch.com
MAXFIELD RESEARCH INC.
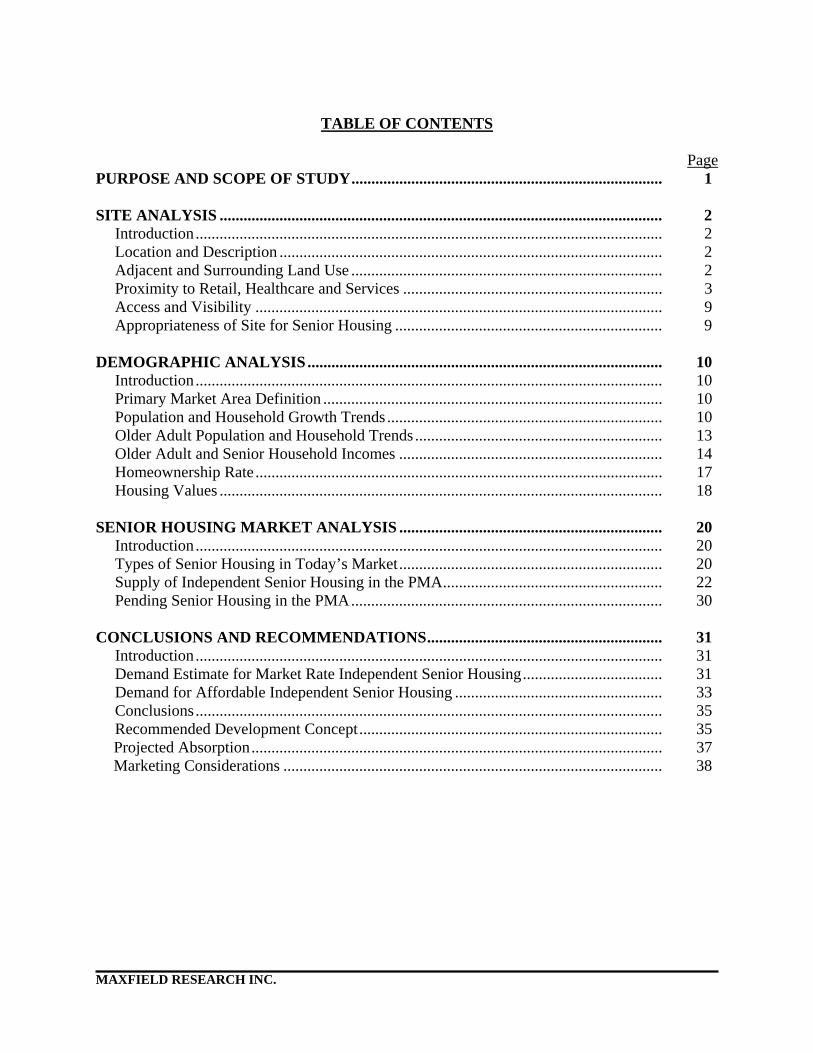
TABLE OF CONTENTS Page PURPOSE AND SCOPE OF STUDY.............................................................................. 1 SITE ANALYSIS ............................................................................................................... 2 Introduction..................................................................................................................... 2 Location and Description ................................................................................................ 2
Adjacent and Surrounding Land Use .............................................................................. 2 Proximity to Retail, Healthcare and Services ................................................................. 3 Access and Visibility ...................................................................................................... 9
Appropriateness of Site for Senior Housing ................................................................... 9 DEMOGRAPHIC ANALYSIS......................................................................................... 10 Introduction..................................................................................................................... 10 Primary Market Area Definition ..................................................................................... 10 Population and Household Growth Trends ..................................................................... 10 Older Adult Population and Household Trends .............................................................. 13 Older Adult and Senior Household Incomes .................................................................. 14 Homeownership Rate ...................................................................................................... 17 Housing Values ............................................................................................................... 18 SENIOR HOUSING MARKET ANALYSIS .................................................................. 20 Introduction..................................................................................................................... 20 Types of Senior Housing in Today’s Market.................................................................. 20 Supply of Independent Senior Housing in the PMA....................................................... 22 Pending Senior Housing in the PMA.............................................................................. 30 CONCLUSIONS AND RECOMMENDATIONS........................................................... 31 Introduction..................................................................................................................... 31 Demand Estimate for Market Rate Independent Senior Housing................................... 31 Demand for Affordable Independent Senior Housing .................................................... 33 Conclusions..................................................................................................................... 35 Recommended Development Concept............................................................................ 35
Projected Absorption....................................................................................................... 37 Marketing Considerations ............................................................................................... 38
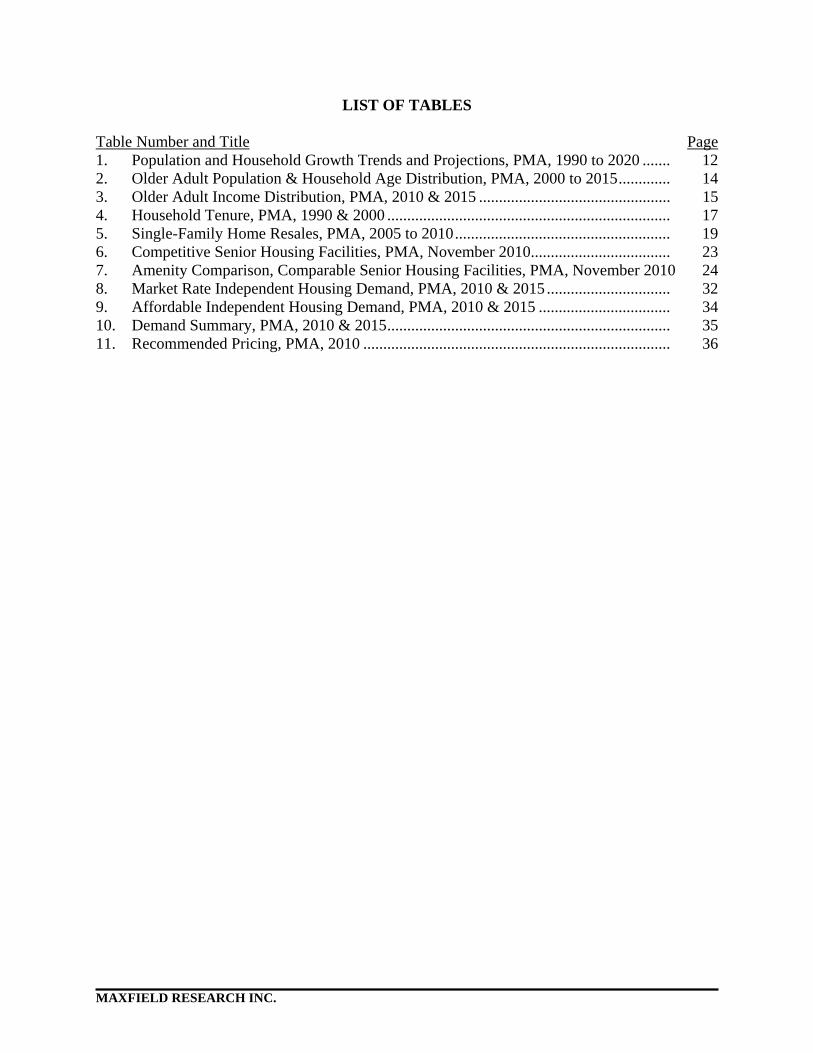
LIST OF TABLES Table Number and Title Page 1. Population and Household Growth Trends and Projections, PMA, 1990 to 2020 ....... 12 2. Older Adult Population & Household Age Distribution, PMA, 2000 to 2015............. 14 3. Older Adult Income Distribution, PMA, 2010 & 2015 ................................................ 15 4. Household Tenure, PMA, 1990 & 2000 ....................................................................... 17 5. Single-Family Home Resales, PMA, 2005 to 2010...................................................... 19 6. Competitive Senior Housing Facilities, PMA, November 2010................................... 23 7. Amenity Comparison, Comparable Senior Housing Facilities, PMA, November 2010 24 8. Market Rate Independent Housing Demand, PMA, 2010 & 2015 ............................... 32 9. Affordable Independent Housing Demand, PMA, 2010 & 2015 ................................. 34 10. Demand Summary, PMA, 2010 & 2015....................................................................... 35 11. Recommended Pricing, PMA, 2010 ............................................................................. 36
MAXFIELD RESEARCH INC.

PURPOSE AND SCOPE OF STUDY
Maxfield Research Inc. was engaged by Anoka County HRA to conduct a market feasibility study for independent senior rental housing on a site located in Lexington, Minnesota. The scope of this study includes an evaluation of the development potential at the Site in Lexington, a review of the demographic trends and characteristics of the primary draw area (“Market Area”) for senior housing, collection and analysis of competitive market data, and an estimation of demand for independent (adult/few services) housing that could be captured at the Subject location. Based on our analysis, we recommend an appropriate development concept that is sized to match the number of units supportable on the subject Site. This study includes both primary and secondary research. Primary research includes interviews with property managers/leasing agents and community development staff. All of the information on existing independent living developments was gathered by Maxfield Research Inc. through primary research and is accurate to the best of our knowledge. Secondary research is credited to the source when used and upon careful review of other factors that may impact projections, is used as a basis for analysis. Secondary sources of data include:
U.S. Census Bureau, Metropolitan Council, Regional Multiple Listing Service of Minnesota ESRI, U.S. Department of Housing and Urban Development, and National Center for Health Statistics.
Fieldwork for this study was completed by Maxfield Research Inc. on December 1, 2010.
MAXFIELD RESEARCH INC. 1
SITE ANALYSIS
Introduction This section of the report assesses the attributes of the Site as they relate to the appeal for the subject development. These attributes include community orientation and aesthetics, adjacent and surrounding land uses, proximity to area resources, access and visibility. These factors individually and collectively impact the attractiveness of a site for senior housing. Maxfield Research Inc. visited the Site on December 1, 2010 and assessed the location based on these factors. Location and Description The subject Site is located in Lexington, Minnesota, a community of 2,167 people (2010 estimate). Lexington is located in the northern portion of the Twin Cities Metro Area in Anoka County adjacent to Interstate 35W. The proposed location is the former Lexington City Hall building at the corner of Lexington Avenue and Lovell Road. The current building is being utilized as office/retail/commercial space. Some of the tenants include the Anoka County Human Services Center, Pizza Man, H&R Block, For the Journey Jewelry, and Bookateria. The current building would be removed to construct the new development. It is being considered to have some first floor commercial space in the new building, but no final decisions have been made. The existing tenants could relocate into the new building if it is financially feasible given the rent per square foot. A map showing the location of the subject Site is on the following page. Adjacent and Surrounding Land Use There are no incompatible land uses adjacent to the subject Site. Single-family homes dominate the areas west and north of the subject Site while two-story townhomes are located to the east. Retail and services are located to the south and southeast of the subject Site along Lake Drive.
MAXFIELD RESEARCH INC. 2

SITE ANALYSIS
Proximity to Retail, Healthcare and Services The Site is located in close proximity to numerous retail and services. There are several retail stores located just south of the subject Site, such as Dunn Brothers Coffee, Subway, Dominos, Nail Care, Tires Plus, Plaza Dry Cleaners, Scrapbook Shop, Papa Murphy’s, and Edward Jones Investment. More retail and services are located south of Lake Drive such as U.S. Bank, Walgreen’s, Liquor Barrel, McDonalds, Ace Hardware, and numerous other small retailers. The Northway Shopping Center is located further south along Lake Drive and offers a variety of shops some of which would appeal to seniors such as, Festival Foods, O’Reilly Auto Parts, Fam-ily Dollar, Monterey Mexican Restaurant, Great Clips, Benton Bakery, and Workout Express. The Village of Blaine offers more comprehensive retail needs with anchor tenants Home Depot, Cub Foods, Michaels and Wal Mart. It is located north of the Site along Lexington Avenue at I-35W in Blaine. The Village also includes numerous main street shops and restaurants such as Applebee’s, Caribou Coffee, Christopher & Banks, GNC, Green Mill, Pier 1 Imports, Maurices, Radio Shack and Axel’s Bonfire. The closest hospital is Unity Hospital in Fridley, which is about 8 miles from the subject Site. There are a number of medical clinics and physicians located within a 5-mile radius of the Site, giving seniors options for their health care needs. Proximity to places of worship is often important to seniors when choosing senior housing. Sen-iors would be able to participate in services at several churches in a variety of denominations lo-cated within a short driving distance of the Site. There are ten different churches within two miles of the Site and 24 churches within five miles.
MAXFIELD RESEARCH INC. 3

SITE ANALYSIS
Site Location
MAXFIELD RESEARCH INC. 4

SITE ANALYSIS
View of south side of existing building on proposed Site facing north from across Lovell Road.
View of east side of existing building on proposed Site facing southwest from across Lexington Avenue.
MAXFIELD RESEARCH INC. 5

SITE ANALYSIS
View of west side of existing building on proposed Site facing east from existing underutilized parking lot.
View of adjacent single-family homes and playground/park west of proposed Site.
MAXFIELD RESEARCH INC. 6

SITE ANALYSIS
View west along Lovell Road from entrance to parking lot on proposed Site.
View east of townhomes adjacent to proposed Site across Lexington Avenue.
MAXFIELD RESEARCH INC. 7

SITE ANALYSIS
View south from proposed Site of retail center on Lovell Road.
View southeast from proposed Site of Lexington Avenue and Lake Drive intersection beyond retail parking lot.
MAXFIELD RESEARCH INC. 8

SITE ANALYSIS
MAXFIELD RESEARCH INC. 9
Access and Visibility The Site is easily accessible via Lexington Avenue or Lovell Road. Interstate 35W can be ac-cessed from Lovell Road about one-half mile west of the Site, giving seniors convenient access to other Twin Cities communities. Visibility is excellent from Lexington Avenue and Lovell Road in all directions. This would allow the proposed senior housing community to be easily accessed by residents and families in Lexington as well as those in the surrounding area. Appropriateness of Site for Senior Housing The subject location is well-suited for senior housing. Adjacent and surrounding land uses are compatible with senior housing. The Site is located within a short distance of numerous retail, healthcare, churches and community services. The Site has good access from Lexington Avenue and Lovell Road. Overall, the location should be well-received by people seeking independent (adult/few services) senior housing in the surrounding area.
DEMOGRAPHIC ANALYSIS
Introduction This section of the report examines key demographic factors that would impact demand for senior housing in Lexington, and specifically independent senior housing. Included are a review of overall population and household growth trends and an analysis of the demographic composition of the older adult and senior population for the area determined to be the primary draw area for senior housing in Lexington. The demographic characteristics of the primary draw area are factored into our demand calculations, which are presented in a following section. Primary Market Area Definition Maxfield Research Inc. determined the draw area for senior housing in Lexington based on traffic and community orientation patterns, geographic and man-made barriers, the location of competitive senior housing, and our experience in senior housing feasibility. We define the draw area, or Primary Market Area (“PMA”) as the following communities: Lexington, Blaine, Centerville, Circle Pines, and Lino Lakes. Based on the characteristics of the subject development, we estimate that the defined PMA would provide 80% of the total support for the subject development. The remaining portion of demand would be derived from outside the defined PMA. This portion of demand would be comprised of people currently residing just outside the PMA who have an orientation to the area (i.e. church, doctor, etc.), people who once resided in the area and desire to return and parents of adult children living in the PMA. A map of the PMA is displayed on the next page. Population and Household Growth Trends Table 1 shows population and household growth trends and projections for the PMA from 1990 to 2020. The data from 1990 and 2000 is from the U.S. Census Bureau, while the 2010 estimates and 2020 projections are from ESRI, a nationally recognized demographics firm, and the Metropolitan Council, with adjustments downward by Maxfield Research Inc. to account for the slowed growth due to the current economic slowdown. The following points are principle conclusions from Table 1: As of 2000, the PMA contained 71,812 people and 24,376 households. The City of
Lexington accounted for roughly 3% of the population in the PMA overall. Between 2000 and 2010, the PMA is estimated to have increased by 27.5% and 31.3% in the
population and household bases, respectively. However, the population of Lexington is estimated to have declined by roughly 50 people (-2%) by 2010. Lexington is nearly fully developed and, as a result, there have been few opportunities for growth.
By 2020, the PMA is projected to contain an estimated 108,710 people and 39,545
households, an increase of about 18.7% in the population and 23.5% in the household base.
MAXFIELD RESEARCH INC. 10

DEMOGRAPHIC ANALYSIS
MAXFIELD RESEARCH INC. 11
Primary Market Area

DEMOGRAPHIC ANALYSIS
Estimate Forecast
1990 2000 2010 2020 No. Pct. No. Pct. No. Pct.
POPULATIONLexington 2,279 2,214 2,167 2,250 -65 -2.9 -47 -2.1 83 3.8Remainder of the PMA 54,119 69,598 89,418 106,460 15,479 28.6 19,820 28.5 17,042 19.1
Market Area Total 56,398 71,812 91,585 108,710 15,414 27.3 19,773 27.5 17,125 18.7
HOUSEHOLDSLexington 829 847 817 950 18 2.2 -30 -3.5 133 16.3Remainder of the PMA 17,509 23,529 31,198 38,595 6,020 34.4 7,669 32.6 7,397 23.7
Market Area Total 18,338 24,376 32,015 39,545 6,038 32.9 7,639 31.3 7,530 23.5
1990 to 2000 2000 to 2010 2010 to 2020
TABLE 1POPULATION AND HOUSEHOLD GROWTH TRENDS AND PROJECTIONS
PRIMARY MARKET AREA
ChangeU.S. Census
Sources: U.S. Census; ESRI; Metropolitan Council; Maxfield Research Inc.
1990 to 2020
MAXFIELD RESEARCH INC. 12

DEMOGRAPHIC ANALYSIS
Older Adult (Age 55+) Population and Household Trends Table 2 shows the age distribution of people and households age 55 and older in the PMA. His-torical information for 2000 is supplied by the U.S. Census Bureau. Estimates for 2010 and pro-jections through 2015 were calculated by Maxfield Research Inc. based on demographic informa-tion supplied by ESRI and the Metropolitan Council. The following points are key observations from Table 2: There were 8,497 older adults and seniors (age 55+) in the PMA in 2000. Seniors (age 65+)
comprised 5% and 9% of the total population and household bases, respectively. The PMA’s older adult and senior population and household bases are estimated to have ex-
perienced strong growth in all age segments between 2000 and 2010. Between 2000 and 2010, the PMA’s older adult and senior population (55+) grew by 6,801 people (80%) and 4,073 households (79%).
Projected forward, the older adult and senior population is anticipated to grow through 2015.
Between 2010 and 2015, the PMA’s older adult and senior population is projected to add 3,825 people (25%) and 2,442 households (26.5%).
The highest numerical growth will be among older adults ages 55 to 64. The highest per-
centage growth however, will be among the 65 to 69 age cohort. Over the next five years, older adults (age 55 to 64) are projected to increase by 1,753 people. Seniors between the ages of 65 to 69 are projected to increase by 39.9% (996 people).
Typically, seniors ages 70 and older have the highest propensity to move into independent
housing. However, we currently see a trend in which projects are attracting people in their mid to late 60s, especially in projects with an ownership structure such as townhomes, con-dominiums and cooperatives.
The PMA is a newer suburban area in the Twin Cities Metro Area and much of its develop-
ment has occurred over the past decade. New suburban areas generally have a younger popu-lation compared to urban areas or first-tier suburbs where seniors have resided for many years. Hence, the proportion of the total population that is 55 and older is relatively low. However, Lexington, Circle Pines and Centerville are all older communities which are fully developed and have higher proportions of seniors compared to Blaine and Lino Lakes.
MAXFIELD RESEARCH INC. 13

DEMOGRAPHIC ANALYSIS
Age 2000 2010 20154,914 9,051 10,804 4,137 84.2% 1,753 19.4%1,401 2,497 3,493 1,096 78.2% 996 39.9%1,016 1,591 2,190 575 56.6% 599 37.7%
664 1,081 1,360 417 62.8% 279 25.8%338 648 749 310 91.6% 101 15.6%164 430 526 266 162.2% 96 22.4%
8,497 15,298 19,123 6,801 80.0% 3,825 25.0%3,583 6,247 8,318 2,664 74.3% 2,072 33.2%1,166 2,159 2,635 993 85.1% 476 22.1%
Tot. Pop. 71,812 91,585 100,148 19,773 27.5% 8,563 9.3%
Age 2000 2010 20152,925 5,333 6,366 2,408 82.3% 1,032 19.4%1,534 2,484 3,487 950 61.9% 1,003 40.4%
700 1,415 1,821 715 102.1% 407 28.7%
5,159 9,232 11,674 4,073 78.9% 2,442 26.5%2,234 3,898 5,308 1,664 74.5% 1,410 36.2%
700 1,415 1,821 715 102.1% 407 28.7%
Tot. HH 24,376 32,015 35,780 7,639 31.3% 3,765 11.8%
Sources: U.S. Census Bureau; ESRI.; Maxfield Research Inc.
2010-2015
55 to 64
Total 55+
TABLE 255+ POPULATION & HOUSEHOLD AGE DISTRIBUTION
PRIMARY MARKET AREA2000-2015
70 to 7475 to 79
Total 75+
65 to 7475 +
Total 55+Total 65+
55 to 64
HOUSEHOLDS
2000-2010
Total 75+Total 65+
80 to 8485 +
POPULATION
2000-2010 2010-2015
65 to 69
Older Adult and Senior Household Incomes Table 3 shows incomes for older adult and senior households in the PMA in 2010 and 2015 based on information provided by ESRI. The data in Table 3 helps determine demand for senior housing based on the size of the market at specific income levels. This data is incorporated into our demand calculations, which are presented in a following section. It is important to note that the data does not account for the asset base of senior households or supplemental income that a senior household could gain from the proceeds of a sale of a home or from contributions from family members. The frailer the senior, the greater the proportion of their income they will typically spend on housing and services. Studies have shown that seniors are willing to pay increasing proportions of their incomes on housing with services, beginning with an income allocation of 40% to 50% for market rate adult senior housing with little or no services, increasing to 65% for congregate (independent with some services) and to 80% to 90% for assisted living and memory care housing. The proceeds from the sales of their homes, as well as financial assistance from their adult children, are often used as supplemental income in order to afford senior housing alternatives.
MAXFIELD RESEARCH INC. 14

DEMOGRAPHIC ANALYSIS
No. Pct. No. Pct. No. Pct. No. Pct.Under $15,000 95 1.8 168 6.7 216 15.3 383 9.8$15,000-$24,999 140 2.6 262 10.6 217 15.3 479 12.3$25,000-$34,999 173 3.2 219 8.8 105 7.4 324 8.3$35,000-$49,999 446 8.4 515 20.7 139 9.8 654 16.8$50,000-$74,999 1,322 24.8 439 17.7 154 10.9 593 15.2$75,000-$99,999 1,018 19.1 247 9.9 166 11.7 412 10.6$100,000 or more 2,140 40.1 634 25.5 418 29.6 1,053 27.0
Total 5,333 100.0 2,484 100.0 1,415 100.0 3,898 100.0
Median Income
No. Pct. No. Pct. No. Pct. No. Pct.Under $15,000 64 1.0 163 4.7 242 13.3 405 7.6$15,000-$24,999 105 1.6 199 5.7 163 9.0 362 6.8$25,000-$34,999 134 2.1 203 5.8 93 5.1 296 5.6$35,000-$49,999 309 4.8 478 13.7 124 6.8 602 11.3$50,000-$74,999 1,357 21.3 647 18.5 227 12.4 873 16.5$75,000-$99,999 1,124 17.7 408 11.7 217 11.9 625 11.8$100,000 or more 3,274 51.4 1,389 39.8 756 41.5 2,145 40.4
Total 6,366 100.0 3,487 100.0 1,821 100.0 5,308 100.0
Median Income
No. Pct. No. Pct. No. Pct. No. Pct.
Under $15,000 -31 -32.7 -5 -2.7 26 12.0 21 5.6$15,000-$24,999 -35 -25.1 -64 -24.2 -54 -24.9 -117 -24.5$25,000-$34,999 -39 -22.5 -16 -7.3 -12 -11.5 -22 -6.9$35,000-$49,999 -137 -30.8 -37 -7.2 -15 -10.6 -51 -7.9$50,000-$74,999 35 2.6 208 47.3 72 47.0 280 47.2$75,000-$99,999 106 10.4 161 65.4 51 31.1 213 51.6$100,000 or more 1,134 53.0 755 119.0 337 80.6 1,092 103.8
Total 1,032 19.4 1,003 40.4 407 28.7 1,415 36.3
Median Income $14,958 17.2 $23,857 43.8 $27,152 49.4 $25,049 45.9
Sources: ESRI; Maxfield Research Inc.
TABLE 3OLDER ADULT INCOME DISTRIBUTION
PRIMARY MARKET AREA2010 & 2015
2010
55-64 65-74 75+ Total 65+
$87,070 $54,449 $55,000 $54,593
2015
55-64 65-74 75+ Total 65+
$102,028 $78,307 $82,151 $79,641
Change 2010-2015
55-64 65-74 75+ Total 65+
MAXFIELD RESEARCH INC. 15

DEMOGRAPHIC ANALYSIS
The following are key points from Table 3: In 2010, the median income for all age 65+ households in the PMA was $54,593. Within
this age group, the median income for households between the ages of 65 and 74 was $54,449 and among age 75 and older households was $55,000. The higher median income for younger seniors (age 65 to 74) compared to older seniors (age 75+) is primarily due to the fact that a higher proportion of younger seniors are married and are more likely to have two pensions, along with the fact that many younger seniors continue to have income-producing employment.
The target market for market rate senior rental housing is senior households age 65 and older
with incomes of at least $30,000 (plus senior homeowners with incomes of at least $20,000). A small portion of older adults, ages 55 to 64, may also choose age-restricted housing, but overall, they usually account for only a small portion of the demand within any given market area. As of 2010, there are roughly 2,874 older senior households (age 65+) in the PMA with incomes of at least $30,000, accounting for 73% of all older senior households.
Adjusted for inflation, the number of senior households (65+) projected to income-qualify for
market rate senior housing (households with incomes of at least $35,000) is expected to in-crease by about 1,372 households through 2015, at which point there will be approximately 4,246 senior households that will be age/income-qualified.
This study also considers the portion of senior households that cannot afford market rate sen-
ior housing alternatives. According to information from the Minnesota Housing Finance Agency, the following are current income-restrictions for subsidized and affordable housing in the County:
% Area Median Income One-Person Two-Person30% AMI $17,650 $20,20050% AMI $29,400 $33,60080% AMI $45,100 $51,550
Household Size
Based on the income-restrictions detailed above, a significant portion of seniors (65+) would
be income-qualified for subsidized and affordable housing. After adjusting for typical household sizes, approximately 623 senior households would qualify for deep-subsidy hous-ing (i.e. 30% AMI or below) and 401 would qualify for affordable housing (i.e. between 30% AMI and 50% AMI). The remaining households would qualify for some of the more lenient affordable housing that has income-restrictions up to 80% AMI.
The majority of subsidized and affordable housing options cater to very low-income or mod-
erate-income seniors who are independent and do not need personal care or other services. For seniors who require additional assistance and would be better served in an assisted living environment, Medicare funds, waivers and other forms of financial assistance are often ac-cepted in order to cover the cost of assisting living care.
MAXFIELD RESEARCH INC. 16

DEMOGRAPHIC ANALYSIS
Homeownership Rate Table 4 shows the number of older adult and senior households that owned and rented their housing in the PMA in 1990 and 2000 according to the U.S. Census. This information lends insight into the number of households that may still have homes to sell and could potentially supplement their incomes from the sales of their homes to support monthly fees for alternative housing. The PMA maintains high rates of homeownership even in the later life years of its residents.
The homeownership rate in 2000 was 95% for age 55 to 64 households, which decreased only slightly to 83% for age 65 to 74 households, and 79% for households age 75 and older.
As seniors age, they may no longer desire or be able to maintain their single-family homes.
They may prefer to move into housing that offers them greater freedom from home maintenance and/or offers them support services. This movement pattern is demonstrated by the significant drop in homeownership between the age group of 65 to 74 (93%) and the 75+ age group (79%).
With a homeownership rate of 88% for all households over the age of 65, a sizeable portion
of residents would be able to use proceeds from the sales of their homes toward senior housing alternatives. The resale of single-family homes would allow additional senior households to qualify for market rate housing products, since equity from the home sale could be used as supplemental income for alternative housing. Some low-income homeowner households would not qualify for affordable housing, as these households would have additional equity that could be converted to monthly income following the sales of their home.
Own Rent Own Rent Own Rent Own Rent
No. of Households 2,823 138 1,398 104 615 162 2,013 266Homeownership Rate
No. of Households 1,717 75 819 72 276 31 1,095 103Homeownership Rate
No. of Households 1,106 63 579 32 339 131 918 163Homeownership Rate 64% 84% 71% 44% 123% 423% 84% 158%
Sources: U.S. Census Bureau, Maxfield Research Inc.
2000
95% 93% 79% 88%
Age of Householder
55-64 65-74 75+ Total 65+
TABLE 4OLDER ADULT HOUSEHOLD TENURE
PRIMARY MARKET AREA1990 & 2000
Change 1990 - 2000
1990
96% 92% 90% 91%
MAXFIELD RESEARCH INC. 17
DEMOGRAPHIC ANALYSIS
Housing Values Table 5 presents home resale data for Lexington and the PMA from the Regional Multiple List-ing Service of Minnesota. The data is presented from 2005 through October 2010. This data is useful in that it represents the amount of equity that seniors may be able to derive upon the sale of their homes, which could potentially be used to defray the costs of senior housing alternatives. In 2010, the average sales price of a single-family home in the PMA is $222,000 and the me-
dian sale price is $200,500. Median prices are generally a better indicator of home resale value as they are not heavily impacted by uncommonly high- or low-priced homes.
Sale prices in Lexington are appreciably lower than the PMA as a whole. The median sale
price in Lexington in 2010 is $130,000 compared to $200,500 in the PMA. Consistent with housing conditions across the Nation, home values have depreciated in the
PMA due to the slow down in the housing market and economy. From 2005 to 2010, the median sales price in the PMA decreased 25.0%. However, sales through October 2010 in-dicate that the median sales price increased by $1,250, the first increase in five years.
Based on the 2010 median home value in Lexington ($130,000), a senior household could
generate approximately $3,025 of additional income annually (about $252 per month), if they invested in an income-producing account (2.5% interest rate) after accounting for mar-keting costs and/or real estate commissions (7% of home sale price).
MAXFIELD RESEARCH INC. 18

DEMOGRAPHIC ANALYSIS
MAXFIELD RESEARCH INC. 19
No. of Average Median AverageArea Sales Price Price DOM
2010* 11 $150,627 $130,000 612009 14 $152,861 $146,250 472008 18 $167,543 $172,500 1132007 14 $174,864 $158,150 832006 10 $223,325 $218,500 562005 25 $201,398 $199,900 90
% Change 2005-2010 -25.2% -35.0%
2010* 644 $222,000 $200,500 672009 866 $220,696 $199,250 722008 735 $254,239 $222,500 822007 714 $297,668 $254,500 772006 909 $305,160 $264,500 672005 1,126 $295,964 $267,250 70
% Change 2005-2010 -25.0% -25.0%
Sources: Multiple Listing Service; Maxfield Research Inc.
TABLE 5SINGLE-FAMILY HOME RESALE VALUES
PRIMARY MARKET AREA2005 to 2010*
* January 1, 2010 to October 31, 2010
Lexington
Primary Market Area
SENIOR HOUSING MARKET ANALYSIS
Introduction The preceding section examined demographic factors that impact demand for senior housing products. This section provides an overview of contemporary senior housing alternatives and an assessment of the current supply of competitive service-enriched housing in the PMA. Additionally, any planned or pending senior housing developments are identified that may compete with the subject development and would satisfy some potential demand for senior housing products in Lexington. Types of Senior Housing in Today’s Market For analytical proposes, Maxfield Research Inc. classifies market rate senior housing into four categories based on the level and type of services offered: Active Adult properties (or independent living without services available) are similar to a
general-occupancy apartment building, in that they offer virtually no services but have age-restrictions (typically 55 or 62 or older). Organized activities and occasionally a transportation program are usually all that are available at these properties. Because of the lack of services, active adult properties typically do not command the rent premiums of more service-enriched senior housing.
Congregate properties (or independent living with services available) offer support services
such as meals and/or housekeeping, either on an optional basis or a limited amount included in the rents. These properties typically dedicate a larger share of the overall building area to common areas, in part, because the units are smaller than in adult housing and in part to encourage socialization among residents. Congregate properties attract a slightly older target market than adult housing, typically seniors age 75 or older. Rents are also above those of the active adult buildings, even excluding the services. Sponsorship by a nursing home, hospital or other health care organization is common.
Assisted Living properties come in a variety of forms, but the target market for most is generally the same: very frail seniors, typically age 80 or older (but can be much younger, depending on their particular health situation), who are in need of extensive support services and personal care assistance. Absent an assisted living option, these seniors would otherwise need to move to a nursing facility. At a minimum, assisted living properties include two meals per day and weekly housekeeping in the monthly fee, with the availability of a third meal and personal care (either included in the monthly fee or for an additional cost). Assisted living properties also have either staff on duty 24 hours per day or at least 24-hour emergency response.
Memory Care properties, designed specifically for persons suffering from Alzheimer’s
disease or other dementias, is one of the newest trends in senior housing. Properties consist mostly of suite-style or studio units or occasionally one-bedroom apartment-style units, and large amounts of communal areas for activities and programming. In addition, staff typically undergoes specialized training in the care of this population. Because of the greater amount
MAXFIELD RESEARCH INC. 20

SENIOR HOUSING MARKET ANALYSIS
of individualized personal care required by residents, staffing ratios are much higher than traditional assisted living and thus, the costs of care are also higher. Unlike conventional assisted living, however, which deals almost exclusively with widows or widowers, a higher proportion of persons afflicted with Alzheimer’s disease are in two-person households. That means the decision to move a spouse into a memory care facility involves the caregiver’s concern of incurring the costs of health care at a special facility while continuing to maintain their home.
Skilled Nursing Care, or long-term care facilities, provides a living arrangement that
integrates shelter and food with medical, nursing, psychosocial and rehabilitation services for persons who require 24-hour nursing supervision. Residents in skilled nursing homes can be funded under Medicare, Medicaid, Veterans, HMOs, insurance as well as use of private funds.
Townhome or Apartment
Fully or Highly Dependent on Care
Senior Housing Product Type
Fully Independent
Source: Maxfield Research Inc.
FIGURE 1
Single-Family Home
CONTINUUM OF HOUSING AND SERVICES FOR SENIORS
Age-Restricted Independent Single-Family or Townhomes or Apartments or Condominiums or
Cooperatives
Congregate Apartments w/ Optional Services
Congregate Apartments w/ Intensive Services
Assisted Living
Memory Care (Alzheimer's Units)
Nursing Facilities
The senior housing products available today, when combined with long-term care facilities form a full continuum of care, extending from virtually a purely residential model to a medically intensive one. Often the services available at these properties overlap with another making these definitions somewhat ambiguous. In general, active adult properties tend to attract younger active seniors, who merely wish to rid themselves of home maintenance; congregate properties serve independent seniors that desire support services (i.e., meals, housekeeping, transportation, etc.) while assisted living properties tend to attract older, frail seniors who need assistance with daily activities, but not the skilled medical care available only in a nursing facility.
MAXFIELD RESEARCH INC. 21

SENIOR HOUSING MARKET ANALYSIS
MAXFIELD RESEARCH INC. 22
Supply of Independent Senior Housing in the PMA Maxfield Research identified and collected market information on eight competitive senior properties in the PMA. The PMA developments contain a combined 429 units. Information regarding age of the structure, number of units, vacancies, unit mix and sizes, and monthly rents are displayed in Table 6, while Table 7 provides a comparison of amenities and services available at the properties. The following discussion summarizes findings from our survey of existing independent senior housing properties in the PMA.
Competitive Senior Properties

SENIOR HOUSING MARKET ANALYSIS
Year Units/Project Name Built Vacant Comments
Blaine Town Square 2005 83 11 - 1BR 721 - 909 $800 - $9502401 108th Lane NE 0 12 - 1BR/D 788 - 862 $890 - $945Blaine 0.0% 42 - 2BR 1,043 - 1,282 $1,100 - $1,295
18 - 2BR/D 1,249 - 1,381 $1,295 - $1,400Cloverleaf Courts 2000 102 9 - 0BR 566 - 5791011 Cloverleaf Parkway 0 71 - 1BR 702 - 886 $700 - $967Blaine 0.0% 22 2BR 886 - 1,030 $967 - $1,241Chauncey Barrett I 1998 16 2 - 1BR7026 Centerville Road 0 6 - 1BR/DCenterville 0.0% 8 - 2BRChauncey Barrett II 2004 31 8 - 1BR 703 - 7867026 Centerville Road 2 13 - 1BR/D 907 - 925Centerville 6.5% 10 - 2BR 964 - 1,024Pines Manor Estates 2005 44 18 - 1BR96 South Drive 1 6 - 1BR/DCircle Pines 2.3% 20 - 2BR 978 - 1,264 $1,130 - $1,315
Total / Average 276 Vacant Units 3
Blaine Town Square 2005 4 4 - 1BR2401 108th Lane NE 0Blaine 0.0%Blaine Court 1991 54 43 - 1BR 696 - 835 $617 - $648701 85th Avenue NE 0 11 - 2BR 833 - 933 $741 - $762Blaine 0.0%Oak Hills Manor 1995 48 12 - 1BR 704 - 774820 Civic Heights Drive 6 36 - 2BR 863 - 971 $705 - $730Circle Pines 12.5%Willow Ponds 1996 47 6 - 1BR101 Willow Pond Trail 0 41 - 2BR 878 - 930 $830 - $840Lino Lakes 0.0%
Total / Average 153 Vacant Units 6
Source: Maxfield Research Inc.
916 $9801.1%
$718
728 $720
AFFORDABLE721 $656 Four 1BR units affordable at 50% of AMI in
building with 83 market rate units.
TABLE 6MARKET RATE AND AFFORDABLE INDEPENDENT SENIOR HOUSING FACILITIES
PRIMARY MARKET AREANovember 2010
BaseUnit Mix Unit Size Monthly Fees
MARKET RATE
Age restricted 55+. Managed by Great Lakes. All units are market rate.
$1,030
Age restricted 55+. Managed by Twin City Christian Homes. All units are market rate.
$874$820$902
$1,011732832
$743$804
Age restricted 55+. Managed by Twin City Christian Homes. 8 residents uses Section 8 voucher. 46 units affordable at 50% of AMI.Age restricted 55+. All units affordable at 60% of AMI.
Age restricted 55+. Managed by Great Lakes. 2 units are HOME program units with income limits.Age restricted 55+. 1 resident uses Section 8 voucher.
$830
$645
3.9%
Age restricted 55+. All units affordable at 60% of AMI.
822
Age restricted 62+. Average age low 80s. All units are market rate except four 1BR units affordable at 50% of AMI listed under afforable units.
$530
750970
1,005
MAXFIELD RESEARCH INC. 23

SENIOR HOUSING MARKET ANALYSIS
MAXFIELD RESEARCH INC. 24
A/C
Dis
hwas
her
Mic
row
ave
Ove
n
W/D
Wal
k-in
Clo
set
Bal
cony
/Pat
io
Em
erge
ncy
Cal
l
Com
mun
ity
Rm
.
Din
ing
Rm
.
Cra
ft/H
obby
Rm
.
Lib
rary
Ter
race
/Por
ch
Sto
rage
Loc
kers
Exe
rcis
e R
m.
Gar
age
Par
king
Gue
st S
uite
Tra
nspo
rtat
ion
Act
ivit
ies
Hou
seke
epin
g
Mea
ls
Other Features
ADULT/FEW SERVICESBlaine Town Square Y Y Y Y N N N Y Y N N N N Y UG N Y Y N N Indoor pool
$45Blaine Court Y N N N S S Y Y N Y Y N Y N UG N N Y N N
$40Cloverleaf Courts Y S Y N S N Y Y N N Y Y Y Y UG N Y Y N N
$10 $45Chauncey Barrett I Y Y Y Y S Y N Y N N N Y Y N UG N N Y N N
$35Chauncey Barrett II Y Y Y Y S Y N Y N N N Y Y N UG N N Y N N
$35Pines Manor Estates Y Y N Y Y Y N Y N N Y Y N Y UG N N Y N N
$40Oak Hills Manor Y Y N N S N Y Y N Y N N Y N Garage N N N N N
$35Willow Ponds Y Y N Y S Y N Y N N N N N N Garage N N N N N
Incld.
Source: Maxfield Research Inc.
TABLE 7
MARKET RATE AND AFFORDABLE SENIOR HOUSING FACILITIESPRIMARY MARKET AREA
Unit Features Building Amenities Services
November 2010
AMENITY COMPARISON
Y=Included, N=Not Included, O=Optional, S=Some, UG=Underground Parking

SENIOR HOUSING MARKET ANALYSIS
Adult/Few Services Senior Housing We identified eight adult/few services senior housing facilities in the PMA with a combined total of 429 units. There are 276 market rate units and 153 affordable units. We have counted Chauncey Barrett Buildings I and II as separate projects due to their price differences. The fol-lowing are key points from Tables 6 and 7 regarding adult/few services senior housing in the PMA. The market rate units have a slightly lower vacancy rate than the affordable units. Three
market rate units were available for a vacancy rate of 1.1% and six affordable units were available for a vacancy rate of 3.9%. The low vacancy rates for both market rate and afford-able units indicate that excess demand for additional independent senior housing is present in the PMA.
All of the properties offer affordable units, but Cloverleaf Courts and Chauncey Barrett are
the only developments that do not have income restrictions on any of their units. The major-ity of the units at Blaine Town Square, Chauncey Barrett II, and Pines Manor Estates do not have income restrictions, but they have a few income-restricted units at each development. The average monthly rents for independent units without income restrictions are about $809 for one-bedroom units, $907 for one-bedroom plus den units, and $1,117 for two-bedroom units.
All units at Blaine Court, Oak Hills Manor, and Willow Ponds have income restrictions at
50% to 60% AMI. The average monthly rents for income-restricted independent units are about $658 for one-bedroom units and $768 for two-bedroom units.
All projects in the PMA are adult/few services developments and do not offer any services.
Common features and amenities among the projects include central/wall air conditioning, community room, library, and a terrace/porch. All projects offer underground or garage parking for $35 to $45 and are included at Willow Ponds.
MAXFIELD RESEARCH INC. 25

SENIOR HOUSING MARKET ANALYSIS
Blaine Town Square, Blaine
Blaine Court, Blaine
MAXFIELD RESEARCH INC. 26

SENIOR HOUSING MARKET ANALYSIS
Cloverleaf Courts, Blaine
Chauncey Barrett I, Centerville
MAXFIELD RESEARCH INC. 27

SENIOR HOUSING MARKET ANALYSIS
Chauncey Barrett II, Centerville
Pines Manor Estates, Circle Pines
MAXFIELD RESEARCH INC. 28

SENIOR HOUSING MARKET ANALYSIS
Oak Hills Manor, Circle Pines
Willow Ponds, Lino Lakes
MAXFIELD RESEARCH INC. 29

SENIOR HOUSING MARKET ANALYSIS
MAXFIELD RESEARCH INC. 30
Pending Senior Housing in the PMA Maxfield Research interviewed local officials in each community of the PMA to learn of any pending senior housing developments. We have identified three pending senior projects over the next several years. Approximately 345 units of senior housing are proposed, of which none are adult/few services housing. Lexington
There are currently no pending senior projects in the City of Lexington, other than the subject project.
Blaine
Suite Senior Living (formerly known as Comforts of Home) of White Bear Lake has pro-posed an expansion of their current campus located on the northeast corner of Cloud Drive NE and 125th Avenue NE in Blaine. The project has received all city approvals and was issued a building permit in August. The expansion would consist of a separate build-ing with 20 assisted living and 12 memory care units. Completion is anticipated in 2011.
Two large senior developments in Blaine have been approved for about two years. How-
ever, both developments have been unable to obtain financing; it is uncertain if either de-velopment will move forward. It is most likely that if one moves forward, the other would not. The following are descriptions of the two approved developments:
1) Crest View Senior Communities received City approval to develop a 174-unit
campus at Ulysses Street and Paul Parkway. The campus would include 100 con-gregate units, 54 assisted living units, and 20 memory care units. Crest View has been unable to secure financing and thus, the development has been stalled for about two years.
2) Welsh Companies received City approval to develop the Hipp Farm property on
125th Avenue west of Highway 65 with senior housing units. As proposed, the development would contain 45 congregate units, 46 assisted living units, 16 memory care units, and 32 skilled care beds. The development was to be called Afilius Senior Living and managed by Walker Elder Care. However, the devel-oper was unable to obtain financing and the project stalled in spring 2010. It is uncertain if the developer will continue to pursue this development.
CONCLUSIONS AND RECOMMENDATIONS
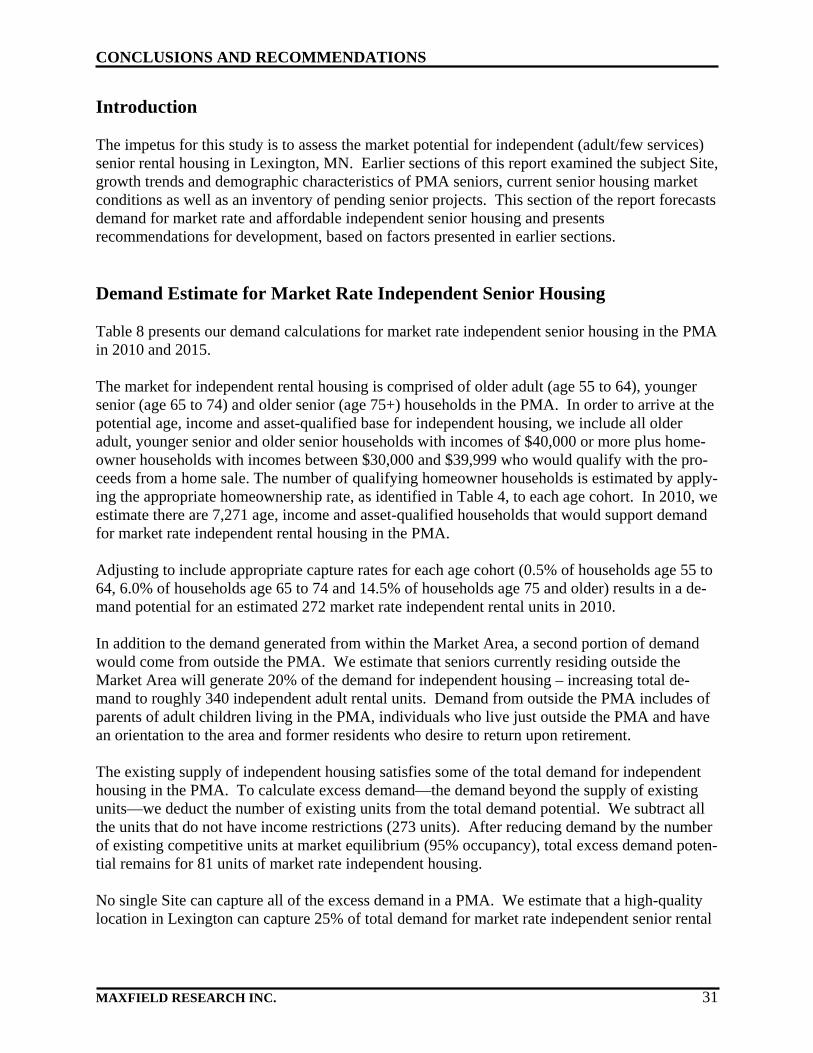
Introduction The impetus for this study is to assess the market potential for independent (adult/few services) senior rental housing in Lexington, MN. Earlier sections of this report examined the subject Site, growth trends and demographic characteristics of PMA seniors, current senior housing market conditions as well as an inventory of pending senior projects. This section of the report forecasts demand for market rate and affordable independent senior housing and presents recommendations for development, based on factors presented in earlier sections. Demand Estimate for Market Rate Independent Senior Housing Table 8 presents our demand calculations for market rate independent senior housing in the PMA in 2010 and 2015. The market for independent rental housing is comprised of older adult (age 55 to 64), younger senior (age 65 to 74) and older senior (age 75+) households in the PMA. In order to arrive at the potential age, income and asset-qualified base for independent housing, we include all older adult, younger senior and older senior households with incomes of $40,000 or more plus home-owner households with incomes between $30,000 and $39,999 who would qualify with the pro-ceeds from a home sale. The number of qualifying homeowner households is estimated by apply-ing the appropriate homeownership rate, as identified in Table 4, to each age cohort. In 2010, we estimate there are 7,271 age, income and asset-qualified households that would support demand for market rate independent rental housing in the PMA. Adjusting to include appropriate capture rates for each age cohort (0.5% of households age 55 to 64, 6.0% of households age 65 to 74 and 14.5% of households age 75 and older) results in a de-mand potential for an estimated 272 market rate independent rental units in 2010. In addition to the demand generated from within the Market Area, a second portion of demand would come from outside the PMA. We estimate that seniors currently residing outside the Market Area will generate 20% of the demand for independent housing – increasing total de-mand to roughly 340 independent adult rental units. Demand from outside the PMA includes of parents of adult children living in the PMA, individuals who live just outside the PMA and have an orientation to the area and former residents who desire to return upon retirement. The existing supply of independent housing satisfies some of the total demand for independent housing in the PMA. To calculate excess demand—the demand beyond the supply of existing units—we deduct the number of existing units from the total demand potential. We subtract all the units that do not have income restrictions (273 units). After reducing demand by the number of existing competitive units at market equilibrium (95% occupancy), total excess demand poten-tial remains for 81 units of market rate independent housing. No single Site can capture all of the excess demand in a PMA. We estimate that a high-quality location in Lexington can capture 25% of total demand for market rate independent senior rental
MAXFIELD RESEARCH INC. 31
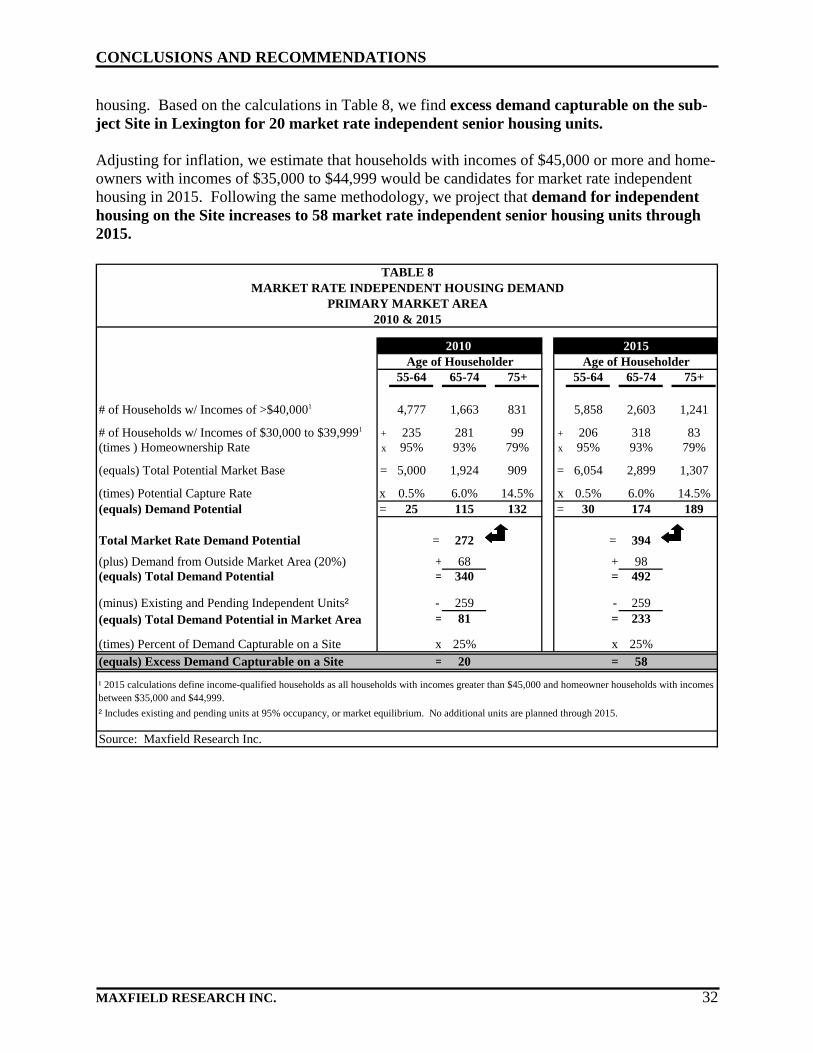
CONCLUSIONS AND RECOMMENDATIONS
housing. Based on the calculations in Table 8, we find excess demand capturable on the sub-ject Site in Lexington for 20 market rate independent senior housing units. Adjusting for inflation, we estimate that households with incomes of $45,000 or more and home-owners with incomes of $35,000 to $44,999 would be candidates for market rate independent housing in 2015. Following the same methodology, we project that demand for independent housing on the Site increases to 58 market rate independent senior housing units through 2015.
55-64 65-74 75+ 55-64 65-74 75+
# of Households w/ Incomes of >$40,0001 4,777 1,663 831 5,858 2,603 1,241
# of Households w/ Incomes of $30,000 to $39,9991 + 235 281 99 + 206 318 83(times ) Homeownership Rate x 95% 93% 79% x 95% 93% 79%
(equals) Total Potential Market Base = 5,000 1,924 909 = 6,054 2,899 1,307
(times) Potential Capture Rate x 0.5% 6.0% 14.5% x 0.5% 6.0% 14.5%(equals) Demand Potential = 25 115 132 = 30 174 189
Total Market Rate Demand Potential = 272 = 394
(plus) Demand from Outside Market Area (20%) + 68 + 98(equals) Total Demand Potential = 340 = 492
(minus) Existing and Pending Independent Units² - 259 - 259(equals) Total Demand Potential in Market Area = 81 = 233
(times) Percent of Demand Capturable on a Site x 25% x 25%
(equals) Excess Demand Capturable on a Site = 20 = 58
Source: Maxfield Research Inc.
2010
² Includes existing and pending units at 95% occupancy, or market equilibrium. No additional units are planned through 2015.
TABLE 8MARKET RATE INDEPENDENT HOUSING DEMAND
PRIMARY MARKET AREA2010 & 2015
¹ 2015 calculations define income-qualified households as all households with incomes greater than $45,000 and homeowner households with incomes between $35,000 and $44,999.
Age of Householder2015
Age of Householder
MAXFIELD RESEARCH INC. 32

CONCLUSIONS AND RECOMMENDATIONS
Demand for Affordable Independent Senior Housing Table 9 presents our demand calculations for affordable independent senior housing in the PMA in 2010 and 2015. While the methodology used to calculate demand for affordable housing closely mirrors the me-thodology used to calculate demand for market rate housing, we make several adjustments to more precisely quantify demand among this market segment. The following points summarize these adjustments: Income-Qualifications: The income-restriction for affordable housing products in Anoka
County (60% AMI) is currently $35,280 for a one-person household and $40,320 for a two-person household. We use $40,000 as the upper end of the income range. It is important to note that individual affordable developments may have unique income guidelines that are more precise than these income restrictions due to subsidy type or other factors. We exclude homeowner households earning incomes between $30,000 and $39,999, as these households would have additional equity that could be converted to monthly income following the sales of their single-family homes. To account for inflation, our figures in 2015 are adjusted to include households earning incomes less than $45,000; homeowner households with in-comes between $35,000 and $44,999 are excluded from the market potential for financially-assisted housing.
Capture Rates: Households in a need-based situation (either requiring services or financial
assistance) more readily move to housing alternatives than those in non-need based situa-tions. Hence, the capture rate among each age group is higher than for market rate housing. Capture rates are employed at 2.0% for households age 55 to 64, 10.0% for households age 65 to 74 and 20.0% for households age 75 and older.
Potential Demand Capture: Seniors in need-based situations are less selective when secur-
ing housing than those in non-need based situations. We estimate that a high-quality site would capture a greater proportion of total demand for financially-assisted housing than for market rate housing; hence, the potential capture rate increases to 40% for independent housing.
Based on the calculations in Table 9, we find excess demand capturable in Lexington for 37 financially-assisted independent senior housing units in 2010. Adjusting for inflation, we estimate that households with incomes less than $45,000 would be candidates for financially-assisted independent housing in 2015. We reduce the potential market by homeowner households earning between $35,000 and $44,999 that would exceed income-restrictions once equity from their home sales is converted to monthly income. Following the same methodology, we project that demand for independent housing in Lexington is calcu-lated for 40 financially-assisted independent senior housing units by 2015.
MAXFIELD RESEARCH INC. 33

CONCLUSIONS AND RECOMMENDATIONS
MAXFIELD RESEARCH INC. 34
55-64 65-74 75+ 55-64 65-74 75+
# of Households w/ Incomes of <$40,000 554 819 583 508 883 580
Less Households w/ Incomes of $30,000 to $39,999 - 235 281 99 - 206 318 83(times ) Homeownership Rate x 95% 93% 79% x 95% 93% 79%
(equals) Total Potential Market Base = 331 558 505 = 312 587 514
(times) Potential Capture Rate x 2.0% 10.0% 20.0% x 2.0% 10.0% 20.0%(equals) Demand Potential = 7 56 101 = 6 59 103
Total Market Rate Demand Potential = 163 = 168
(plus) Demand from Outside Market Area (30%) + 70 + 72(equals) Total Demand Potential = 233 = 240
(minus) Existing and Pending Independent Units² - 140 - 140(equals) Total Demand Potential in Market Area = 94 = 100
(times) Percent of Demand Capturable on a Site x 40% x 40%
(equals) Excess Demand Capturable on a Site = 37 = 40
Source: Maxfield Research Inc.
TABLE 9SUBSIDIZED/AFFORDABLE INDEPENDENT HOUSING DEMAND
PRIMARY MARKET AREA2010 & 2015
² Includes existing and pending units at 95% occupancy, or market equilibrium. No additional units are planned through 2015.
¹ 2015 calculations define income-qualified households as all households with incomes less than $45,000. Homeowner households with incomes between $35,000 and $44,999 are excluded from the market potential for financially-assisted housing.
2010Age of Householder
2015Age of Householder
CONCLUSIONS AND RECOMMENDATIONS
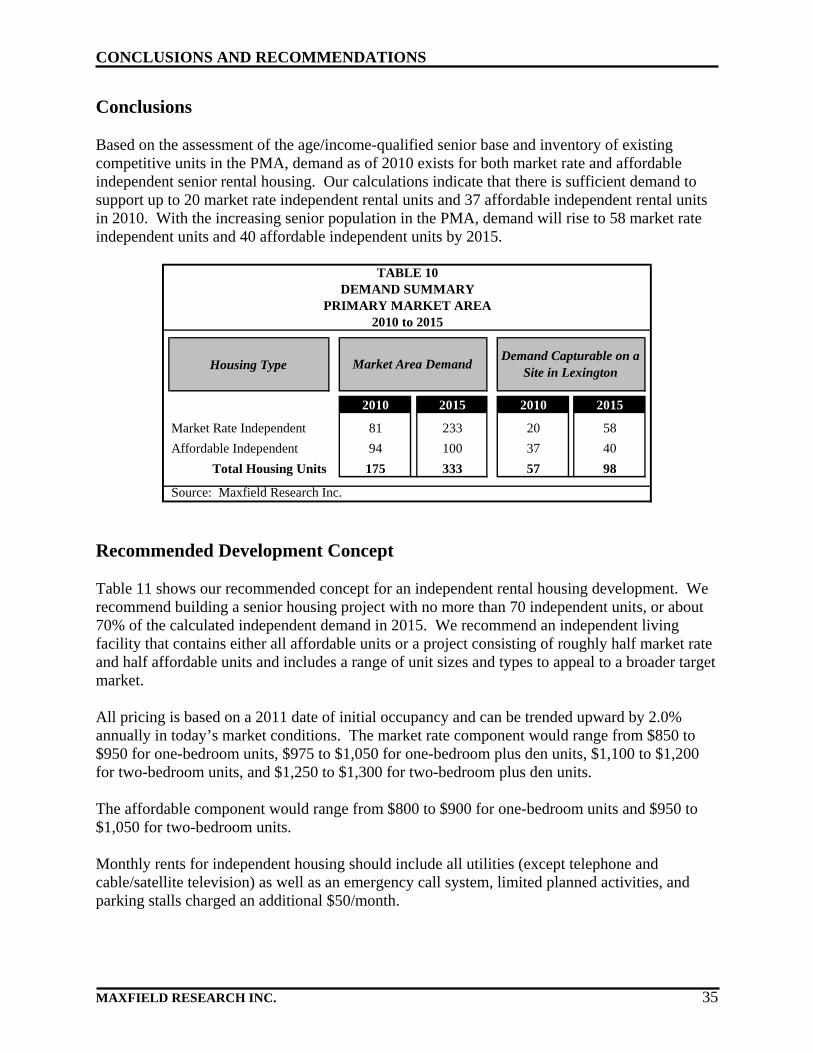
Conclusions Based on the assessment of the age/income-qualified senior base and inventory of existing competitive units in the PMA, demand as of 2010 exists for both market rate and affordable independent senior rental housing. Our calculations indicate that there is sufficient demand to support up to 20 market rate independent rental units and 37 affordable independent rental units in 2010. With the increasing senior population in the PMA, demand will rise to 58 market rate independent units and 40 affordable independent units by 2015.
Housing Type
2010 2015 2010 2015
Market Rate Independent 81 233 20 58
Affordable Independent 94 100 37 40
Total Housing Units 175 333 57 98
Source: Maxfield Research Inc.
Demand Capturable on a Site in Lexington
TABLE 10DEMAND SUMMARY
PRIMARY MARKET AREA2010 to 2015
Market Area Demand
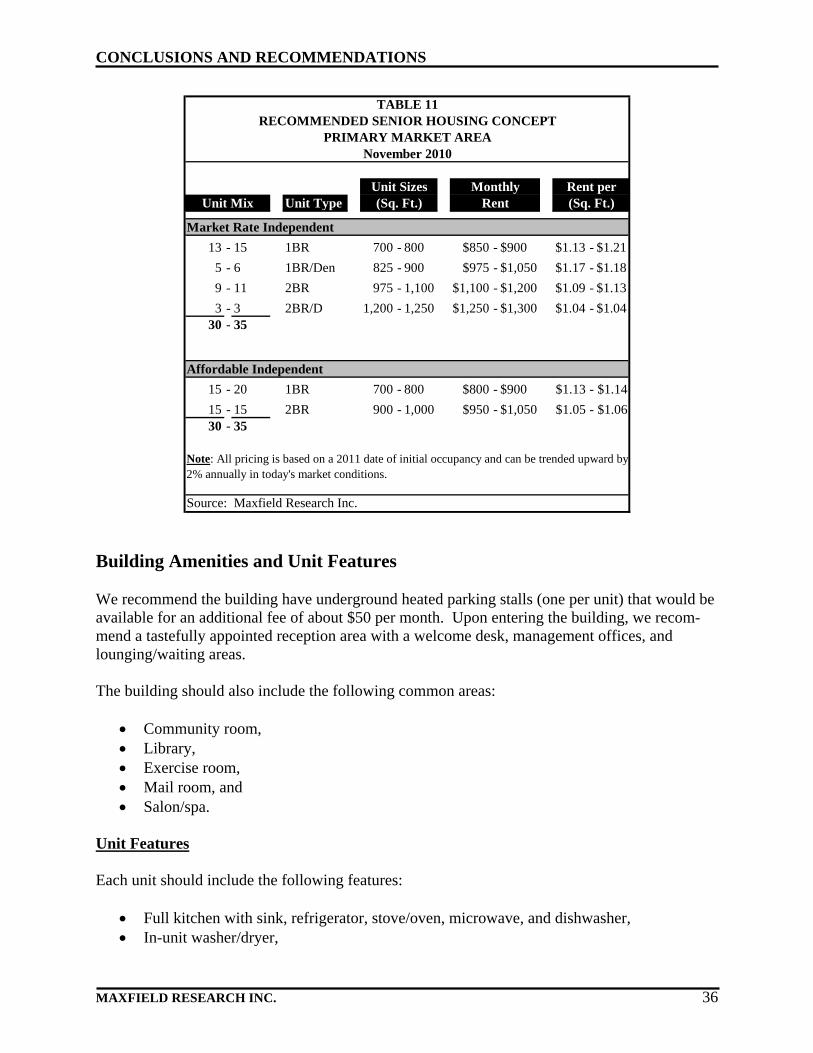
Recommended Development Concept Table 11 shows our recommended concept for an independent rental housing development. We recommend building a senior housing project with no more than 70 independent units, or about 70% of the calculated independent demand in 2015. We recommend an independent living facility that contains either all affordable units or a project consisting of roughly half market rate and half affordable units and includes a range of unit sizes and types to appeal to a broader target market. All pricing is based on a 2011 date of initial occupancy and can be trended upward by 2.0% annually in today’s market conditions. The market rate component would range from $850 to $950 for one-bedroom units, $975 to $1,050 for one-bedroom plus den units, $1,100 to $1,200 for two-bedroom units, and $1,250 to $1,300 for two-bedroom plus den units. The affordable component would range from $800 to $900 for one-bedroom units and $950 to $1,050 for two-bedroom units. Monthly rents for independent housing should include all utilities (except telephone and cable/satellite television) as well as an emergency call system, limited planned activities, and parking stalls charged an additional $50/month.
MAXFIELD RESEARCH INC. 35
CONCLUSIONS AND RECOMMENDATIONS
Unit Type
Market Rate Independent
13 - 15 1BR 700 - 800 $850 - $900 $1.13 - $1.21
5 - 6 1BR/Den 825 - 900 $975 - $1,050 $1.17 - $1.18
9 - 11 2BR 975 - 1,100 $1,100 - $1,200 $1.09 - $1.13
3 - 3 2BR/D 1,200 - 1,250 $1,250 - $1,300 $1.04 - $1.0430 - 35
Affordable Independent
15 - 20 1BR 700 - 800 $800 - $900 $1.13 - $1.14
15 - 15 2BR 900 - 1,000 $950 - $1,050 $1.05 - $1.0630 - 35
Source: Maxfield Research Inc.
Note: All pricing is based on a 2011 date of initial occupancy and can be trended upward by2% annually in today's market conditions.
(Sq. Ft.)Monthly
Rent (Sq. Ft.)Unit Mix
TABLE 11
Rent per
PRIMARY MARKET AREARECOMMENDED SENIOR HOUSING CONCEPT
November 2010
Unit Sizes
Building Amenities and Unit Features We recommend the building have underground heated parking stalls (one per unit) that would be available for an additional fee of about $50 per month. Upon entering the building, we recom-mend a tastefully appointed reception area with a welcome desk, management offices, and lounging/waiting areas. The building should also include the following common areas:
Community room, Library, Exercise room, Mail room, and Salon/spa.
Unit Features Each unit should include the following features:
Full kitchen with sink, refrigerator, stove/oven, microwave, and dishwasher, In-unit washer/dryer,
MAXFIELD RESEARCH INC. 36

CONCLUSIONS AND RECOMMENDATIONS
Full bathroom with walk-in shower, Spacious bedrooms and living areas, Ample storage space, Balcony (some units), Bay windows (some units), Walk-in closet (some units), Handicap and other accessibility features, and Individually-controlled heating and air conditioning.
Project Absorption Based on our review of the current and projected housing needs of senior households in the PMA and our assessment of the existing competitive market, we estimate the absorption of the recom-mended units at the proposed project based on a 2011 opening with a pre-leasing period. The new development would be the newest property built in the PMA since 2005 and it would enjoy an attractive site and good location. Our projected absorption accounts for the slowed resale housing market. Marketing staff at ex-isting buildings have noticed that seniors are having greater difficulty selling their homes and this is impacting some seniors’ ability to move into alternative housing options. If the housing market improves over the next year then absorption may be more rapid than our projections. For the market rate independent units (30 to 35 units), we forecast that stabilized occu-pancy (95%) would be reached in 12 to 20 months of initial occupancy. This assumes that 15% of the units would be preleased and that the remaining 25 to 30 units would be leased at an average rate of 1.5 to 2.0 units per month. We forecast that the recommended affordable independent units (30 to 35 units) would reach stabilized occupancy (95%) in 7 to 10 months of initial occupancy. This assumes that 30% of the units would be preleased and that the remaining 21 to 25 units would be leased at an average rate of 2.5 to 3.0 units per month. We assume that no other new competitive product is marketing simultaneously with the subject property and that the building opens in spring or early summer. Additional competition and/or a winter opening could extend the absorption period somewhat. Absorption estimates assumes an aggressive marketing campaign, including architectural renderings and marketing signs located at the site.
MAXFIELD RESEARCH INC. 37

CONCLUSIONS AND RECOMMENDATIONS
MAXFIELD RESEARCH INC. 38
Marketing Considerations We project the subject development will be well-received in the marketplace. The following points are specific market considerations for the subject development:
The quality of construction, the buildings’ appearance and the landscaping will be impor-tant and should also reflect this market’s tastes. Special attention should also be paid to decor, color schemes, carpeting, furnishings, fixtures and the quality of finishing.
Develop a website early in the construction process. Although seniors looking for hous-
ing alternatives may not fully utilize online resources, the internet would be a critical tool to educate adult caregivers, who often provide primary support in the selection of housing products for their senior parents, and community members (i.e. hospital discharge plan-ners, senior advocacy professionals, etc.) who provide frequent referrals.
Begin the marketing effort at least a year prior to opening, escalating to full-scale six
months before grand opening. Seniors who need extra income through the sale of their home might need six months or more to prepare their home for sale and to find a buyer, especially if the home is older, smaller or in need of repair. With residents who have paid a deposit to reserve a unit, keep them updated on the progress of construction.
Develop attractive brochures detailing information on support services, building design,
features, amenities, and monthly fees. These items should be made available at the time marketing begins, preferably at groundbreaking. We recommend the creation of at least one marketing brochure that speaks directly to adult children who will guide the deci-sions of their senior parents; this brochure would recognize their perspective, addressing their concerns and presenting the benefits to them. The competitive advantages stated earlier in this section should be emphasized in the marketing materials.
Open houses and tours should be implemented to give area seniors and caregivers a
chance to become acquainted with the development. Utilize referral networks in the PMA (i.e. hospitals, clinics, social workers, home health agencies, senior centers, churches and even other nursing homes) to inform seniors of the project before construction begins. Networking may also bring about valuable input, which could further refine the concept and the delivery of support services.