Embed Size (px)
Citation preview
A Marine Waste Biorefinery
A thesis submitted for the degree of Doctor of Philosophy
(PhD) at Newcastle University
by
Ahmed Said Hamed Al Hatrooshi
November 2019


i
Abstract
Biodiesel is a renewable alternative to ‘petro-diesel’. There is already an established, conventional
production technology based on refined vegetable oils. However, this is always more expensive
than producing petroleum-based diesel, mainly due to the feedstock cost. Use of a cheap, non-
edible feedstock, such as waste shark liver oil (WSLO), would reduce the biodiesel production
cost and make the process economically viable.
WSLO is obtained by exposing sharks’ livers to the sun until they melt and collecting the oil
produced. Sharks’ livers comprise 25-30% of their body weight. Historically, the discarded
WSLO was used for waterproofing wooden boats. However, this application is no longer required,
as modern boats are made of fibreglass. The excess WSLO derived from these discarded sharks’
livers has great potential for being further processed into valuable products, including biodiesel,
squalene and omega-3 polyunsaturated fatty acids (PUFA), such as eicosapentaenoic (EPA) and
docosahexaenoic (DHA). The glyceride components of the WSLO can be converted into biodiesel
using existing biodiesel processing technologies, while the squalene, EPA and DHA may be
extracted and sold as value-added products through biorefinery processes.
This study investigated the production of fatty acid methyl ester (FAME) from WSLO using both
acid (sulfuric acid, H2SO4) and base (sodium hydroxide, NaOH) catalysts. Due to the high levels
of free fatty acids (FFA) in WSLO, homogeneous alkali-catalysed transesterification was less
effective than the acid-catalysed process, resulting in a maximum WSLO to FAME conversion of
only 40% after 15 min at a 60°C temperature, a 1.5 wt.% of NaOH catalyst and a 6:1 molar ratio
of methanol to WSLO. The acid-catalysed transesterification of the WSLO was investigated, using
Design of Experiments (DoE), by a response surface method. The acid-catalysed process achieved
99% FAME conversion during a 6.5 h reaction time at a 60°C temperature, a 5.9 wt. % of H2SO4
catalyst and a 10:3 molar ratio of methanol to WSLO.

ii
Saponification of WSLO for extracting squalene was also investigated using a DoE methodology
to obtain the operating conditions for highest squalene extraction. The results showed 101.6 ± 1.3 %
squalene recovery at the following operating conditions: a 5 min reaction time, a 9.9 wt. % of
water loading and a 20:1 molar ratio of ethanol to oil. Aqueous silver nitrate (AgNO3) was
employed for extracting EPA and DHA from fatty acid ethyl esters produced from the WSLO.
The highest EPA and DHA recoveries achieved were 66.2% EPA and 83.4% DHA. These came
from extractions using a 2 h reaction time, a mixing speed of 300 rpm, a 20°C reaction temperature,
and a 50 wt. % of silver nitrate concentration.
Techno-economic analysis was performed to assess the commercial feasibilities of acid-catalysed
biodiesel production using WSLO and alkali-catalysed biodiesel production using refined
vegetable oil (rapeseed oil). Aspen HYSYS-V9 was used to simulate both production types at
plant capacity of 12,000 te/y and lifespan of 20 years. Net present values (NPVs) of US $34.8 and
US $4.9 million were obtained for the acid-catalysed WSLO process and the alkali-catalysed
vegetable oil process, respectively. The internal rate of return (IRR) was calculated to be 260%
for the acid-catalysed process and 56% for the alkali-catalysed process. Therefore, the acid-
catalysed process is more profitable than the alkali-catalysed process due to its higher IRR
percentage. Sensitivity analysis was also conducted to show the effect of certain variables on the
NPV of both biodiesel production types. It was concluded that the biodiesel selling price has more
effect on the NPV than the glycerol variation price, whereas the triglyceride feedstock purchase
prices have the largest influence on the NPV of the two processes.

iii
Dedication
This Ph.D. thesis is dedicated to Mariam, Said and Mohammed and my parents for their love,
encouragement, support and prayers.

iv
Acknowledgment
All grace is due to Allah (God) for giving me this opportunity to embark on my PhD program. My
sincere gratitude and acknowledgement to my supervision team Prof. Adam Harvey and Dr.
Valentine Eze for their guidance and valuable contributions. Also, I would like to express my
gratitude to my parents, wife and family for their patient, support and prayers. My sincere thanks
to all members of the Process Intensification Group (PIG), administrative staff and office
colleagues for their usual support and co-operation. I also express my appreciations to Diwan
Royal Court of Oman Government for funding this research.

v
Table of Contents
Biodiesel ............................................................................................................................. 18
Waste Shark Liver Oil as a Feedstock for Biodiesel .......................................................... 18
Recovery of Squalene and Omega-3 PUFAs from Waste Shark Liver Oil ....................... 20
Omega-3 PUFAs Recovery ......................................................................................... 20
Squalene Recovery and Novelty ................................................................................. 21
A General Overview of a Proposed WSLO-based Biorefinery .......................................... 22
Research Aim and Objectives: ........................................................................................... 24
Thesis Layout ..................................................................................................................... 25
Biofuel Feedstock and Global Biofuel Production ............................................................. 27
Biodiesel Production Technologies .................................................................................... 29
Factors that Affect Biodiesel Production Reactions ........................................................... 30
Type of Catalyst .......................................................................................................... 30
Alkali Catalyst ............................................................................................................. 31
Aid Catalyst ................................................................................................................. 33
Enzyme Catalyst .......................................................................................................... 33
Alcohol Quantity ......................................................................................................... 34
Reaction Temperature and Catalyst Concentration ..................................................... 34
Moisture Content and Free Fatty Acid Content .......................................................... 35
Types of Reactors for Biodiesel Production ....................................................................... 36
Static mixers reactor .................................................................................................... 37
Micro-reactors ............................................................................................................. 38

vi
Oscillatory flow reactors ............................................................................................. 39
Spinning reactors ......................................................................................................... 41
Acoustic reactors ......................................................................................................... 42
Bio-refining of Waste Shark Liver Oil............................................................................... 43
Biodiesel Production from Waste Shark Liver Oil ..................................................... 43
Extraction Process of Omega-3 Polyunsaturated Fatty Acids (PUFAs) ..................... 44
Squalene Extraction Process ....................................................................................... 55
Summary ............................................................................................................................ 59
Introduction ........................................................................................................................ 62
Materials ............................................................................................................................. 62
Experimental Methods ....................................................................................................... 63
Determinations of the Density of the Waste Shark Liver Oil ..................................... 63
Water Content by Karl Fischer Titration .................................................................... 63
Determination of Lipid Classes, Squalene and Free Fatty Acids ............................... 64
Alkali-Catalysed Transesterification ........................................................................... 65
Acid-Catalysed Transesterification ............................................................................. 66
Squalene Extraction by Saponification ....................................................................... 66
EPA and DHA Extraction Using Aqueous Silver Nitrate ........................................... 68
Analysis of FAME, EPA, DHA and Squalene Contents Using Gas Chromatography71
Fourier Transform Infrared Spectroscopy ................................................................... 74
Nuclear Magnetic Resonance .................................................................................... 79
Error Analysis ........................................................................................................... 82
Waste Shark Liver Oil Characterisation ............................................................................ 84
NMR Analysis for FAME Produced from Acid Catalysed Transesterification ................ 87
Monitoring Waste Shark liver Oil Transesterification Using FTIR................................... 89
Waste Shark Liver Oil Transesterification and FAME Conversions with the Catalysts ... 90

vii
Parametric Study and Optimisation of Acid-catalysis of WSLO Transesterification ........ 92
Squalene Recovery from Waste Shark Liver Oil ............................................................... 94
Effect of the Extraction Parameters on Squalene Recovery ........................................ 97
Optimal Conditions for Squalene Recovery ................................................................ 99
EPA and DHA Extraction ................................................................................................ 100
Effect of Process Parameters on EPA and DHA Extraction ..................................... 101
Process Description .......................................................................................................... 105
Acid-Catalysed Transesterification of WSLO to Biodiesel ...................................... 109
Alkali-Catalysed Transesterification of Refined Vegetable Oil ................................ 110
Economic Analysis ........................................................................................................... 111
Sensitivity Analysis .......................................................................................................... 117
Summary ........................................................................................................................... 119
Conclusions ...................................................................................................................... 120
Further Work .................................................................................................................... 122
Appendix A: WSLO Fatty Acid Profile ...................................................................................... I
Appendix B: Analysis of Waste Shark Liver Oil by Iatroscan MK-6 ....................................... II
Appendix C: GC Chromatogram showing squalene in the WSLO FAME Sample ................. III
Appendix C 1: Squalene peak after 5 min reaction time of WSLO saponification ................. IV
Appendix C 2: Squalene peak after 30 min reaction time of WSLO saponification ................ V
Appendix C 3 :Squalene peak after 60 min reaction time of WSLO saponification ............... VI
Appendix C 4 : Squalene peak after washing ......................................................................... VII
Appendix D: European Biodiesel Specification EN 14214 .................................................. VIII
Appendix E: ASTM Biodiesel Standard D 6751 ..................................................................... IX

viii
List of Figures
Figure 1.1: Worldwide energy consumption (Urban, 2015) ........................................................ 16
Figure 1.2: Projection regarding biofuel consumption in the transport sector in Million Tonnes of
Oil Equivalent (Mtoe)(IEA, 2017) ............................................................................................... 17
Figure 1.3: Structure of EPA (a) and DHA (b) (Holub and Holub, 2004) ................................... 20
Figure 1.4: Squalene (Fox, 2009) ................................................................................................. 21
Figure 1.5: Flow diagram of WSLO Biorefinery ......................................................................... 23
Figure 2.1: Biofuels production by region (PikeResearch, 2012) ................................................ 27
Figure 2.2: Bioethanol yield of different feedstocks (Halder et al., 2019) .................................. 28
Figure 2.3: Alkali-catalysed biodiesel production (Leung et al., 2010)....................................... 32
Figure 2.4: CSTR diagrammatic sketch (Zhao et al., 2015) ........................................................ 36
Figure 2.5: Batch reactor (Dimian et al., 2014) ........................................................................... 37
Figure 2.6: Experimental setup: (a) static mixer closed-loop system ,and (b)internal structure of
static mixer (Qiu et al., 2010)....................................................................................................... 38
Figure 2.7: The configuration of oscillatory flow reactor (Harvey and Lee, 2012) ..................... 40
Figure 2.8: Schematic of oscillatory flow reactor for biodiesel production (Harvey and Lee, 2012)
...................................................................................................................................................... 41
Figure 2.9: A schematic view of a spinning disk reactor (Pask et al., 2012). .............................. 41
Figure 2.10: Ether lipids (Fernández et al., 2013)........................................................................ 43
Figure 2.11: Structure of EPA (a) and DHA (b) (Holub and Holub, 2004) ................................ 44
Figure 2.12: General overview of common omega-3 extraction methods (Lembke, 2013a) ...... 46
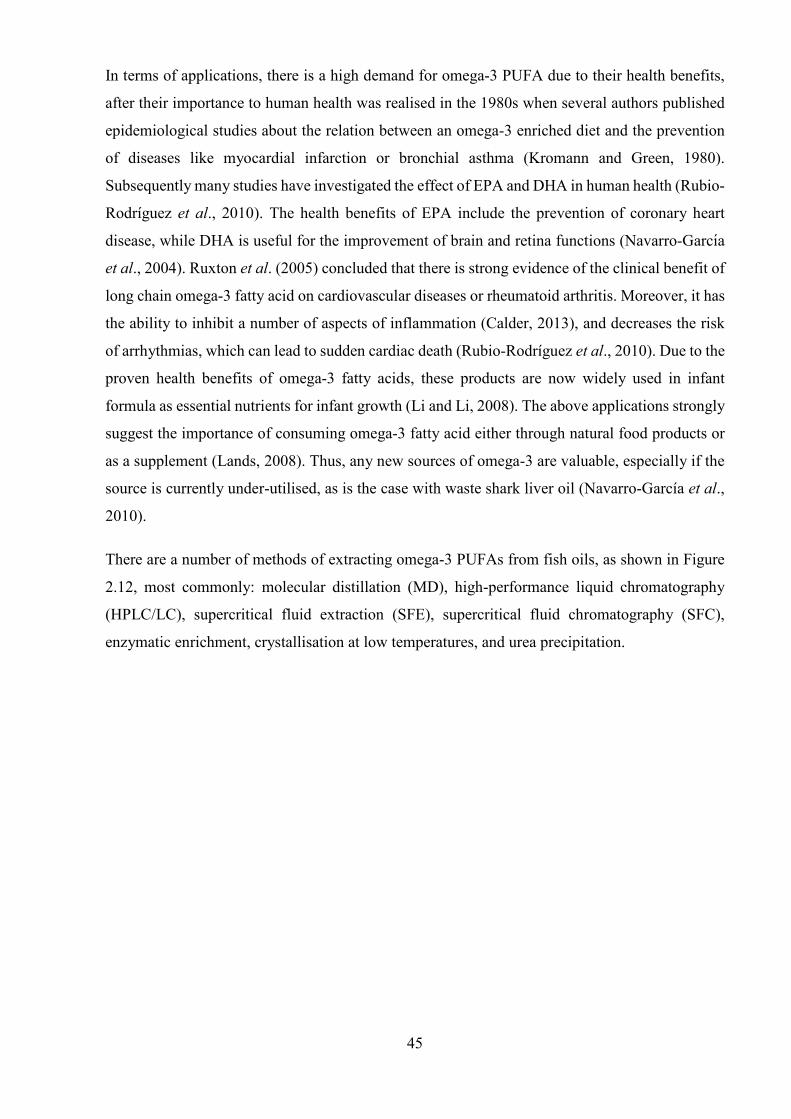
Figure 2.13: Formation of urea crystals in the absence and presence of long chain fatty acids
(Shahidi and Wanasundara, 1998) ............................................................................................... 47
Figure 2.14: Enrichment of total ω3-fatty acids of seal blubber oil upon low temperature
crystallization. A, triacylglycerol form; B, free fatty acid form (Wanasundara, 2001). .............. 48
Figure 2.15: Molecular distillation for production of omega 3 ester (Flavourtech, 2009; Atadashi
et al., 2013) ................................................................................................................................... 50
Figure 2.16: Pressure-temperature phase diagram for CO2 (Grandison and Lewis, 1996; King,
2003) ............................................................................................................................................ 51
Figure 2.17: Flow scheme of the SFF process (Fiori et al., 2014)Streams: F=FAEE feed, M=CO2
make up, S=CO2 to column, E=extract, E1=extract CO2 free, L0=reflux, R= raffinate,
R1=raffinate CO2 free. Equipment: COL=fractionation column, SP=separator, HE=heat
exchanger, CV=control valve ...................................................................................................... 52
Figure 2.18: Squalene chemical structure (Popa et al., 2015a) .................................................... 55

ix
Figure 2.19: Short path distillation (Flavourtech, 2009) .............................................................. 56
Figure 2.20: Supercritical carbon dioxide extraction (FluidsScience, 2015) ............................... 58
Figure 3.1: C30 Karl Fischer Titrator (Mettler Toledo, UK) ....................................................... 63
Figure 3.2: Iatroscan MK-6 (Scientifique, 2014) ......................................................................... 64
Figure 3.3: Experimental set up .................................................................................................... 65
Figure 3.4: WSLO saponification ................................................................................................. 68
Figure 3.5: General overview of EPA and DHA extraction (Shanmugam and Donaldson, 2015)
...................................................................................................................................................... 69
Figure 3.6: process for recovery of EPA and DHA from aqueous and emulsion phases ............. 70
Figure 3.7: Experimental steps for the EPA and DHA extractions. Arrow in Figure 3.7 (a) refers
to the residual oil layer, arrow in Figure 3.7 (b) refers to the de-emulsification layer and the arrow
in Figure 3.7(c) refers to the de-complexation layer. ................................................................... 70
Figure 3.8: Gas chromatography (Chaintreau, 2007) ................................................................... 71
Figure 3.9: Squalene calibration curve ......................................................................................... 73
Figure 3.10: The relationship of the vibrational infrared region to others types of energy transition
(Pavia et al., 2008). ....................................................................................................................... 75
Figure 3.11: Different types of bond with the infrared absorption range (Pavia et al., 2008). .... 76
Figure 3.12: Stretching and bending modes (Pavia et al., 2008). ................................................ 76
Figure 3.13: Stretching and bending vibration of methyl group (Pavia et al., 2008). .................. 77
Figure 3.14: A schematic diagram of an FTIR (Pavia et al., 2008). ............................................ 78
Figure 3.15: Diamagnetic shielding or diamagnetic anisotropy (Pavia et al., 2008) ................... 79
Figure 3.16: A typical chemical shift scale on NMR spectrum chart (Pavia et al., 2008) ........... 80
Figure 4.1: NMR spectra of the FAME from WSLO ................................................................... 87
Figure 4.2: Proton NMR Chart ..................................................................................................... 88
Figure 4.3: NMR spectra for pure squalene ................................................................................. 88
Figure 4.4: FTIR 4 hrs transesterification reaction using acid catalyst ........................................ 89
Figure 4.5: 3-D FTIR transesterification reaction using acid catalyst .......................................... 89
Figure 4.6: Effect of mixing intensity on WSLO transesterification at 60°C, with a 6h reaction
time, a 30:1 methanol to oil molar ratio and using a 3wt.% of the H2SO4 catalyst. ..................... 90
Figure 4.7: FAME conversions for transesterification of WSLO at 720rpm mixing speed using,
(a) 1.5 wt.% NaOH at 6:1 methanol to oil molar ratio, 60⁰C temperature and 60min reaction time,
(b) 1.5 wt.% H2SO4 at 30:1 methanol to oil molar ratio, 60⁰C temperature and 6h reaction time.
...................................................................................................................................................... 91
Figure 4.8: effect of the reaction parameters (reaction time (h), methanol molar ratio and catalyst
concentration (wt.%)) on conversions of WSLO to FAME. ........................................................ 93

x
Figure 4.9: Effects plot for squalene recovery ............................................................................. 96
Figure 4.10: Effect of process parameters on squalene recovery; (a) ethanol molar ratio and
reaction time; (b) reaction time and water loading; (c) water loading and ethanol molar ratio ... 97
Figure 4.11: Soap in form of (a) emulsion and (b) particulate/granular ...................................... 98
Figure 4.12: Overview of aqueous silver nitrate extraction of EPA and DHA from WSLO .... 101
Figure 4.13: Effects of process parameters on EPA and DHA recovery %; (a) at different reaction
times and 30 wt.% AgNO3 concentration; (b) at different AgNO3 concentrations and 2 h reaction
time. ............................................................................................................................................ 102
Figure 5.1: Process flow sheet for acid-catalysed transesterification of WSLO for the production
of biodiesel ................................................................................................................................. 106
Figure 5.2: Process flow sheet for conventional biodiesel production (alkali-catalysed process)
from refined vegetable oil .......................................................................................................... 108
Figure 5.3 Process flow sheet of biodiesel production plant from palm oil with supercritical
methanol at low molar ratio (Sakdasri et al., 2018). .................................................................. 115
Figure 5.4: The change in the NPV as functions of the purchase prices of (a) WSLO and methanol
(b) rapeseed oil and methanol .................................................................................................... 117
Figure 5.5: The change in the NPV as functions of the biodiesel and glycerol selling prices for (a)
the acid-catalysed plant using WSLO, and (b) the alkali-catalysed plant using vegetable oil
(rapeseed oil) .............................................................................................................................. 118

xi
List of Tables
Table 2.1: Several processes for the silver ion-based extraction of omega-3 PUFAs ................. 54
Table 2.2: Chemical and physical properties of squalene (Popa et al., 2015a) ............................ 55
Table 2.3: Experimental result for the squalene content and yields (Pietsch and Jaeger, 2007a) 57
Table 2.4: A comparison of various EPA and DHA extraction techniques(Lembke, 2013b) ..... 61
Table 3.1: Atomic number and nuclei spin (Pavia et al., 2008) ................................................... 80
Table 3.2: Nuclei spin quantum and magnetic properties of selected nuclei (Pavia et al., 2008) 81
Table 3.3: Laboratory equipment used and their errors ............................................................... 82
Table 4.1: Lipid classes as measured by Iatroscan MK-6 ............................................................ 84
Table 4.2: Fatty acids profile of the WSLO ................................................................................. 85
Table 4.3: Average molecular weights of WSLO ........................................................................ 86
Table 4.4:Experimental and predicted conversion of WSLO to FAME at different conditions .. 92
Table 4.5: Squalene recovery at different parameter spaces ........................................................ 95
Table 5.1: A summary of the raw materials used to produce biodiesel, and utilities including
heating energy and cooling water ............................................................................................... 111
Table 5.2: Material balance and process conditions ................................................................... 112
Table 5.3: Economic analysis for the biodiesel production capacity of 12000 te/y ................... 114
Table 5.4:The economic analsyis results for biodesel production from palm oil using SCM
processe with different plant capacites in US$ millions (Sakdasri et al., 2018). ....................... 116
xii
Nomenclature and Abbreviations List of Abbreviations
AKG Alkylglycerols
ALA Alpha-Linolenic Acid
ASTM American Society for Testing and Materials
CCC Counter-current Chromatography
CFPP Cold Filter Plugging Point
DAGE Diacylglycerol Ether
DHA Docosahexaenoic
DI Deionised
DG Di-glyceride
DoE Design of Experiment
EPA Eicosapentaenoic
FAEE Fatty Acid Ethyl Ester
FAME Fatty Acid Methyl Ester
FFA Free Fatty Acid
FID Flame Ionization Detector
FTIR Fourier-transform infrared spectroscopy
GC Gas Chromatography
GHG Greenhouse Gases
GL Glycerol
HPLC High Performance Liquid Chromatography

xiii
IEA International Energy Agency
IRR Internal Rate of Return
LC Liquid Chromatography
MAGE Monoacylglycerol Ethers
MD Molecular Distillation
MG Mono-glyceride
MHz Megahertz
MPa Megapascal
MSHA Mine Safety and Health Administration
Mtoe Million Tonnes of Oil Equivalent
NMR Nuclear magnetic resonance
NPV Net Present Value
NRTL Non-random Two Liquid
OBR Oscillatory Baffle Reactor
OFR Oscillatory Flow Reactor
OSHA Occupational Safety and Health Administration
PEL Permissible Exposure Limit
PPM Parts per million
PUFA Polyunsaturated Fatty Acids
RF Radio frequency
RPM Revolutions per minute
SBO Seal Blubber Oil

xiv
SCCO2 Supercritical Carbon Dioxide
SCM Supercritical methanol
SD Standard deviation
SFC Supercritical Fluid Chromatography
SFF Supercritical Fluid fractionation
TCI Total Capital Investment
TEA Techno-economic Analysis
te/y Tonne/Year
TG/TAG Triglycerides
TLC Thin Layer Chromatography
TMS Tetramethylsilane
WSLO Waste Shark Liver Oil
List of Nomenclature
ρ Density (g/ml)
Ai Peak area of methylheptadecanoate (mV.s)
Ci Concentration of the methylheptadecanoate solution (mL)
I Nuclei spin (-)
m Mass of sample (mg)

15
P Pressure (Pa)
Pc Critical Pressure (Pa)
T Temperature (K)
Tc Critical Temperature (K)
Vi Volume of the methylheptadecanoate solution (mL)
(xi –𝑥𝑥) Deviation from the mean (-)
(N−1) Total number of measurements minus one (-)

16
Introduction
Globally, the main source of energy is fossil fuels. However, fossil fuel combustion leads to
harmful environmental emissions and contributes to global warming, and these are a significant
factor in climate change. Exploring renewable sources to replace fossil fuels is therefore an
important task for scientists (Mathimani et al., 2015). Figure 1.1 shows worldwide energy
consumption in 2013, in which petroleum was the largest source of energy.
Figure 1.1: Worldwide energy consumption (Urban, 2015)
Energy is vital for the development of the world economy, and a major part of this energy is used
for transportation. World transport fuel demand is expected to increase by approximately 30% in
2030, according to the World Energy Outlook (IEA, 2017). Figure 1.1 shows that almost 80% of
the global energy consumed is fossil fuel-based, and 58% of this fossil fuel is used in the transport
sector (Escobar et al., 2009). Thus, for substantial changes in the composition of world transport
energy consumption to be effected, the development of sustainable technology with low CO2
emissions is required (Cuenot et al., 2012).

17
To guard against the rise in fossil fuel-based transport energy consumption, numerous
organisations and governments have promoted energy diversity and greenhouse gas (GHG)
emission reduction through the use of biofuels. Figure 1.2 shows a projection of biofuel
consumption in the transport sector (IEA, 2017). Clearly, the current production of transport
biofuels needs to triple to achieve the 2030 Sustainable Development Scenario (SDS) target. This
target can be driven by cost reductions of advanced biofuels, widespread sustainability governance
and more adoption in aviation and marine transport (IEA, 2017). One of the main liquid biofuels
used in the transportation sector is biodiesel.
Figure 1.2: Projection regarding biofuel consumption in the transport sector in Million Tonnes of Oil Equivalent (Mtoe)(IEA, 2017)

18
Biodiesel Biodiesel, derived from vegetable oils or animal fats, is a renewable replacement for petro-diesel
in compression ignition engines. Its quality is dictated by ASTM D6751 (Burton and Biofuels,
2008) in the USA and Canada, and EN 14214 in the European Union. The main component is
fatty acid methyl esters (FAMEs) of long-chain fatty acids (Bryan, 2008). As a clean-burning
alternative to diesel fuel, biodiesel has various environmental benefits, including biodegradability,
very low toxicity, and a reduction in CO2 emissions (Rasal et al., 2019). Due to the environmental
benefits of biodiesel combustion, various government policies have mandated the blending of
biodiesel with petro-diesel, resulting in a growth in biodiesel production and consumption (Bin-
Mahfouz et al., 2018). This growth represents 15 times the production volume of biodiesel in the
period from 2002 to 2012 (De Oliveira and Coelho, 2017). Biodiesel is commonly produced via
triglyceride (usually vegetable oil) transesterification and/or free fatty acid (FFA) esterification
reactions in the presence of alcohols (Kole et al., 2012).
The main determining factor of the price of biodiesel is the cost of feedstock, which comprises
70–95% of total biodiesel production costs (Banković-Ilić et al., 2012). Hence, the use of a cheap
non-edible feedstock, such as waste shark liver oil (WSLO), would reduce biodiesel production
costs and make the process more economically viable.
Waste Shark Liver Oil as a Feedstock for Biodiesel Sharks have been consumed as a food in coastal regions for over 5,000 years (Vannuccini, 1999).
In fact, they provide a variety of products including: meat (fresh, frozen or smoked), fins (shark
fin soup), liver (cosmetics and boat coating), skin (leather and sandpaper), cartilage (ground and
proposed as an anti-cancer treatment), jaws, and teeth (jewellery) (Vannuccini, 1999). Waste shark
liver oil (WSLO), derived from discarded shark livers, has great potential for further processing
into valuable products such as biodiesel, squalene and omega-3 polyunsaturated fatty acids
(PUFA), including eicosapentaenoic (EPA) and docosahexaenoic (DHA). A shark’s liver
comprises 25-30% of its body weight (Popa et al., 2015c), and WSLO is obtained by exposing the
liver to the sun until it melts, so that the oil can be collected. The major constituents of WSLO are
triglycerides (TG), diacylglycerol ethers (DAGE), and squalene (Wetherbee and Nichols, 2000).
Lipid content varies among shark species and can be affected by factors such as fishing season,
species, and the location of fishing (Navarro-Garcia et al., 2000).

19
Generally, sharks form 50% of the by-catch (sharks that are caught unintentionally while catching
certain target species and target sizes of fish ) in the deep water fisheries of New Zealand and
Australia, yet most of the sharks are discarded and the liver oil is unutilised (Wetherbee and
Nichols, 2000). Historically, the discarded WSLO was used for to proof wooden boats (Jabado et
al., 2015), but now these applications are no longer required as modern boats are fibreglass. The
excess WSLO derived from these discarded shark livers in the fishing industry could instead be
processed to obtain valuable products like biodiesel, squalene, and omega-3 PUFAs –including
EPA and DHA. While the TG components of the WSLO can be converted to biodiesel using
existing biodiesel processing technologies, the squalene, EPA and DHA can be extracted and sold
as value-added products through a biorefinery process in Oman.
The premise of this project is to utilise the waste from the discarded sharks’ liver. Nowadays,
shark liver oil is not utilised in Oman and it is usually wasted. Total shark landings by species for
all governorates in Oman during 2016 was 7,507 tonnes (Ministry of Agriculture and Fisheries,
2014). Therefore, the proposed biorefinery project in Oman will focus in utilising the waste for
the production of valuables products such as biodiesel, squalene, and omega-3 oil in Oman (Al
Hatrooshi et al., 2020).
There is a misconception between sharks finning which is prohibited internationally and shark
fishing for local consumption. Shark finning is the act of removing fins from sharks and
discarding the rest of the shark alive to the sea in order to have bigger space for storing the fins
which is much valuable than the body (Fowler et al., 2005).
Shark finning creates an extensive waste as the fin is about 5% of the total weight of a shark
(Vannuccini, 1999). This waste is contrary to the code of conduct in the United Nations FAO
which states the importance of avoiding waste and discards in fisheries (Code of Conduct for
Responsible Fisheries (Article 7.2.2). Furthermore, the FAO International Plan of Action for the
Conservation and Management of Sharks (IPOA- Sharks) encourages full utilisation of dead
sharks. Thus, utilising shark liver oil obtained after fishing the sharks for local consumption is
crucial as per the stated international laws and regulations.
20
Recovery of Squalene and Omega-3 PUFAs from Waste Shark Liver Oil
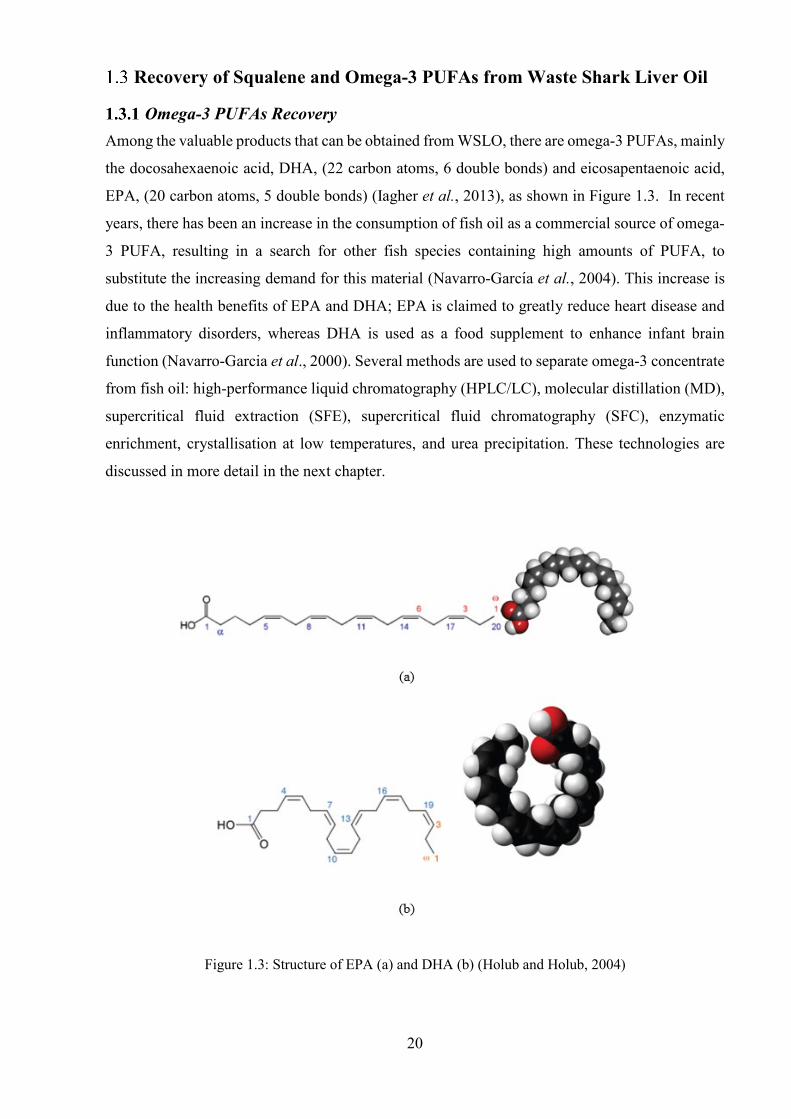
Omega-3 PUFAs Recovery Among the valuable products that can be obtained from WSLO, there are omega-3 PUFAs, mainly
the docosahexaenoic acid, DHA, (22 carbon atoms, 6 double bonds) and eicosapentaenoic acid,
EPA, (20 carbon atoms, 5 double bonds) (Iagher et al., 2013), as shown in Figure 1.3. In recent
years, there has been an increase in the consumption of fish oil as a commercial source of omega-
3 PUFA, resulting in a search for other fish species containing high amounts of PUFA, to
substitute the increasing demand for this material (Navarro-Garcı́a et al., 2004). This increase is
due to the health benefits of EPA and DHA; EPA is claimed to greatly reduce heart disease and
inflammatory disorders, whereas DHA is used as a food supplement to enhance infant brain
function (Navarro-Garcia et al., 2000). Several methods are used to separate omega-3 concentrate
from fish oil: high-performance liquid chromatography (HPLC/LC), molecular distillation (MD),
supercritical fluid extraction (SFE), supercritical fluid chromatography (SFC), enzymatic
enrichment, crystallisation at low temperatures, and urea precipitation. These technologies are
discussed in more detail in the next chapter.
Figure 1.3: Structure of EPA (a) and DHA (b) (Holub and Holub, 2004)

21
Squalene Recovery and Novelty Another major constituent of WSLO is squalene, which is an organic compound with the formula
C30H50, as shown in Figure 1.4. It is mainly obtained from shark liver oil and can also be found in
some vegetable oils (Kim and Karadeniz, 2012). The amount of hydrocarbon (squalene) present
in WSLO varies widely depending on species. Deprez et al. (1990) reported quantities of squalene
ranging from 1–88% of the overall lipids in eight shark species from Tasmanian waters. Squalene
is used in various cosmetic applications, for example as a moisturiser, since it is able to penetrate
the skin quickly and enhances skin absorption of cosmetics and medicaments (Davenport, 1989 ).
Furthermore, it can be used as an adjuvant added to a number of vaccines, including the pandemic
H1N1 vaccine (Fox, 2009). There are several methods used to extract squalene from shark liver oil
including molecular distillation under high vacuum (short path distillation), counter current
chromatography, and supercritical fluid extractions.
Controlled saponification for extraction of squalene is a newly proposed technique in this study.
It was conducted for the first time for separation of squalene from WSLO using controlled
saponification. No report has been published on the use of saponification for extraction of squalene
from WSLO.
Figure 1.4: Squalene (Fox, 2009)
22
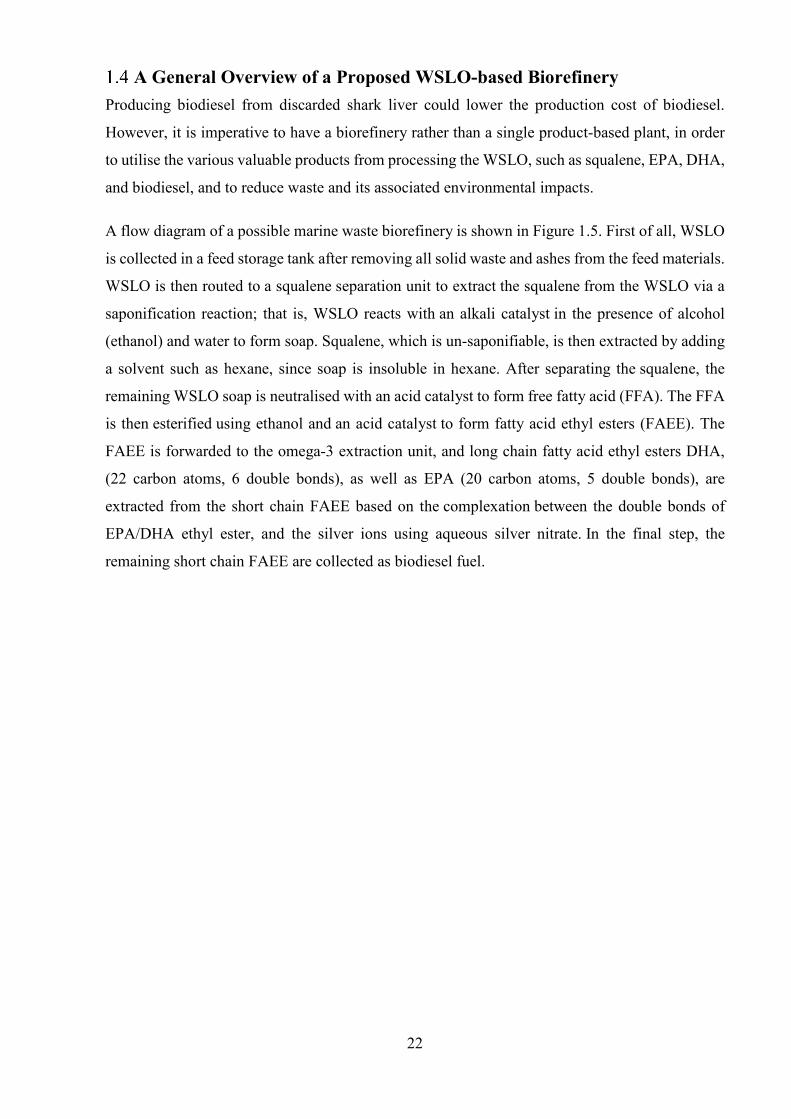
A General Overview of a Proposed WSLO-based Biorefinery Producing biodiesel from discarded shark liver could lower the production cost of biodiesel.
However, it is imperative to have a biorefinery rather than a single product-based plant, in order
to utilise the various valuable products from processing the WSLO, such as squalene, EPA, DHA,
and biodiesel, and to reduce waste and its associated environmental impacts.
A flow diagram of a possible marine waste biorefinery is shown in Figure 1.5. First of all, WSLO
is collected in a feed storage tank after removing all solid waste and ashes from the feed materials.
WSLO is then routed to a squalene separation unit to extract the squalene from the WSLO via a
saponification reaction; that is, WSLO reacts with an alkali catalyst in the presence of alcohol
(ethanol) and water to form soap. Squalene, which is un-saponifiable, is then extracted by adding
a solvent such as hexane, since soap is insoluble in hexane. After separating the squalene, the
remaining WSLO soap is neutralised with an acid catalyst to form free fatty acid (FFA). The FFA
is then esterified using ethanol and an acid catalyst to form fatty acid ethyl esters (FAEE). The
FAEE is forwarded to the omega-3 extraction unit, and long chain fatty acid ethyl esters DHA,
(22 carbon atoms, 6 double bonds), as well as EPA (20 carbon atoms, 5 double bonds), are
extracted from the short chain FAEE based on the complexation between the double bonds of
EPA/DHA ethyl ester, and the silver ions using aqueous silver nitrate. In the final step, the
remaining short chain FAEE are collected as biodiesel fuel.

23
Figure 1.5: Flow diagram of WSLO Biorefinery
waste shark liver oil(WSLO)
Saponification
Soaps
Neutralisation of soaps to form FFA
FFA esterification to form FAEE
Omega-3 oils (EPA/DHA) extraction
FAEE (Biodiesel)
Unsaponifiables (squalene)

24
Research Aim and Objectives: The aim of this work was to identify an efficient and cost effective technique to utilise waste shark
liver oil (WSLO) for the production of biodiesel, squalene and omega-3 PUFAs, including EPA
and DHA.
The following objectives were identified to achieve this research aim:
1) To survey the techniques used for squalene and omega-3 oil separation, to determine which
can be integrated with biodiesel production;
2) To characterise WSLO, including the content of triglycerides, free fatty acids, moisture,
squalene and omega-3 oils components (EPA and DHA);
3) To investigate the effect of using alkali and acid-catalysed homogeneous
transesterification on FAME conversion from WSLO;
4) To carry out a parametric study on biodiesel production reaction from WSLO using both
experimental investigations and statistical modelling, to obtain the conditions for highest
FAME conversion from WSLO;
5) To determine the best technique for separating squalene, EPA and DHA from WSLO;
6) To simulate the conversion of WSLO to biodiesel using Aspen HYSYS-V9 and carry out
a techno-economic analysis including net present value (NPV) and internal rate of return
(IRR) to assess the potential economic feasibilities of the proposed plant;
7) To conduct a sensitivity analysis to show the effect of changing uncertain variables on the
NPV of the proposed plant.

25
Thesis Layout
This section gives a brief overview of the thesis layout.
1) Chapter 1: Introduction
This chapter covers the background to the project on sources of energy and worldwide energy
consumption, including transportation energy. It also shows the importance of promoting energy
diversity and greenhouse gas (GHG) emission reduction using biofuels such as biodiesel.
Furthermore, it presents the main determining factor in biodiesel production cost as feedstock, the
cost of which comprises 70–95% of total biodiesel costs. Hence, the use of a cheap non-edible
feedstock, such as waste shark liver oil (WSLO), would reduce biodiesel production costs and
make the process more economically viable. This section also introduces value-added products
obtained from this feedstock, such as squalene and omega 3 oils (EPA and DHA), via the
biorefinery process. Finally, it presents the aim and objectives of this research.
2) Chapter 2: Literature Review
Initially, the technologies used to produce biodiesel and the factors that affect the biodiesel
production reaction are reviewed. There is also a review of different squalene and omega-3 oils
(EPA and DHA) extraction techniques.
3) Chapter 3: Materials and Methods
After reviewing biodiesel production technologies and identifying the extraction techniques for
squalene and omega-3 oils (EPA and DHA), this chapter provides the details of all materials and
methods used to carry out the experimental research, including the characterisation of WSLO,
homogenous catalysed transesterification of WSLO, and squalene and omega-3 oils (EPA and
DHA) extraction methods.

26
4) Chapter 4: Results and Discussion
This chapter describes the results obtained from the characterisation of WSLO, the alkali
transesterification of WSLO, and the experimental design for acid-catalysed transesterification. It
also presents and discusses the results of the experimental design for squalene extraction using
saponification, before discussing the results of the EPA and DHA extraction experiments.
5) Chapter 5: Techno-economic Analysis
This chapter assesses and compares the commercial feasibility of an acid-catalysed biodiesel plant
using WSLO, with conventional alkali-catalysed biodiesel production using refined vegetable oil
(rapeseed oil). Aspen HYSYS-V9 was used to simulate both plants and accordingly the Net
Present Values (NPV), internal rate of return (IRR), and breakeven price were evaluated. Finally,
a sensitivity analysis was conducted to show the effect of changing certain variables on the NPV
of both biodiesel plants.
6) Chapter 6: Conclusions and Further Work:
This chapter summarises the findings of the WSLO characterisation, the alkali transesterification
of WSLO, and experimental design of the acid-catalysed transesterification. It also concludes from
the findings of the experimental design for squalene extraction using saponification, and the EPA
and DHA extraction experiments. The last section of this chapter recommends future work that
needs to be undertaken.

27
Literature Review
Biofuel Feedstock and Global Biofuel Production There has been a continuous rise in global biofuel production since 2011, as shown in Figure 2.1.
This growing interest in biofuel is mainly due to the concerns associated with petroleum-based
fuels in terms of energy supply and cost, and climate change. Therefore, ensuring affordable and
reliable energy sources with minimum adverse effects on the environment is crucial for world
energy supply (Peters and Thielmann, 2008).
Figure 2.1: Biofuels production by region (PikeResearch, 2012)
Most biofuels are bio-ethanol and biodiesel and are used as liquid fuels for transportation.
Generally, bioethanol is obtained from the fermentation of various feedstock that contains sugar
and carbohydrates (Halder et al., 2019) Figure 2.2 shows bioethanol yield from various feedstock.
Bio-ethanol is produced commercially on an industrial scale, mainly in United States and Brazil
due to the predominance of sugarcane and the abundance of land suitable for the cultivation of
this raw material (Neto et al., 2018). The production of world ethanol for transportation tripled
from 17 × 109 L to 52 × 109 L between 2000 and 2007. The major producers of ethanol are United
States and Brazil which account for 62.2% and 25% of global ethanol production,
respectively (Singh and Dwevedi, 2019)

28
Ethanol fuel is used in blended state E10 (10% ethanol) which is recommended for all cars that
are manufactured after 2000. Blended ethanol as fuel has been commonly used in Brazil, the
United States, and Europe. The first car to run entirely on ethanol was a Fiat 147 in 1978 in Brazil.
(Singh and Dwevedi, 2019).
In 2008, bio-ethanol consumption as a fuel for transportation surpassed gasoline in Brazil
(Chaddad, 2010). Currently, more than 95% of all cars sold in Brazil are “flex-fuel” cars that can
use any blend of gasoline and ethanol (Amorim et al., 2011). Gasoline sold in Brazil contains 25%
anhydrous bioethanol (Amorim et al., 2011).
Figure 2.2: Bioethanol yield of different feedstocks (Halder et al., 2019)
Biodiesel is the most common biofuel as a replacement for petrodiesel in compression ignition
engines (Celante et al., 2018). Biodiesel can be obtained from several sources, such as animal fat,
vegetable sources (edible or non-edible oils), algae, waste cooking oil and grease (Singh and Singh,
2010). The selection of biodiesel feedstock depends on many factors, such as availability and
climate. The main feedstock for biodiesel production in Europe is rapeseed and sunflower oils,
whereas animal fats and soybean are predominantly used in the USA, and palm oil in Asia,
respectively (Singh and Singh, 2010).

29
Non-edible vegetable oils and other sources of waste oils are potential low-priced feedstocks for
biodiesel production, as there are concerns about the use of edible oil for biodiesel production due
to the gap between demand and supply, which contributes to food shortages and the global food
crisis (Yang et al., 2014). Therefore, non-edible oils from crops that grow in wasteland and which
do not compete with food crops could be considered as a sustainable feedstock for biodiesel
production. Moreover, it is important that governmental policies and legislation should ensure a
balance in ecosystems in the food and fuel supply chain (Yang et al., 2014).
A major challenge to biodiesel production is the high production cost (Zhang et al., 2003b),
especially the high cost of feedstocks, which accounts for 70–95% of the total biodiesel production
cost (Banković-Ilić et al., 2012). Hence, using a cheap non-edible feedstock, such as waste oil,
e.g. waste shark liver oil, could reduce production costs and make the process economically viable.
Biodiesel Production Technologies Biodiesel production technology is undergoing rapid technological reform in both industry and
academia (Patil and Deng, 2009). The main challenge for commercial biodiesel production is its
high cost compared to petroleum-based diesel (Radich, 1998). Therefore, several studies have
been carried out to identify a cost effective biodiesel production technology (Patil and Deng, 2009).
There are a number of technologies for producing biomass-derived biodiesels, such as direct use
and blending of vegetable oils, micro-emulsions, thermal cracking (pyrolysis), and
transesterification (Ma and Hanna, 1999b), but only the triglyceride transesterification and FFA
esterification processes can be used to produce biofuel that meets the technical definition for
biodiesel.
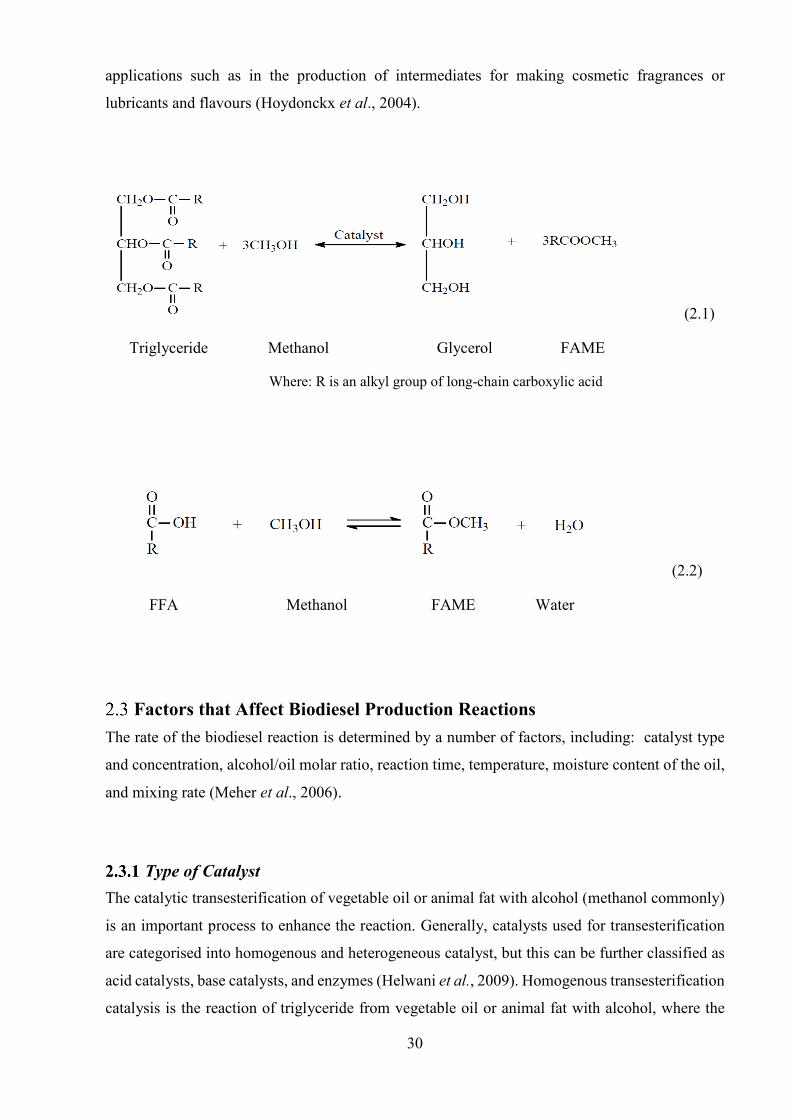
Transesterification for biodiesel production is the most common technique because it is cost
effective, and the physical characteristics of the FAMEs produced are very close to diesel fuel
(Balat and Balat, 2010). Transesterification (alcoholysis) is an ester conversion process involving
reactions of the triglyceride from animal fat or vegetable oils with an alcohol (e.g. methanol) to
produce FAME and glycerol as a by-product, as shown in Equation 2.1. These reactions can be
carried out with or without catalysts, but catalysts are routinely used to increase the reaction rates.
Usually, excess alcohol is required to shift the equilibrium to the product side due to equilibrium
limitations (Meher et al., 2006). In biodiesel feedstocks containing high levels of free fatty acids,
an esterification pre-treatment of the FFA may be required. Esterification is a reversible reaction
of carboxylic acids with alcohol (e.g. methanol) to form alky esters and water in the presence of
acid catalysts (Moser, 2009), as illustrated in Equation 2.2. This reaction has many commercial
30
applications such as in the production of intermediates for making cosmetic fragrances or
lubricants and flavours (Hoydonckx et al., 2004).
(2.1)
Triglyceride Methanol Glycerol FAME
Where: R is an alkyl group of long-chain carboxylic acid
(2.2)
FFA Methanol FAME Water
Factors that Affect Biodiesel Production Reactions The rate of the biodiesel reaction is determined by a number of factors, including: catalyst type
and concentration, alcohol/oil molar ratio, reaction time, temperature, moisture content of the oil,
and mixing rate (Meher et al., 2006).
Type of Catalyst The catalytic transesterification of vegetable oil or animal fat with alcohol (methanol commonly)
is an important process to enhance the reaction. Generally, catalysts used for transesterification
are categorised into homogenous and heterogeneous catalyst, but this can be further classified as
acid catalysts, base catalysts, and enzymes (Helwani et al., 2009). Homogenous transesterification
catalysis is the reaction of triglyceride from vegetable oil or animal fat with alcohol, where the
31
catalyst is in the same phase as the reactant. Among the homogenous catalysts used for
transesterification are alkali catalysts, such as the hydroxides and methoxides of sodium and
potassium (de Lima and Mota, 2019). Among the acid catalysts, the most commonly used
homogenous acid catalysts are sulphuric, phosphoric and hydrochloric acids (Ma and Hanna,
1999b).
The use of heterogeneous catalysis in transesterification reactions has the advantages of
preventing saponification reaction, and lower processing cost by eliminating the additional steps
for removing the catalyst, as is the case in the homogenous catalyst (de Lima and Mota, 2019).
Hence, heterogeneous catalysts have been reported as substitutes for homogeneous catalysts, as
heterogeneous catalysts are less corrosive and easier to separate and handle (Helwani et al., 2009).
However, homogenous transesterification catalysis has significantly accelerated
transesterification reaction rate in comparison with the heterogeneous reaction (Georgogianni et
al., 2009). Furthermore, transesterification can be conducted in the absence of catalyst (non-
catalytic transesterification), but this process is not economically viable for the production of
biodiesel due to the high energy requirement (Zabeti et al., 2009).
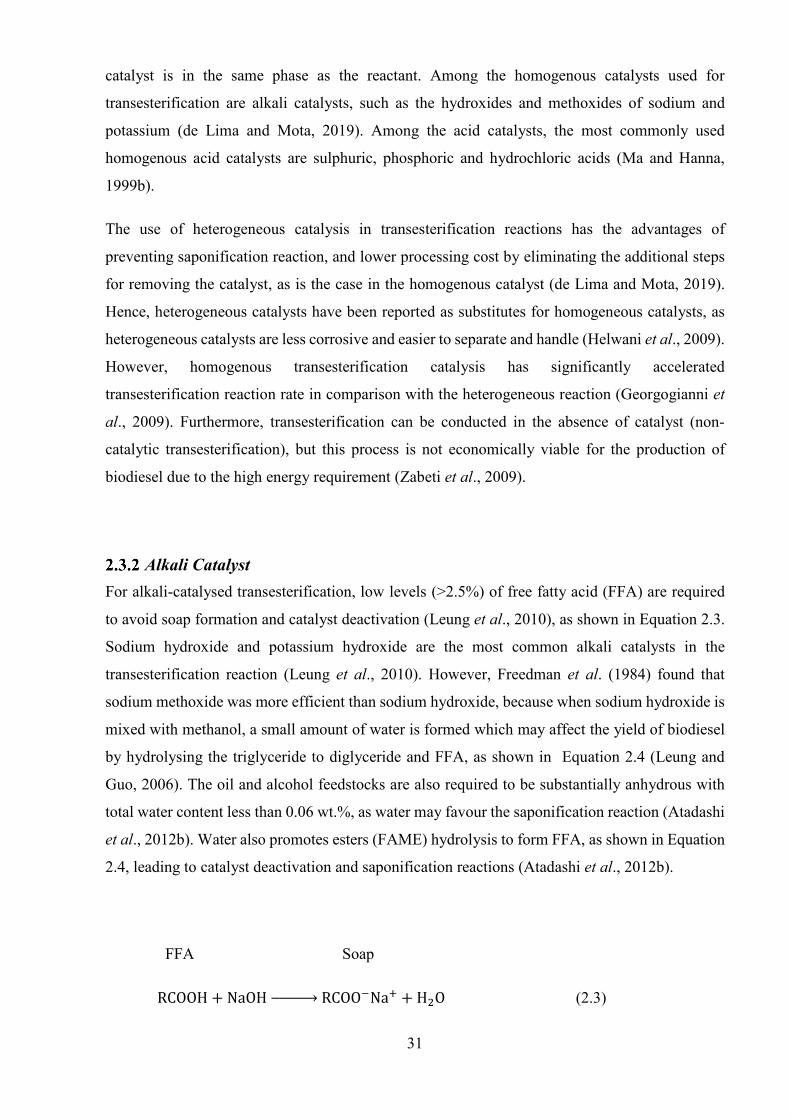
Alkali Catalyst For alkali-catalysed transesterification, low levels (>2.5%) of free fatty acid (FFA) are required
to avoid soap formation and catalyst deactivation (Leung et al., 2010), as shown in Equation 2.3.
Sodium hydroxide and potassium hydroxide are the most common alkali catalysts in the
transesterification reaction (Leung et al., 2010). However, Freedman et al. (1984) found that
sodium methoxide was more efficient than sodium hydroxide, because when sodium hydroxide is
mixed with methanol, a small amount of water is formed which may affect the yield of biodiesel
by hydrolysing the triglyceride to diglyceride and FFA, as shown in Equation 2.4 (Leung and
Guo, 2006). The oil and alcohol feedstocks are also required to be substantially anhydrous with
total water content less than 0.06 wt.%, as water may favour the saponification reaction (Atadashi
et al., 2012b). Water also promotes esters (FAME) hydrolysis to form FFA, as shown in Equation
2.4, leading to catalyst deactivation and saponification reactions (Atadashi et al., 2012b).
FFA Soap
RCOOH + NaOH �⎯⎯⎯⎯� RCOO−Na+ + H2O (2.3)

32
RCOOCH3 + H2O Base Catalyst �⎯⎯⎯⎯⎯⎯⎯⎯⎯� RCOOH + CH3OH (2.4)
FAME Water FFA Methanol
Alkaline catalysis is advantageous because of its higher reaction rate, which is 4,000 times faster
than acid-catalysed transesterification, and the relatively simple process requirements (Lam et al.,
2010; Atadashi et al., 2013). However, there are some drawbacks of this type of catalyst, such as
the difficulty of extracting the catalyst from the product and recovering by product (glycerol);
these are an extra steps with cost and energy implications (Leung et al., 2010). Current purification
technologies for crude glycerol are proven effective technologies. However, due to the cost and
high energy requirement, it is believed that glycerol purification technologies are viable for large
scale plants and unfeasible for small and medium plants due to the energy and cost restraints
(Thompson and He, 2006; Ardi et al., 2015).
Figure 2.3 shows that feedstock with an FFA percentage higher than 2.5% requires pre-treatment
before using an alkali catalyst. The oil may be esterified with an acid catalyst to reduce the amount
of FFA, but if the amount of free fatty acid in the biodiesel feedstock is less than 2.5% then an
alkali catalyst is suitable for the reaction (Leung et al., 2010).
Crude Glycerol is a by-product of this process
Figure 2.3: Alkali-catalysed biodiesel production (Leung et al., 2010)

33
Aid Catalyst Acid-catalysed transesterification is not as often used in industrial applications for biodiesel
production as its counterpart, the alkali-catalysed transesterification. The main reason for this is
that the homogenous acid-catalysed transesterification reaction is about four thousand times
slower than the homogenous base-catalysed transesterification (Leung, Wu et al. 2010).
Nevertheless, acid-catalysed transesterification has an advantage over the base-catalysed process
as it has a high tolerance for high FFA in the feedstock. Some of the acid catalysts used for
transesterification are sulphuric, phosphoric, hydrochloric and organic sulphuric acids.
In alkali-catalysed transesterification, the presence of high FFA and water results in soap
formation and, hence, partially shifts the reaction from transesterification to saponification. To
avoid these problems, oil from animal fat, or fish oil with a high FFA content, requires an FFA
esterification pre-treatment step using an acid catalyst to reduce the FFA content before the
application of alkali-catalysed transesterification (Canakci and Sanli, 2008).
Existing studies have shown the positive effect of using an acid-catalysed pre-treatment method
followed by alkali-catalysed transesterification. For example, acid-catalysed pre-treatment steps
were applied to a yellow grease with 12% FFA and a brown grease with 33% FFA, to reduce their
FFA content to less than 1% FFA (Enweremadu and Mbarawa, 2009).
Enzyme Catalyst Enzymatic catalysts such as lipases can catalyse the transesterification of a variety of
triglycerides, including waste oils and fats with high levels of FFA. For instance, sunflower oil
has been successfully catalysed by lipases from C. antarctica and R. miehei. Furthermore,
rapeseed oil has been transesterified using lipases from M. miehei, M. circinelloides and
T. lanuginose (Gog et al., 2012). Feedstock with high FFA, such as tallow, was transesterified
using M. miehei and C. antarctica lipases (Gog et al., 2012). Using enzymatic catalysts to
produce biodiesel can overcome the drawbacks associated with alkali-catalysed transesterification,
such as extracting the catalyst from the product and avoiding soap formation. The main drawback
of enzymatic transesterification is the high cost and longer reaction time, and so it is not common
to use lipases to produce biodiesel commercially (Leung et al., 2010).

34
Alcohol Quantity Researchers have investigated the effect of the molar ratio of alcohol to triglycerides in the yield
of biodiesel and found that one of the important factors influencing ester yield is the quantity of
alcohol (Leung and Guo, 2006). The stoichiometric molar ratio of alcohol to oil is 3:1, where the
reaction needs three moles of alcohol for one mole of triglycerides to produce three moles of
FAME and one mole of glycerol. However, since the reaction is reversible, excess alcohol is
required to ensure triglycerides have been converted to FAME. Although increasing the amount
of alcohol enhances the ester yield, this also increases the cost of alcohol recovery (Musa, 2016).
The higher energy required for alcohol recovery has a huge effect on the processing of feedstocks
containing a high level of FFA, such as waste cooking oil, which requires higher molar ratios of
alcohol to triglycerides of up to 15:1 for acid-catalysed transesterification (Ali et al., 1995).
Furthermore, molar ratios of 3:1 to 15:1 were investigated in the transesterification of Cynara oil
using ethanol, where the yield of biodiesel increased with the ethanol molar ratio up to a value of
12:1. The best biodiesel yield was obtained with molar ratios of 9:1 and 12:1, whereas an
incomplete reaction was observed for molar ratios below 6:1. However, for a molar ratio of 15:1,
the glycerol separation was difficult and the yield of esters decreased due to the fact that a part of
the glycerol remains in the biodiesel phase (Lee and Saka, 2010).
Reaction Temperature and Catalyst Concentration It has frequently been reported that the temperature of the transesterification reaction influences
the ester yield. The transesterification of soybean oil with methanol molar ratio 6:1 has been
investigated using 1% of NaOH at three different temperatures. After 0.1 hr the ester yields were
94%, 87% and 64% for 60°C, 45°C and 32°C, respectively (Ma and Hanna, 1999a). Researchers
demonstrated that, depending on the oil feedstock used, the optimal temperature ranges from 50°C
to 60°C, and it has to be lower than the boiling point of alcohol used to avoid vaporisation of
alcohol (Ma and Hanna, 1999a).
The conversion of triglycerides to fatty acid esters can also be affected by the amount of catalyst
used in the reaction. Eevera et al. (2009) investigated the influence of catalyst concentrations on
transesterification using sodium hydroxide catalyst in methanolysis of refined canola oil and used
frying oil. The conversion of triglyceride to FAME was shown to increase with catalyst
concentration, while an insufficient amount of sodium hydroxide resulted in incomplete
conversion of triglycerides to FAME, resulting in lower ester contents (Eevera et al., 2009). The
study also showed that, sodium hydroxide catalyst at 1.5 wt. % based on the oil reached the
optimal value biodiesel yield. However, a further increase in catalyst concentration decreased ester

35
conversion and a large amount of soap was noticed (Eevera et al., 2009). This is because the
addition of excess alkaline catalyst resulted in greater triglyceride participation in the
saponification reaction with sodium hydroxide, as shown in Equation 2.5. Therefore, the amount
of soap production increased and consequently ester conversion decreased (Eevera et al., 2009).
Triglycerides + 3 NaOH → Soap + Glycerol (2.5)
Moisture Content and Free Fatty Acid Content Oil and alcohol feedstocks are required to be substantially anhydrous with total water contents
below 0.06 wt.% for alkali-catalysed transesterification. Having excess water above 0.06 wt.% in
alkali-catalysed transesterification leads to hydrolysis of the triglycerides and production of FFA,
which react with the alkaline catalyst to form soap. Consequently, it will affect the biodiesel yield
and render the separation of glycerol (Dorado et al., 2002). Furthermore, soap formation
deactivates the catalyst activity, which will reduce the biodiesel yield (Atadashi et al., 2012a).
Feedstocks with FFA percentages above 2.5% require pre-treatment before using an alkali catalyst.
The oil may be esterified with an acid catalyst to reduce the amount of FFA, but if the amount of
free fatty acid in the biodiesel feedstock is less than 2.5% then the alkali catalyst is suitable for
the reaction (Leung et al., 2010). Generally, feedstock with high FFA and water result in soap
formation and, hence, shift the reaction partially from transesterification to saponification.
Therefore, to avoid these problems, an esterification pre-treatment step using an acid catalyst is
required to reduce the FFA content before the application of alkali-catalysed transesterification
(Canakci and Sanli, 2008).

36
Types of Reactors for Biodiesel Production Commercial biodiesel producers use continuous stirred tank reactors (CSTR) for the
transesterification of animal fat or vegetable oils in the presence of acid or base catalyst to produce
biodiesel. CSTR is the most common continuous-flow system in biodiesel production (Regalado-
Méndez et al., 2015). The continuous-stirred tank reactor has constant input and output of material
where the reactants are continuously added and the product are continuously removed as shown
in Figure 2.4.
Figure 2.4: CSTR diagrammatic sketch (Zhao et al., 2015)
CSTR is usually used for larger plants (>4 million L/year) whereas batch reactors are used for
small biodiesel production plants (Gerpen, 2005). The batch reactor consists of a tank and some
type of agitation. The tank contains the reactants for the process which are oil, alcohol, and catalyst
in the case of biodiesel process.
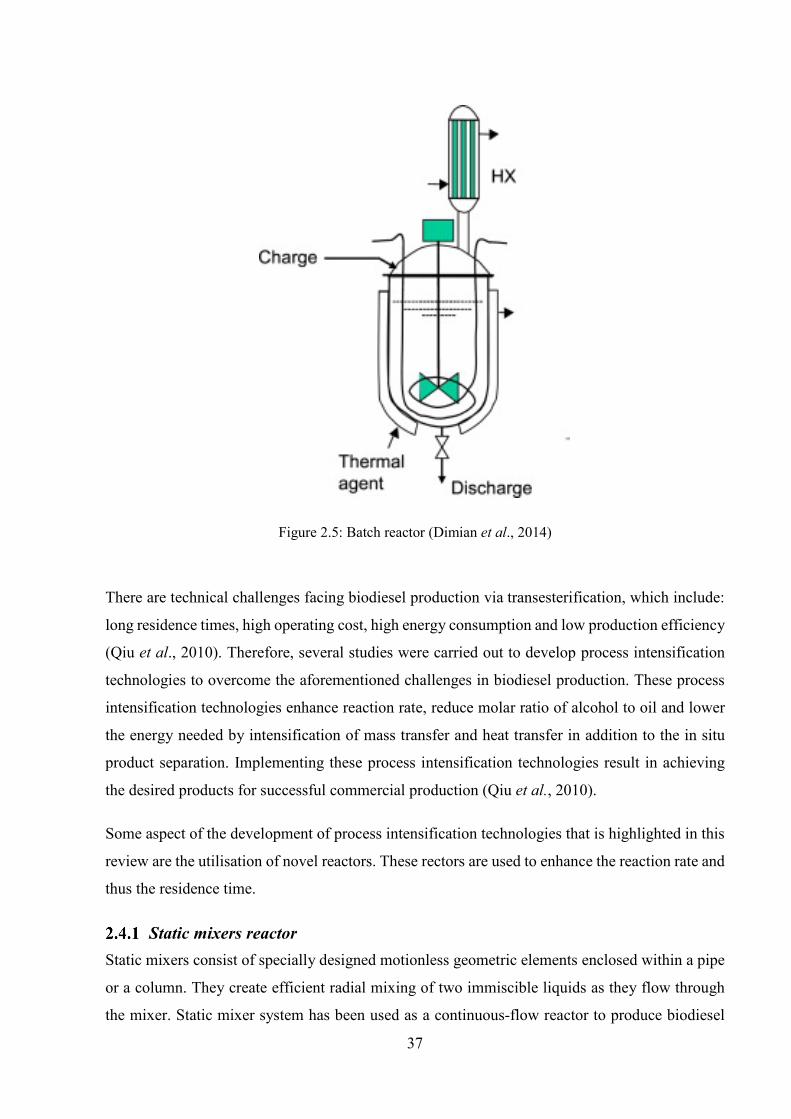
Batch reactors are operated with all the reactants placed in the reactor before the start of reaction,
and all are removed after the completion of reaction. There is no addition or removal of material
during the reaction process as shown in Figure 2.5 (Foutch, 2003).
The main advantages of the batch reactor are simplicity of design, which allows for high flexibility
to accommodate variations in feedstock type, composition, and quantity. The major drawbacks of
the batch process include low productivity, larger variation in product quality, and labour that is
more intensive and energy requirements (Foutch, 2003).
37
Figure 2.5: Batch reactor (Dimian et al., 2014)
There are technical challenges facing biodiesel production via transesterification, which include:
long residence times, high operating cost, high energy consumption and low production efficiency
(Qiu et al., 2010). Therefore, several studies were carried out to develop process intensification
technologies to overcome the aforementioned challenges in biodiesel production. These process
intensification technologies enhance reaction rate, reduce molar ratio of alcohol to oil and lower
the energy needed by intensification of mass transfer and heat transfer in addition to the in situ
product separation. Implementing these process intensification technologies result in achieving
the desired products for successful commercial production (Qiu et al., 2010).
Some aspect of the development of process intensification technologies that is highlighted in this
review are the utilisation of novel reactors. These rectors are used to enhance the reaction rate and
thus the residence time.
Static mixers reactor Static mixers consist of specially designed motionless geometric elements enclosed within a pipe
or a column. They create efficient radial mixing of two immiscible liquids as they flow through
the mixer. Static mixer system has been used as a continuous-flow reactor to produce biodiesel
38
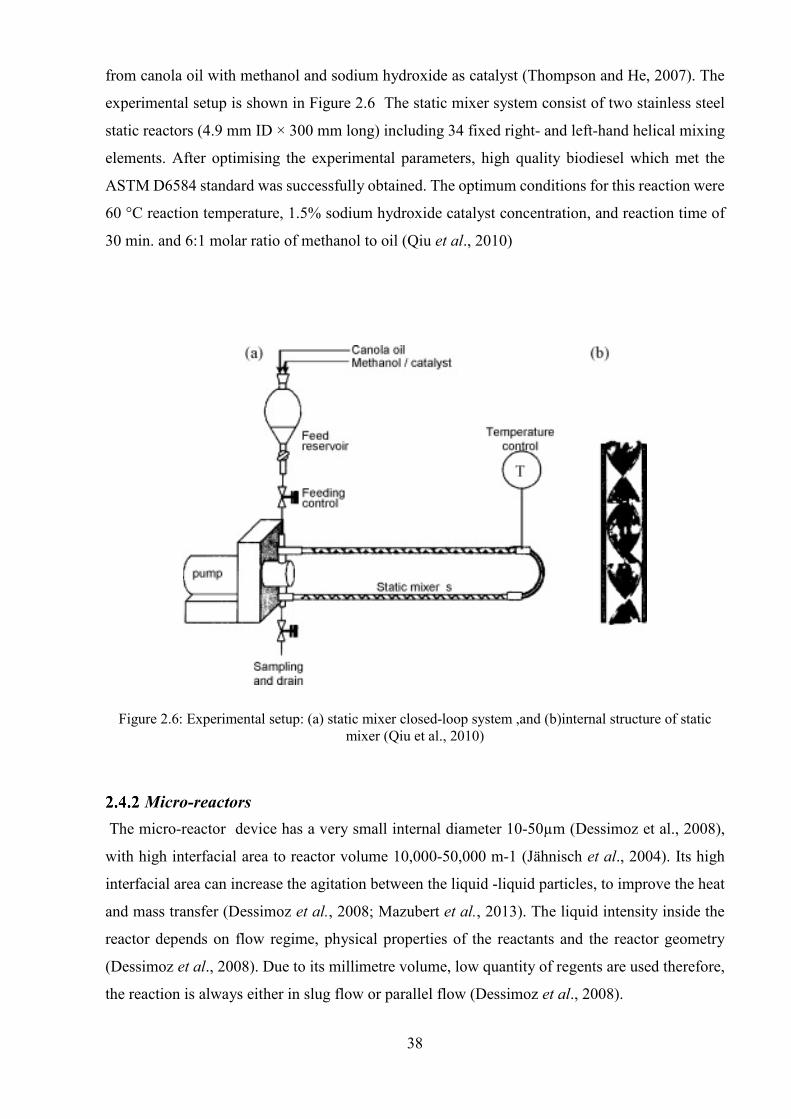
from canola oil with methanol and sodium hydroxide as catalyst (Thompson and He, 2007). The
experimental setup is shown in Figure 2.6 The static mixer system consist of two stainless steel
static reactors (4.9 mm ID × 300 mm long) including 34 fixed right- and left-hand helical mixing
elements. After optimising the experimental parameters, high quality biodiesel which met the
ASTM D6584 standard was successfully obtained. The optimum conditions for this reaction were
60 °C reaction temperature, 1.5% sodium hydroxide catalyst concentration, and reaction time of
30 min. and 6:1 molar ratio of methanol to oil (Qiu et al., 2010)
Figure 2.6: Experimental setup: (a) static mixer closed-loop system ,and (b)internal structure of static mixer (Qiu et al., 2010)
Micro-reactors The micro-reactor device has a very small internal diameter 10-50µm (Dessimoz et al., 2008),
with high interfacial area to reactor volume 10,000-50,000 m-1 (Jähnisch et al., 2004). Its high
interfacial area can increase the agitation between the liquid -liquid particles, to improve the heat
and mass transfer (Dessimoz et al., 2008; Mazubert et al., 2013). The liquid intensity inside the
reactor depends on flow regime, physical properties of the reactants and the reactor geometry
(Dessimoz et al., 2008). Due to its millimetre volume, low quantity of regents are used therefore,
the reaction is always either in slug flow or parallel flow (Dessimoz et al., 2008).

39
In slug-flow, the mixing can be enhanced by either increasing of interfacial area (i.e. using zigzag
channel) or increasing the recirculating diffusion (Wen et al., 2009). In parallel flow regime, the
mass transport depends only on the particles diffusion inside the reactor, because there is no
recirculating diffusion (Mazubert et al., 2013).
This reactor was employed in the transesterification reaction of biodiesel production. Rahimi et
al. (2014) reported that 98% of yield can be obtained from methanolysis of soybean oil at 9:1 of
(MeOH: soybean oil) molar ratio, 1.2 (catalyst KOH : oil) wt.% , 60 ℃ reaction temperature and
180s reaction time (Rahimi et al., 2014). While, only 28s and 56℃ were required to complete the
same reaction under the same operating conditions when the reactor was modified to zigzag
channel (240µm) (Wen et al., 2009). Zigzag shape can increase the internal surface area which in
turn leads to increase the contact between the reaction particles and improve triglyceride to FAME
conversion. 78.3% of FAME yield was obtained from supercritical conditions of refined palm oil
with ethyl acetate at 330-370℃ reaction temperature , under 200 bar pressure in micro- reactor
and 1:50 of ethyl acetate to oil molar ratio (Sootchiewcharn et al., 2015).
To sum up, biodiesel synthesis can be intensified in a micro reactor, as this reactor can reduce the
required time and energy with high efficiency of production. However, due to reactor small
volume, using solid catalyst can cause many technical problems such as plugging.
Oscillatory flow reactors Oscillatory flow reactors (OBR) are tubular reactors which contain equally spaced orifice plate
baffles and produce oscillatory flow using a piston drive as shown Figure 2.7. When a fluid is
introduced into the OBR reactor, an oscillatory motion interacts with it, intensifies radial mixing
which enhance mass and heat transfer, and maintain plug flow.

40
Figure 2.7: The configuration of oscillatory flow reactor (Harvey and Lee, 2012)
A continuous oscillatory flow reactor (OFR) was developed to produce biodiesel from rapeseed
oil in a pilot-scale plant shown in Figure 2.8. The reactor consists of two vertically positioned
jacketed tubes of 1.5 m length and 25 mm internal diameter. Biodiesel conversion of 99% were
achieved after 30 min at 50 °C using a molar ratio of methanol to rapeseed oil of 1.5 and in the
presence of a sodium hydroxide catalyst. Conversions of biodiesel up to 99% were achieved after
30 min at 50 °C using a molar ratio of methanol to rapeseed oil of 1.5 and in the presence of a
sodium hydroxide catalyst (Harvey and Lee, 2012).
One of the advantages of OBR technology is that it requires a very low molar ratio of methanol to
oil in comparison to the stoichiometric ratio (3:1) which reduces significantly the operating cost.
Furthermore, the short length-to-diameter of this reactor decreases capital cost and allows scale
up of the process (Harvey and Lee, 2012).

41
Figure 2.8: Schematic of oscillatory flow reactor for biodiesel production (Harvey and Lee, 2012)
Spinning reactors The spinning reactor is disc or tube rotates fast depending on centrifugal force. The reactants fed
from the top of the reactor, from which a thin layer travel along the disc and help to enhance the
mixing as shown in Figure 2.9 Error! Reference source not found.(de Caprariis et al., 2012;
Pask et al., 2012).
Figure 2.9: A schematic view of a spinning disk reactor (Pask et al., 2012).

42
More than 98% of FAME yield was attained after 40s from methanolysis of canola oil in the
presence of NaOH catalyst under 40 - 65 ℃ for a reaction carried out in a rotating tube reactor
(Lodha et al., 2012). In comparison with batch reactor, a few seconds were required to convert
80% of canola oil to FAME conversion at 40℃ reaction temperature, 6:1 (methanol : canola
oil), 1 wt.% of (NaOH : oil) catalyst concentration and 1000 rpm stirring speed (Qiu et al., 2012).
The disadvantage of this reactor is the difficult handling of solid catalyst in this reactor. The only
way that can be used to overcome this difficulty is by coating the reactor tube by a catalytic
material which is a very expensive and time consuming technique.
Acoustic reactors Acoustic reactor or ultrasound reactor is a type of intensification reactor that produces an acoustic
energy with a frequency ranged from 20-50 kHz to mix the reactants together. This frequency can
create a cavity in the reaction mixture which enables establishment of a uniform and intense
mixing inside the reactor (Gole and Gogate, 2012). This reactor has been employed to produce
biodiesel due to its excellent performance to enhance the mixing and increase the interfacial area
between the liquid –liquid reaction (Mazubert et al., 2013).
It was found that the transesterification reaction carried out in an acoustic reactor is shorter and
more economic in terms of reducing the required regents to achieve the same conversion of
triglyceride to methyl ester compared with batch reactor. (Kumar et al., 2010) found that more
than 98% of free fatty acid ethyl eater yield can be obtained from ethanolysis of coconut oil at
6:1 of ethanol : oil molar ratio, 0.75 wt % (KOH : oil) catalyst concentration in an acoustic reactor.
Furthermore, the required time in ultra-sonication reactor was 7 min. compared with 1-4 h to
achieve the same conversion in a batch reactor (Kumar et al., 2010). Similarly, only 50 min was
required in the transesterification reaction of canola oil to methanol (1:5), 0.7 wt.% of potassium
hydroxide in ultrasonic reactor at room temperature to get >99% of canola oil conversion to
FAME (Thanh et al., 2010). Ultrasound reactor was also used in the transesterification reaction in
heterogeneous phase. Mild reaction conditions were required to obtained more than 90 % yield of
methyl ester at 90 min reaction time , 65℃ reaction temperature, (9:1) of methanol to soybean
oil and 1wt% loading of calcium methoxide catalyst (Deshmane and Adewuyi, 2013).
In summary, even the obtained free fatty acid alkyl ester from this type of reactor has a good
quality with high conversion, but the required time to establish the reaction (7 and 90 min) which
is high compared with that required in micro-reactor (180 s) and spinning disc (40 s).

43
Bio-refining of Waste Shark Liver Oil
Biodiesel Production from Waste Shark Liver Oil There are limited studies on biodiesel production from WSLO, and there is currently no existing
work on producing biodiesel from Carcharhinidae shark liver oil used in this study. Most existing
research is focused on physical and chemical properties, characterisations of lipids, separation of
squalene and discrimination against diacylglycerol ethers (DAGE). A lipase-catalysed ethanolysis
of squalene-free shark liver oil was investigated by Fernández et al. (2013),who used the
ethanolysis of shark liver oil for the discrimination of ether lipids such as alkylglycerols (AKG),
monoacylglycerol ethers (MAGE), and DAGE, as shown in
Figure 2.10. Ether lipids (AKG, MAGE, and DAGE) are valuable components. They have been
used as a therapy for cancer since they are potent antineoplastic agents that inhibit growth, show
anti-metastatic activity and induce differentiation and apoptosis in cancer cells (Diomede et al.,
1993).
Figure 2.10: Ether lipids (Fernández et al., 2013)

44
Extraction Process of Omega-3 Polyunsaturated Fatty Acids (PUFAs) Omega-3 fatty acids are long-chain polyunsaturated fatty acids ranging from 18 to 22 carbon
atoms, with the first double bonds starting at the third carbon from the methyl end group. WSLO
is one source of omega-3 PUFA, mainly the docosahexaenoic acid, DHA, (22 carbon atoms, six
double bonds) and eicosapentaenoic acid, EPA (20 carbon atoms, five double bonds), as shown
in Figure 2.11 (Iagher et al., 2013). Omega-3 fatty acid can also be found as alpha-linoleic acid
(ALA) in plant oil like walnut and algal oil. The degree of unsaturation (number of double bonds)
in the fatty acid determines the degree of susceptibility to oxidation. DHA has six double bonds
and EPA has five double bonds which are very susceptible to several types of reaction, especially
oxidation, due to the high number of double bonds. Furthermore, the hydrolysis reaction can occur
in the presence of moisture and heat, where the PUFA triglycerides will break down into free fatty
acids, mono, and di-glycerides (Hernandez, 2005).
The isomerisation reaction also occurs in fish oil when there is a change in the configuration of
fish oil fatty acid from cis- to trans-isomers, especially when fish oil deodorisation is conducted
at unusually high temperatures and for long periods of time (Hernandez, 2005). Other
isomerisation reactions occur when the double bond in fatty acids changes position due to high
heat exposure, resulting in the formation of conjugated double bonds (Hernandez, 2005).
Figure 2.11: Structure of EPA (a) and DHA (b) (Holub and Holub, 2004)
45
In terms of applications, there is a high demand for omega-3 PUFA due to their health benefits,
after their importance to human health was realised in the 1980s when several authors published
epidemiological studies about the relation between an omega-3 enriched diet and the prevention
of diseases like myocardial infarction or bronchial asthma (Kromann and Green, 1980).
Subsequently many studies have investigated the effect of EPA and DHA in human health (Rubio-
Rodríguez et al., 2010). The health benefits of EPA include the prevention of coronary heart
disease, while DHA is useful for the improvement of brain and retina functions (Navarro-Garcı́a
et al., 2004). Ruxton et al. (2005) concluded that there is strong evidence of the clinical benefit of
long chain omega-3 fatty acid on cardiovascular diseases or rheumatoid arthritis. Moreover, it has
the ability to inhibit a number of aspects of inflammation (Calder, 2013), and decreases the risk
of arrhythmias, which can lead to sudden cardiac death (Rubio-Rodríguez et al., 2010). Due to the
proven health benefits of omega-3 fatty acids, these products are now widely used in infant
formula as essential nutrients for infant growth (Li and Li, 2008). The above applications strongly
suggest the importance of consuming omega-3 fatty acid either through natural food products or
as a supplement (Lands, 2008). Thus, any new sources of omega-3 are valuable, especially if the
source is currently under-utilised, as is the case with waste shark liver oil (Navarro-García et al.,
2010).
There are a number of methods of extracting omega-3 PUFAs from fish oils, as shown in Figure
2.12, most commonly: molecular distillation (MD), high-performance liquid chromatography
(HPLC/LC), supercritical fluid extraction (SFE), supercritical fluid chromatography (SFC),
enzymatic enrichment, crystallisation at low temperatures, and urea precipitation.

46
Figure 2.12: General overview of common omega-3 extraction methods (Lembke, 2013a)
2.5.2.1 Urea Precipitation
Urea precipitation is used to extract omega 3 PUFA from fish oil, and was first reported by Domat
et al. (1955). The process depends on the formation of crystals that contain urea-complex with
saturated fatty acids.
Figure 2.13 shows the formation of urea crystals in the absence and presence of long chain fatty acids.
This crystal is removed by centrifugation or filtration, and subsequently produces an effluent
liquid stream with a high concentration of unsaturated fatty acid. The drawback of this extraction
process is the moderate extraction efficiency and potential formation of carbamate, which is a
carcinogenic compound (Shahidi and Wanasundara, 1998; Canas and Yurawecz, 1999).
The use of urea complexation in pilot scale for the concentration of omega-3 fatty acid has been
demonstrated by Ratnayake et al. (1988). The production of omega-3 fatty acid from seal blubber
using urea complexation was optimised by Wanasundara and Shahidi (1999). A maximum production
of omega-3 fatty acid (88.2%) at a urea : fatty acid ratio of 4.5:1, a crystallisation time of 24 h, and a
crystallisation temperature of -10°C (Wanasundara and Shahidi, 1999).
47
Figure 2.13: Formation of urea crystals in the absence and presence of long chain fatty acids (Shahidi and
Wanasundara, 1998)
2.5.2.2 Low Temperature Crystallisation
The low temperature crystallisation method is one of the techniques used for the separation of
omega 3 PUFA from fish oil. The method depends on the melting point of the fatty acid in a
different organic solvent at low temperature (-50°C to -70°C), such as methanol, ethanol and
hexane. In order to attain the required low temperatures, a heavy refrigeration load is required,
and this is the main shortcoming of this extraction process for large industrial
applications(Lembke, 2013a). It has been reported that use of different organic solvents and
temperatures affects the concentration of PUFA (Yokochi et al., 1990). Therefore, it is necessary
to select carefully the right solvent and temperature in order to achieve the optimum concentration
of ω3-PUFA.
Preparation of ω3-PUFA concentrates from seal blubber oil (SBO) by low-temperature
crystallisation has been reported (Wanasundara, 2001). The SBO in TAG form was subjected to
solvent crystallisation at different temperatures. Figure 2.14 (A) shows the extraction of total ω3-
PUFA following low-temperature crystallisation of SBO using hexane and acetone as solvents. It
was observed that the content of ω3-PUFA in the non-crystalline fraction (the concentrate) was
increased with lowering of the crystallisation temperature. Acetone afforded the highest
concentration of total ω3-PUFA at all of the temperature conditions.

48
Figure 2.14: Enrichment of total ω3-fatty acids of seal blubber oil upon low temperature crystallization. A, triacylglycerol form; B, free fatty acid form (Wanasundara, 2001).
Low-temperature crystallization of SBO, in the free fatty acid form resulted in total ω3-PUFA
content of up to 58.3 and 66.7% at −60 and −70°C temperature using hexane with concentrate
recoveries of 39.0 and 24.8%, respectively as shown in Figure 2.14 (B). However, the content of
total ω3-PUFA in acetone increased up to 56.7 and 46.8%, but the recovery of the concentrate
was 15.9 and 12.9%, respectively (Wanasundara, 2001).
2.5.2.3 Enzymatic Enrichment
Enzymatic enrichment can be used to extract EPA and DHA from fish oil. The process depends
on liberating the FFA from the glycerol backbone using specific enzymes such as lipase B from
Candida antarctica, which can cleave in the sn1 and sn3 positions of the glycerol; alternatively,
they can cleave in the sn2 position specifically, as most fish oils have EPA and DHA in position
sn2 of the triglycerides. Consequently, the FFA can be removed by molecular distillation (MD)
and the remainder is the concentrated EPA and/or DHA fraction. Using enzymatic enrichment
technology, around 50% omega-3 concentrations (EPA + DHA) can be achieved (Lembke, 2013b).
Enzymatic hydrolysis of sardine oil for enrichening omega-3 fatty acid in small scale with
Candida rugosa, Mucor javanicus, and Aspergillus niger were investigated by Okada and

49
Morrissey (2007). It was concluded that Candida rugosa is more effective compared to other
lipases (Okada and Morrissey, 2007).
Mbatia et al. (2010) examined the enzymatic enrichment of omega-3 fatty acid with Nile perch
viscera oil. It has been found that the temperature can affect the reaction rate of lipase and
consequently affect the enrichment. Therefore, the increase in enrichment level is proportional to
the EPA and DHA losses (Mbatia et al., 2010). Chen and Ju (2000) reported that that using
immobilised enzymes is time consuming and in order to PUFA, oxidation at relatively low
temperature reaction, additional time is recommended (Chen and Ju, 2000).
The main factors that affect the production ω-3 fatty acids concentrates via lipase-assisted
hydrolysis are: enzyme concentration, reaction time, temperature and pH. Furthermore, the
temperature of the reaction medium and the reaction time are vital due to the influence on the
oxidative state of the prepared ω-3 concentrates (Sun et al., 2002).
2.5.2.4 Liquid Chromatography
Liquid Chromatography (LC) is a separation technique with high selectivity for the chain length
and degree of unsaturation of the fatty acid. However, isolation of the fatty acid fraction requires
a large amount of organic solvents (mobile phase) in the separation column and these organic
solvents have to be removed from the isolated fatty acid, which makes it a costly process (Lembke,
2013a). The other drawback of LC is that the final product may still have traces of the undesired
organic solvents. Nevertheless, the LC technique has been used for many years to produce very
highly concentrated omega-3 products, mostly in combination with other concentration techniques
like urea precipitation, MD, and low temperature crystallisation (Lembke, 2013a)
2.5.2.5 Molecular Distillation
The basic principle of molecular distillation as shown in Figure 2.15 is the difference of compound
volatility under vacuum to allow operation at lower temperatures. The difference in volatility of
the shorter chain (16- and 18-carbon fatty acids esters) and longer chain (20- and 22-carbon
EPA/DHA ethyl ester) enables the short path distillation process to concentrate EPA and DHA
ethyl esters to levels of over 50% (Breivik et al., 1997). Further concentration of omega-3 over
50% using the same method can be achieved by repeatedly running the oil through the same
process, which costs more energy and exposes the product to a very high temperature,
consequently shortening product stability and shelf life (Breivik et al., 1997).

50
Figure 2.15: Molecular distillation for production of omega 3 ester (Flavourtech, 2009; Atadashi et al., 2013)
2.5.2.6 Supercritical Fluid Extraction
A supercritical fluid state exists when the pressure and temperature are both above the critical
values (i.e. T > Tc and P > Pc), as shown in Figure 2.16. Supercritical fluid extraction uses
supercritical carbon dioxide (“SCCO2”) as the medium of extraction. This is considered a green
solvent because CO2 is non-toxic, non-flammable, inexpensive, and has mild critical conditions
(Tc = 31.1°C and Pc = 73.8 bar) (Rubio-Rodríguez et al., 2010); all this allows for the processing
of thermo-labile compounds such as omega-3 PUFAs. CO2 is easily separated from the product
after processing because it is gaseous at ambient conditions (Rubio-Rodríguez et al., 2010).

51
Figure 2.16: Pressure-temperature phase diagram for CO2 (Grandison and Lewis, 1996; King, 2003)
The principle of the SFE technology is the different solubility of the fatty acid ethyl ester in the
SCCO2. The solubility of short chain FAEEs is greater than the solubility of long chain ones, while
the solubility dependence on the number of unsaturated chemical bonds is almost negligible (Fiori
et al., 2014). Figure 2.17 shows a flow scheme of the SFF process. The SFF operates in a high
pressure extraction column, where the fatty acid ethyl ester mixture flows counter-current to the
supercritical carbon dioxide. The liquid FAEE mixture flows downwards and the SCCO2 flows
upwards. The short chain FAEEs are solubilised into SCCO2 and, consequently, the liquid FAEE
mixture is enriched in long chain FAEEs, which include the EPA and DHA concentrate (Fiori et
al., 2014).

52
Figure 2.17: Flow scheme of the SFF process (Fiori et al., 2014)Streams: F=FAEE feed, M=CO2 make up, S=CO2 to column, E=extract, E1=extract CO2 free, L0=reflux, R= raffinate, R1=raffinate CO2 free. Equipment: COL=fractionation column, SP=separator, HE=heat exchanger, CV=control valve
2.5.2.7 Supercritical Fluid Chromatography
The SFC technique operates at temperatures in the range of 40–50°C, and these low temperatures
prevent thermal stress on EPA and DHA, which are highly temperature sensitive (Lembke, 2013a).
This makes the SFC one of the most appropriate technologies for the concentration of
polyunsaturated fatty acids. The low temperature and efficient performance of the SFC is due to
the high selectivity of both the supercritical fluid and the stationary phase, like packed or capillary
columns (Lembke, 2013a). Omega-3 PUFA from fish oil has been separated at a bench scale, to
achieve an ester mixture with 90% purity of EPA, using silica gel as the stationary phase and
supercritical chromatography with SC-CO2 as the mobile phase (Pettinello et al., 2000). The SFC
process is already installed at the industrial scale, and there are some companies like KD-Pharma
or Solutex which are separating omega-3 to EPA at concentrations of 95% and DHA up to 80%,
using this technology (Rubio-Rodríguez et al., 2010).

53
2.5.2.8 Aqueous Silver Nitrate Extractions
Silver nitrate has been previously reported for concentration of the ethyl ester of PUFAs by
Yazawa et al. (1995). A US patent also shows that silver nitrate solution can be used to extract
omega-3 PUFA from marine oils (Breivik et al., 2015). The extraction process depends on the
interaction of the silver ions (Ag+) with the double bonds of EPA and DHA to produce complexes
that are soluble in the ionic or polar carrying phases (Shanmugam and Donaldson, 2015). The
same extraction principle has been reported by Fagan et al. (2013), in which EPA and DHA was
isolated at more than 88% purity from esterified tuna oil in chromatography-based separations.
Teramoto et al. (1994) examined the effect of temperatures on the extraction of PUFA ethyl ester
using silver nitrate solution, and found that PUFA ethyl ester extraction decreased with the
temperature. The advantage of using silver nitrate extraction is the ability to extract the omega-3
PUFAs at moderate temperatures and pressures, compared to other techniques which need
significant changes in temperature and pressure to extract the omega-3 PUFAs. The other
advantage of this technique is the ability to achieve high product purity. Furthermore, the silver
nitrate in this technique can be recovered since silver nitrate is an expensive material and toxic.
The cost of silver nitrate with ≥99.0% purity is 1,262 US$/kg (Patil et al., 2013). The Occupational
Safety and Health Administration (OSHA) and the Mine Safety and Health Administration
(MSHA) reported the Permissible Exposure Limit (PEL) of the silver compounds to be 0.01
mg/m3 (Drake and Hazelwood, 2005).
The recovery methods for silver nitrate include multi-effect evaporation, electrochemical
oxidation using a copper electrode, and a chemical reaction method using sodium hydroxide and
nitric acid (Shanmugam et al., 2015). The recovered silver nitrate will reduce the material cost
and improve the economic process of this technique (Murphy, 1991; Rawat, 1986).
Over the past decade, micro/mini-fluidic technology has also been incorporated into the solvent
extraction of PUFA ethyl esters, to enhance mass transfer rates, extraction performance, and low
solvent inventory requirements, as compared to other conventional extraction techniques
(Shanmugam and Donaldson, 2015). Generally, PUFA extraction can be carried out using ionic
liquid containing silver salt or silver nitrate solution, with the former having better extraction
performance than the latter (Li et al., 2009a).
Despite its superior extraction performance, AgNO3 in ionic liquid has a number of limitations,
such as difficulties of preparation where it requires inert gas atmospheres and heating at 70°C (Li
et al., 2009a).

54
Furthermore, ionic liquid silver salts can decompose in harsh environments, for instance, AgNO3
in ionic liquid is light-sensitive and must be stored under dark conditions (Li et al., 2009a). Table
2.1 summarises the existing processes for the silver ion-based extraction of omega-3 PUFAs in
terms of flow pattern, residence time and extraction efficiency.
Table 2.1: Several processes for the silver ion-based extraction of omega-3 PUFAs
System
Flow pattern
Residence time
Extraction efficiency
Reference
Ionic Liquids
based AgBF4 in Mistral Multi-Mixer
Mixing
30 mins at 20°C
80% in solvents
Min Li et al. 2008
Imidazolium-based
ionic liquids containing silver tetra fluoroborate
Mixing
25 mins at 20°C
Distribution
ratio-320
Min Li et al. 2009
Silver ion-loaded porous
hollow fibre membrane
Flow through
packed column
-
100%
recovery
Akio Shibasaki et al. 1999
Π Complexing
sorbents
Solid phase extraction in Mistral Multi
Mixer
30 mins at 20°C
89-91%
Stripping in Solvents
Min Li et al. 2009
Aqueous silver nitrate
solutions
Micro reactor
slug flow
20 s
N/A
Eiji Kamio et al., 2009
Silver nitrate
solution
Hydrophobic Hollow fiber membrane
N/A, 303K
N/A
Kubota et al ,1997
Silver nitrate
solution
Slug flow based
Mini-fluidic
36 s at 10°C
80%
A.Donaldson ,2013

55
Squalene Extraction Process Squalene is an organic compound with the formula C30 H50. It is mainly obtained from shark liver
oil and can also be found in some vegetable oils (Kim and Karadeniz, 2012). Although numerous
efforts have been made to produce squalene from plant sources such as olive oil, wheat germ and
rice bran, the squalene contents of these materials have been too low for commercial purposes
(Nakazawa et al., 2012). The Japanese researcher Dr. Mitasumaru Tsujimoto discovered squalene
in 1906 while working at the Tokyo Industrial Testing Station as an oil and fat expert. He extracted
the unsaponifiable fraction from the shark liver oil and discovered the presence of squalene, a
highly unsaturated hydrocarbon (Popa et al., 2015a). In 1916, Mitasumaru successfully obtained
unsaturated hydrocarbon C30H50 from two deep-sea shark species. He named it squalene in
reference to the shark family name Squalidae (Tsujimoto, 1916). In the following years, many
researchers confirmed the chemical formula proposed by Mitasumaru with the chemical structure
as shown in
Figure 2.18 and chemical and physical properties as in Table 2.2 (Popa et al., 2015a).
Figure 2.18: Squalene chemical structure (Popa et al., 2015a)
Table 2.2: Chemical and physical properties of squalene (Popa et al., 2015a) Properties Value
Molecular weight 410.7 g/mol
Melting point −75 °C
Viscosity at 25∘C 12 cP
Density 0.858 g/mL
Boiling point at 25∘C 285 °C
Flash point 110 °C
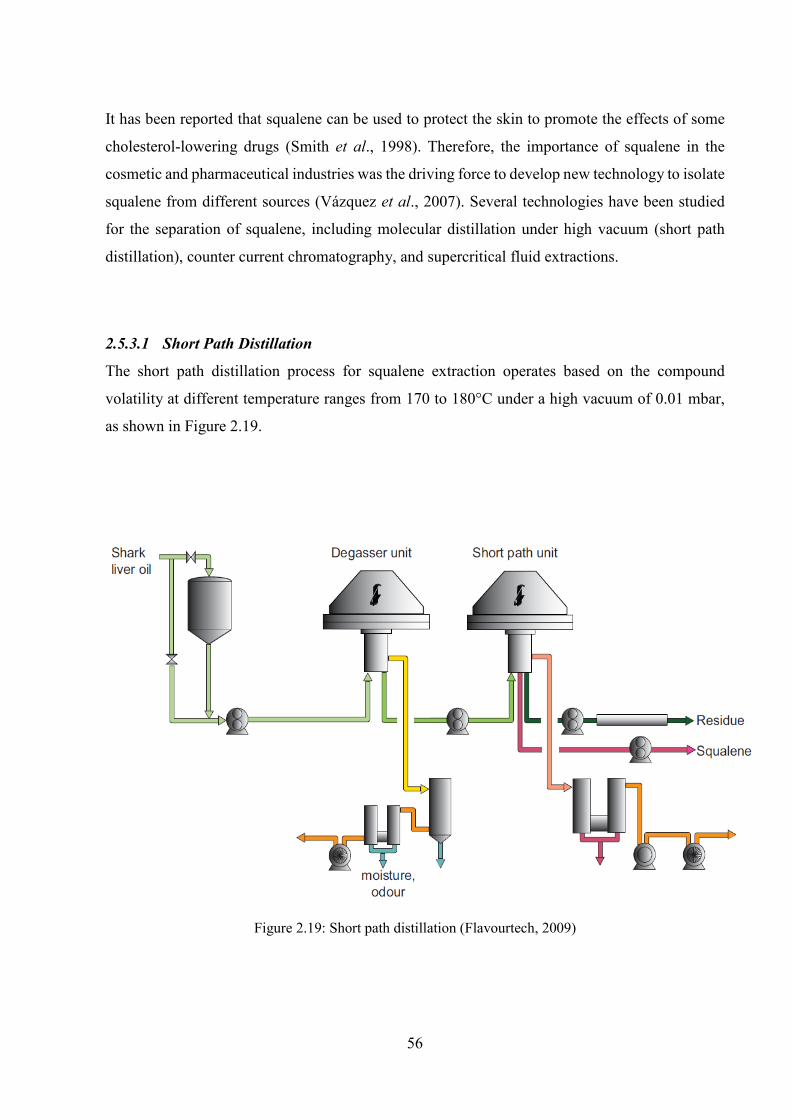
56
It has been reported that squalene can be used to protect the skin to promote the effects of some
cholesterol-lowering drugs (Smith et al., 1998). Therefore, the importance of squalene in the
cosmetic and pharmaceutical industries was the driving force to develop new technology to isolate
squalene from different sources (Vázquez et al., 2007). Several technologies have been studied
for the separation of squalene, including molecular distillation under high vacuum (short path
distillation), counter current chromatography, and supercritical fluid extractions.
2.5.3.1 Short Path Distillation
The short path distillation process for squalene extraction operates based on the compound
volatility at different temperature ranges from 170 to 180°C under a high vacuum of 0.01 mbar,
as shown in Figure 2.19.
Figure 2.19: Short path distillation (Flavourtech, 2009)
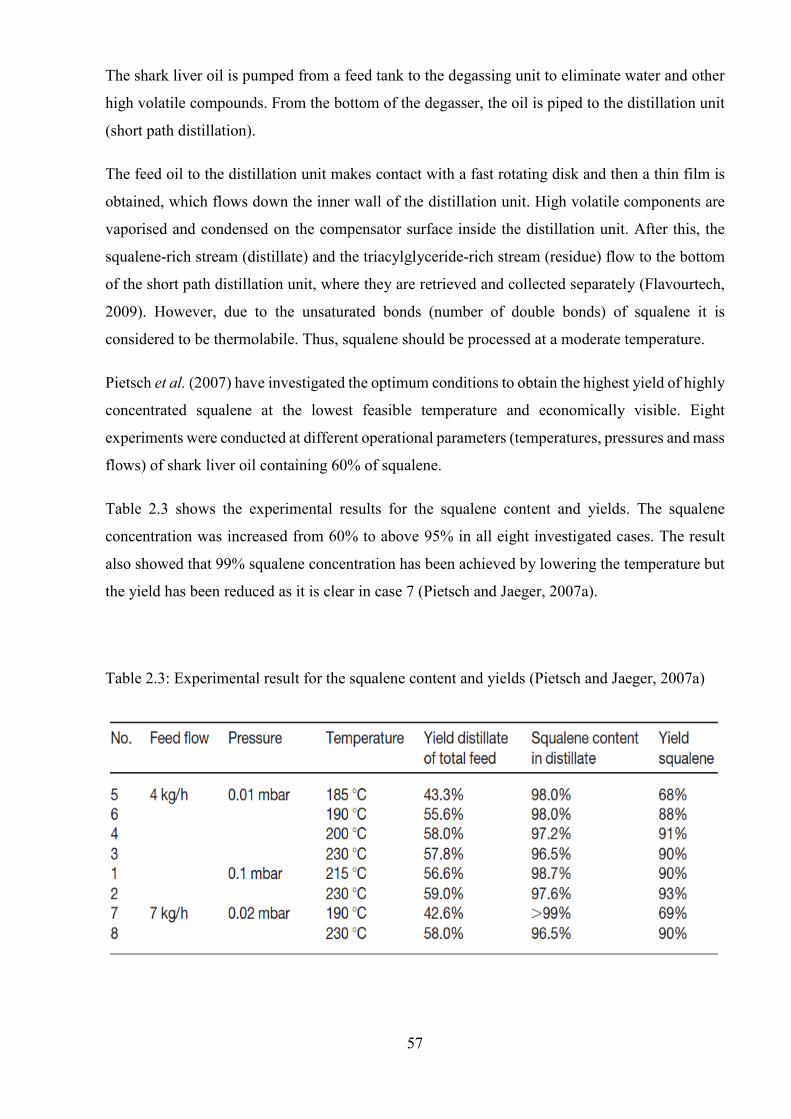
57
The shark liver oil is pumped from a feed tank to the degassing unit to eliminate water and other
high volatile compounds. From the bottom of the degasser, the oil is piped to the distillation unit
(short path distillation).
The feed oil to the distillation unit makes contact with a fast rotating disk and then a thin film is
obtained, which flows down the inner wall of the distillation unit. High volatile components are
vaporised and condensed on the compensator surface inside the distillation unit. After this, the
squalene-rich stream (distillate) and the triacylglyceride-rich stream (residue) flow to the bottom
of the short path distillation unit, where they are retrieved and collected separately (Flavourtech,
2009). However, due to the unsaturated bonds (number of double bonds) of squalene it is
considered to be thermolabile. Thus, squalene should be processed at a moderate temperature.
Pietsch et al. (2007) have investigated the optimum conditions to obtain the highest yield of highly
concentrated squalene at the lowest feasible temperature and economically visible. Eight
experiments were conducted at different operational parameters (temperatures, pressures and mass
flows) of shark liver oil containing 60% of squalene.
Table 2.3 shows the experimental results for the squalene content and yields. The squalene
concentration was increased from 60% to above 95% in all eight investigated cases. The result
also showed that 99% squalene concentration has been achieved by lowering the temperature but
the yield has been reduced as it is clear in case 7 (Pietsch and Jaeger, 2007a).
Table 2.3: Experimental result for the squalene content and yields (Pietsch and Jaeger, 2007a)
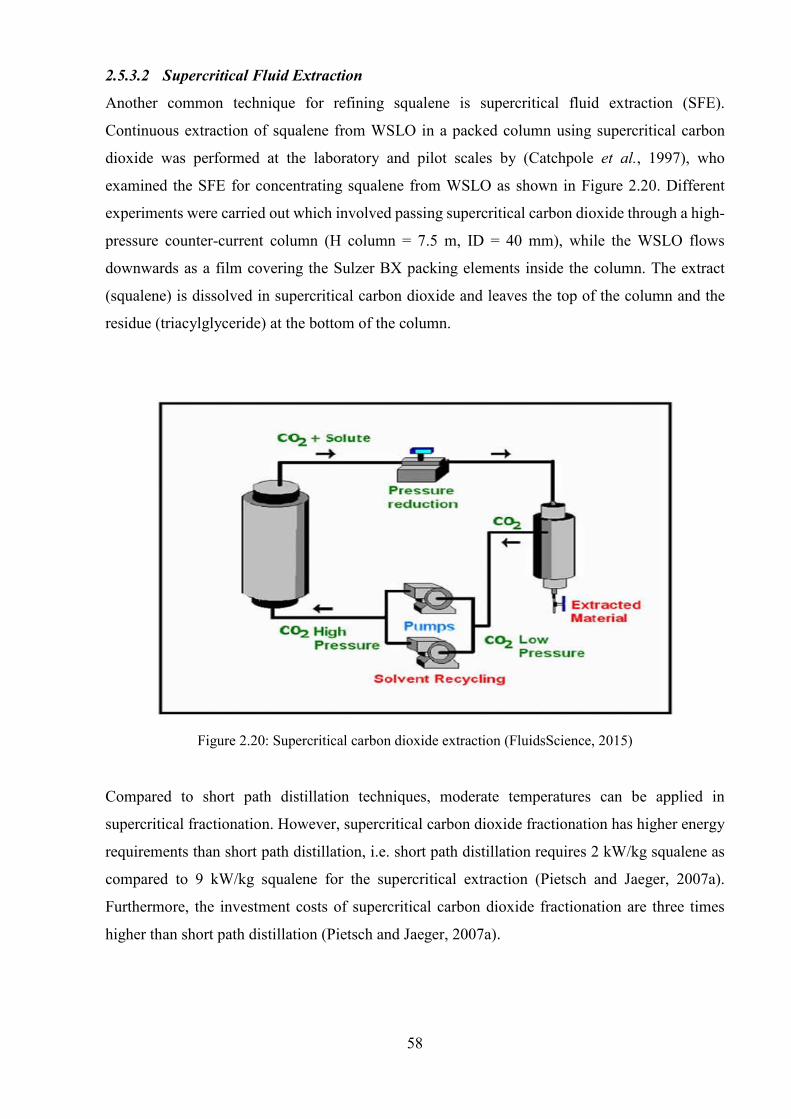
58
2.5.3.2 Supercritical Fluid Extraction
Another common technique for refining squalene is supercritical fluid extraction (SFE).
Continuous extraction of squalene from WSLO in a packed column using supercritical carbon
dioxide was performed at the laboratory and pilot scales by (Catchpole et al., 1997), who
examined the SFE for concentrating squalene from WSLO as shown in Figure 2.20. Different
experiments were carried out which involved passing supercritical carbon dioxide through a high-
pressure counter-current column (H column = 7.5 m, ID = 40 mm), while the WSLO flows
downwards as a film covering the Sulzer BX packing elements inside the column. The extract
(squalene) is dissolved in supercritical carbon dioxide and leaves the top of the column and the
residue (triacylglyceride) at the bottom of the column.
Figure 2.20: Supercritical carbon dioxide extraction (FluidsScience, 2015)
Compared to short path distillation techniques, moderate temperatures can be applied in
supercritical fractionation. However, supercritical carbon dioxide fractionation has higher energy
requirements than short path distillation, i.e. short path distillation requires 2 kW/kg squalene as
compared to 9 kW/kg squalene for the supercritical extraction (Pietsch and Jaeger, 2007a).
Furthermore, the investment costs of supercritical carbon dioxide fractionation are three times
higher than short path distillation (Pietsch and Jaeger, 2007a).

59
2.5.3.3 Counter-Current Chromatography
Counter-current chromatography (CCC) is a technique for separating many natural compounds
using a support free liquid stationary phase or “solid phase” (Berthod et al., 2009). The main
principle of CCC is to split a sample into two immiscible liquid phases prepared by mixing two
or more solvents, where one of the liquid phases is used as the stationary phase and the other is
pumped through the column as the mobile phase. This allows the components to be separated,
based on their solubilities, into the two phases (Berthod et al., 2009). Purification of squalene from
micro algae was successfully performed using counter-current chromatography (Lu et al., 2003).
There are several advantages of the CCC technique in comparison to the classical liquid
chromatography. These are that solvent usage is far lower than in solid phase chromatography
systems (Graham et al., 2001), and that sample components can be completely recovered, as the
CCC technique is a solid free phase. This means that there is no possibility of component losses
from irreversible adsorption onto the solid matrix, as is the case with liquid
chromatography (Skalicka-Woźniak and Garrard, 2014).
The drawbacks associated with the CCC technique are that it is time consuming to employ solvent
selection systems as both phases are liquid, and any change in one phase directly affects the other.
Although the analysis of solvent selection systems can be achieved by an automated liquid-
handling, it still requires several hours to complete (Skalicka-Woźniak and Garrard, 2014).
Another drawback is that a single CCC run operates over a low polarity range in comparison with
the high polarity range in the liquid chromatography. The low polarity range is useful to remove
a compound from a complex mixture, but it is a disadvantage when many pure compounds are
required from the mixture in a single purification run (Skalicka-Woźniak and Garrard, 2014).
Summary Using a cheap non-edible feedstock, such as waste shark liver oil, could reduce production costs
and make the process economically viable. Waste shark liver oil could instead be processed to
obtain valuable products such as: biodiesel, squalene, and omega-3 PUFAs– including EPA and
DHA.
Squalene C30 H50 can be separated from WSLO using several technologies, such as molecular
distillation (short path distillation), counter current chromatography, and supercritical fluid
extractions. The other added-value product that can be obtained from WSLO is omega-3 oils (EPA
and DHA). Various techniques have been investigated or used for the extraction of EPA and DHA
60
from WSLO, such as: molecular distillation, high-performance liquid chromatography,
supercritical fluid extraction, supercritical fluid chromatography, enzymatic enrichment,
crystallisation at low temperatures, silver nitrate extraction, and urea precipitation. Table 2.4
compares various EPA and DHA extraction techniques, and the silver nitrate extraction technique
is recommended in this work due to the following advantages:
(i) The ability to extract omega-3 PUFAs at moderate temperatures and pressures, compared
to other techniques, which require high temperatures and pressures to reach the
supercritical conditions which would incur higher operating and capital costs.
(ii) It has a high extraction efficiency of 88-91%, after liquid chromatography and supercritical
fluid extraction, which both have up to 99% extraction efficiency. However, the silver
nitrate extraction technique has a lower capital investment cost in comparison to liquid
chromatography and supercritical fluid extraction.
(iii) Silver nitrate can be recycled, which will reduce the materials costs and improve the
overall process economics.
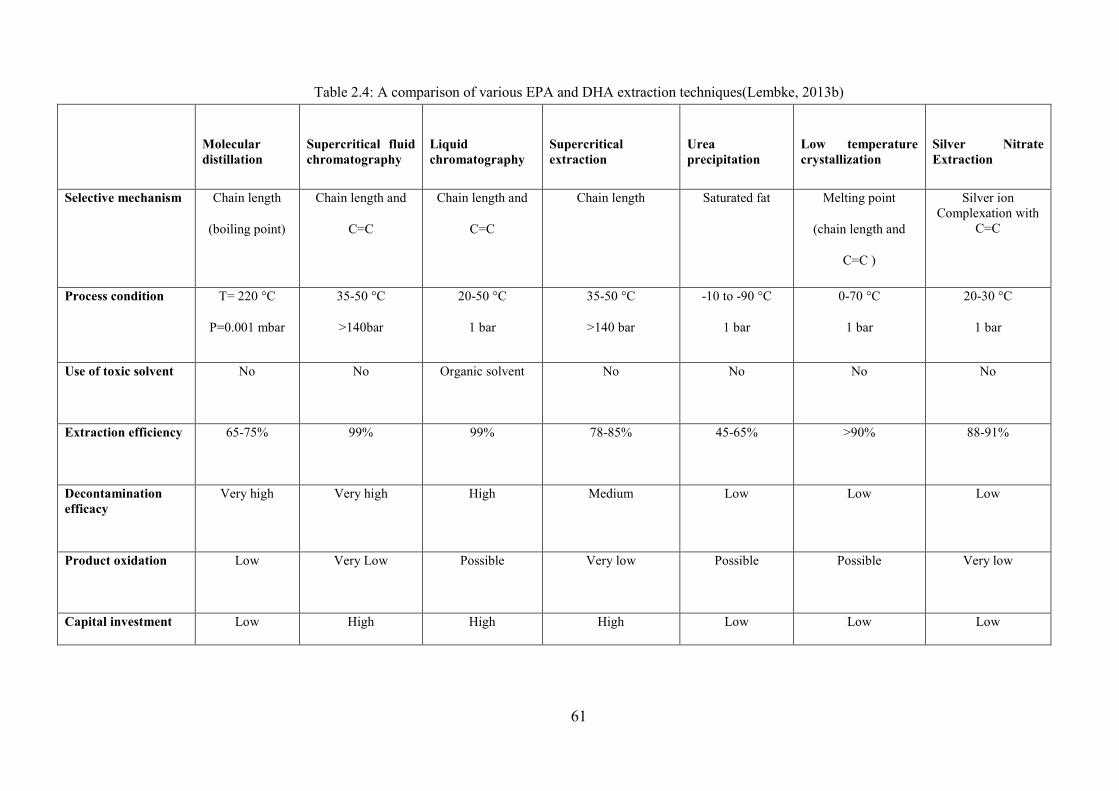
61
Table 2.4: A comparison of various EPA and DHA extraction techniques(Lembke, 2013b)
Molecular distillation
Supercritical fluid chromatography
Liquid chromatography
Supercritical extraction
Urea precipitation
Low temperature crystallization
Silver Nitrate Extraction
Selective mechanism Chain length
(boiling point)
Chain length and
C=C
Chain length and
C=C
Chain length Saturated fat Melting point
(chain length and
C=C )
Silver ion Complexation with
C=C
Process condition T= 220 °C
P=0.001 mbar
35-50 °C
>140bar
20-50 °C
1 bar
35-50 °C
>140 bar
-10 to -90 °C
1 bar
0-70 °C
1 bar
20-30 °C
1 bar
Use of toxic solvent No No Organic solvent No No No No
Extraction efficiency 65-75% 99% 99% 78-85% 45-65% >90% 88-91%
Decontamination efficacy
Very high Very high High Medium Low Low Low
Product oxidation Low Very Low Possible Very low Possible Possible Very low
Capital investment Low High High High Low Low Low

62
Materials and Methods
Introduction This chapter describes the project’s materials and methods. The feedstock used was waste shark
liver oil (WSLO), which was characterised by measuring its density, water content and chemical
composition.
The transesterification of WSLO was investigated using alkali and acid catalysts. Saponification
of the WSLO was also investigated for extracting squalene from it, while aqueous silver nitrate
(AgNO3) was employed for extracting eicosapentaenoic acid (EPA) and docosahexaenoic acid
(DHA) from fatty acid ethyl esters produced by the WSLO.
Materials The feedstock used for this study was WSLO obtained from the Carcharhinidae family. The oil
was sourced from Sur, Sultanate of Oman, which is one of the largest collection centres for WSLO
in Oman. Sulfuric acid (H2SO4, 98% purity, Sigma-Aldrich, UK) was used as an acid catalyst and
granulated sodium hydroxide (NaOH, 97% purity, Sigma-Aldrich, UK) as an alkali catalyst. The
alcohols used were anhydrous methanol (99.8% purity, Sigma-Aldrich, UK) and anhydrous
ethanol (96% purity, Alfa Aesar, UK). Methyl heptadecanoate (99% purity, Sigma-Aldrich, UK)
was used as an internal standard for gas chromatography (GC) analysis of the FAME produced.
Acetic acid (99.5% purity, Sigma-Aldrich, UK) and powdered calcium oxide anhydrous (99.9%
purity, Sigma-Aldrich, UK) were used for quenching the reactions.
A standard grain FAME Mix—10 mg/mL in dichloromethane, part number: CRM47801, from
Sigma-Aldrich, UK—was used for identifying the FAME peaks in the chromatogram. Hexane
(98% purity, Alfa Aesar, UK) was used as a solvent for EPA and DHA extractions. Silver nitrate
(AgNO3, 99% purity, Sigma-Aldrich, UK) was used to prepare the silver nitrate solution for EPA
and DHA extraction.

63
Experimental Methods
Determinations of the Density of the Waste Shark Liver Oil The WSLO density was determined using the following steps. The oil was heated to 30°C and
transferred into a dry, 25 mL volumetric flask of known weight. The weight of the oil was recorded
using an AND HR-200 weighing balance (± 1mg), and the density of the WSLO was calculated
using Equation 1.1. The density is calculated to obtain the amount of alcohol (molar ratio of
alcohol to WSLO) needed for the transesterification of WSLO.
Density of WSLO (ρ)= Weight of the WSLO (g)Volume of flask (mL) (1.1)
Water Content by Karl Fischer Titration Karl Fischer Titration is an analytical technique for determining the amount of water in organic
substances. The water content analysis was performed using a C30 Karl Fischer Titrator with
HYDRANAL™ - Coulomat AG as a titration reagent as shown in Figure 3.1 (Mettler Toledo,
UK). The titration reagent was titrated until a steady background endpoint of 20 μl/min was
achieved, followed by additions of 0.2 g of the WSLO sample using a 1mL syringe. The added
samples were then titrated until a stable endpoint was achieved to obtain the WSLO water content.
Figure 3.1: C30 Karl Fischer Titrator (Mettler Toledo, UK)
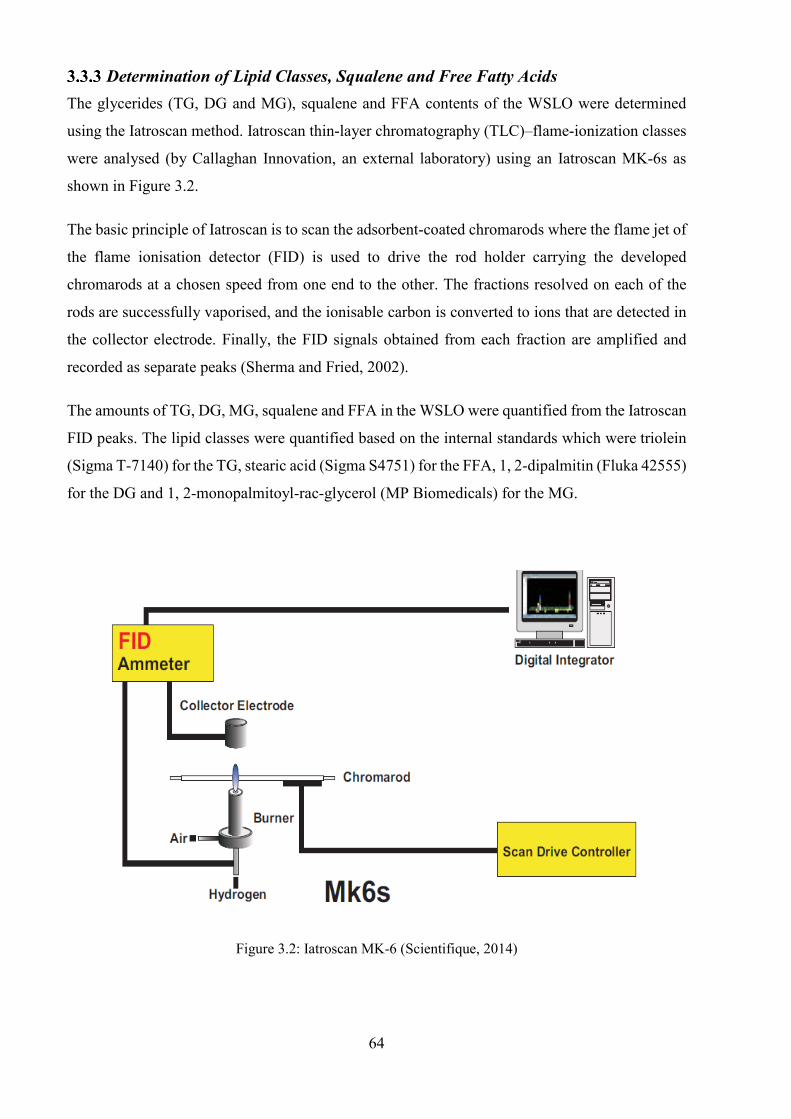
64
Determination of Lipid Classes, Squalene and Free Fatty Acids The glycerides (TG, DG and MG), squalene and FFA contents of the WSLO were determined
using the Iatroscan method. Iatroscan thin-layer chromatography (TLC)–flame-ionization classes
were analysed (by Callaghan Innovation, an external laboratory) using an Iatroscan MK-6s as
shown in Figure 3.2.
The basic principle of Iatroscan is to scan the adsorbent-coated chromarods where the flame jet of
the flame ionisation detector (FID) is used to drive the rod holder carrying the developed
chromarods at a chosen speed from one end to the other. The fractions resolved on each of the
rods are successfully vaporised, and the ionisable carbon is converted to ions that are detected in
the collector electrode. Finally, the FID signals obtained from each fraction are amplified and
recorded as separate peaks (Sherma and Fried, 2002).
The amounts of TG, DG, MG, squalene and FFA in the WSLO were quantified from the Iatroscan
FID peaks. The lipid classes were quantified based on the internal standards which were triolein
(Sigma T-7140) for the TG, stearic acid (Sigma S4751) for the FFA, 1, 2-dipalmitin (Fluka 42555)
for the DG and 1, 2-monopalmitoyl-rac-glycerol (MP Biomedicals) for the MG.
Figure 3.2: Iatroscan MK-6 (Scientifique, 2014)

65
Alkali-Catalysed Transesterification Homogeneous alkali-catalysed transesterification of the characterised WSLO using methanol was
conducted in a 250 mL, three-neck batch reactor equipped with a condenser, a sampling point
connection and a thermocouple to measure the temperature. The round-bottomed reactor was
seated on a metal block attached to a heater-stirrer (Stuart UC152, UK), which did both the heating
and the mixing. Prior to the reactions, 1.5 wt.% NaOH, based on the WSLO, was dissolved in
methanol and heated to the reaction temperature in a separate vessel. The methanol-catalyst
solution was transferred into the batch reactor that contains WSLO, which had already been heated
to the reaction temperature inside the batch reactor.
These reactions were carried out at a mixing speed of 720 rpm, a reaction temperature of 60°C
and 6:1 methanol to WSLO molar ratio. The methanol to oil molar ratio of 6:1 is the usually
accepted alcohol-to-glyceride molar ratio (Musa, 2016). It has been reported that soybean
methanolysis using an H2SO4 catalyst has increased the ester formation sharply from 77%, at a
3.3:1 methanol to oil molar ratio, to 87.8%, at a 6:1 methanol to oil molar ratio, with only moderate
improvement to a maximum value of 98.4% ester formation at a 30:1 methanol to oil molar ratio
(Balat and Balat, 2008). During the experiments, 1mL sample was collected from the reaction
mixture at different time intervals (1, 2, 4, 8, 15, 20, 40, 50 and 60 min) using a 1000 μL
micropipette. The samples were dispensed into a 2mL, pre-weighed vial containing 0.05 mL acetic
acid 0.1 M to quench the reaction. All samples were kept in the freezer at -20°C for GC analysis.
The experiments were carried out using a three-neck batch reactor. The reactor was a round-
bottomed glass flask with three necks connected with a condenser, a sampling point and a
thermocouple. The round-bottomed three-neck reactor was attached with a heating block designed
to transfer the heat and magnetic stirring from the hotplate stirrer to attain the heating and mixing
required for the experiment, as shown in Figure 3.3.
Figure 3.3: Experimental set up

66
Acid-Catalysed Transesterification The acid-catalysed transesterification of the WSLO was investigated, using Design of
Experiments (DoE), by a response surface method. DoE is a statistical tool used to evaluate, and
optimise, the relations between variables and system responses. The advantage of DoE lies in
minimising the number of experimental trials required to cover a particular parameter space
(Abdullah et al., 2009).
DoE was not conducted for the alkali-catalysed transesterification of WSLO because the alkali
catalyst was clearly inferior to the acid for this process, based on the screening results. This was
because the alkali catalyst is not appropriate for high-FFA feedstocks, as it reacts with the FFA
forming soap and water “saponification” (Pullen and Saeed, 2015).
The reaction variables studied for the acid catalysis were reaction time in the range of 1 to 7 h,
H2SO4 catalyst loading from 1 to 6 wt.% and methanol to oil molar ratios from 6:1 to 30:1. The
experiments were carried out using the batch reactor setup described earlier for the homogeneous
alkali-catalysed process and a similar experimental procedure, with a reaction temperature of 60°C
and a mixing speed of 720 rpm. The amount of H2SO4 catalyst calculated for each experiment was
dissolved in the matching required amount of methanol and heated to the reaction temperature in
a separate vessel, and this solution was transferred into the batch reactor containing each
experiment’s desired amount of WSLO already heated to the reaction temperature. For every
experiment, 1mL of the sample was collected from the reaction mixture at different time intervals
(15, 30 min; 1, 1.5, 2, 3, 4, 5, 6 h) using a 1000 μL micropipette, and the sample was transferred
to a 2mL, pre-weighed vial, where the reaction was quenched using a saturated solution of calcium
oxide. All the collected samples for the experiments were kept in the freezer at -20°C for GC
analysis.
Squalene Extraction by Saponification The amount of squalene present in WSLO varied widely depending on the species (Hall et al.,
2016). In this research, saponification for extracting squalene was investigated. The principle
applied in this extraction technique was to extract the un-saponifiable squalene from the
saponifible WSLO. Fatty acids can react with alkali catalsyt such as NaOH and turn into many
polar carboxylic salts (soap), which are insoluble in solvents such as hexane and accordingly the
un-saponifiable squalene can be extracted from the saponifible WSLO .
DoE was conducted for the squalene extraction to obtain the operating conditons for the highest
squalene extraction. The DoE was conducted over the following parameter space: (i) alcohol to
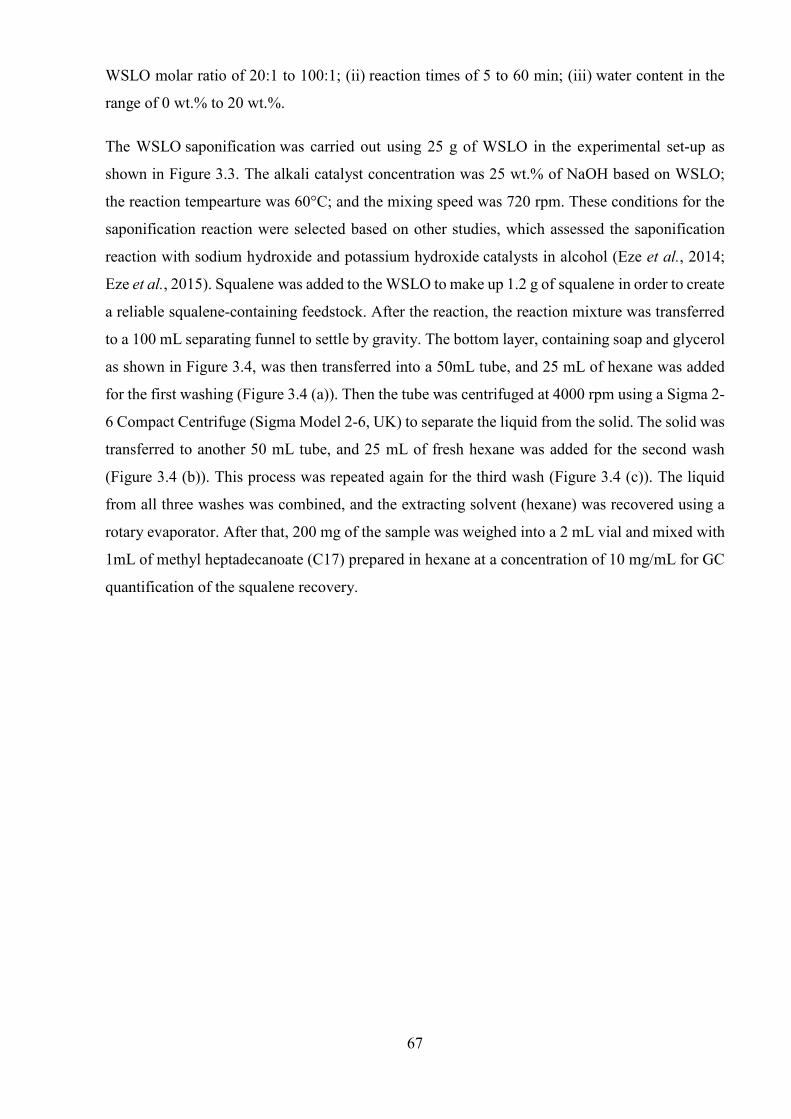
67
WSLO molar ratio of 20:1 to 100:1; (ii) reaction times of 5 to 60 min; (iii) water content in the
range of 0 wt.% to 20 wt.%.
The WSLO saponification was carried out using 25 g of WSLO in the experimental set-up as
shown in Figure 3.3. The alkali catalyst concentration was 25 wt.% of NaOH based on WSLO;
the reaction tempearture was 60°C; and the mixing speed was 720 rpm. These conditions for the
saponification reaction were selected based on other studies, which assessed the saponification
reaction with sodium hydroxide and potassium hydroxide catalysts in alcohol (Eze et al., 2014;
Eze et al., 2015). Squalene was added to the WSLO to make up 1.2 g of squalene in order to create
a reliable squalene-containing feedstock. After the reaction, the reaction mixture was transferred
to a 100 mL separating funnel to settle by gravity. The bottom layer, containing soap and glycerol
as shown in Figure 3.4, was then transferred into a 50mL tube, and 25 mL of hexane was added
for the first washing (Figure 3.4 (a)). Then the tube was centrifuged at 4000 rpm using a Sigma 2-
6 Compact Centrifuge (Sigma Model 2-6, UK) to separate the liquid from the solid. The solid was
transferred to another 50 mL tube, and 25 mL of fresh hexane was added for the second wash
(Figure 3.4 (b)). This process was repeated again for the third wash (Figure 3.4 (c)). The liquid
from all three washes was combined, and the extracting solvent (hexane) was recovered using a
rotary evaporator. After that, 200 mg of the sample was weighed into a 2 mL vial and mixed with
1mL of methyl heptadecanoate (C17) prepared in hexane at a concentration of 10 mg/mL for GC
quantification of the squalene recovery.

68
Figure 3.4: WSLO saponification
EPA and DHA Extraction Using Aqueous Silver Nitrate Solvent extraction has been widely used for separating fatty acid ethyl esters (FAEE) based on the
complexation between the double bonds of PUFA ethyl ester and silver ions (Shanmugam and
Donaldson, 2015). This separation was achieved through a chemical reaction between the silver
nitrate ions and the five to six unsaturation sites of Omega-3/6 PUFA. Silver nitrate salt-solutions
have previously been used as solvents for the purification of the ethyl ester of PUFA ethyl ester.
(Yazawa et al., 1995). In this process, silver ions interact with the double bonds in unsaturated
fatty acids to produce complexes that are soluble in ionic/polar carrying phases, as shown in Figure
3.5.
(a) After the experiment (b) Washing1 and 2 (c) Washing 3

69
Figure 3.5: General overview of EPA and DHA extraction (Shanmugam and Donaldson, 2015)
Extraction was carried out by mixing aqueous silver nitrate with the FAEE produced from the
WSLO in a ratio of 3:1 silver nitrate to FAEE. The mixing was performed using an IKA incubator,
model KS 4000i, at a mixing speed of 300 rpm and a temperature of 20°C. The silver nitrate
solution was prepared by adding solid silver nitrate to DI water at different concentrations (15, 30
and 50 wt.%) to obtain the concentration profile (Shanmugam and Donaldson, 2015). The reaction
times were varied at (0.5, 1, 2 and 4 h) to screen the highest extraction of EPA and DHA. The
selected ranges of reaction times were based on studies conducted for the extraction of EPA and
DHA from tuna methyl esters using aqueous silver nitrate (Huong, 2007). The catalyst
concentrations ranges were based on studies elsewhere including (Shanmugam and Donaldson,
2015).
The overall EPA and DHA recovery process is summarised in Figure 3.6. After mixing in the
incubator, the reaction mixture was transferred to a separating funnel to separate the residual oil
layer, as shown in Figure 3.7 (a). Subsequently, 10mL of hexane was added to the
aqueous/emulsion layer obtained after gravity separation to de-emulsify the oil droplets. The
resulting organic layer was recovered via gravity separation. This is the ‘de-emulsification’ step,
and the recovered organic layer is referred to as ‘Fraction 1’ (F1), as illustrated in Figure 3.7 (b).
Deionised water was added to the remaining aqueous solution from the de-emulsification step at
a volume ratio of 10:1, which caused the complexed omega-3 to de-complex. This was followed
by the addition of 10 mL of hexane and recovery of the organic layer via gravity separation. This
is the ‘de-complexation’ step, and the recovered layer is referred to as ‘Fraction 2’ (F2). This step
is shown in Figure 3.7 (c). Samples from F1 and F2 were weighed into 2 mL vials, to which was

70
added 1 mL of C17—the internal standard for GC analysis—to determine the percentage of EPA
and DHA recovery.
Figure 3.6: process for recovery of EPA and DHA from aqueous and emulsion phases
Figure 3.7: Experimental steps for the EPA and DHA extractions. Arrow in Figure 3.7 (a) refers to the residual oil layer, arrow in Figure 3.7 (b) refers to the de-emulsification layer and the arrow in Figure
3.7(c) refers to the de-complexation layer.
(a) Residual oil (b) De-emulsification (c) De-complexation

71
Analysis of FAME, EPA, DHA and Squalene Contents Using Gas Chromatography
Gas chromatography, as shown in Figure 3.8, is a technique used to analyse/separate mixtures of
gases or liquid. FAME contents in the samples collected from the transesterification reaction were
analysed using a Hewlett Packard 6890 Series II Gas Chromatograph (Hewlett Packard, USA),
equipped with a fused silica (15QC3/BPX5-0.25, SGE Analytics, UK) capillary column 0.25μm
in film thickness, 15m in length and 0.32mm in diameter.
Figure 3.8: Gas chromatography (Chaintreau, 2007)
50mg of each sample was carefully weighed in a 2 mL vial using an A&D HR-200 weighing
balance (±1 mg). Then 1mL additions of a solution of 10 mg/mL methyl heptadecanoate prepared
in heptane were added to the samples. 0.5µL of the prepared sample solution was injected into
the GC using a 5 µL micro-syringe (SGE Analytics, UK). The GC analysis was programmed,
beginning with an initial oven temperature of 120˚C (held for 5 min.). This temperature was
increased to 210˚C, at a rate of 30˚C/min, and held for 17min (total run time of 25 min). The GC
injector and FID temperatures were set at 250˚C and 260˚C, respectively, while the carrier gas
used was helium at pressure of 10.0 psi.

72
FAME contents and yields for the samples were calculated using the procedure of BS EN 14103,
as shown in Equations 1.2 and 1.3.
FAME content in the sample (%)= ∑ AAi
* Ci*Vim
*100% (1.2)
Where ∑ A is the sum total of the all the peak areas of all the FAMEs in the sample from the GC
chromatogram.
Ai = Peak area of methylheptadecanoate.
Ci = concentration, in mL, of the methylheptadecanoate solution.
Vi = volume, in mL, of the methylheptadecanoate solution.
m = mass, in mg, of the sample.
FAME yield (%)= FAME content in the sample Maximum theoretical FAME
*100% (1.3)
Squalene recovery was quantified using GC. A 200 mg sample was obtained after combining all
three washes from the saponification reaction and after removing the hexane by rotary evaporator.
The 200 mg sample was weighed into a 2 mL vial using an A&D HR-200 weighing balance
(±1mg), and the sample was then mixed with 1mL of methyl heptadecanoate (C17) prepared in
hexane at a concentration of 10 mg/mL. 0.5 µL of the prepared sample, solution was injected into
the GC using a 5µL micro-syringe (SGE Analytics, UK). The GC analysis was programmed,
beginning with an initial oven temperature of 120˚C (held for 5 min.). As before, this temperature
was increased to 210˚C, at a rate of 30˚C/min, and held for 17 min (total run time of 25 min). The
GC injector and FID temperatures were again set at 250˚C and 260˚C, respectively, while the
carrier gas used was helium at a pressure of 10.0 psi. Squalene content in the samples was
calculated using Equation 1.4, based upon the line equation, y = 0.8827x + 0.0225, from the
calibration curve shown in Figure 3.9. The squalene recovery was calculated using Equation 1.5,
where the total mass of squalene in the experiment was obtained using the volume and density
after the reaction.

73
Figure 3.9: Squalene calibration curve
Squalene Content (%)= As
Ai* Ci*Vi
m* 1
Slop*100 (1.4)
Where: As is the peak area of squalene in the sample
Ai= Peak area of methylheptadecanoate
Ci= concentration, in mL, of the methylheptadecanoate solution
Vi= volume, in mL, of the methylheptadecanoate solution
m= mass, in mg, of the sample
Squalene Recovery (%)= total mass of squalene after the reaction total mass of squalene before reaction
*100 (1.5)
y = 0.8827x + 0.0225R² = 0.9815
0
0.2
0.4
0.6
0.8
1
1.2
0 0.2 0.4 0.6 0.8 1 1.2 1.4
As/A
i
Squalene mass g /C17 mass g
Squalene Calibration
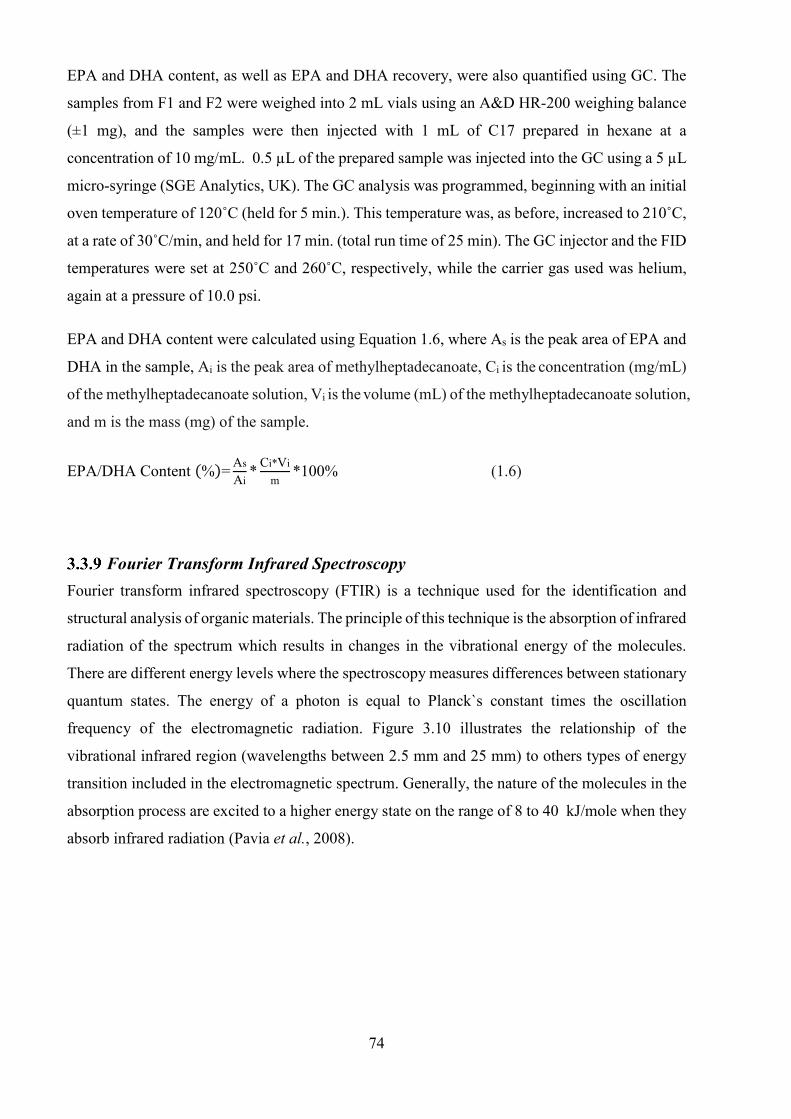
74
EPA and DHA content, as well as EPA and DHA recovery, were also quantified using GC. The
samples from F1 and F2 were weighed into 2 mL vials using an A&D HR-200 weighing balance
(±1 mg), and the samples were then injected with 1 mL of C17 prepared in hexane at a
concentration of 10 mg/mL. 0.5 µL of the prepared sample was injected into the GC using a 5 µL
micro-syringe (SGE Analytics, UK). The GC analysis was programmed, beginning with an initial
oven temperature of 120˚C (held for 5 min.). This temperature was, as before, increased to 210˚C,
at a rate of 30˚C/min, and held for 17 min. (total run time of 25 min). The GC injector and the FID
temperatures were set at 250˚C and 260˚C, respectively, while the carrier gas used was helium,
again at a pressure of 10.0 psi.
EPA and DHA content were calculated using Equation 1.6, where As is the peak area of EPA and
DHA in the sample, Ai is the peak area of methylheptadecanoate, Ci is the concentration (mg/mL)
of the methylheptadecanoate solution, Vi is the volume (mL) of the methylheptadecanoate solution,
and m is the mass (mg) of the sample.
EPA/DHA Content (%)= AsAi
* Ci*Vim
*100% (1.6)
Fourier Transform Infrared Spectroscopy Fourier transform infrared spectroscopy (FTIR) is a technique used for the identification and
structural analysis of organic materials. The principle of this technique is the absorption of infrared
radiation of the spectrum which results in changes in the vibrational energy of the molecules.
There are different energy levels where the spectroscopy measures differences between stationary
quantum states. The energy of a photon is equal to Planck`s constant times the oscillation
frequency of the electromagnetic radiation. Figure 3.10 illustrates the relationship of the
vibrational infrared region (wavelengths between 2.5 mm and 25 mm) to others types of energy
transition included in the electromagnetic spectrum. Generally, the nature of the molecules in the
absorption process are excited to a higher energy state on the range of 8 to 40 kJ/mole when they
absorb infrared radiation (Pavia et al., 2008).

75
Figure 3.10: The relationship of the vibrational infrared region to others types of energy transition (Pavia et al., 2008).
The absorbed energy will increase the amplitude of the vibrational motions of the bonds in the
molecule. Every type of bond has a different natural frequency of vibration therefore; infrared
radiation is used for the identification of the molecules. Other use of infrared spectrum is the
structural analysis of the molecules because each type of bond (N-H, C-H, O-H, C=O, C-O, C=C,
etc.) are found in specific vibrational infrared region. For example, any infrared absorption in the
range of 1715 ±100 𝑐𝑐𝑐𝑐−1 is typically due to the existence of a C=O bond (carbonyl group) in the
molecule (Fifield and Kealey, 1995). Figure 3.11 illustrates different type of bond with the infrared
absorption range.

76
Figure 3.11: Different types of bond with the infrared absorption range (Pavia et al., 2008).
Infrared active molecules have different mode of vibrational motion. The typical modes of
vibrational motion in a molecule that absorb infrared radiation are stretching and bending as
shown in Figure 3.12. Stretching vibrations arise at higher frequencies than bending vibrations.
Any group contains three or two atoms where at least two are identical; there are two modes of
stretching vibration: asymmetric stretching vibrations and symmetric stretching vibrations.
Furthermore, various bending vibration are executed and can be observed at characteristic wave
number.
Figure 3.12: Stretching and bending modes (Pavia et al., 2008).

77
Figure 3.13 shows stretching and bending modes of methyl group. In general, symmetric
stretching vibrations occur at higher frequencies than symmetric stretching vibrations. For
instance, the methyl group gives rise to a symmetric stretching vibration at 2872 𝑐𝑐𝑐𝑐−1 and an
asymmetric stretch at 2962 𝑐𝑐𝑐𝑐−1 . The bending vibration terms such as scissoring, rocking,
wagging, and twisting are used to designate the origins of infrared bands as it is clear in Figure
3.13.
Figure 3.13: Stretching and bending vibration of methyl group (Pavia et al., 2008).
A schematic diagram of an FTIR is shown in Figure 3.14 where an interferometer is used to
process the energy sent to the sample where the source energy passes through a beam splitter.
Incoming radiation will pass through a mirror positioned at a 45° angle and then separates it into
two perpendicular beams; one at a 90° angle and the other is undeflected. The 90° angle beam
goes to a stationary mirror and is returned to the beam splitter, whereas the undeflected beam goes

78
to a moving mirror and then returned to the beam splitter. The two beams are recombined when
they meet at the beam splitter. Different wavelength content of the two beams causes both
constructive and destructive interferences. The combined beam containing these interference
patterns is called the interferogram which contains all of the radiative energy coming from the
source and has a wide range of wavelengths oriented toward the sample by the beam splitter. The
wavelength (frequencies) that are found in the infrared spectrum are absorbed by the sample
simultaneously. After that, the modified interferogram signal reaches the detector with the amount
of energy absorbed at every wavelength (frequency). The modified interferogram is compared
with a reference laser beam by a mathematical process called a Fourier transform by the computer.
Then, the individual frequencies are reconstructed and plotted as a typical infrared spectrum.
Infrared spectrum of a compound is obtained by subtracting the spectrum of the background which
contains infrared-active atmospheric gases such as carbon dioxide and water vapour from the
sample spectrum automatically by the computer software.
Figure 3.14: A schematic diagram of an FTIR (Pavia et al., 2008).

79
Nuclear Magnetic Resonance Nuclear magnetic resonance (NMR) is a physical phenomenon used to investigate the molecular
properties of matters by irradiating atomic nuclei in a magnetic field with radio waves. The
principle of NMR is the absorption of electromagnetic radiation in the radio magnetic region of
the spectrum which leads to change in the orientation of the spinning nuclei in the magnetic field.
Not every proton in a molecule has absorption of the electromagnetic radiation at exactly the same
frequency. This is because the protons in a molecule are surrounded (shielded) by electrons that
exist in different electronic (magnetic) environment from one proton to other. After exposing the
protons to a magnetic field, the valence electrons of the protons are caused to circulate and create
a counter magnetic field that opposes the applied magnetic field. This circulation of valence
electrons called diamagnetic shielding or diamagnetic anisotropy at it is shown in Figure 3.15.
Figure 3.15: Diamagnetic shielding or diamagnetic anisotropy (Pavia et al., 2008)
The difference between the amounts of a given proton resonance from the standard reference
substance TMS (tetramethylsilane) is called the chemical shift. The TMS has been chosen as a
reference substance because the methyl groups protons are more shielded than most of other
compounds. Thus, when the resonance of other compound is measured, its proton resonance is
obtained in term of how far is (in Hertz) from those of TMS. The shift from TMS for a given
proton is proportional to the strength of the applied magnetic field. For instance, in an applied
magnetic field of 1.41 Tesla, the resonance of a proton is 60 MHz, whereas if the applied magnetic
field is 2.35 Tesla, the resonance is 100 MHz.

80
The chemical shift unit is reported as ppm (parts per million) because the TMS is used as a
reference substance for other compound protons absorption. Thus, the resonance of the protons in
TMS comes at exactly 0.00 ppm in a typical chemical shift scale on NMR spectrum chart as it is
shown in Figure 3.16.
Figure 3.16: A typical chemical shift scale on NMR spectrum chart (Pavia et al., 2008)
The nuclei spin (I), has different values such as 0, ½, 1, 1 ½. The actual value of nuclei spin
depends on the atomic number and the mass number of the nuclei as it is clear in Table
3.1. Only non-zero spin quantum numbers can produce NMR spectra. When the nucleus has a
charge, spinning about its own axis may produce a magnetic momentum in the axis.
Table 3.1: Atomic number and nuclei spin (Pavia et al., 2008)
Mass number
Atomic number
Nuclei spin(I)
Odd
Even or odd
½ …
Even
Even
0
Even
Odd
1, 2, 3.
The nucleus possesses angular momentum, where for each isotope, the value of magnetic moment
along the axis and the angular momentum determine the frequency at which the energy can be
absorbed. Furthermore, the sensitivity of the technique for a specific nucleus is determined by the
value of its magnetic moment. As shown in Table 3.2, the 1H has the highest sensitivity,

81
whereas 12C and 16O have spin quantum numbers of zero and they are inactive. Therefore, proton
magnetic resonance is very useful in the identification of organic compounds as many organic
compounds consist of only these three atom (Pavia et al., 2008) .
Table 3.2: Nuclei spin quantum and magnetic properties of selected nuclei (Pavia et al., 2008)
Figure 3.11 schematically illustrates the main elements of an NMR spectrometer. First of all, the
sample is dissolved in a solvent, then a small amount of internal reference TMS is added. The
sample cell is a small cylindrical glass suspended in the gap between the faces of the pole pieces
of the magnet. The sample is turned around its axis to ensure uniform magnetic field to all part of
the solution. A coil attached to a 60-MHz radiofrequency (RF) generator in the magnet gap. This
coil in the magnet gap is attached to the 60-MHz radiofrequency (RF) generator in order to supply
the electromagnetic energy used to change the spin orientations of the protons. A detector coil is
positioned perpendicularly to the RF oscillator coil. When there is no absorption of energy taking
place, detector coil will not pick up any of the energy given off by the RF oscillator coil. However,
if the sample absorbs energy, radiofrequency signal is induced by the reorientation of the nuclear
spins. Finally, it is recorded as a peak or resonance signal (Pavia et al., 2008).
Nucleus
Nucleus spin quantum number
Magnetic moment
Resonance frequency
Sensitivity
1H 1/2 14.09 60.000 1.00
12C 0 - - -
13C 1/2 3.53 15.08 1.8 x-410
16O 0 - - -

82
Figure 3.11 a schematic diagram of an NMR (Pavia et al., 2008).
Error Analysis There are three main categories of error. These three types are systematic error (determinate
errors), random error (indeterminate errors) and gross errors. The systematic errors are
instrumental, methodological, which is consistently deviated in one direction from the true value.
Table 3.3 shows the errors for the laboratory equipment used in this project.
Table 3.3: Laboratory equipment used and their errors
Laboratory equipment
Error
Weighing balance A&D HR-200 weighing balance
(±0.05 mg)
Pipette 100-1000 µL
±8 µL @ISO8655
Measuring flask/ cylinder
±0.25 mL
rpm mixing speed
±10 rpm
Hotplate temperature controller
±0.5°C
The second category of error is the random error. Random errors are caused by uncontrollable
fluctuations in variables which result in a change in the experimental results. A multiple number
of measurements result in evenly distributed data scattered around an average value or mean. This
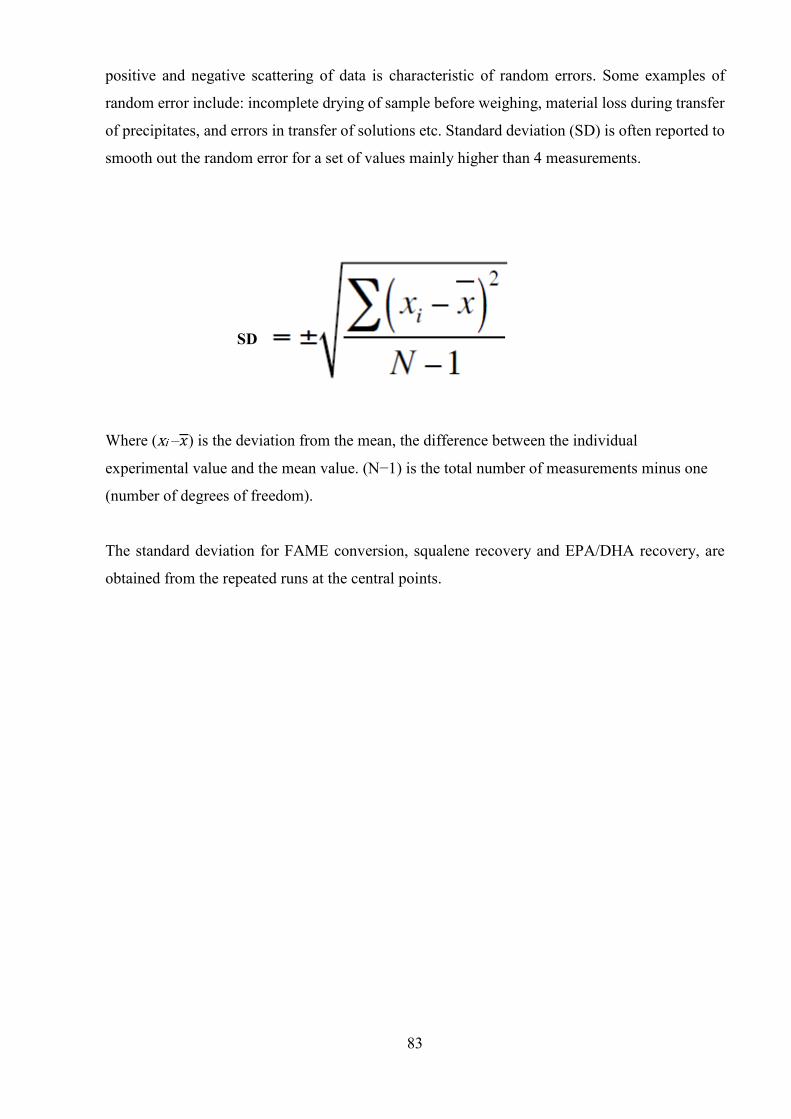
83
positive and negative scattering of data is characteristic of random errors. Some examples of
random error include: incomplete drying of sample before weighing, material loss during transfer
of precipitates, and errors in transfer of solutions etc. Standard deviation (SD) is often reported to
smooth out the random error for a set of values mainly higher than 4 measurements.
SD
Where (xi –𝑥𝑥) is the deviation from the mean, the difference between the individual
experimental value and the mean value. (N−1) is the total number of measurements minus one
(number of degrees of freedom).
The standard deviation for FAME conversion, squalene recovery and EPA/DHA recovery, are
obtained from the repeated runs at the central points.
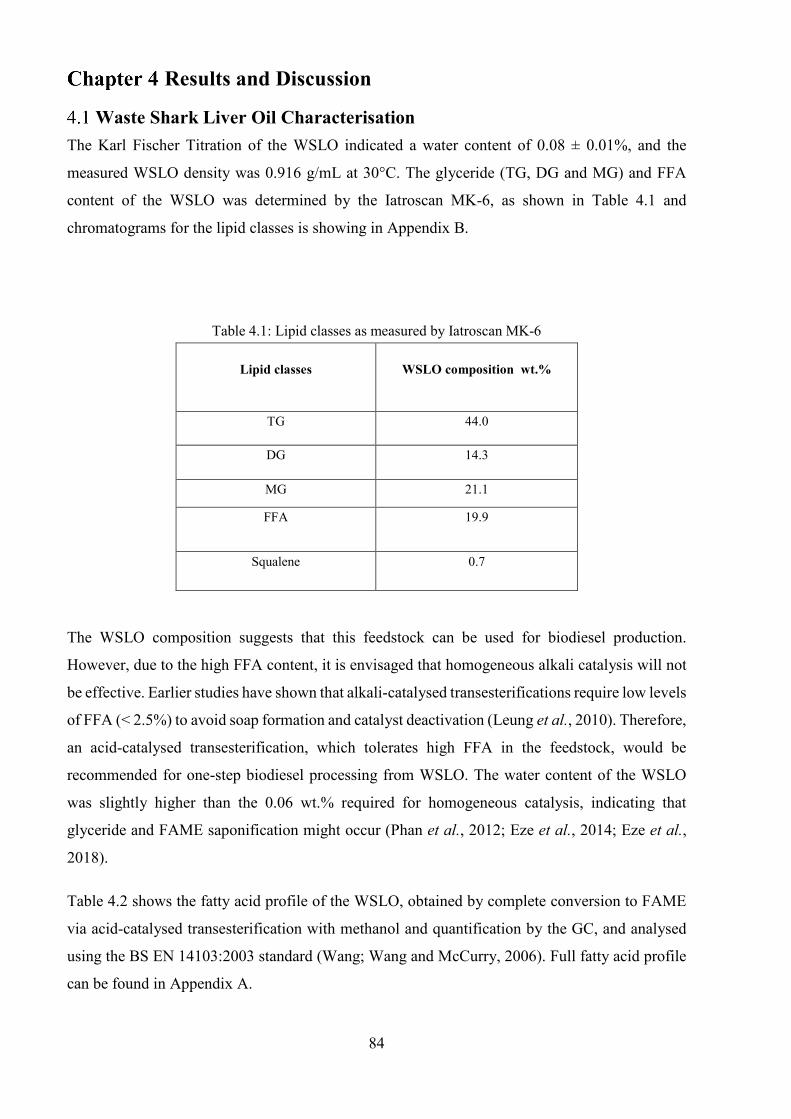
84
Results and Discussion
Waste Shark Liver Oil Characterisation The Karl Fischer Titration of the WSLO indicated a water content of 0.08 ± 0.01%, and the
measured WSLO density was 0.916 g/mL at 30°C. The glyceride (TG, DG and MG) and FFA
content of the WSLO was determined by the Iatroscan MK-6, as shown in Table 4.1 and
chromatograms for the lipid classes is showing in Appendix B.
Table 4.1: Lipid classes as measured by Iatroscan MK-6
Lipid classes
WSLO composition wt.%
TG 44.0
DG 14.3
MG 21.1
FFA 19.9
Squalene 0.7
The WSLO composition suggests that this feedstock can be used for biodiesel production.
However, due to the high FFA content, it is envisaged that homogeneous alkali catalysis will not
be effective. Earlier studies have shown that alkali-catalysed transesterifications require low levels
of FFA (< 2.5%) to avoid soap formation and catalyst deactivation (Leung et al., 2010). Therefore,
an acid-catalysed transesterification, which tolerates high FFA in the feedstock, would be
recommended for one-step biodiesel processing from WSLO. The water content of the WSLO
was slightly higher than the 0.06 wt.% required for homogeneous catalysis, indicating that
glyceride and FAME saponification might occur (Phan et al., 2012; Eze et al., 2014; Eze et al.,
2018).
Table 4.2 shows the fatty acid profile of the WSLO, obtained by complete conversion to FAME
via acid-catalysed transesterification with methanol and quantification by the GC, and analysed
using the BS EN 14103:2003 standard (Wang; Wang and McCurry, 2006). Full fatty acid profile
can be found in Appendix A.

85
Table 4.2: Fatty acids profile of the WSLO
Type of fatty acids
Systematic Name
Weight % of fatty acid
14:0 Myristic acid 5.0
15:0 Pentadecanoic acid 0.6
16:0 Palmitic acid 19.5
16:1n-7 Palmitoleic acid 6.0
16:2n-4 9,12‐hexadecadienoic acid 1.0
18:0 Stearic acid 6.3
18:1n-9 Oleic acid 11.4
18:1n-7 Vaccenic acid 4.0
18:2n-6 Linoleic acid 1.1
20:1n-9 Eicosenoic acid 1.9
20:4n-6 Arachidonic acid 2.2
22:1n-11 Cetoleic acid 1.8
22:4n-6 Adrenic acid 1.0
22:5n-3 Clupanodonic acid 3.7
22:5n-6 Osbond acid 1.8
20:5n-3 (EPA) Eicosapentaenoic acid 6.1
22:5n-3 Docosapentaenoic acid 3.7
22:6n-3 (DHA) Docosahexaenoic acid 15.0

86
The fatty acid profile in Table 4.2 shows that the WSLO contains 21.1% PUFAs, constituting 15%
DHA and 6.1% EPA. The European biodiesel standard, EN 14214 as shown in Appendix D, limits
the content of polyunsaturated (≥ four double bonds) methyl esters to 1% (m/m). However, the
FAME produced from the WSLO could be directly used as biodiesel in the USA and Canada, as
the ASTM D6751 standards as shown in Appendix E do not specify the percentage of PUFAs
allowable in biodiesel. Nevertheless, it is recommended that the PUFAs in WSLO be separated to
obtain EPA and DHA for pharmaceutical application. The remaining FAME after EPA and DHA
separation meets the EN 14214 standards and can be used as a biodiesel.
The average molecular weights obtained from the WSLO fatty acids profile are shown in Table
4.3. Where, the molecular weight for TG, DG and MG are calculated as below:
TG = 3 Σ FAME + GL - 3CH3OH
DG = 2 Σ FAME + GL - 2CH3OH
MG = Σ FAME + GL - CH3OH
Table 4.3: Average molecular weights of WSLO
Glyceride/FAME
WSLO average molecular weight (g/mol)
Triglyceride (TG)
910
Di-glyceride (DG)
698.4
Mono-glyceride (MG)
393.7
Fatty acid methyl esters( FAME)
304.7

87
NMR Analysis for FAME Produced from Acid Catalysed Transesterification
FAME produced from acid catalysed transesterification was analysed by using NMR. Figure
4.1shows an NMR spectrum of the FAME from WSLO. The purpose of this test was to investigate
if the triglycerides have been totally converted to FAME or not. Furthermore, NMR analysis was
used to check the presence of squalene in the WSLO sample after reaction.
Y axis (Amplitude)
X axis Chemical shift (ppm)
Figure 4.1: NMR spectra of the FAME from WSLO
Figure 4.1shows that there are some unconverted triglyceride peaks at 4.28 ppm and 4.131 ppm
for “c” proton (H2C) as shown in Figure 4.2 which indicate that complete conversion was not
achieved for the FAME produced from WSLO.

88
Figure 4.2: Proton NMR Chart
Figure 4.3 shows NMR spectra for pure squalene (99% purity). This spectrum has been used to
determine the presence of squalene in WSLO fatty acid methyl ester NMR spectra. The NMR
spectra of the FAME from WSLO in Figure 4.1 showed a presence of a small peak at 5.201 ppm
(=C-H) assigned to squalene, which is consistent with the Iatroscan chromatogram result for
WSLO about the presence of squalene in the WSLO sample.
Y axis (Amplitude)
X axis Chemical shift (ppm)
Figure 4.3: NMR spectra for pure squalene

89
Monitoring Waste Shark Liver Oil Transesterification Using FTIR FTIR was used to monitor transesterification using an acid catalyst as shown in Figure 4.4 and
Figure 4.5. The results illustrate that the FTIR technique was not a reliable method for on-line
monitoring of conversion of triglyceride to FAME using transesterification reaction for WSLO
samples. There was no real indication of FAME produced because the methyl peak at wave length
1438 cm-1 may represent FAME and methanol as well. Likewise, the carbonyl functional group
observed at wave length 1749 cm-1 could be from either triglyceride or FAME. Therefore, the
result in Figure 4.4 is not indicating a firm conclusion about FAME production at different time
intervals for this reaction. However, GC analysis of the samples confirmed that FAME was
produced from the transesterification of WSLO using acid catalysts.
Figure 4.4: FTIR 4 hrs transesterification reaction using acid catalyst
Axes (X=Wavenumber ,Y= Absorbtion,and Z-time)
Figure 4.5: 3-D FTIR transesterification reaction using acid catalyst
0
0.2
0.4
0.6
0.8
1
1.2
1.4
050010001500200025003000350040004500
Abso
rban
ce (A
.U.)
Wavenumber (cm-1)
4 hrs
25 min
10 min
4 min
0 min

90
Waste Shark Liver Oil Transesterification and FAME Conversions with the Catalysts
The effects mixing has on WSLO transesterification are shown in Figure 4.6 for reactions at 60°C
with a reaction time of 6 h, a 30:1 methanol to oil molar ratio and using a 3 wt.% of sulfuric acid
(H2SO4) catalyst. The FAME conversions against time for different mixing speeds (400, 720 and
1080rpm) clearly indicate that the reaction was mixing independent at 720 rpm and above, while,
at speeds above 400 rpm, there was a mass transfer-controlled reaction. The WSLO
transesterification reaction overcomes the mass transfer dependent region at speeds of 720 and
1080 rpm, becoming kinetically controlled.
Figure 4.6: Effect of mixing intensity on WSLO transesterification at 60°C, with a 6h reaction time, a 30:1 methanol to oil molar ratio and using a 3wt.% of the H2SO4 catalyst.
Figure 4.7 shows the results of the preliminary investigations of the WSLO transesterification
using both acid and base catalysts. The maximum FAME conversion obtained for the
homogeneous alkali-catalysed process was 40%, using the typical transesterification conditions
of 60°C temperature, a 60 min reaction time, a mixing speed of 720 rpm, 1.5 wt.% NaOH, and a
6:1 methanol to oil molar ratio (Figure 4.7 (a)). The FAME conversions increased only slightly
from 15% at 3min to reach the maximum after 15min. This was followed by a period of continuous
decrease in the FAME conversions, with only 12% FAME conversion after the full 60min reaction
time. The trend in the FAME conversions for the NaOH catalyst was attributed to the effect of the
0
10
20
30
40
50
60
70
80
90
100
WSL
O c
onve
rsio
ns to
FA
ME
(%)
Reaction time (h)
Mixing speed720 RPM
400 RPM
1080 RPM

91
high FFA content (19.9%) in the WSLO, which results in the catalyst being deactivated by reacting
with the FFA to form soap and water (saponification) (Pullen and Saeed, 2015). Moreover, the
presence of water in the reaction mixture also leads to glyceride and FAME saponification,
resulting in the observed period of decrease in FAME conversions after achieving the maximum
conversion.
Figure 4.7: FAME conversions for transesterification of WSLO at 720rpm mixing speed using, (a) 1.5 wt.% NaOH at 6:1 methanol to oil molar ratio, 60⁰C temperature and 60min reaction time, (b) 1.5 wt.% H2SO4 at 30:1 methanol to oil molar ratio, 60⁰C temperature and 6h reaction time.
As shown in Figure 4.7 (b), the FAME conversions increased with the reaction time, achieving
93% conversion after 6h. Acid-catalysed transesterification has an advantage over the base-
catalysed process, as it can tolerate high FFA in the feedstock (Issariyakul et al., 2007). It is
expected that either a longer reaction time or an increase in catalyst concentration would be
required to reach the maximum equilibrium of FAME conversion for acid-catalysed WSLO
transesterification. Therefore, a parametric study and optimisation of the acid-catalysed WSLO
transesterification was carried out, as discussed in the following section.

92
Parametric Study and Optimisation of Acid-catalysis of WSLO Transesterification
Parametric studies of the reaction conditions for the acid-catalysed transesterification of the
WSLO were evaluated at 1 to 7 h reaction times, H2SO4 catalyst loading from 1 to 6 wt.% and
methanol to oil molar ratios from 6:1 to 30:1. These studies used a response surface methodology
in DoE with a central composite design.
Table 4.4 shows the experimental and predicted conversion of WSLO to FAME at different
parameter spaces. The main effects were caused by the reaction times and catalyst concentrations,
while the molar ratios showed only moderate effects on FAME conversion. An experimental error
of ± 1.1% was obtained for the data in Table 4.4, based on the three repeats on central points
which are 18 molar ratio of methanol to WSLO, 3.5wt. % of H2SO4 catalyst loading and 4 hrs
reaction time.
Table 4.4:Experimental and predicted conversion of WSLO to FAME at different conditions Run Molar Ratio
(methanol/WSLO) H2SO4 catalyst loading (wt. %)
Time (h)
Experimental conversion of
WSLO to FAME
Model predicted conversion of
WSLO to FAME
1 30 6 7 99.6 99.8
2 18 6 4 95.8 96.3
3 30 1 1 30.0 29.2
4 6 6 1 56.4 55.9
5 6 3.5 4 86.0 86.5
6 6 1 1 31.0 29.8
7 18 3.5 4 87.1 86.6
8 18 3.5 4 86.7 86.6
9 18 3.5 7 96.1 95.5
10 30 1 7 94.9 95.3
11 30 3.5 4 87.0 86.7
12 6 6 7 98.9 98.9
13 6 1 7 95.7 96.0
14 18 3.5 4 85.0 86.6
15 18 3.5 1 41.0 40.9
16 30 6 1 57.0 56.9
17 18 1 4 81.2 81.0

93
An empirical model for FAME conversions, determined from the experimental data using the DoE
response method, is shown in Equation 4.1, where X is the methanol molar ratio, Y is the catalyst
loading (wt.%), and Z is the reaction time (h).
FAME conversion (%) = 0.581 - 0.0385 X + 3.694 Y + 28.164 Z + 0.3190 Cat. Y×Y (4.1) - 2.0451 Z×Z + 0.01292 X×Y - 0.7750 Y×Z. The DoE model predicted that the maximum conversion would occur at: 10.3:1 molar ratio of
methanol to oil, 6.5 h reaction time and 5.9 wt.% H2SO4 catalyst. These conditions were validated
experimentally, and the results showed 99 ±1.1% conversions of the WSLO to FAME.
The interactions of reaction parameters—time, methanol molar ratio and catalyst concentration—
on FAME conversion are shown in Figure 4.8. Clearly, FAME conversions increased with the
methanol molar ratio, up to a maximum of 18:1. After this maximum was reached, further increase
in the methanol molar ratio led to reductions in the FAME conversion. This is in line with findings
for the transesterification of Cynara oil using different molar ratios between 3:1 and 15:1, where
the yield of biodiesel increased with molar ratio up to a value of 12:1, and decreased up to the
maximum molar ratio of 15:1, because a fraction of the glycerol remained in the biodiesel phase
(Musa, 2016).
Figure 4.8: effect of the reaction parameters (reaction time (h), methanol molar ratio and catalyst concentration (wt.%)) on conversions of WSLO to FAME.
301 86
1 00
90
80
70
60
50
406.03.51 .0 741
Methanol molar ratio
Mea
n FA
ME
conv
ersi
on (%
)
Catalyst loading (wt. %) Reaction time (h)
Main Effects Plot for FAME conversion (%)
94
The p-value obtained from DoE for the molar ratio was 0.039, so it was statistically significant.
The increase in catalyst concentration from 1 wt.% to 3.5 wt.% resulted in a sharp rise in FAME
conversions. However, further increases in the catalyst concentration, up to 6 wt.%, did not
improve the FAME conversions. Reaction time also increased conversion over the selected range,
as expected. The p-values obtained from DoE for the catalyst loading and reaction time were 0.00,
and that indicates strong evidence for rejecting the null hypothesis which shows that there is no
statistically signification variation in the variables. Therefore, the catalyst loading and reaction
time are statistically significant.
Squalene Recovery from Waste Shark Liver Oil DoE, using a response surface methodology with a central composite design, was employed to
obtain the parametric conditions for the highest squalene recovery. The DoE was conducted across
the following parameter space: (i) an alcohol to WSLO molar ratio of 20:1 to 100:1, (ii) reaction
times of 5 to 60 min and (iii) water contents in the range of 0 to 20 wt.%. Each experiment was
carried out using 6 g of WSLO, spiked with 1.2 g of squalene, corresponding to 16.7 wt. %
squalene in WSLO. The alkali catalyst concentration was NaOH at 25 wt.% (based on WSLO
dissolved in the alcohol-water solutions) at 60°C with a 720 rpm mixing speed. The experimental
squalene recovery is shown in Table 4.5, with a margin of error of ± 1.3 %, based on the three
repeats around central points which are 60:1 molar ratio of ethanol to WSLO, 10 wt. % water
loading to the reaction and 32.5 min reaction time. The GC chromatograms for squalene recovery
at different reaction times (5, 30 and 60 min) and after washing are attached in appendices (C1,
C2, C3 and C4). An empirical model for squalene extraction determined from the experimental
data using the DoE response method is shown in Equation 4.2, where X is the ethanol molar ratio,
Y is the water loading (wt.%) and Z is the reaction time (min).
Squalene recovery(%) = 95.2 + 0.19 X - 2.36 Z + 8.38 Y (4.2) - 0.00250 X×X + 0.0146 Z×Z - 0.390 Y×Y + 0.00629 X×Z- 0.0477 X×Y + 0.0548 Z×Y
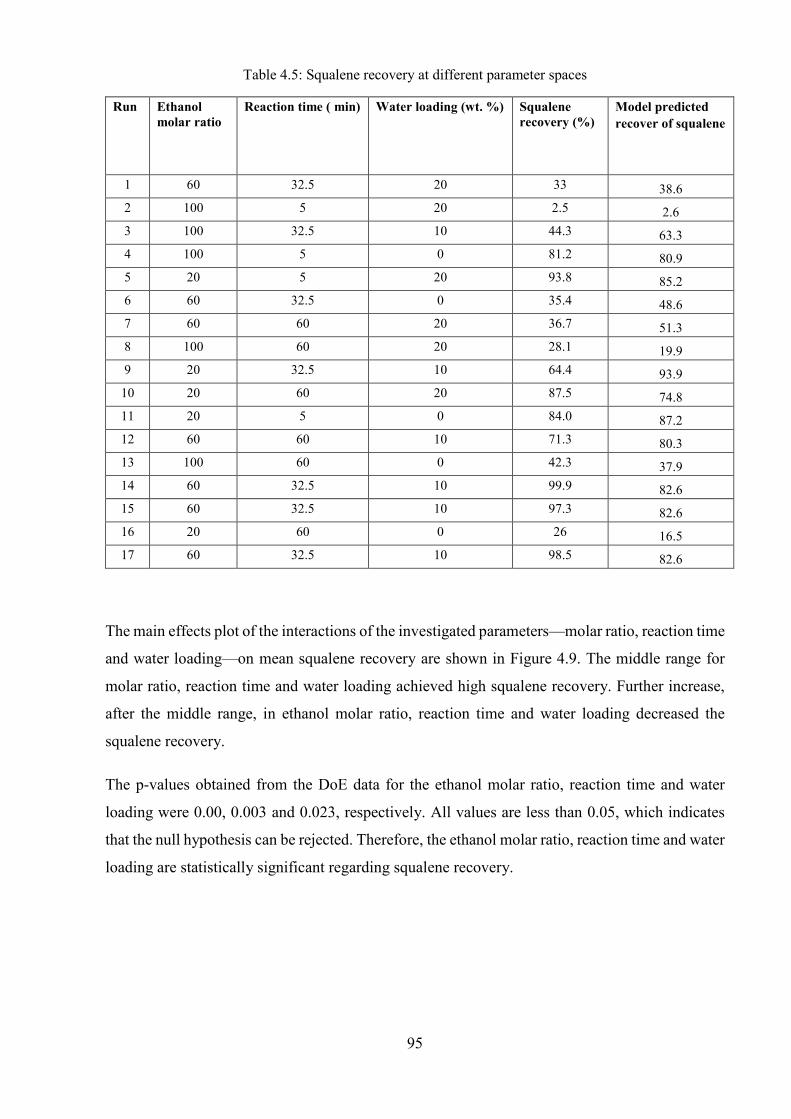
95
Table 4.5: Squalene recovery at different parameter spaces
The main effects plot of the interactions of the investigated parameters—molar ratio, reaction time
and water loading—on mean squalene recovery are shown in Figure 4.9. The middle range for
molar ratio, reaction time and water loading achieved high squalene recovery. Further increase,
after the middle range, in ethanol molar ratio, reaction time and water loading decreased the
squalene recovery.
The p-values obtained from the DoE data for the ethanol molar ratio, reaction time and water
loading were 0.00, 0.003 and 0.023, respectively. All values are less than 0.05, which indicates
that the null hypothesis can be rejected. Therefore, the ethanol molar ratio, reaction time and water
loading are statistically significant regarding squalene recovery.
Run Ethanol molar ratio
Reaction time ( min) Water loading (wt. %) Squalene recovery (%)
Model predicted recover of squalene
1 60 32.5 20 33 38.6 2 100 5 20 2.5 2.6 3 100 32.5 10 44.3 63.3 4 100 5 0 81.2 80.9 5 20 5 20 93.8 85.2 6 60 32.5 0 35.4 48.6 7 60 60 20 36.7 51.3 8 100 60 20 28.1 19.9 9 20 32.5 10 64.4 93.9
10 20 60 20 87.5 74.8 11 20 5 0 84.0 87.2 12 60 60 10 71.3 80.3 13 100 60 0 42.3 37.9 14 60 32.5 10 99.9 82.6 15 60 32.5 10 97.3 82.6 16 20 60 0 26 16.5 17 60 32.5 10 98.5 82.6

96
Figure 4.9: Effects plot for squalene recovery
1 006020
90
80
70
60
50
4060.032.55.0 201 00
Ethanol molar ratio
Mea
n sq
uale
ne re
cove
ry (%
)
Reaction time( min) Water Loading (wt.%)
Main Effects Plot for Squalene recovery %
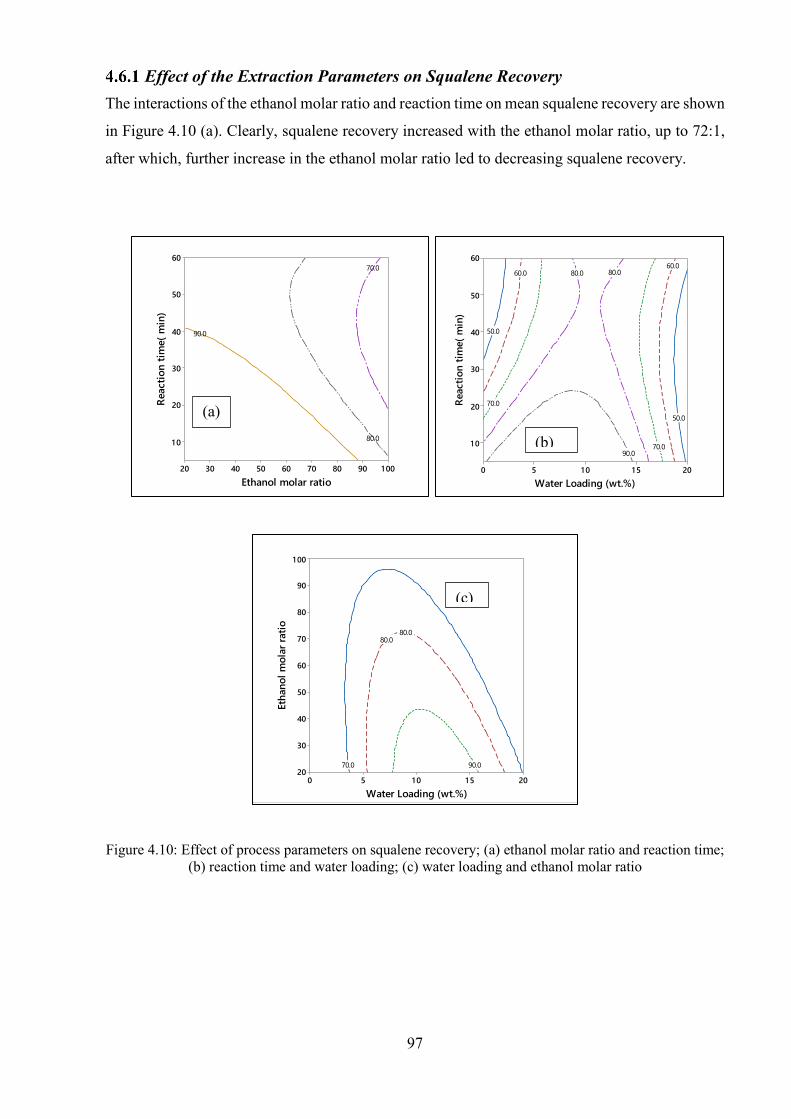
97
Effect of the Extraction Parameters on Squalene Recovery The interactions of the ethanol molar ratio and reaction time on mean squalene recovery are shown
in Figure 4.10 (a). Clearly, squalene recovery increased with the ethanol molar ratio, up to 72:1,
after which, further increase in the ethanol molar ratio led to decreasing squalene recovery.
Figure 4.10: Effect of process parameters on squalene recovery; (a) ethanol molar ratio and reaction time; (b) reaction time and water loading; (c) water loading and ethanol molar ratio
90.0
80.0
70.0
Ethanol molar ratio
Reac
tion
time(
min
)
1 009080706050403020
60
50
40
30
20
1 090.0
80.0 80.0
70.0
70.0
60.060.0
50.0
50.0
Water Loading (wt.%)
Reac
tion
time(
min
)201 51 050
60
50
40
30
20
1 0
90.0
80.080.0
70.0
Water Loading (wt.%)
Etha
nol m
olar
ratio
201 51 050
1 00
90
80
70
60
50
40
30
20
(a)
(b)
(c)

98
This is explained by the fact that, at low ethanol molar ratios, the soap produced was in the form
of an emulsion, as shown in Figure 4.11 (a), which makes squalene recovery difficult. However,
with a slight increase in the ethanol molar ratio, the soap became particulate/granular in form, as
shown in Figure 4.11 (b), allowing for easy squalene recovery. Further increase in the ethanol
molar ratio, up to 100:1, led to reductions in squalene recovery, because the higher ethanol molar
ratio pushed equilibrium further toward ethoxide formation, and this reduced the mole fraction of
hydroxide ions and, consequently, the rates of saponification (Eze et al., 2015).
Figure 4.11: Soap in form of (a) emulsion and (b) particulate/granular
The amount of water introduced in the reaction mixture can affect the level of saponification, and,
accordingly, the separation of squalene. Figure 4.11 (b) shows the interaction between reaction
time and water loading on squalene recovery. As the water content increased from 0% to 7.5%,
the saponification rates increased because of the hydroxide-ethoxide equilibrium reaction, leading
to the production of more hydroxide ions, as shown in Equation 4.3. The increase in hydroxide
concentration led to higher rates of saponification, as reported elswhere (Eze et al., 2015).
However, with further increases in water loading from 7.5% to 20%, the squalene recovery
declined as the type of soap produced was in the form of an emulsion rather than particulates,
leading to the loss of some squalene to the soap layer.
CH3CH2OH + OH- ↔ CH3CH2O- + H2O ( 4.3 )
(a) Soap in form of emulsion (b) Soap in form of particulate/granular

99
Figure 4.10 (c) shows the interaction of water loading and the ethanol molar ratio on squalene
recovery. Both parameters have similar trends. Moderate increase in water content and ethanol
molar ratio resulted in enhanced saponification and, consequently, increased the squalene
recovery. However, further increase in ethanol molar ratio and water loading reduced squalene
recovery because the excess ethanol molar ratio pushed equilibrium further toward ethoxide
formation, which reduced the mole fraction of hydroxide ions required for WSLO saponification.
Moreover, the soap produced at high ethanol molar ratios and high water loading was in the form
of an emulsion, leading to loss of some squalene in the soap layer.
Optimal Conditions for Squalene Recovery Optimal squalene recovery was predicted by the DoE model at the following operating conditions:
20:1 molar ratio of ethanol to oil, 5 min reaction time and 9.9 wt. % water loading. These
conditions were validated experimentally, and the results showed 101.6 ± 1.3 % squalene recovery.
The squalene recovery process developed in this study has been compared with the most common
techniques applied in the industry for squalene extraction, such as short path distillation and
supercritical fluid extraction techniques.
Short path distillation can be used to achieve 97% squalene extraction from shark liver oil (Pietsch
and Jaeger, 2007b), whereas the use of supercritical carbon dioxide has been reported to achieve
squalene recovery of 95% (Catchpole et al., 1997). However, squalene recovery above 97% using
supercritical carbon dioxide can only be achieved using reflux, which increases operational costs
(Catchpole et al., 1997).
The main drawback of the supercritical fluid extraction (SFE) is the high cost of equipment and
the complexity of the operation (Popa et al., 2015b). In terms of energy utilisation, SFE’s requires
more energy than short path distillation, and the investment cost of short path distillation is about
one-third that of the supercritical process (Pietsch and Jaeger, 2007b). Furthermore, from an
operational perspective, the saponification extraction technique does not require high energy to
pressurise the oil feedstock or to reach the supercritical conditions, as is the case for the
supercritical fluid extraction technique.

100
EPA and DHA Extraction A parametric study was conducted to obtain the optimal process conditions for EPA and DHA
recovery from FAEE using aqueous silver nitrate by complexation between the double bonds of
PUFA ethyl ester and silver ions. Ethyl ester is used instead of methyl ester because ethyl ester is
edible. Methyl ester, when hydrolysed in the stomach, will produce methanol, which is toxic.
That methanol will metabolise to form formaldehyde, which is also poisonous—causing blindness
and death. However, ethyl ester, when hydrolysed, will produce ethanol, which is not toxic.
The FAEE was produced by converting the residual soap from the WSLO saponification. The
saponification was performed at the optimal conditions obtained from the DoE: 20:1 molar ratio
of ethanol to oil, 5 min reaction time and 9.9 wt.% water loading. The soap produced was then
neutralised with 0.5M HCl and esterified to FAEE using the H2SO4 catalyst. The FAEE
conversion was 98.6% at the optimum conditions obtained from the DoE results: 10.3 molar ratio
of ethanol to WSLO, 6.5 h reaction time, 60°C temperature, and 5.9 wt.% of the H2SO4 catalyst.
The amounts of EPA and DHA in the FAEE produced from the WSLO were 6.1% and 15 %,
respectively. The extraction experiments were carried out using a ratio of 3:1 (v/v) silver nitrate
to the FAEE across the following parameter space: (i) reaction time at 0.5, 1, 2 and 4 h and (ii)
aqueous silver nitrate concentrations of 15, 30 and 50 wt.% AgNO3 in water.
Figure 4.12 shows an overview of aqueous silver nitrate extraction of EPA and DHA from WSLO.
The reaction temperature was kept constant at 20°C (Lembke, 2013a), and the mixing speed was
300 rpm, based on a previous mixing study (Bura Mohanarangan, 2012). The solvent was hexane,
based on the screening conducted by Teramto et al (1994), which achieved the highest EPA and
DHA extraction in comparison to heptane, benzene, toluene and other solvents (Teramoto et al.,
1994).

101
Figure 4.12: Overview of aqueous silver nitrate extraction of EPA and DHA from WSLO
Effect of Process Parameters on EPA and DHA Extraction Figure 4.13 (a) shows that EPA and DHA recovery increased, from 11.2% to 21.6% for DHA and
from 10.9% to 14.1% for the EPA, between the reaction times of 0.5 and 2 h. There was a sharp
increase in the EPA and DHA recovery from 0.5 to 1.5 h and a moderate increase in recovery
between 1.5 and 2 h. However, for the reaction time after 2 h and up to 4 h, there was no substantial
change in the amounts of EPA and DHA extracted, which indicates that equilibrium extraction
was reached at 2 h.
Silver Nitrate Extraction of FAEE
from WSLO
•The reaction is between WSLO FAEE and AgNO3
•It is a mass transfer limited •Enhanced by the mixing and the contact between the WSLO FAEE and AgNO3Separation of the oil
residual phase and aqueous phase
De-emulsification of oil
De-complexation of aqueous phase
Collecting the organic
fraction for sample
preparation and analysis( EPA/DHA)

102
Figure 4.13: Effects of process parameters on EPA and DHA recovery %; (a) at different reaction times and 30 wt.% AgNO3 concentration; (b) at different AgNO3 concentrations and 2 h reaction time.
Figure 4.13 (b) illustrates the correlation between silver nitrate concentration and EPA and DHA
extraction. The extractions of EPA and DHA mainly depended on the complexation of silver ion
Ag+ with the polyunsaturated fatty acid double bonds (Teramoto et al., 1994; Li et al., 2009).
Clearly, the silver nitrate concentration is an important parameter in EPA and DHA extraction.
Silver nitrate concentrations were examined in the range of 15 to 50 wt.% at fixed a reaction time
of 2h, based on the time required to achieve maximum equilibrium extraction in Figure 4.13(a).
Clearly, the EPA and DHA extraction increased rapidly with the silver nitrate concentration. It
was observed that a sharp increase in EPA and DHA recovery occurred above 30 wt.% silver
nitrate concentration, reaching 66.2% EPA and 83.4% DHA extractions at 50 wt.% silver nitrate
concentration. Increasing the silver nitrate concentration above 50 wt.% was not possible at the
operating conditions, as this exceeded the solubility limit, which is 256 g per 100 mL water at
25 °C and 1 atm (Seidell, 1919).
The observed trends of AgNO3 concentration on EPA and DHA were dependent on the number
of double bond complexations. The complexation of Ag+ increased with the degree of unsaturation
in the fatty acid chain. The composition of the extracted PUFAs showed that there was
substantially higher extraction of DHA. The higher degree of DHA extraction compared to EPA
could be explained by the number of double bonds, which is higher in DHA (n = 6) than in EPA
(n = 5) (Teramoto et al., 1994; Li et al., 2009b).

103
The results derived from this study should now be compared with the most common techniques
used in the industry for EPA and DHA extraction—including molecular distillation, supercritical
extraction technology and supercritical fluid chromatography. The molecular distillation achieved
50-60% recovery of EPA and DHA from (18/12EE) fish oil ethyl ester (Lembke, 2013b). However,
this process requires relatively high operating temperatures of 140-170°C (Lembke, 2013b),
which can result in degradation of EPA and DHA due to thermal stress (Nakano et al., 1996).
Furthermore, Lemhke (1997) reports that fish oil processed using the molecular distillation
method could suffer up to 350% higher thermal stress than fish oil processed using the
supercritical fluid extraction method (Lemhke, 1997). However, the main advantage of molecular
distillation is the low investment cost in comparison to the supercritical fluid extraction method.
The high cost associated with supercritical fluid extraction is mainly due to the cost of pressurising
both the fish oil and the CO2 to achieve supercritical conditions—73 bar (~1070 psig) and
temperatures of ~32°C (Shahidi and Wanasundara, 1998).
Supercritical fluid extraction using CO2 achieved 96.4% recovery of omega-3 rich oil obtained
from the by-products of the fish industry in 3h and under the following extraction conditions: 25
MPa, 40°C and around 13.75 kg CO2/h (Rubio-Rodríguez et al., 2008). Omega-3 PUFA from fish
oil can be separated at the bench scale from an ester mixture, with 90% purity of EPA, using silica
gel as a stationary phase and supercritical chromatography with SC-CO2 as a mobile phase
(Pettinello et al., 2000).
The advantage of the supercritical fluid chromatography technique is the moderate working
temperatures in the range of 40-50°C. These low temperatures prevent thermal stress on EPA and
DHA, which makes supercritical fluid chromatography one of the most appropriate technologies
for the concentration of polyunsaturated fatty acids. However, it has the same disadvantage as
supercritical fluid extraction—high pressure requirements, which necessitate high investment
costs (Nakano et al., 1996).
Clearly, the aqueous silver nitrate method for extracting EPA and DHA offers advantages over
molecular distillation due to the mild operating temperatures and the suitability of large scale
production (Lembke, 2013b). Moreover, the investment cost of silver nitrate extraction is much
lower than either supercritical extraction technology or supercritical fluid chromatography
because of the process’s simplicity and moderate operating temperature and pressure (up to 30°C
and 1 bar) (Lembke, 2013b).

104
However, the major challenge in commercial applications of this process for EPA and DHA
extraction is the cost of AgNO3 and the requirement to recycle the silver nitrate from the aqueous
solutions after the de-complexation process in order to reduce the cost of materials. There are
several methods for silver nitrate recovery, including multi-effect evaporation, electrochemical
oxidation using copper electrode, and the chemical reaction method using sodium hydroxide and
nitric acid (Shanmugam et al., 2015).

105
Techno-economic Analysis
Techno-economic analysis (TEA) is a vital tool for assessing the economic feasibilities of a project
or an investment. In this study, TEA was used to assess the commercial feasibility of the proposed
process for biodiesel production from WSLO, compared with conventional biodiesel production
from refined vegetable oil (rapeseed oil). Aspen HYSYS-V9 was used to simulate both plants.
The process simulations for both plants were based on the plant’ biodiesel production capacity of
12,000 te/y. Non-random two liquid (NRTL) is the fluid package selected in this case due to the
presence of polar components such as methanol and glycerol (Gess et al., 1991).
Process Description Process simulation steps primarily involve defining chemical components, choosing a
thermodynamic model, defining the plant capacity, selecting the operating units, and setting up
the charge conditions such as flowrate, temperature, and pressure. The simulated process flow
sheet of acid-catalysed transesterification of WSLO for the production of biodiesel with the stream
composition is illustrated in . The reactions involved in this process are
shown in Equations 5.1 and 5.2. The reaction was performed with a methanol-to-oil molar ratio
of 10.3:1, 6.5 h reaction time, 60 °C reaction temperature, and 5.9 wt% H2SO4 catalyst
concentration. The glycerides (TG, DG and MG), free fatty acid, biodiesel, glycerol, water and
H2SO4 were as defined in the components list in Aspen HYSYS-V9 as triolein, oleic acid, m-
oleate, glycerol, H2O, and H2SO4, respectively.
TG + 3 MEOH ↔ 3FAME + Glycerol (5.1)
FFA + MEOH ↔ FAME + H2O (5.2)
Where, TG=Triglycerides, FAME=Fatty acid methyl ester, MEOH=Methanol, FFA=Free Fatty
acid.

106
Stream Name 101 105 103 105B 106 101B 201 202 202B 203C 301
FAME 501 502 Water
out FAME pure Oil
Temperature [C] 0.00 0.00 0.00 0.00 0.00 0.00 0.00 0.00 0.00 0.00 0.00 0.00 0.00 1.00 0.00 0.00
Pressure [kPa] 25.00 25.00 25.00 60.00 100.11 43.59 64.73 240.50 60.00 60.00 55.17 99.99 239.68 286.56 286.56 331.71 Molar Flow [kgmole/h] 101.32 101.32 101.32 400.00 400.00 400.00 101.32 101.32 101.30 130.00 101.30 101.30 101.30 101.30 101.30 70.00
Mass Flow [kg/h] 4.66 1.81 6.90 1.81 24.01 22.20 10.64 13.37 13.37 10.95 3.90 76.53 0.30 0.17 3.72 0.01
Components mole fraction
(Triolein) 0.00 0.80 0.00 0.80 0.00 0.00 0.00 0.00 0.00 0.00 0.00 0.00 0.00 0.00 0.00 0.08
(Methanol) 1.00 0.00 0.00 0.00 0.44 0.68 0.98 0.00 0.00 0.00 0.00 0.00 0.00 0.00 0.00 0.00
(M-Oleate) 0.00 0.00 0.00 0.00 0.19 0.00 0.00 0.35 0.35 0.34 0.96 0.00 0.00 0.24 0.99 0.92
(Glycerol) 0.00 0.00 0.00 0.00 0.06 0.00 0.00 0.11 0.11 0.03 0.00 0.00 0.95 0.00 0.00 0.00
(H2SO4) 0.00 0.00 1.00 0.00 0.29 0.31 0.00 0.52 0.52 0.00 0.00 0.00 0.00 0.00 0.00 0.00
(H2O) 0.00 0.00 0.00 0.00 0.02 0.01 0.02 0.03 0.03 0.63 0.04 1.00 0.05 0.76 0.01 0.00
(OleicAcid) 0.00 0.20 0.00 0.20 0.00 0.00 0.00 0.00 0.00 0.00 0.00 0.00 0.00 0.00 0.00 0.00
Figure 5.1: Process flow sheet for acid-catalysed transesterification of WSLO for the production of biodiesel

107
The simulated process flow sheet for conventional biodiesel production using alkali-catalysed
transesterification of refined vegetable oil with the stream composition is shown in . The reaction
was conducted with a methanol-to-oil molar ratio of 6:1, 1 h reaction time, 60 °C reaction
temperature and 1.5 wt.% NaOH catalyst concentration. The triglycerides, biodiesel, glycerol,
water, NaOH, HCl, and NaCl was as defined in the components list in Aspen HYSYS-V9 as
triolein, m-oleate, glycerol and H2O, NaOH, HCl, and NaCl, respectively. The reaction conversion
for both plants was assumed to be 99%.
The determination of plant capacity for the biodiesel production from WSLO was based on the
reported availability of shark liver oil in Oman. Total shark landings by species for all
governorates in Oman during 2016 was 7,507 tonnes (Ministry of Agriculture and Fisheries, 2014).
Since, as noted, a shark’s liver comprises 25-30% of its body weight (Popa et al., 2015c), around
2,000 te/y is the amount of shark liver oil in Oman. Assuming this statistic is applicable to the
neighbouring six Gulf countries, around 12,000 te/y is the proposed plant capacity. For the sake
of comparison, the same capacity was used for the conventional biodiesel process using refined
vegetable oil.

108
Stream Name RS Oil Methanol NaOH 105B 101B 107 201 202 202B 203 204 301 302 Glycerol
pure H2O water outlet
Fame only
Temperature [C] 0.00 0.00 0.00 0.00 0.00 0.00 0.00 0.00 0.00 0.00 0.00 0.00 0.00 0.00 0.00 0.00 0.00
Pressure [kPa] 25.00 25.00 25.00 60.00 62.77 72.78 64.73 323.25 25.00 30.00 30.00 40.92 1.97 239.68 99.99 164.11 346.11
Molar Flow [kgmole/h] 101.30 101.30 101.30 400.00 400.00 350.00 101.30 101.30 101.30 101.30 101.30 101.30 102.00 101.30 101.30 101.30 105.00
Mass Flow [kg/h] 1.55 6.24 0.52 1.55 124.86 126.40 119.76 6.65 6.65 7.17 6.65 4.83 12.81 1.59 11.22 1.50 3.33
components mole fraction
(Triolein) 1.00 0.00 0.00 1.00 0.00 0.00 0.00 0.00 0.00 0.00 0.00 0.00 0.00 0.00 0.00 0.00 0.00
(Methanol) 0.00 1.00 0.00 0.00 0.99 0.94 0.99 0.00 0.00 0.00 0.00 0.00 0.00 0.00 0.00 0.00 0.00
(M-Oleate) 0.00 0.00 0.00 0.00 0.00 0.04 0.00 0.69 0.69 0.64 0.69 0.95 0.00 0.00 0.00 0.85 1.00
(Glycerol) 0.00 0.00 0.00 0.00 0.01 0.02 0.01 0.23 0.23 0.21 0.23 0.00 0.12 0.95 0.00 0.00 0.00
(H2SO4) 0.00 0.00 0.00 0.00 0.00 0.00 0.00 0.00 0.00 0.00 0.00 0.00 0.00 0.00 0.00 0.00 0.00
(NaOH) 0.00 0.00 1.00 0.00 0.00 0.00 0.00 0.08 0.08 0.00 0.00 0.00 0.00 0.00 0.00 0.00 0.00
(H2O) 0.00 0.00 0.00 0.00 0.00 0.00 0.00 0.00 0.00 0.07 0.08 0.05 0.88 0.05 1.00 0.15 0.00
Figure 5.2: Process flow sheet for conventional biodiesel production (alkali-catalysed process) from refined vegetable oil

109
Acid-Catalysed Transesterification of WSLO to Biodiesel As shown in , the methanol and H2SO4 catalyst were mixed and pumped
to the reactor CRV 301. The WSLO was pumped and preheated in heat exchanger E-101 to 60°C
prior to entering the reactor. After the reactor, the reactor downstream was used to heat the WSLO
entering from the reactor (heat integration), and then routed to the distillation column T-100 in
order to separate the excess methanol from the product stream. In T-100, five theoretical stages
and a reflux ratio of two were used to obtain good separation between the methanol and other
reaction mixtures, based on the findings of (Zhang et al., 2003a). Stream 201 methanol is recycled
back to the reactor CRV 301 to reduce the overall cost of the methanol used. The bottom stream
of the distillation column was progressed to the acid removal unit CRV-100. The sulfuric acid was
neutralised using calcium oxide (CaO) to produce CaSO4 and H2O, as shown in Equation 5.3. A
gravity separator was employed to remove the calcium sulphate CaSO4. The remaining stream,
which consists mainly of FAME, water, glycerol and water, is routed to the water washing stage
using liquid-liquid extraction column T-301.
H2SO4 + CaO → CaSO4 + H2O (5.3)
The main purpose of the water washing stage is to separate the FAME from glycerol and water.
Water was added as a solvent to wash the FAME in four theoretical stages in the liquid-liquid
extraction column. The same stages were used to separate FAME from glycerol and water, based
on the findings of (Connemann and Fischer, 1998).
In order to obtain a final biodiesel product adhering to ASTM specifications (more than 96.5%
purity), a FAME distillation column with five theoretical stages and a reflux ratio of two were
employed. The distillation column was operated under vacuum to reduce thermal stress and avoid
FAME degradation. Water was removed from the FAME and the final FAME purity was 99.93%.
The bottom stream of the water washing unit, which consists of glycerol and water, is forwarded
to the glycerol purification distillations column T-501. The distillation column consists of five
theoretical stages and a reflux ratio of two. The glycerol was separated from water with 99.0%
purity.

110
Alkali-Catalysed Transesterification of Refined Vegetable Oil The simulated process flow sheet for the conventional biodiesel production using alkali-catalysed
transesterification of refined vegetable oil is shown in . The reaction was conducted with a
methanol-to-oil molar ratio of 6:1, 1 h reaction time, 60°C reaction temperature and 1.5 wt.%
NaOH catalyst concentration; these are the conventional conditions used for transesterification of
soybean oil (Freedman et al., 1986). The triglycerides, biodiesel, glycerol, water, NaOH, HCl, and
NaCl were as defined from the components list in Aspen HYSYS-V9 as triolein, m-oleate,
glycerol, H2O, NaOH, HCl and NaCl, respectively.
As shown in the methanol and NaOH catalyst were mixed and pumped to the reactor CRV 100.
The refined vegetable oil was pumped and preheated in heat exchanger E-100 to 60°C prior to
entering the reactor. After the reactor, the reactor downstream was utilised to heat the incoming
refined vegetable oil from the reactor and then routed to the distillation column to separate the
excess methanol from the product stream. Five theoretical stages and a reflex ratio of 2 were used
to separate the methanol and other reaction mixtures in the distillation column. The methanol was
then recycled back to the reactor CRV 100 in order to reduce the overall cost, as indicated
previously. The bottom stream of the distillation column was then transferred to the alkali
neutralisation reactor. The NaOH was neutralised using HCl to produce NaCl and H2O, as shown
in Equation 5.4. Next, a gravity separator removed the sodium chloride NaCl, and the remaining
stream consisting mainly of FAME, water, glycerol and water, was then routed to the water
washing stage using the liquid-liquid extraction column.
NaOH + HCl → NaCl + H2O (5.4)
The main purpose of the water washing stage is to separate the FAME from glycerol and water.
Water was added as a solvent to wash the FAME in four theoretical stages in a liquid-liquid
extraction column. The FAME purity achieved after this stage was 99.6%. However, because the
content of water was at this point more than the maximum allowable water content for biodiesel,
as per the ASTM standards (≤ 0.05%), further purification of the FAME was required. To obtain
a final biodiesel product which adhered to ASTM specifications, a FAME distillation column with
five theoretical stages and a reflux ratio of two were employed. The distillation column was
operated under vacuum to reduce thermal stress and avoid FAME degradation. Water was
removed from the FAME and the final FAME purity was 99.87%. The bottom stream of the water
washing unit consisting of glycerol and water is forwarded to the glycerol purification distillations
column. The distillation column consists of five theoretical stages and a reflux ratio of two. The
glycerol was separated from water with 99.0% purity.

111
Economic Analysis The purpose of this economic analysis is to assess the profitability of the acid-catalysed biodiesel
plant using WSLO and compare it with the conventional biodiesel production using refined
vegetable oil (rapeseed oil) with an alkali catalyst. The economic analysis was based on the
following assumptions:
(i) A biodiesel plant production capacity of 12,000 te/y;
(ii) A plant life time of 20 years;
(iii) An operation of 100% of the plant capacity all the time;
(iv) A discount rate of 15%;
(v) Raw material/feedstock (waste shark liver oil) costs mainly associated with the logistic
cost.
The plant life time, discount rate and plant operation are assumed based on a similar biodiesel
production plant using palm oil (Zhang et al., 2003a).
Table 5.1 presents a summary of the materials and chemicals used to produce the biodiesel,
and utilities such as heating energy and cooling water. The cost of the utilities is based on the
cost of heating and cooling.
Table 5.1: A summary of the raw materials used to produce biodiesel, and utilities including heating energy and cooling water
Materials/Chemicals
Price US $/tonne
Reference
Methanol
428
(Methanex, 2018)
Biodiesel 1250 (NESTE, November 2018) Waste shark liver oil
(WSLO transport and collection) 400 Based on local survey and
fishermen in OMAN Alalawi, K. (2019)
Refined vegetable oil (Rapeseed oil )
840 ( NESTE, November 2018)
Glycerol 125 AliBaba.com (1) Sulfuric acid H2SO4 200 AliBaba.com (2)
CaO Calcium oxide
100 AliBaba.com (3)
Sodium hydroxide NOH (99% purity)
400 AliBaba.com (4)
Hydrochloric acid HCl
200 AliBaba.com (5)
Utilities
Heating
Cooling water
Acid-catalysed process Alkali-catalysed process
10.3 US $/h
16.2 US $/h
9.87 US $/h
8.96 US $/h

112
Table 5.2 compares the results obtained from the simulation of the acid and alkali processes. The
conversion used in both cases is 99%, and the same amounts of biodiesel were produced from
both processes, since the same quantity of feedstock was used. Clearly, the quantity of glycerol
produced in the alkali process is higher than the glycerol produced from the acid catalyst. This is
because the feedstock (rapeseed oil) for the alkali process contains 99% TG, and therefore with
an alkali catalyst and alcohol it predominantly produces FAME and glycerol. However, since
WSLO contains less TG (~44%), it produces less glycerol. Furthermore, as WSLO contains more
FFA (~20%), this gives FAME and water. The simulation results are shown in Table 5.2.
Table 5.2: Material balance and process conditions
Item
Conditions
Acid process plant
(WSLO)
Alkali process plant
(vegetable oil) Process condition Temperature (◦C)
60
60
Pressure (kPa)
101.3 101.3
Molar ratio
10.3:1 6:1
Conversion (%)
99
99
Material flow input Waste shark liver oil/rapeseed oil
1370
1370
Make up methanol (kg/h)
232.31
200.8
Recycling methanol (kg/h)
365.89
100.8
Catalyst (kg/h) 81.6
13.84
Catalyst neutralising agent (kg/h)
46.6
12.6
Washing water (kg/h)
230.0
198
Product Biodiesel (kmol/h)
4.6
4.6
Glycerol (kmol/h) 0.3 1.55
113
Total capital investment (TCI) in biodiesel production consists of the total equipment cost,
installation costs, and other indirect costs (such as engineering, construction, contractors, and
contingency costs). The production costs include those of total raw materials added to the total
operation and maintenance costs. Overall utilities costs and the revenue generated from biodiesel
and glycerol were calculated based on the quantity of product and the selling price. Table 5.3
shows the total capital investment, and costs of utilities and production, as obtained from Aspen
HYSYS-V9. Net present value (NPV) is a useful tool to determine the profitability of a project or
investment. A positive NPV shows a profit, while a negative NPV indicates a loss. It is calculated
based on the difference in the present value of cash inflow and outflow over a period of time.
Table 5.3 shows a positive NPV of US $34.8 and US $4.9 million for the acid-catalysed process
and alkali-catalysed process, respectively.
Internal rate of return (IRR) is a discount rate that makes the NPV of all cash flow equal to zero.
IRR is used to evaluate the profitability of potential investments. The IRR in this project was
calculated to be 260% for the acid-catalysed WSLO process and 56% for the alkali-catalysed
vegetable oil process. It is clear that the acid-catalysed process is more attractive than the alkali-
catalysed process due to the higher IRR% of the acid-catalysed process. The break-even price is
the minimum selling price required to have a positive NPV for the process. The break-even price
for the biodiesel obtained from the acid-catalysed WSLO process is 600.3 US $ /te. In other words,
the minimum price for selling biodiesel and making a profit is 600.3 US $/te. If the selling price
is lower than this, the project is not profitable. The break-even price for the biodiesel obtained
from the alkali-catalysed process is US $1,100 which is US $150 lower than the current market
price of biodiesel (Neste, November 2018).
Considering all the results obtained from the economic analysis, it is clear that producing biodiesel
from WSLO using an acid catalyst and with a plant capacity of 12,000 te/y is more profitable and
attractive than the alkali-catalysed process. The main factor in the economic analysis in both
processes is the fact that WSLO is a waste. These results are in line with the literature, which
shows that the use of cheap, non-edible feedstocks such as waste oils improves the production
costs and makes the process economically viable (Banković-Ilić et al., 2012). The other advantage
of this acid-catalysed process is the lower methanol-to-oil ratio of 10.3:1 in comparison to the
typical acid-catalysed transesterification alcohol-to-oil molar ratio of 30:1. The lower molar ratio
contributes effectively to the economics in comparison to the high molar ratio of methanol, which
requires a larger reactor and consequently consumes more heat duties for the complete conversion.

114
Table 5.3: Economic analysis for the biodiesel production capacity of 12000 te/y
The techno-economic analysis results obtained from alkali catalysed transesterification of
vegetable oil and acid catalysed transesterification of WSLO for biodiesel production plant are
compared with a techno-economic analysis study conducted by Sakdarsi et al (2018), for biodiesel
production from palm oil with supercritical methanol (SCM) at low molar ratio and plant capacity
of 40,000 te/y (Sakdasri et al., 2018). The process was simulated under a continues flow process
to meet the requirement of an industrial production plant. The SCM process has been successfully
investigated for a good quality biodiesel production that meet both the ASTM (D6751) and EN
(14214) biodiesel standards (Sakdasri et al., 2016). The study were conducted in both a batch and
continuous reactor. Biodiesel was produced at the optimal condition of 400 °C reaction
Item
Cost in US $ millions
Acid-catalysed plant (WSLO)
Alkali-catalysed plant (vegetable oil)
Total capital investment
2.07
1.98
Utilities cost
0.22
0.17
Revenue from biodiesel
12.01
12.01
Revenue from glycerol
0.05
0.27
Production costs
6.06
11.1
Net annual profit
6.0
1.18
NPV (20 y)
34.8
4.9
IRR (%, 20 y)
260
56

115
temperature, 15 MPa reaction pressure and a methanol: oil molar ratio of 12:1 (Sawangkeaw et
al., 2011). The process flow sheet of the biodiesel production plant from palm oil with
supercritical methanol at low molar ratio is shown in Figure 5.3.
Figure 5.3 Process flow sheet of biodiesel production plant from palm oil with supercritical methanol at low molar ratio (Sakdasri et al., 2018).
The reaction conditions for the SCM process were obtained from literature based on a similar
studies. The SCM process reaction temperature was 300 °C and reaction pressure of 20 MPa and
a methanol : oil molar ratio of 42:1(Saka and Kusdiana, 2001). The palm oil and methanol were
separately fed into the supercritical reactor by two high-pressure pumps at 25°C and 1 bar
(Sakdasri et al., 2018). Both streams were heated by heat exchangers and pressurised to
the required pressure of 20 MPa before entering the reactor. Palm oil and methanol streams were
mixed and converted to their respective products in the reactor at reaction temperature of 300°C.
After that, the liquid product stream was routed to the heat exchangers in order to preheat the feeds
(Sakdasri et al., 2018). The excess methanol from the product stream was separated using a
distillation column, which was recycled to the process in order to reduce the overall cost of
methanol. A decanter was employed to separate the glycerol as a by-product. Finally, the product
stream was introduced to a distillation column to remove the trace amounts of residual methanol
(Sakdasri et al., 2018). The economic analysis of biodiesel production from palm oil using SCM
was investigated for a three different plant capacities (10,000 te/y, 40,000 te/y and 100,000 te/y)
as shown in Table 5.4
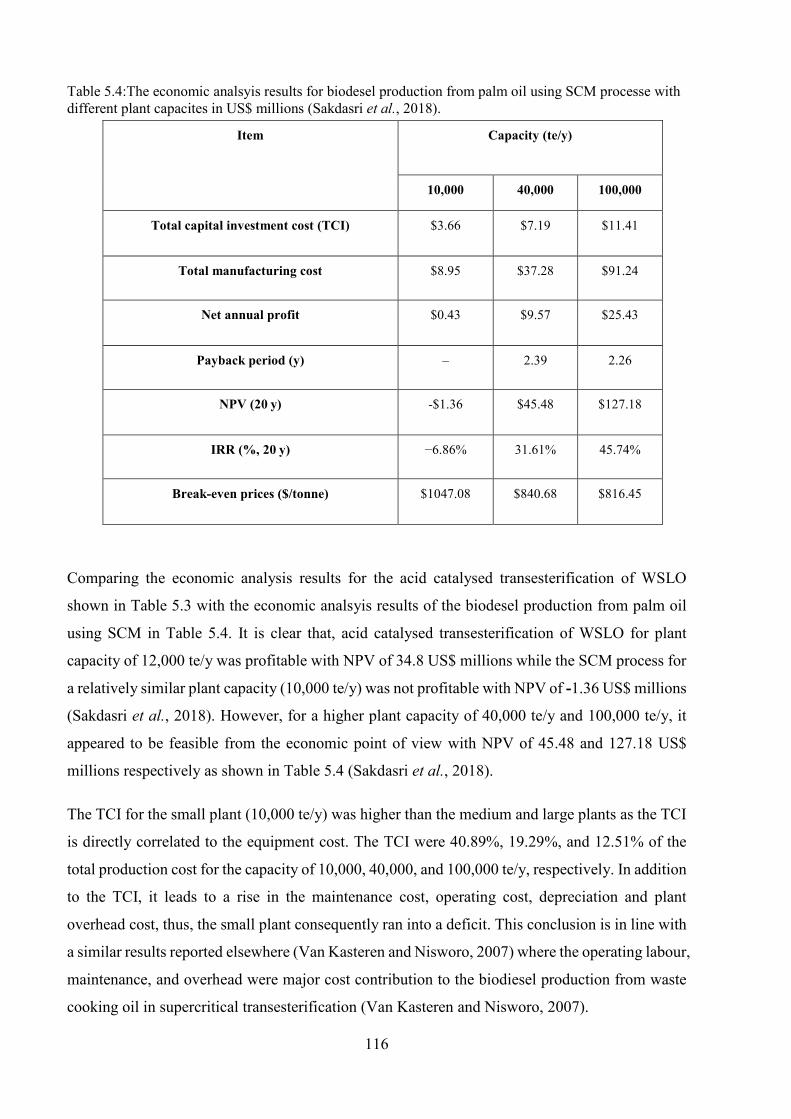
116
Table 5.4:The economic analsyis results for biodesel production from palm oil using SCM processe with different plant capacites in US$ millions (Sakdasri et al., 2018).
Item Capacity (te/y)
10,000 40,000 100,000
Total capital investment cost (TCI) $3.66 $7.19 $11.41
Total manufacturing cost $8.95 $37.28 $91.24
Net annual profit $0.43 $9.57 $25.43
Payback period (y) – 2.39 2.26
NPV (20 y) -$1.36 $45.48 $127.18
IRR (%, 20 y) −6.86% 31.61% 45.74%
Break-even prices ($/tonne) $1047.08 $840.68 $816.45
Comparing the economic analysis results for the acid catalysed transesterification of WSLO
shown in Table 5.3 with the economic analsyis results of the biodesel production from palm oil
using SCM in Table 5.4. It is clear that, acid catalysed transesterification of WSLO for plant
capacity of 12,000 te/y was profitable with NPV of 34.8 US$ millions while the SCM process for
a relatively similar plant capacity (10,000 te/y) was not profitable with NPV of -1.36 US$ millions
(Sakdasri et al., 2018). However, for a higher plant capacity of 40,000 te/y and 100,000 te/y, it
appeared to be feasible from the economic point of view with NPV of 45.48 and 127.18 US$
millions respectively as shown in Table 5.4 (Sakdasri et al., 2018).
The TCI for the small plant (10,000 te/y) was higher than the medium and large plants as the TCI
is directly correlated to the equipment cost. The TCI were 40.89%, 19.29%, and 12.51% of the
total production cost for the capacity of 10,000, 40,000, and 100,000 te/y, respectively. In addition
to the TCI, it leads to a rise in the maintenance cost, operating cost, depreciation and plant
overhead cost, thus, the small plant consequently ran into a deficit. This conclusion is in line with
a similar results reported elsewhere (Van Kasteren and Nisworo, 2007) where the operating labour,
maintenance, and overhead were major cost contribution to the biodiesel production from waste
cooking oil in supercritical transesterification (Van Kasteren and Nisworo, 2007).
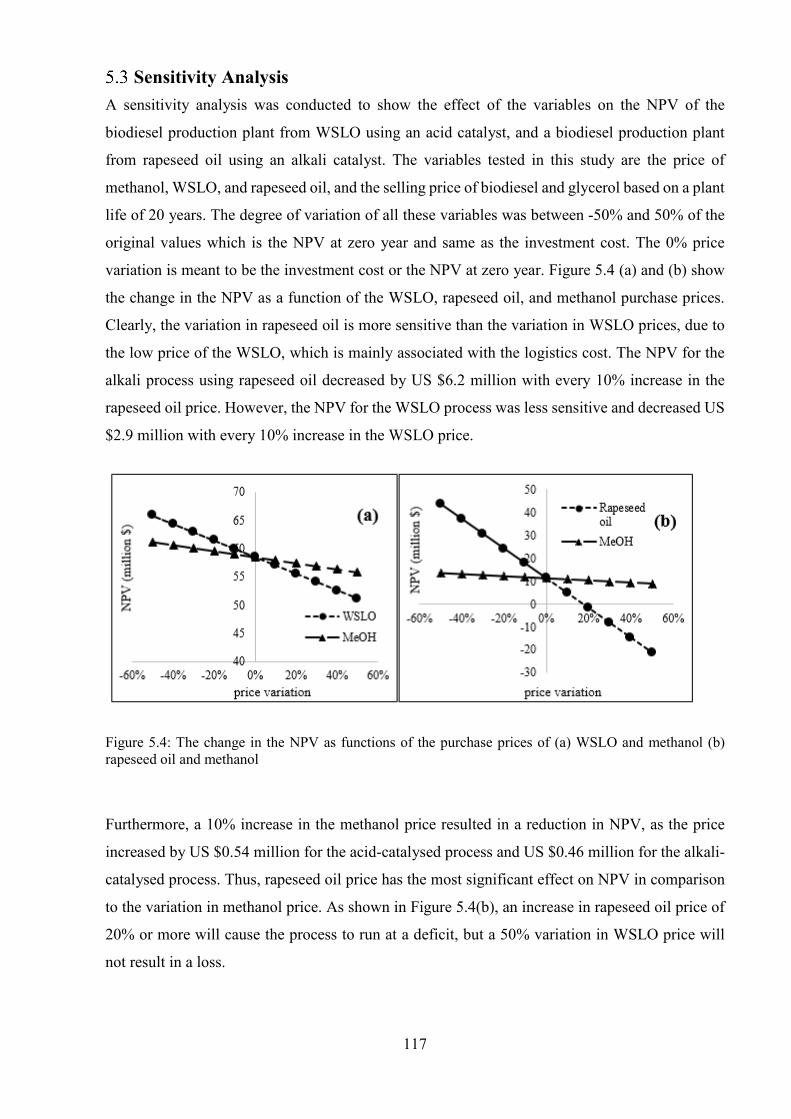
117
Sensitivity Analysis A sensitivity analysis was conducted to show the effect of the variables on the NPV of the
biodiesel production plant from WSLO using an acid catalyst, and a biodiesel production plant
from rapeseed oil using an alkali catalyst. The variables tested in this study are the price of
methanol, WSLO, and rapeseed oil, and the selling price of biodiesel and glycerol based on a plant
life of 20 years. The degree of variation of all these variables was between -50% and 50% of the
original values which is the NPV at zero year and same as the investment cost. The 0% price
variation is meant to be the investment cost or the NPV at zero year. Figure 5.4 (a) and (b) show
the change in the NPV as a function of the WSLO, rapeseed oil, and methanol purchase prices.
Clearly, the variation in rapeseed oil is more sensitive than the variation in WSLO prices, due to
the low price of the WSLO, which is mainly associated with the logistics cost. The NPV for the
alkali process using rapeseed oil decreased by US $6.2 million with every 10% increase in the
rapeseed oil price. However, the NPV for the WSLO process was less sensitive and decreased US
$2.9 million with every 10% increase in the WSLO price.
Figure 5.4: The change in the NPV as functions of the purchase prices of (a) WSLO and methanol (b) rapeseed oil and methanol
Furthermore, a 10% increase in the methanol price resulted in a reduction in NPV, as the price
increased by US $0.54 million for the acid-catalysed process and US $0.46 million for the alkali-
catalysed process. Thus, rapeseed oil price has the most significant effect on NPV in comparison
to the variation in methanol price. As shown in Figure 5.4(b), an increase in rapeseed oil price of
20% or more will cause the process to run at a deficit, but a 50% variation in WSLO price will
not result in a loss.

118
Clearly, Figure 5.5 shows the change in the NPV as functions of the biodiesel and glycerol selling
prices for the acid- and alkali-catalysed process. The NPV was sensitive to the biodiesel selling
price, since biodiesel is the main product in the process and plays a significant role in its
economics. The NPV increased US $7.4 million with every 10% increase in the biodiesel selling
price. In addition, the effect of a 10% glycerol variation was US $0.03 million for the acid-
catalysed process and US $ 0.17 for the alkali-catalysed. The effect of a glycerol price variation
on NPV is more significant for the alkali process than the acid due to the higher amount of glycerol
produced from the alkali process using rapeseed oil, which is mainly triglycerides.
Figure 5.5: The change in the NPV as functions of the biodiesel and glycerol selling prices for (a) the acid-catalysed plant using WSLO, and (b) the alkali-catalysed plant using vegetable oil (rapeseed oil)
It can be clearly noticed that the biodiesel selling price has more influence on the NPV in
comparison to the glycerol variation prices. Moreover, the sensitivity analysis as shown in Figure
5.4 and Figure 5.5 gives an idea of the minimum selling price required to have a positive NPV for
the process, which is known as the break-even price. The break-even price for producing biodiesel
from the acid-catalysed WSLO process was 600.3 US $/te, and 1,100 US $/te for the alkali-
catalysed rapeseed oil process.

119
Summary The feedstock purchase price has the largest influence on the economics of the two processes.
These results are in line with the literature, which shows that the cost of feedstock accounts for
70–95% of total biodiesel production costs (Banković-Ilić et al., 2012). This has caused increasing
research interest in the use of cheap, non-edible feedstocks, such as waste oils, to improve
production costs and make the process economically viable. Taken together, the economic
analysis suggests that producing biodiesel from WSLO using an acid catalyst at a plant capacity
of 12,000 te/y is more profitable and attractive than an alkali-catalysed process. However, the
limited supply of WSLO in one location is the main downside of this process.

120
Conclusions and Further Work
Conclusions The main goal of this project was to identify an efficient and cost-effective technique for
converting WSLO to biodiesel, whilst producing high added value co-products of squalene,
eicosapentaenoic acid (EPA), and docosahexaenoic acid (DHA). The high price of biodiesel
compared to the petroleum-based diesel is the main challenge for biodiesel production. Currently,
the biodiesel market is based on subsidies, and the cost of biodiesel is predominantly a function
of the feedstock cost rather than the processing costs. Therefore, the use of cheap, non-edible
feedstock such as WSLO should reduce the cost and make biodiesel production economically
viable.
This research has shown that the conventional method of biodiesel production, homogeneous
alkali-catalysed (NaOH) transesterification, was ineffective at converting WSLO to FAME due to
the high FFA content. Instead, it has been demonstrated here that acid-catalysed (H2SO4)
transesterification of the WSLO is technically feasible. Furthermore, the FAME conversions
increased with the methanol-to-oil molar ratio, reaction time and catalyst concentration, reaching
a maximum of 99.0 ±1.1%, achieved at 10.3 molar ratio, 6.5 h and 5.9 wt. % of H2SO4 acid catalyst.
It was also demonstrated that WSLO can be converted to biodiesel using existing biodiesel
processing technologies, and that squalene, EPA and DHA can be extracted.
Squalene is a value-added product obtainable from WSLO, and is used in various cosmetic
applications as well as being an adjuvant in vaccines, including the pandemic H1N1 vaccine.
Saponification extraction can achieve 101.6± 1.3 % squalene recovery (at 20:1 alcohol to oil, 5
min reaction time and 9.9 wt. % water loading).
Aqueous silver nitrate (AgNO3) was employed for extractions of EPA and DHA from fatty acid
ethyl esters produced from the WSLO. The extractions of the EPA and DHA depended on the
complexation of silver ion Ag+ with the poly-unsaturated fatty acid double bonds. Extraction was
carried out by mixing aqueous silver nitrate with the FAEE produced from the WSLO in a ratio
of 3:1 silver nitrate to FAEE. The results of this investigation for EPA and DHA extraction showed
that the highest EPA and DHA recoveries occurred at 50 wt.% silver nitrate concentration,
reaching 66.2 % EPA and 83.4% DHA extractions.
Techno-economic analysis was used to compare the commercial feasibilities of the acid-catalysed
biodiesel production from the WSLO, with the conventional, commercial alkali-catalysed
biodiesel process using refined vegetable oil (rapeseed oil). Aspen HYSYS-V9 was used to

121
simulate both plants. The simulation process of acid-catalysed transesterification of WSLO for
the production of biodiesel was performed with a methanol-to-oil molar ratio of 10.3:1, 6.5 h
reaction time, 60 °C reaction temperature and 5.9 wt.% H2SO4 catalyst concentration. However,
the simulated process for conventional biodiesel production using alkali-catalysed
transesterification of refined vegetable oil (rapeseed oil) was conducted with a methanol-to-oil
molar ratio of 6:1, 1 h reaction time, 60 °C reaction temperature and 1.5 wt.% NaOH catalyst
concentration.
The NPVs were US $34.8 and US $4.9 million for the acid-catalysed biodiesel process from the
WSLO and alkali-catalysed processes, respectively. The IRR% in this project was calculated to
be 260% for the acid-catalysed process and 56% for the alkali-catalysed process. Clearly, the acid-
catalysed process is more economically attractive than the alkali-catalysed due to the higher IRR%
for the acid-catalysed process than the alkali-catalysed process. The break-even prices for
producing biodiesel from the WSLO process was 600.3 US $ /te, and 1,100 US $ /te for the alkali-
catalysed rapeseed oil process. The main reason the WSLO-biodiesel, by all these metrics, is so
much more profitable is that the WSLO is waste, whereas rapeseed oil typically costs 840 US $/te.
The other economic advantage of this acid-catalysed process is the lower methanol-to-oil ratio of
10.3:1, in comparison to the typical acid-catalysed transesterification alcohol-to-oil molar ratio of
30:1. This reduces the operating costs by reducing the methanol recycling, capital costs, and
energy duties of the larger unit’s operation, including the reactor and distillation column.
Sensitivity analysis showed that the rapeseed oil process was substantially more sensitive to all of
the variables than the WSLO-based process. For instance, the NPV for the alkali process using
rapeseed oil decreased by US $6.2 million with every 10% increase in the rapeseed oil price.
However, the NPV for the WSLO process was less sensitive and decreased US $2.9 million with
every 10% increase in the WSLO price. A variation in the methanol price of 10% resulted in a
change in the NPV of US $0.54 million for the acid-catalysed process and US $0.46 million for
the alkali-catalysed process. Overall, the rapeseed oil price had the most significant effect on NPV.
Another observation was that the biodiesel selling price had significantly more influence on the
NPV than the glycerol price. This is because biodiesel is the main product and is produced at
approximately five times the volume of the glycerol. Furthermore, the price of glycerol is
historically low due to oversupply from the biodiesel industry worldwide. Taken together, the
economic analysis suggests that producing biodiesel from WSLO using an acid catalyst at a plant
capacity of 12,000 te/year is more profitable and attractive than producing biodiesel from
vegetable oil using an alkali-catalysed process. Furthermore, this will become significantly more
profitable if the various co-products (EPA, DHA, and squalene) are also considered.

122
Further Work It is recommended that further research be undertaken in the following areas:
I. The current research was not specifically designed to evaluate factors related to biodiesel
quality. Therefore, further experimental investigations are needed to carry out biodiesel
tests to meet ASTM and European biodiesel standards. These tests include but not limited
to calorific value test, emission test, high cold filter plugging point (CFPP), cloud point
and pour point.
II. Systematically investigate the recovery of silver nitrate used for the extraction of the EPA
and DHA from WSLO ethyl ester. Since the cost of silver nitrate is high, it is imperative
to recover the silver nitrate from aqueous phase after de-complexation to reduce the cost
of raw materials. There are several recovery techniques for silver nitrate from waste
solution including multi-effect evaporation, electrochemical oxidation using a copper
electrode, and a chemical reaction method using sodium hydroxide and nitric acid
(Murphy, 1991 and Rawat, 1986).
III. Investigate the possibility of recycling the solid “particles” and ashes obtained after the
filtration of WSLO. These solid particles contains phospholipid (Debouzy et al., 2008)
which can be utilised as a fertiliser to improve the plant growth (Kopp et al., 1996). There
are several studies on valorising fish waste as fertiliser due to the high content of nutrients
in the fish waste, such as N, P, and Ca (Radziemska et al., 2018).
IV. Model the biorefinery as a complete process using Aspen HYSYS and scale-up the
biorefinery from laboratory to pilot plant to enable more accurate techno-economic
analysis and life cycle assessment of the process. Data from such scale up could then more
reliably be compared to industrial-scale and commercial processes.

123
References
Abdullah, A.Z., Razali, N. and Lee, K.T. (2009) 'Optimization of mesoporous K/SBA-15
catalyzed transesterification of palm oil using response surface methodology', Fuel
Processing Technology, 90(7), pp. 958-964.
Al Hatrooshi, A.S., Eze, V.C. and Harvey, A.P. (2020) 'Production of biodiesel from waste
shark liver oil for biofuel applications', Renewable Energy, 145, pp. 99-105.
Ali, Y., Hanna, M.A. and Cuppett, S.L. (1995) 'Fuel properties of tallow and soybean oil esters',
Journal of the American Oil Chemists' Society, 72(12), pp. 1557-1564.
AliBaba.com 2018, China Popular Manufacturer High Quality Glycerol For Sale - Buy
Glycerol,Glycerol Manufacture,Glycerol For Sale Product on Alibaba.com. [online]
www.alibaba.com. Available at: https://www.alibaba.com/product-detail/China-
Popular-Manufacturer-High-QualityGlycerol [Accessed 12 Nov. 2018].
AliBaba.com 2018, High Purity 98% Industrial Grade Sulphuric Acid H2SO4 For Sale - Buy
Price For High Purity 98% Industrial Grade Sulphuric Acid H2SO4,High Purity 98%
Industrial Grade Sulphuric Acid H2SO4,98% Industrial Grade Sulphuric Acid H2SO4
For Sale Product on Alibaba.com. [online] www.alibaba.com. Available at:
https://www.alibaba.com/product-detail/High-Purity-98-Industrial-Grade-Sulphuric
[Accessed 12 Nov. 2018].
AliBaba.com 2018, High Quality Calcium Oxide With Good Price/cas No.:1305-78-8 - Buy
Calcium Oxide,High Quality Calcium Oxide,Calcium Oxide With Good Price Product
on Alibaba.com. [online] www.alibaba.com. Available at:
https://www.alibaba.com/product-detail/High-Quality-Calcium-Oxide [Accessed 12
Nov. 2018].
AliBaba.com 2018, Best Price Soap Paper Making Pearls Sodium Hydroxide Caustic Soda -
Buy Caustic Soda For Paper Making,Caustic Soda Pearls 99%,Cheap Caustic Soda
124
Pearls Product on Alibaba.com. [online] www.alibaba.com. Available at:
https://www.alibaba.com/product-detail/best-price-soap-paper-making [Accessed 12
Nov. 2018].
AliBaba.com 2018, Hydrochloric Acid - 33% Min - Buy Hydrochloric Acid Industry Grade
& Food Grade,Hydrochloric Acid 31% To 37% Industrial Grade,Hydrochloric Acid
Industry Grade & Food Grade Product on Alibaba.com. [online] www.alibaba.com.
Available at: https://www.alibaba.com/product-detail/HYDROCHLORIC-ACID
[Accessed 12 Nov. 2018].
Amorim, H.V., Lopes, M.L., de Castro Oliveira, J.V., Buckeridge, M.S. and Goldman, G.H.
(2011) 'Scientific challenges of bioethanol production in Brazil', Applied
Microbiology and Biotechnology, 91(5), p. 1267.
Ardi, M.S., Aroua, M.K. and Hashim, N.A. (2015) 'Progress, prospect and challenges in
glycerol purification process: A review', Renewable & Sustainable Energy Reviews,
42, pp. 1164-1173.
Atadashi, I.M., Aroua, M.K., Abdul Aziz, A.R. and Sulaiman, N.M.N. (2012a) 'The effects of
water on biodiesel production and refining technologies: A review', Renewable and
Sustainable Energy Reviews, 16(5), pp. 3456-3470.
Atadashi, I.M., Aroua, M.K., Aziz, A.R.A. and Sulaiman, N.M.N. (2012b) 'The effects of
water on biodiesel production and refining technologies: A review', Renewable and
Sustainable Energy Reviews, 16(5), pp. 3456-3470.
Atadashi, I.M., Aroua, M.K., Aziz, A.R.A. and Sulaiman, N.M.N. (2013) 'The effects of
catalysts in biodiesel production: A review', Journal of industrial and engineering
chemistry, 19(1), pp. 14-26.
Balat, M. and Balat, H. (2008) 'A critical review of bio-diesel as a vehicular fuel', Energy
Conversion and Management, 49(10), pp. 2727-2741.

125
Balat, M. and Balat, H. (2010) 'Progress in biodiesel processing', Applied Energy, 87(6), pp.
1815-1835.
Banković-Ilić, I.B., Stamenković, O.S. and Veljković, V.B. (2012) 'Biodiesel production from
non-edible plant oils', Renewable and Sustainable Energy Reviews, 16(6), pp. 3621-
3647.
Barabás, I. and Todoruț, I.-A. (2011) 'Biodiesel quality, standards and properties', in Biodiesel-
quality, emissions and by-products. Intechopen.
Berthod, A., Ruiz-Ángel, M.J. and Carda-Broch, S. (2009) 'Countercurrent chromatography:
People and applications', Journal of Chromatography A, 1216(19), pp. 4206-4217.
Bin-Mahfouz, A., Mahmoud, K. and Mourad, M. (2018) 'Influence of Biodiesel Inlet
Temperature on the Performance of a Small DI Diesel Engine', American Journal of
Science and Technology, 5(3), pp. 42-48.
Breivik, H., Haraldsson, G.G. and Kristinsson, B. (1997) 'Preparation of highly purified
concentrates of eicosapentaenoic acid and docosahexaenoic acid', Journal of the
American Oil Chemists' Society, 74(11), pp. 1425-1429.
Breivik, H., Thorstad, O. and Libnau, F.O. (2015) 'Process for concentrating omega-3 fatty
acids'. Google Patents.
Bura Mohanarangan, A. (2012) 'EXTRACTION OF OMEGA-3 FATTY ACIDS FROM
ATLANTIC HERRING (Clupea harengus)'.
Burton, R. and Biofuels, P. (2008) 'An overview of ASTM D6751: biodiesel standards and
testing methods', Alternative fuels consortium.

126
Calder, P.C. (2013) 'Omega‐3 polyunsaturated fatty acids and inflammatory processes:
nutrition or pharmacology?', British Journal of Clinical Pharmacology, 75(3), pp.
645-662.
Canas, B.J. and Yurawecz, M.P. (1999) 'Ethyl carbamate formation during urea complexation
for fractionation of fatty acids', Journal of the American Oil Chemists' Society, 76(4),
pp. 537-537.
Catchpole, O.J., von Kamp, J.-C. and Grey, J.B. (1997) 'Extraction of Squalene from Shark
Liver Oil in a Packed Column Using Supercritical Carbon Dioxide', Industrial &
Engineering Chemistry Research, 36(10), pp. 4318-4324.
Celante, D., Schenkel, J.V.D. and de Castilhos, F. (2018) 'Biodiesel production from soybean
oil and dimethyl carbonate catalyzed by potassium methoxide', Fuel, 212, pp. 101-107.
Chaddad, F.R. (2010) 'UNICA: Challenges to Deliver Sustainability in the Brazilian Sugarcane
Industry1', International Food and Agribusiness Management Review, 13(4).
Chaintreau, A. (2007) '6.2 - Analytical Methods to Determine Potentially Allergenic
Fragrance-Related Substances in Cosmetics', in Salvador, A. and Chisvert, A. (eds.)
Analysis of Cosmetic Products. Amsterdam: Elsevier, pp. 257-275.
Chen, T.-C. and Ju, Y.-H. (2000) 'Enrichment of eicosapentaenoic acid and docosahexaenoic
acid in saponified menhaden oil', Journal of the American Oil Chemists' Society, 77(4),
pp. 425-428.
Connemann, J. and Fischer, J. (1998) Int. Liquid Biofuels Congress, Curitiba, Brasil.
Cuenot, F., Fulton, L. and Staub, J. (2012) 'The prospect for modal shifts in passenger transport
worldwide and impacts on energy use and CO2', Energy Policy, 41, pp. 98-106.

127
Davenport, S.R.D., P. P. (1989 ) Market opportunities for shark liver oil (Accessed: 21 August).
de Caprariis, B., Di Rita, M., Stoller, M., Verdone, N. and Chianese, A. (2012) 'Reaction-
precipitation by a spinning disc reactor: Influence of hydrodynamics on nanoparticles
production', Chemical Engineering Science, 76, pp. 73-80.
de Lima, A.L. and Mota, C.J.A. (2019) 'Biodiesel: A Survey on Production Methods and
Catalysts', in Mulpuri, S., Carels, N. and Bahadur, B. (eds.) Jatropha, Challenges for
a New Energy Crop: Volume 3: A Sustainable Multipurpose Crop. Singapore:
Springer Singapore, pp. 475-491.
De Oliveira, F.C. and Coelho, S.T. (2017) 'History, evolution, and environmental impact of
biodiesel in Brazil: A review', Renewable and Sustainable Energy Reviews, 75, pp.
168-179.
Debouzy, J.-C., Crouzier, D., Lefebvre, B. and Dabouis, V. (2008) 'Study of Alkylglycerol
Containing Shark Liver Oil: A Physico Chemical Support for Biological Effect?',
Drug Target Insights, 3, p. DTI.S671.
Deshmane, V.G. and Adewuyi, Y.G. (2013) 'Synthesis and kinetics of biodiesel formation via
calcium methoxide base catalyzed transesterification reaction in the absence and
presence of ultrasound', Fuel, 107, pp. 474-482.
Dessimoz, A.-L., Cavin, L., Renken, A. and Kiwi-Minsker, L. (2008) 'Liquid–liquid two-phase
flow patterns and mass transfer characteristics in rectangular glass microreactors',
Chemical Engineering Science, 63(16), pp. 4035-4044.
Diomede, L., Colotta, F., Piovani, B., Re, F., Modest, E.J. and Salmona, M. (1993) 'Induction
of apoptosis in human leukemic cells by the ether lipid 1-octadecyl-2-methyl-rac-
glycero-3-phosphocholine. A possible basis for its selective action', International
Journal of Cancer, 53(1), pp. 124-130.

128
Dorado, M.P., Ballesteros, E., De Almeida, J.A., Schellert, C., Löhrlein, H.P. and Krause, R.
(2002) 'An alkalai-catalyzed transesterification process for high free fatty acid waste
oils', Transactions of the American Society of Agricultural Engineers, 45(3), pp. 525-
529.
Drake, P.L. and Hazelwood, K.J. (2005) 'Exposure-Related Health Effects of Silver and Silver
Compounds: A Review', Annals of Work Exposures and Health, 49(7), pp. 575-585.
Eevera, T., Rajendran, K. and Saradha, S. (2009) 'Biodiesel production process optimization
and characterization to assess the suitability of the product for varied environmental
conditions', Renewable Energy, 34(3), pp. 762-765.
Enweremadu, C.C. and Mbarawa, M.M. (2009) 'Technical aspects of production and analysis
of biodiesel from used cooking oil—A review', Renewable and Sustainable Energy
Reviews, 13(9), pp. 2205-2224.
Escobar, J.C., Lora, E.S., Venturini, O.J., Yáñez, E.E., Castillo, E.F. and Almazan, O. (2009)
'Biofuels: Environment, technology and food security', Renewable and Sustainable
Energy Reviews, 13(6–7), pp. 1275-1287.
Eze, V.C., Harvey, A.P. and Phan, A.N. (2015) 'Determination of the kinetics of biodiesel
saponification in alcoholic hydroxide solutions', Fuel, 140, pp. 724-730.
Eze, V.C., Phan, A.N. and Harvey, A.P. (2014) 'A more robust model of the biodiesel reaction,
allowing identification of process conditions for significantly enhanced rate and water
tolerance', Bioresource Technology, 156, pp. 222-231.
Eze, V.C., Phan, A.N. and Harvey, A.P. (2018) 'Intensified one-step biodiesel production from
high water and free fatty acid waste cooking oils', Fuel, 220, pp. 567-574.
129
Fernández, Ó., Vázquez, L., Reglero, G. and Torres, C.F. (2013) 'Discrimination against
diacylglycerol ethers in lipase-catalysed ethanolysis of shark liver oil', Food
Chemistry, 136(2), pp. 464-471.
Fifield, F.W. and Kealey, D. (1995) Principles and practice of analytical chemistry. Blackie
academic & professional.
Fiori, L., Manfrini, M. and Castello, D. (2014) 'Supercritical CO2 fractionation of omega-3
lipids from fish by-products: Plant and process design, modeling, economic feasibility',
Food and Bioproducts Processing, 92(2), pp. 120-132.
Flavourtech (2009) Omega-3 Concentrate Process Line. Available at:
http://www.flavourtech.com/Technologies/System_Process_Lines/omega-
concentrate.html.
FluidsScience (2015) supercritical fluid extraction. Available at:
http://eng.ege.edu.tr/~otles/SupercriticalFluidsScienceAndTechnology/bolumb/Wc3
4c920327cd9.htm.
Foutch, G. (2003) Reactors in Process Engineering.
Fowler, S.L., International Union for Conservation of, N. and Natural, R. (2005) Sharks, Rays
and Chimaeras: The Status of the Chondrichthyan Fishes : Status Survey. IUCN.
Fox, C. (2009) 'Squalene Emulsions for Parenteral Vaccine and Drug Delivery', Molecules,
14(9), p. 3286.
Freedman, B., Butterfield, R.O. and Pryde, E.H. (1986) 'Transesterification kinetics of soybean
oil 1', Journal of the American Oil Chemists’ Society, 63(10), pp. 1375-1380.

130
Georgogianni, K.G., Katsoulidis, A.K., Pomonis, P.J., Manos, G. and Kontominas, M.G. (2009)
'Transesterification of rapeseed oil for the production of biodiesel using homogeneous
and heterogeneous catalysis', Fuel Processing Technology, 90(7–8), pp. 1016-1022.
Gerpen, J.V. (2005) 'Biodiesel processing and production', Fuel Processing Technology,
86(10), pp. 1097-1107.
Gess, M.A., Danner, R.P. and Nagvekar, M. (1991) Thermodynamic analysis of Vapor-liquid
equilibria: Recommended models and a standard data base. Design Institute for
Physical Property Data, American Institute of Chemical Engineers.
Gog, A., Roman, M., Toşa, M., Paizs, C. and Irimie, F.D. (2012) 'Biodiesel production using
enzymatic transesterification – Current state and perspectives', Renewable Energy,
39(1), pp. 10-16.
Gole, V.L. and Gogate, P.R. (2012) 'A review on intensification of synthesis of biodiesel from
sustainable feed stock using sonochemical reactors', Chemical Engineering and
Processing: Process Intensification, 53, pp. 1-9.
Graham, A.S., McConvey, I.F. and Shering, P. (2001) 'An evaluation of the performance of a
preparative CCC machine for the separation of an active pharmaceutical ingredient',
Journal of liquid chromatography & related technologies, 24(11-12), pp. 1811-1825.
Halder, P., Azad, K., Shah, S. and Sarker, E. (2019) '8 - Prospects and technological
advancement of cellulosic bioethanol ecofuel production', in Azad, K. (ed.) Advances
in Eco-Fuels for a Sustainable Environment. Woodhead Publishing, pp. 211-236.
Hall, D.W., Marshall, S.N., Gordon, K.C. and Killeen, D.P. (2016) 'Rapid Quantitative
Determination of Squalene in Shark Liver Oils by Raman and IR Spectroscopy', Lipids,
51(1), pp. 139-147.

131
Harvey, A.P. and Lee, J.G.M. (2012) '5.12 - Intensification of Biofuel Production', in Sayigh,
A. (ed.) Comprehensive Renewable Energy. Oxford: Elsevier, pp. 205-215.
Helwani, Z., Othman, M.R., Aziz, N., Kim, J. and Fernando, W.J.N. (2009) 'Solid
heterogeneous catalysts for transesterification of triglycerides with methanol: A
review', Applied Catalysis A: General, 363(1–2), pp. 1-10.
Holub, D.J. and Holub, B.J. (2004) 'Omega-3 fatty acids from fish oils and cardiovascular
disease', Molecular and Cellular Biochemistry, 263(1), pp. 217-225.
Hoydonckx, H.E., De Vos, D.E., Chavan, S.A. and Jacobs, P.A. (2004) 'Esterification and
Transesterification of Renewable Chemicals', Topics in Catalysis, 27(1), pp. 83-96.
Huong, L.M. (2007) 'Polyunsaturated fatty acid enrichment by complexation with silver ion',
Vietnam Journal of Chemistry, 45(6), p. 757.
Iagher, F., de Brito Belo, S.R., Souza, W.M., Nunes, J.R., Naliwaiko, K., Sassaki, G.L.,
Bonatto, S.J.R., de Oliveira, H.H.P., Brito, G.A.P., de Lima, C., Kryczyk, M., de
Souza, C.F., Steffani, J.A., Nunes, E.A. and Fernandes, L.C. (2013) 'Antitumor and
anti-cachectic effects of shark liver oil and fish oil: comparison between independent
or associative chronic supplementation in Walker 256 tumor-bearing rats', Lipids in
health and disease, 12, pp. 146-146.
IEA (2017) 'World Energy Outlook', world Energy Outlook Available at:
http://www.worldenergyoutlook.org
Issariyakul, T., Kulkarni, M.G., Dalai, A.K. and Bakhshi, N.N. (2007) 'Production of biodiesel
from waste fryer grease using mixed methanol/ethanol system', Fuel Processing
Technology, 88(5), pp. 429-436.

132
Jabado, R.W., Al Ghais, S.M., Hamza, W., Henderson, A.C., Spaet, J.L.Y., Shivji, M.S. and
Hanner, R.H. (2015) 'The trade in sharks and their products in the United Arab
Emirates', Biological Conservation, 181, pp. 190-198.
Jähnisch, K., Hessel, V., Löwe, H. and Baerns, M. (2004) 'Chemistry in Microstructured
Reactors', Angewandte Chemie International Edition, 43(4), pp. 406-446.
Kim, S.-K. and Karadeniz, F. (2012) 'Chapter 14 - Biological Importance and Applications of
Squalene and Squalane', in Se-Kwon, K. (ed.) Advances in Food and Nutrition
Research. Academic Press, pp. 223-233.
Knothe, G. (2006) 'Analyzing biodiesel: standards and other methods', Journal of the American
Oil Chemists' Society, 83(10), pp. 823-833.
Kole, C., Joshi, C.P. and Shonnard, D.R. (2012) Handbook of bioenergy crop plants. CRC
Press.
Kopp, H., Weiss, A. and Schlue, R. (1996) 'Use of phospholipids to improve plant growth',
World patent WO012685.
Kromann, N. and Green, A. (1980) 'Epidemiological Studies in the Upernavik District,
Greenland', Acta Medica Scandinavica, 208(1‐6), pp. 401-406.
Kumar, D., Kumar, G., Poonam and Singh, C.P. (2010) 'Fast, easy ethanolysis of coconut oil
for biodiesel production assisted by ultrasonication', Ultrasonics Sonochemistry, 17(3),
pp. 555-559.
Lam, M.K., Lee, K.T. and Mohamed, A.R. (2010) 'Homogeneous, heterogeneous and
enzymatic catalysis for transesterification of high free fatty acid oil (waste cooking oil)
to biodiesel: a review', Biotechnology advances, 28(4), pp. 500-518.

133
Lee, J.-S. and Saka, S. (2010) 'Biodiesel production by heterogeneous catalysts and
supercritical technologies', Bioresource technology, 101(19), pp. 7191-7200.
Lembke, P. (2013a) 'Production Techniques for Omega-3 Concentrates', in De Meester, F.,
Watson, R.R. and Zibadi, S. (eds.) Omega-6/3 Fatty Acids. Humana Press, pp. 353-
364.
Lembke, P. (2013b) 'Production Techniques for Omega-3 Concentrates', in De Meester, F.,
Watson, R.R. and Zibadi, S. (eds.) Omega-6/3 Fatty Acids: Functions, Sustainability
Strategies and Perspectives. Totowa, NJ: Humana Press, pp. 353-364.
Lemhke, P. (1997) 'Production of High Purity n-3 Fatty Acid-Ethyl Esters hy Process Scale
Supercritical Fluid Chromatography', Supercritical Fluid Chromatography with
Patked Columns: Techniques and Applications, 75, p. 429.
Leung, D.Y.C. and Guo, Y. (2006) 'Transesterification of neat and used frying oil:
Optimization for biodiesel production', Fuel Processing Technology, 87(10), pp. 883-
890.
Leung, D.Y.C., Wu, X. and Leung, M.K.H. (2010) 'A review on biodiesel production using
catalyzed transesterification', Applied Energy, 87(4), pp. 1083-1095.
Li, M. and Li, T. (2008) 'Enrichment of Omega-3 Polyunsaturated Fatty Acid Methyl Esters
by Ionic Liquids Containing Silver Salts', Separation Science and Technology, 43(8),
pp. 2072-2089.
Li, M., Pittman, C.U. and Li, T. (2009a) 'Extraction of polyunsaturated fatty acid methyl esters
by imidazolium-based ionic liquids containing silver tetrafluoroborate—Extraction
equilibrium studies', Talanta, 78(4), pp. 1364-1370.
134
Li, M., Pittman Jr, C.U. and Li, T. (2009b) 'Extraction of polyunsaturated fatty acid methyl
esters by imidazolium-based ionic liquids containing silver tetrafluoroborate—
Extraction equilibrium studies', Talanta, 78(4-5), pp. 1364-1370.
Lodha, H., Jachuck, R. and Suppiah Singaram, S. (2012) 'Intensified Biodiesel Production
Using a Rotating Tube Reactor', Energy & Fuels, 26(11), pp. 7037-7040.
Lu, H.-T., Jiang, Y. and Chen, F. (2003) 'Preparative separation and purification of squalene
from the microalga Thraustochytrium ATCC 26185 by high-speed counter-current
chromatography', Journal of Chromatography A, 994(1), pp. 37-43.
Ma, F. and Hanna, M.A. (1999a) 'Biodiesel production: A review', Bioresource Technology,
70(1), pp. 1-15.
Ma, F. and Hanna, M.A. (1999b) 'Biodiesel production: a review1', Bioresource Technology,
70(1), pp. 1-15.
Mathimani, T., Uma, L. and Prabaharan, D. (2015) 'Homogeneous acid catalysed
transesterification of marine microalga Chlorella sp. BDUG 91771 lipid – An efficient
biodiesel yield and its characterization', Renewable Energy, 81, pp. 523-533.
Mazubert, A., Poux, M. and Aubin, J. (2013) 'Intensified processes for FAME production from
waste cooking oil: A technological review', Chemical Engineering Journal, 233, pp.
201-223.
Mbatia, B., Adlercreutz, D., Adlercreutz, P., Mahadhy, A., Mulaa, F. and Mattiasson, B. (2010)
'Enzymatic oil extraction and positional analysis of ω-3 fatty acids in Nile perch and
salmon heads', Process Biochemistry, 45(5), pp. 815-819.

135
Meher, L.C., Vidya Sagar, D. and Naik, S.N. (2006) 'Technical aspects of biodiesel production
by transesterification—a review', Renewable and Sustainable Energy Reviews, 10(3),
pp. 248-268.
Ministry of Agriculture and Fisheries (2014) 'Fisheries Statistics Book '. 13/12/2015. Muscat:
Ministry of Agriculture and Fisheries,Department of Fisheries Statistics, p.252.
Available:http://omanagriculture.net/Pages/BulletinDetails.aspx?Id=596&lang=EN&
I=0&DId=0&CId=0&CMSId=800183#726
Moser, B.R. (2009) 'Biodiesel production, properties, and feedstocks', In Vitro Cellular &
Developmental Biology - Plant, 45(3), pp. 229-266.
Musa, I.A. (2016) 'The effects of alcohol to oil molar ratios and the type of alcohol on biodiesel
production using transesterification process', Egyptian Journal of Petroleum, 25(1),
pp. 21-31.
Nakano, K., Kato, S., Noritomi, H. and Nagahama, K. (1996) 'Extraction of polyunsaturated
fatty acid ethyl esters from sardine oil using Ag+-containing o/w/o emulsion liquid
membranes', Journal of Membrane Science, 110(2), pp. 219-227.
Nakazawa, A., Matsuura, H., Kose, R., Kato, S., Honda, D., Inouye, I., Kaya, K. and Watanabe,
M.M. (2012) 'Optimization of culture conditions of the thraustochytrid
Aurantiochytrium sp. strain 18W-13a for squalene production', Bioresource
Technology, 109, pp. 287-291.
Navarro-Garcı́a, G., Pacheco-Aguilar, R., Bringas-Alvarado, L. and Ortega-Garcı́a, J. (2004)
'Characterization of the lipid composition and natural antioxidants in the liver oil of
Dasyatis brevis and Gymnura marmorata rays', Food Chemistry, 87(1), pp. 89-96.
Navarro-Garcia, G., Pacheco-Aguilar, R., Vallejo-Cordova, B., Ramirez-Suarez, J.C. and
Bolaños, A. (2000) 'Lipid Composition of the Liver Oil of Shark Species from the

136
Caribbean and Gulf of California Waters', Journal of Food Composition and Analysis,
13(5), pp. 791-798.
Navarro-García, G., Ramírez-Suárez, J.C., Cota-Quiñones, E., Márquez-Farías, F. and
Bringas-Alvarado, L. (2010) 'Storage stability of liver oil from two ray (Rhinoptera
bonasus and Aetobatus narinari) species from the Gulf of Mexico', Food Chemistry,
119(4), pp. 1578-1583.
Neto, A.C., Guimarães, M.J.O.C. and Freire, E. (2018) 'Business models for commercial scale
second-generation bioethanol production', Journal of Cleaner Production, 184, pp.
168-178.
Okada, T. and Morrissey, M.T. (2007) 'Production of n− 3 polyunsaturated fatty acid
concentrate from sardine oil by lipase-catalyzed hydrolysis', Food chemistry, 103(4),
pp. 1411-1419.
Pask, S.D., Nuyken, O. and Cai, Z. (2012) 'The spinning disk reactor: an example of a process
intensification technology for polymers and particles', Polymer Chemistry, 3(10), pp.
2698-2707.
Patil, P.D. and Deng, S. (2009) 'Optimization of biodiesel production from edible and non-
edible vegetable oils', Fuel, 88(7), pp. 1302-1306.
Patil, R.A., Kausley, S.B., Balkunde, P.L. and Malhotra, C.P. (2013) 'Comparative study of
disinfectants for use in low-cost gravity driven household water purifiers', Journal of
Water and Health, 11(3), pp. 443-456.
Pavia, D., Lampman, G., Kriz, G. and Vyvyan, J. (2008) Introduction to spectroscopy.
Cengage Learning.

137
Peters, J. and Thielmann, S. (2008) 'Promoting biofuels: Implications for developing countries',
Energy Policy, 36(4), pp. 1538-1544.
Pettinello, G., Bertucco, A., Pallado, P. and Stassi, A. (2000) 'Production of EPA enriched
mixtures by supercritical fluid chromatography: From the laboratory scale to the pilot
plant', Journal of Supercritical Fluids, 19(1), pp. 51-60.
Phan, A.N., Harvey, A.P. and Eze, V. (2012) 'Rapid Production of Biodiesel in Mesoscale
Oscillatory Baffled Reactors', Chemical Engineering & Technology, 35(7), pp. 1214-
1220.
Pietsch, A. and Jaeger, P. (2007a) 'Concentration of squalene from shark liver oil by short-path
distillation', European Journal of Lipid Science and Technology, 109(11), pp. 1077-
1082.
Pietsch, A. and Jaeger, P. (2007b) 'Concentration of squalene from shark liver oil by short‐
path distillation', European journal of lipid science and technology, 109(11), pp. 1077-
1082.
PikeResearch (2012) 'Biofuels Markets and Technologies', p. 3.
Popa, O., Băbeanu, N.E., Popa, I., Niță, S. and Dinu-Pârvu, C.E. (2015a) 'Methods for
obtaining and determination of squalene from natural sources', BioMed research
international, 2015.
Popa, O., Băbeanu, N.E., Popa, I., Niță, S. and Dinu-Pârvu, C.E. (2015b) 'Methods for
obtaining and determination of squalene from natural sources', BioMed research
international, 2015, pp. 367202-367202.

138
Popa, O., x, beanu, N.E., Popa, I., Ni, x21b, x, Sultana, Dinu, P., xe and rvu, C.E. (2015c)
'Methods for Obtaining and Determination of Squalene from Natural Sources',
BioMed Research International, 2015, p. 16.
Pullen, J. and Saeed, K. (2015) 'Investigation of the factors affecting the progress of base-
catalyzed transesterification of rapeseed oil to biodiesel FAME', Fuel Processing
Technology, 130, pp. 127-135.
Qiu, Z., Petera, J. and Weatherley, L.R. (2012) 'Biodiesel synthesis in an intensified spinning
disk reactor', Chemical Engineering Journal, 210, pp. 597-609.
Qiu, Z., Zhao, L. and Weatherley, L. (2010) 'Process intensification technologies in continuous
biodiesel production', Chemical Engineering and Processing: Process Intensification,
49(4), pp. 323-330.
Radich, A. (1998) 'Biodiesel performance, costs, and use', Combustion, 24(2), pp. 131-132.
Radziemska, M., Vaverková, M.D., Adamcová, D., Brtnický, M. and Mazur, Z. (2018)
'Valorization of Fish Waste Compost as a Fertilizer for Agricultural Use', Waste and
Biomass Valorization, pp. 1-9.
Rahimi, M., Aghel, B., Alitabar, M., Sepahvand, A. and Ghasempour, H.R. (2014)
'Optimization of biodiesel production from soybean oil in a microreactor', Energy
Conversion and Management, 79, pp. 599-605.
Rasal, A., Saxena, S., Nair, N., Vikal, M., Yadav, K. and Dwivedi, G. (2019) Singapore.
Springer Singapore.
Regalado-Méndez, A., Romero, R.R., Rangel, R.N. and Skogestad, S. (2015) 'Biodiesel
production in stirred tank chemical reactors: a numerical simulation', in New Trends

139
in Networking, Computing, E-learning, Systems Sciences, and Engineering. Springer,
pp. 109-116.
Rubio-Rodríguez, N., Beltrán, S., Jaime, I., de Diego, S.M., Sanz, M.T. and Carballido, J.R.
(2010) 'Production of omega-3 polyunsaturated fatty acid concentrates: A review',
Innovative Food Science & Emerging Technologies, 11(1), pp. 1-12.
Rubio-Rodríguez, N., de Diego, S.M., Beltrán, S., Jaime, I., Sanz, M.T. and Rovira, J. (2008)
'Supercritical fluid extraction of the omega-3 rich oil contained in hake (Merluccius
capensis–Merluccius paradoxus) by-products: Study of the influence of process
parameters on the extraction yield and oil quality', The Journal of Supercritical Fluids,
47(2), pp. 215-226.
Saka, S. and Kusdiana, D. (2001) 'Biodiesel fuel from rapeseed oil as prepared in supercritical
methanol', Fuel, 80(2), pp. 225-231.
Sakdasri, W., Sawangkeaw, R. and Ngamprasertsith, S. (2016) 'Response surface methodology
for the optimization of biofuel production at a low molar ratio of supercritical
methanol to used palm olein oil', Asia‐Pacific Journal of Chemical Engineering,
11(4), pp. 539-548.
Sakdasri, W., Sawangkeaw, R. and Ngamprasertsith, S. (2018) 'Techno-economic analysis of
biodiesel production from palm oil with supercritical methanol at a low molar ratio',
Energy, 152, pp. 144-153.
Sawangkeaw, R., Teeravitud, S., Bunyakiat, K. and Ngamprasertsith, S. (2011) 'Biofuel
production from palm oil with supercritical alcohols: Effects of the alcohol to oil molar
ratios on the biofuel chemical composition and properties', Bioresource technology,
102(22), pp. 10704-10710.
Seidell, A. (1919) Solubilities of inorganic and organic compounds c. 2. D. Van Nostrand
Company.

140
Shahidi, F. and Wanasundara, U.N. (1998) 'Omega-3 fatty acid concentrates: nutritional
aspects and production technologies', Trends in Food Science & Technology, 9(6), pp.
230-240.
Shanmugam, K. and Donaldson, A.A. (2015) 'Extraction of EPA/DHA from 18/12EE Fish Oil
Using AgNO3(aq): Composition, Yield, and Effects of Solvent Addition on Interfacial
Tension and Flow Pattern in Mini-Fluidic Systems', Industrial & Engineering
Chemistry Research, 54(33), pp. 8295-8301.
Shanmugam, K., Neima, A. and Donaldson, A.A. (2015) 'Design and Feasibility Analysis of
Commercial Silver-Based Solvent Extraction of Omega-3 PUFA', Global Journal of
Research In Engineering.
Sherma, J. and Fried, B. (2002) 'Handbook of thin layer chromatography', Anal. Chem, 72, pp.
9R-25R.
Singh, D.P. and Dwevedi, A. (2019) 'Chapter 2 - Production of clean energy by green ways',
in Dwevedi, A. (ed.) Solutions to Environmental Problems Involving Nanotechnology
and Enzyme Technology. Academic Press, pp. 49-90.
Singh, S.P. and Singh, D. (2010) 'Biodiesel production through the use of different sources and
characterization of oils and their esters as the substitute of diesel: a review', Renewable
and sustainable energy reviews, 14(1), pp. 200-216.
Skalicka-Woźniak, K. and Garrard, I. (2014) 'Counter-current chromatography for the
separation of terpenoids: a comprehensive review with respect to the solvent systems
employed', Phytochemistry reviews : proceedings of the Phytochemical Society of
Europe, 13(2), pp. 547-572.
Smith, T.J., Yang, G.Y., Seril, D.N., Liao, J. and Kim, S. (1998) 'Inhibition of 4-
(methylnitrosamino)-1-(3-pyridyl)-1-butanone-induced lung tumorigenesis by dietary
olive oil and squalene', Carcinogenesis, 19(4), pp. 703-706.
141
Sootchiewcharn, N., Attanatho, L. and Reubroycharoen, P. (2015) 'Biodiesel Production from
Refined Palm Oil using Supercritical Ethyl Acetate in A Microreactor', Energy
Procedia, 79, pp. 697-703.
Sun, T., Pigott, G.M. and Herwig, R.P. (2002) 'Lipase‐assisted concentration of n‐3
polyunsaturated fatty acids from viscera of farmed Atlantic salmon (Salmo salar L.)',
Journal of Food Science, 67(1), pp. 130-136.
Teramoto, M., Matsuyama, H., Ohnishi, N., Uwagawa, S. and Nakai, K. (1994) 'Extraction of
ethyl and methyl esters of polyunsaturated fatty acids with aqueous silver nitrate
solutions', Industrial & engineering chemistry research, 33(2), pp. 341-345.
Thanh, L.T., Okitsu, K., Sadanaga, Y., Takenaka, N., Maeda, Y. and Bandow, H. (2010)
'Ultrasound-assisted production of biodiesel fuel from vegetable oils in a small scale
circulation process', Bioresource Technology, 101(2), pp. 639-645.
Thompson, J.C. and He, B.B. (2006) 'Characterization of crude glycerol from biodiesel
production from multiple feedstocks', Applied engineering in agriculture, 22(2), pp.
261-265.
Thompson, J.C. and He, B.B. (2007) 'Biodiesel production using static mixers', Transactions
of the ASABE, 50(1), pp. 161-165.
Tsujimoto, M. (1916) 'A highly unsaturated hydrocarbon in shark liver oil', Industrial &
Engineering Chemistry, 8(10), pp. 889-896.
Urban, T. (2015) 'worldwide energy consumption', worldwide energy consumption 2013.
Available at: http://waitbutwhy.com/2015/06/how-tesla-will-change-your-life.html.

142
Van Kasteren, J.M.N. and Nisworo, A.P. (2007) 'A process model to estimate the cost of
industrial scale biodiesel production from waste cooking oil by supercritical
transesterification', Resources, Conservation and Recycling, 50(4), pp. 442-458.
Vannuccini, S. ( 1999) 'Shark utilization, marketing and trade', FAO Fisheries and Technical
paper, p. 470.
Vázquez, L., Torres, C.F., Fornari, T., Señoráns, F.J. and Reglero, G. (2007) 'Recovery of
squalene from vegetable oil sources using countercurrent supercritical carbon dioxide
extraction', The Journal of Supercritical Fluids, 40(1), pp. 59-66.
Wanasundara, U.N. (2001) 'Marine oils: Stabilization, structural characterization and omega-
3 fatty acid concentration'.
Wanasundara, U.N. and Shahidi, F. (1999) 'Concentration of omega 3-polyunsaturated fatty
acids of seal blubber oil by urea complexation: optimization of reaction conditions',
Food Chemistry, 65(1), pp. 41-49.
Wang, C.-X. and McCurry, J. (2006) 'Determining the Ester and Linolenic Acid Methyl Ester
Content to Comply with EN14103', Agilent Technologies.
Wen, Z., Yu, X., Tu, S.-T., Yan, J. and Dahlquist, E. (2009) 'Intensification of biodiesel
synthesis using zigzag micro-channel reactors', Bioresource Technology, 100(12), pp.
3054-3060.
Wetherbee, B.M. and Nichols, P.D. (2000) 'Lipid composition of the liver oil of deep-sea
sharks from the Chatham Rise, New Zealand', Comparative Biochemistry and
Physiology Part B: Biochemistry and Molecular Biology, 125(4), pp. 511-521.
143
Yang, L., Takase, M., Zhang, M., Zhao, T. and Wu, X. (2014) 'Potential non-edible oil
feedstock for biodiesel production in Africa: A survey', Renewable and Sustainable
Energy Reviews, 38, pp. 461-477.
Yokochi, T., Usita, M.T., Kamisaka, Y., Nakahara, T. and Suzuki, O. (1990) 'Increase in the
γ-linolenic acid content by solvent winterization of fungal oil extracted
fromMortierella genus', Journal of the American Oil Chemists’ Society, 67(11), pp.
846-851.
Zabeti, M., Wan Daud, W.M.A. and Aroua, M.K. (2009) 'Activity of solid catalysts for
biodiesel production: A review', Fuel Processing Technology, 90(6), pp. 770-777.
Zhang, Y., Dube, M.A., McLean, D.D.L. and Kates, M. (2003a) 'Biodiesel production from
waste cooking oil: 1. Process design and technological assessment', Bioresource
technology, 89(1), pp. 1-16.
Zhang, Y.A., Dubé, M.A., McLean, D. and Kates, M. (2003b) Biodiesel production from waste
cooking oil: 1. Process design and technological assessment.


I
Appendices
Appendix A: WSLO Fatty Acid Profile
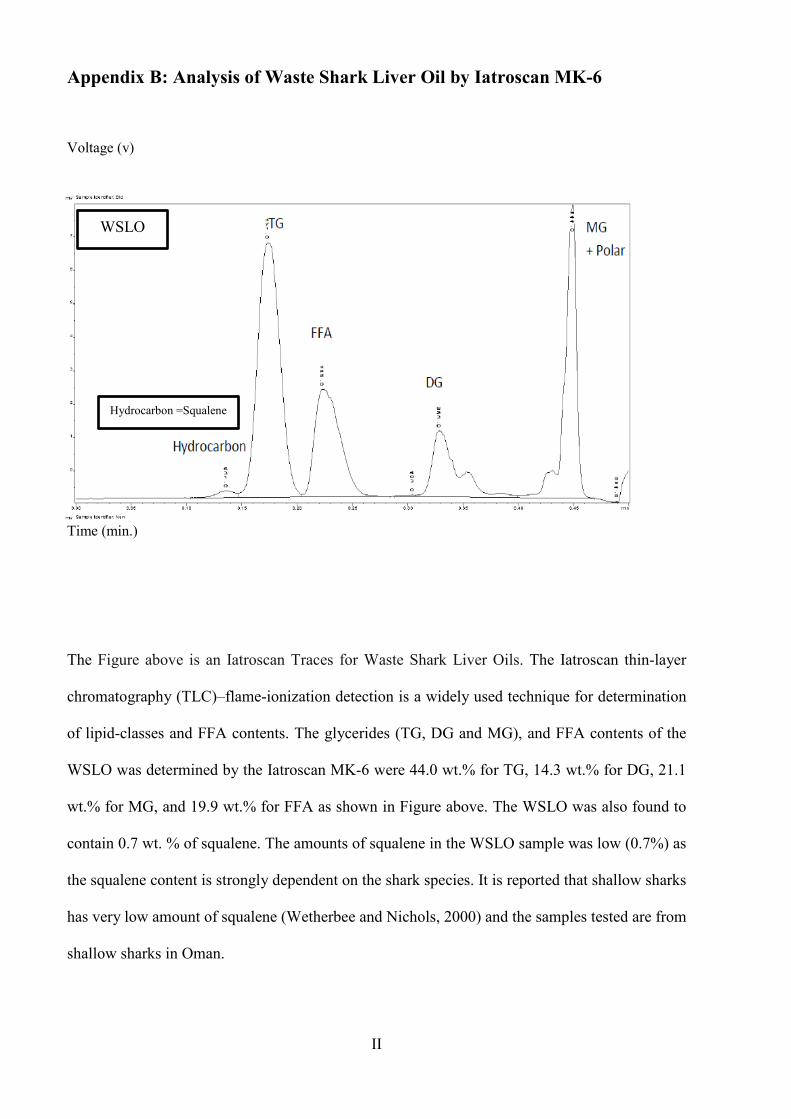
II
Appendix B: Analysis of Waste Shark Liver Oil by Iatroscan MK-6
Voltage (v)
Time (min.)
The Figure above is an Iatroscan Traces for Waste Shark Liver Oils. The Iatroscan thin-layer
chromatography (TLC)–flame-ionization detection is a widely used technique for determination
of lipid-classes and FFA contents. The glycerides (TG, DG and MG), and FFA contents of the
WSLO was determined by the Iatroscan MK-6 were 44.0 wt.% for TG, 14.3 wt.% for DG, 21.1
wt.% for MG, and 19.9 wt.% for FFA as shown in Figure above. The WSLO was also found to
contain 0.7 wt. % of squalene. The amounts of squalene in the WSLO sample was low (0.7%) as
the squalene content is strongly dependent on the shark species. It is reported that shallow sharks
has very low amount of squalene (Wetherbee and Nichols, 2000) and the samples tested are from
shallow sharks in Oman.
WSLO
Hydrocarbon =Squalene

III
Appendix C: GC Chromatogram showing squalene in the WSLO FAME Sample
Squalene
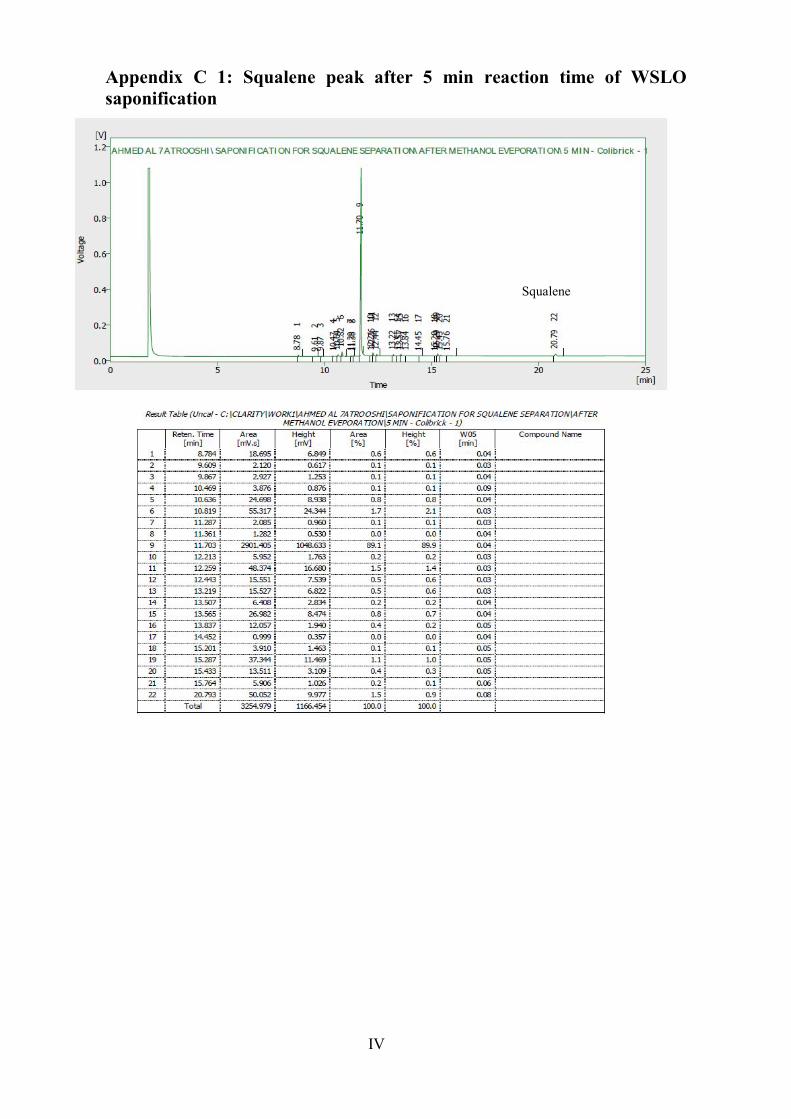
IV
Appendix C 1: Squalene peak after 5 min reaction time of WSLO saponification
Squalene
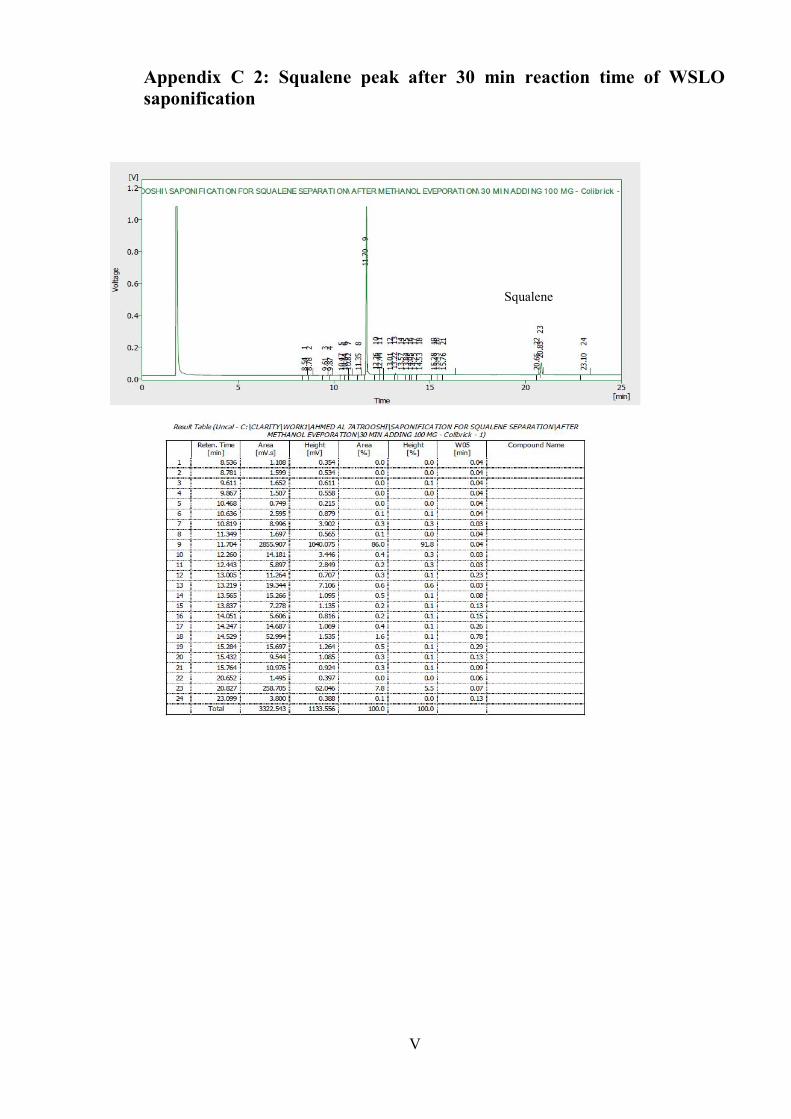
V
Appendix C 2: Squalene peak after 30 min reaction time of WSLO saponification
Squalene

VI
Appendix C 3 :Squalene peak after 60 min reaction time of WSLO saponification
Squalene

VII
Appendix C 4 : Squalene peak after washing
Squalene

VIII
Appendix D: European Biodiesel Specification EN 14214
European Biodiesel Specification EN 14214 (Barabás and Todoruț, 2011)

IX
Appendix E: ASTM Biodiesel Standard D 6751
(Knothe, 2006) ASTM Biodiesel Standard D 6751


![INDEX [ens.dk]...municipal bio-waste from the municipality is digested together with waste-water sludge. The plant was upgraded in 2016 into Billund Biorefinery with ... Administration](https://img.pdfslide.us/doc/110x75/5e26dac77a9bc25ead240f5c/index-ensdk-municipal-bio-waste-from-the-municipality-is-digested-together.jpg)