Embed Size (px)
Citation preview
OR I G INA L ART I C L E
A Major Human White Matter Pathway Between Dorsaland Ventral Visual CortexHiromasa Takemura1, Ariel Rokem1, JonathanWinawer2, Jason D. Yeatman1,3,Brian A. Wandell1, and Franco Pestilli1,4
1Department of Psychology, Stanford University, Stanford, CA, USA, 2Department of Psychology, New YorkUniversity, New York, NY, USA, 3Institute for Learning and Brain Science (ILABS), University of Washington,Seattle,WA, USA, and 4Department of Psychological and Brain Sciences, Programs in Neuroscience and CognitiveScience, Indiana University, Bloomington, IN, USA
Address correspondence to email: [email protected] (H.T.); [email protected] (F.P.)
AbstractHuman visual cortex comprisesmany visual fieldmaps organized into clusters. A standard organization separates visualmapsinto 2 distinct clusters within ventral and dorsal cortex. We combined fMRI, diffusion MRI, and fiber tractography to identify amajor white matter pathway, the vertical occipital fasciculus (VOF), connecting maps within the dorsal and ventral visualcortex. We use a model-based method to assess the statistical evidence supporting several aspects of the VOF wiring pattern.There is strong evidence supporting the hypothesis that dorsal and ventral visual maps communicate through the VOF. Thecortical projection zones of the VOF suggest that human ventral (hV4/VO-1) and dorsal (V3A/B) maps exchange substantialinformation. The VOF appears to be crucial for transmitting signals between regions that encode object properties includingform, identity, and color and regions that map spatial information.
Key words: diffusion-weighted MRI, fiber tractography, vertical occipital fasciculus, visual cortex, white matter
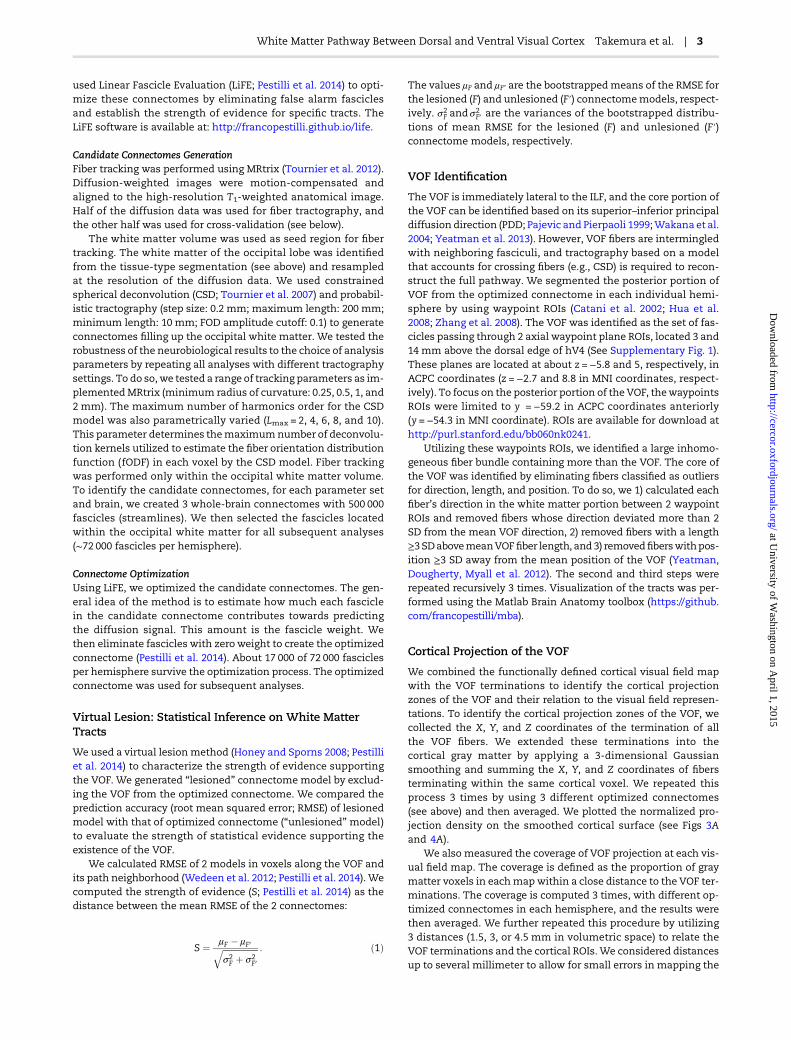
IntroductionOver the last several decades, visual neuroscientists have learnedhow to use fMRI to identify multiple visual field maps (Fig. 1) inthe living human brain (DeYoe et al. 1994; Engel et al. 1994,1997; Sereno et al. 1995; Wandell et al. 2007; Silver and Kastner2009; Wandell and Winawer 2011). Several theories have beenproposed to characterize the organization of these visual fieldmaps (Wandell et al. 2007). A key theory with substantial supportdistinguishes between maps located relatively dorsal and thoselocated relatively ventral (Ungerleider andMishkin 1982; Goodaleand Milner 1992; Kravitz et al. 2013).
According to this theory, the ventral stream ismainly engagedin interpreting the properties of color, form, and objects. For ex-ample, several lateral and ventral visual field maps in humans(Fig. 1B) have clear stimulus selectivity, such as color selective
response in hV4 (Zeki et al. 1991; McKeefry and Zeki 1997; Bartelsand Zeki 2000; Wade et al. 2002, 2008; Winawer et al. 2010; God-dard et al. 2011) and shape selective responses in the lateraloccipital (LO) areas (Malach et al. 1995; Grill-Spector et al. 2001;Larsson and Heeger 2006; Amano et al. 2009). The dorsal streamis engaged in interpreting spatial organization and guidingaction, and dorsal maps in humans (Fig. 1A) have selectivity formotion and disparity (Tootell et al. 1997; Tsao et al. 2003; McKee-fry et al. 2008) and spatial attention (Tootell et al. 1998; Schlup-peck et al. 2005; Silver et al. 2005; Swisher et al. 2007; Silver andKastner 2009).
Whereas responses to stimuli in the 2 streams differ (Ungerlei-der and Mishkin 1982; Goodale and Milner 1992), there are alsoexamples showing relationships between responses measuredin these 2 streams (Grill-Spector et al. 1998, 2000; James et al.
© The Author 2015. Published by Oxford University Press. All rights reserved. For Permissions, please e-mail: [email protected]
Cerebral Cortex, 2015, 1–10
doi: 10.1093/cercor/bhv064Original Article
1
Cerebral Cortex Advance Access published March 31, 2015 at U
niversity of Washington on A
pril 1, 2015http://cercor.oxfordjournals.org/
Dow
nloaded from
2002; Kriegeskorte et al. 2003; Fang and He 2005; Tolias et al. 2005;Konen and Kastner 2008). It seems quite likely that long-rangewhitematter projectionsmust carry the information that commu-nicates between at least some of the maps in these 2 streams.
This study defines the anatomical location and cortical pro-jections of the only known candidate white matter pathway forconnecting occipital dorsal and ventral streams. This pathway,the vertical occipital fasiculus (VOF; Wernicke 1881; Yeatmanet al. 2013), is little discussed in the vision and cognitive neurosci-ence literature (Yeatman, Weiner et al. 2014), yet it may be thecrucial pathway transmitting signals between these 2 importantstreams. Finally, we identify a key role for visual hemifield mapsV3A/B and hV4/VO-1 which are the principal cortical projectionzones of this pathway.
Materials and MethodsMR Data Acquisition and Preprocessing
SubjectsDiffusion-weighted magnetic resonance imaging (DWI) datawere collected at Stanford’s Center for Cognitive and Neurobio-logical Imaging (http://cni.stanford.edu/). Five human subjectswith normal or corrected-to-normal visual acuity participatedin the study (5 males; age range 27–40, mean age 32.6 yearsold). All subjects participated in 1 scanning session to obtain ahigh-resolution T1-weighted anatomical volume, 1–3 functionalMRI sessions to measure visual field maps, and 1 diffusion MRIsession to measure high-spatial and high-angular resolution dif-fusionMRI (HARDI) data. Informedwritten consent was obtainedfromall subjects. The experimental procedureswere approved bythe Stanford University Institutional Review Board. The diffusiondataset was used in other publications (Pestilli et al. 2014; Rokemet al. 2015).
Diffusion DataA dual-spin echo diffusion-weighted sequence (Reese et al. 2003)was used. In each scan, MR images were acquired for 96 differentdirections of diffusion weighting. The spatial resolution of themeasurement was 1.5 × 1.5 × 1.5 mm. The b-value was set to2000 s/mm2 and TE was 96.8 ms. Ten nondiffusion-weightedimages (b = 0) were acquired at the beginning of each scan. Twoscans were performed.
MR images were motion corrected to the average b = 0 imagein each scan, using a rigid body alignment algorithm, implemen-ted in SPM (Friston and Ashburner 2004). The direction of the dif-fusion gradient in each diffusion-weighted volumewas correctedusing the rotation parameters from the motion correction pro-cedure. Because of the relatively long duration between the RFexcitation and image acquisition in the dual-spin echo sequenceused, there is sufficient time for eddy currents to subside. Hence,eddy current correction was not applied. All preprocessing stepshave been implemented inMatlab as part of themrVista softwaredistribution (https://github.com/vistalab/vistasoft).
For post hoc correction of EPI spatial distortion, measurementsof the B0 magnetic field were performed to DWI data. Field mapswere collected in the same slices as the functional data using a16-shot, gradient echo spiral trajectory pulse sequence. Two vo-lumes were successively acquired, one with TE set to 9.091 msand one with TE increased by 2.272 ms, and the phase differencebetween the volumes was used as an estimate of the magneticfield. To track slow drifts in the magnetic field (e.g., due to gradi-ent heating), field maps were collected before and after the diffu-sion runs as well as periodically between diffusion runs.
Anatomical MRI Acquisition and Tissue SegmentationThewhite and graymatter borderwasdefinedusing a T1-weightedFSPGR image (0.7 × 0.7 × 0.7 mm in 4 subjects and 1 × 1 × 1 mm in 1subject). White/graymatter tissue contrast was increased by aver-aging 4 T1 measurements acquired in the same scan session. Aninitial segmentation was performed using an automated proced-ure in Freesurfer (Fischl 2012) and refined manually (Yushkevichet al. 2006) (http://www.itksnap.org/pmwiki/pmwiki.php).
Functional Data and Visual Field Maps EstimationThe visual field maps in each hemisphere were identified usingthe population receptive field (pRF) modeling for fMRI data(Dumoulin and Wandell 2008). Subjects participated in at least4 fMRI scans (TR; 1.5 s; voxel size; 2.5 mm isotropic in 4 subjectsand 2.5 × 2.5 × 3 mm in 1 subject). Stimulus design and analysismethods were the same as the bar scans used in previous studies(Dumoulin and Wandell 2008; Amano et al. 2009; Winawer et al.2010).
Retinotopic maps were created by projecting the pRF esti-mates onto cortical surfaces. The borders between most visualareas (V1, V2, V3, V3A/B, hV4, VO-1, VO-2, LO-1, and LO-2) weremarkedmanually at the reversals in polar angles. The borders be-tween hV4 and VO-1 are determined by an eccentricity reversal(Brewer et al. 2005) and an anatomical landmark (Witthoft et al.2014). VO-2 was not identified in 2 of 10 hemispheres. MapsV3A and V3B were combined in the main analyses, because wecould identify the boundary between these maps in only 8 of 10hemispheres. We performed 1 additional analysis separatingV3A and V3B in these 8 hemispheres.
Selection and Validation of White matter Connectomes
We used probabilistic tractography to generate candidate con-nectome of the human occipital lobe (Tournier et al. 2012). We
V1
V2dV3d
V3A
V3B
hV4
LO-1LO-2TO-1
V1V2v
V3v
hV4 VO-1VO-2
V2d
V3d
B
A
Figure 1. The human dorsal and ventral visual fieldmaps. (A) Lateral view of dorsal
visual fieldmaps. (B) Medial view of ventral visual fieldmaps. Rectangular outlines
in the left panels indicate the region magnified in right panel. LO, lateral occipital;
TO, temporal occipital; VO, ventral occipital (Brewer et al. 2005; Larsson andHeeger
2006; Amano et al. 2009).
2 | Cerebral Cortex
at University of W
ashington on April 1, 2015
http://cercor.oxfordjournals.org/D
ownloaded from
used Linear Fascicle Evaluation (LiFE; Pestilli et al. 2014) to opti-mize these connectomes by eliminating false alarm fasciclesand establish the strength of evidence for specific tracts. TheLiFE software is available at: http://francopestilli.github.io/life.
Candidate Connectomes GenerationFiber tracking was performed using MRtrix (Tournier et al. 2012).Diffusion-weighted images were motion-compensated andaligned to the high-resolution T1-weighted anatomical image.Half of the diffusion data was used for fiber tractography, andthe other half was used for cross-validation (see below).
The white matter volume was used as seed region for fibertracking. The white matter of the occipital lobe was identifiedfrom the tissue-type segmentation (see above) and resampledat the resolution of the diffusion data. We used constrainedspherical deconvolution (CSD; Tournier et al. 2007) and probabil-istic tractography (step size: 0.2 mm; maximum length: 200 mm;minimum length: 10 mm; FOD amplitude cutoff: 0.1) to generateconnectomes filling up the occipital white matter. We tested therobustness of the neurobiological results to the choice of analysisparameters by repeating all analyses with different tractographysettings. To do so, we tested a range of tracking parameters as im-plementedMRtrix (minimum radius of curvature: 0.25, 0.5, 1, and2 mm). The maximum number of harmonics order for the CSDmodel was also parametrically varied (Lmax = 2, 4, 6, 8, and 10).This parameter determines themaximumnumber of deconvolu-tion kernels utilized to estimate the fiber orientation distributionfunction (fODF) in each voxel by the CSD model. Fiber trackingwas performed only within the occipital white matter volume.To identify the candidate connectomes, for each parameter setand brain, we created 3 whole-brain connectomes with 500 000fascicles (streamlines). We then selected the fascicles locatedwithin the occipital white matter for all subsequent analyses(∼72 000 fascicles per hemisphere).
Connectome OptimizationUsing LiFE, we optimized the candidate connectomes. The gen-eral idea of the method is to estimate how much each fasciclein the candidate connectome contributes towards predictingthe diffusion signal. This amount is the fascicle weight. Wethen eliminate fascicles with zeroweight to create the optimizedconnectome (Pestilli et al. 2014). About 17 000 of 72 000 fasciclesper hemisphere survive the optimization process. The optimizedconnectome was used for subsequent analyses.
Virtual Lesion: Statistical Inference on White MatterTracts
We used a virtual lesion method (Honey and Sporns 2008; Pestilliet al. 2014) to characterize the strength of evidence supportingthe VOF. We generated “lesioned” connectome model by exclud-ing the VOF from the optimized connectome. We compared theprediction accuracy (root mean squared error; RMSE) of lesionedmodel with that of optimized connectome (“unlesioned” model)to evaluate the strength of statistical evidence supporting theexistence of the VOF.
We calculated RMSE of 2 models in voxels along the VOF andits path neighborhood (Wedeen et al. 2012; Pestilli et al. 2014). Wecomputed the strength of evidence (S; Pestilli et al. 2014) as thedistance between the mean RMSE of the 2 connectomes:
S ¼ μF � μF0ffiffiffiffiffiffiffiffiffiffiffiffiffiffiffiffiffiσ2F þ σ2
F0
q : ð1Þ
The values μF and μF’ are the bootstrappedmeans of the RMSE forthe lesioned (F) and unlesioned (F′) connectomemodels, respect-ively. σ2
F and σ2F0 are the variances of the bootstrapped distribu-
tions of mean RMSE for the lesioned (F) and unlesioned (F′)connectome models, respectively.
VOF Identification
The VOF is immediately lateral to the ILF, and the core portion ofthe VOF can be identified based on its superior–inferior principaldiffusion direction (PDD; Pajevic and Pierpaoli 1999;Wakana et al.2004; Yeatman et al. 2013). However, VOF fibers are intermingledwith neighboring fasciculi, and tractography based on a modelthat accounts for crossing fibers (e.g., CSD) is required to recon-struct the full pathway. We segmented the posterior portion ofVOF from the optimized connectome in each individual hemi-sphere by using waypoint ROIs (Catani et al. 2002; Hua et al.2008; Zhang et al. 2008). The VOF was identified as the set of fas-cicles passing through 2 axial waypoint plane ROIs, located 3 and14 mm above the dorsal edge of hV4 (See Supplementary Fig. 1).These planes are located at about z =−5.8 and 5, respectively, inACPC coordinates (z = −2.7 and 8.8 in MNI coordinates, respect-ively). To focus on the posterior portion of the VOF, thewaypointsROIs were limited to y = −59.2 in ACPC coordinates anteriorly(y =−54.3 in MNI coordinate). ROIs are available for download athttp://purl.stanford.edu/bb060nk0241.
Utilizing these waypoints ROIs, we identified a large inhomo-geneous fiber bundle containing more than the VOF. The core ofthe VOF was identified by eliminating fibers classified as outliersfor direction, length, and position. To do so, we 1) calculated eachfiber’s direction in the white matter portion between 2 waypointROIs and removed fibers whose direction deviated more than 2SD from the mean VOF direction, 2) removed fibers with a length≥3SDabovemeanVOFfiber length, and3) removedfiberswithpos-ition ≥3 SD away from the mean position of the VOF (Yeatman,Dougherty, Myall et al. 2012). The second and third steps wererepeated recursively 3 times. Visualization of the tracts was per-formed using the Matlab Brain Anatomy toolbox (https://github.com/francopestilli/mba).
Cortical Projection of the VOF
We combined the functionally defined cortical visual field mapwith the VOF terminations to identify the cortical projectionzones of the VOF and their relation to the visual field represen-tations. To identify the cortical projection zones of the VOF, wecollected the X, Y, and Z coordinates of the termination of allthe VOF fibers. We extended these terminations into thecortical gray matter by applying a 3-dimensional Gaussiansmoothing and summing the X, Y, and Z coordinates of fibersterminating within the same cortical voxel. We repeated thisprocess 3 times by using 3 different optimized connectomes(see above) and then averaged. We plotted the normalized pro-jection density on the smoothed cortical surface (see Figs 3Aand 4A).
We also measured the coverage of VOF projection at each vis-ual field map. The coverage is defined as the proportion of graymatter voxels in eachmapwithin a close distance to the VOF ter-minations. The coverage is computed 3 times, with different op-timized connectomes in each hemisphere, and the results werethen averaged. We further repeated this procedure by utilizing3 distances (1.5, 3, or 4.5 mm in volumetric space) to relate theVOF terminations and the cortical ROIs. We considered distancesup to several millimeter to allow for small errors in mapping the
White Matter Pathway Between Dorsal and Ventral Visual Cortex Takemura et al. | 3
at University of W
ashington on April 1, 2015
http://cercor.oxfordjournals.org/D
ownloaded from
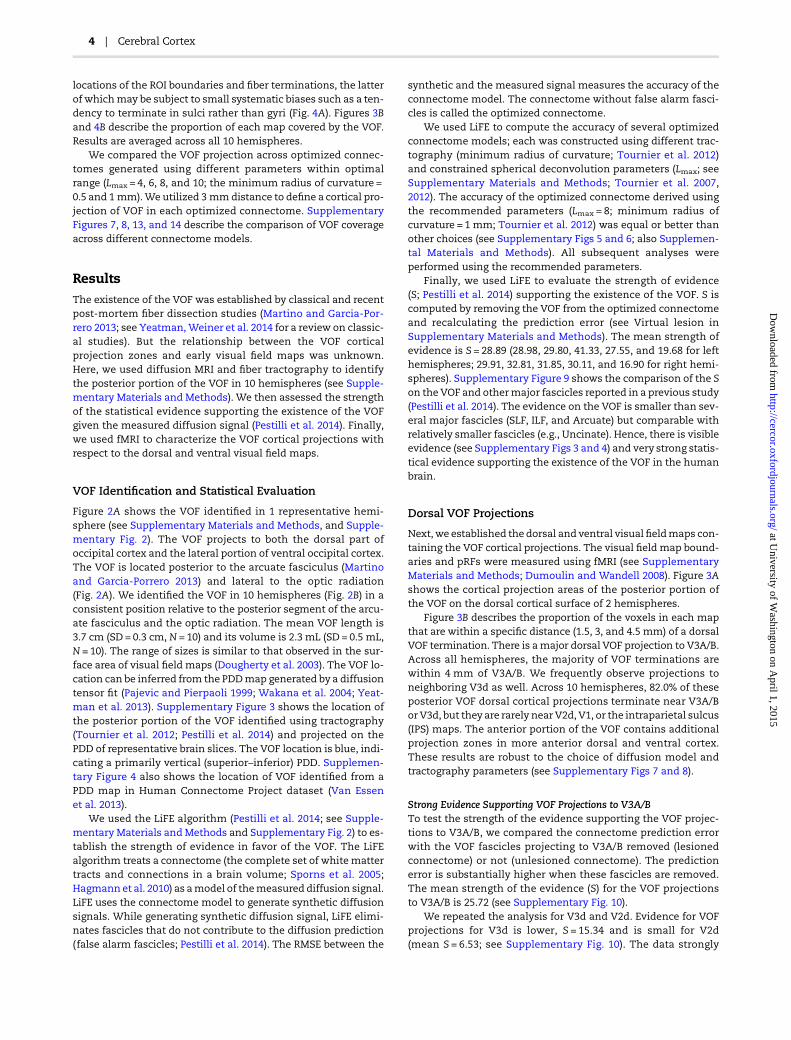
locations of the ROI boundaries and fiber terminations, the latterof whichmay be subject to small systematic biases such as a ten-dency to terminate in sulci rather than gyri (Fig. 4A). Figures 3Band 4B describe the proportion of each map covered by the VOF.Results are averaged across all 10 hemispheres.
We compared the VOF projection across optimized connec-tomes generated using different parameters within optimalrange (Lmax = 4, 6, 8, and 10; the minimum radius of curvature =0.5 and 1 mm).We utilized 3 mmdistance to define a cortical pro-jection of VOF in each optimized connectome. SupplementaryFigures 7, 8, 13, and 14 describe the comparison of VOF coverageacross different connectome models.
ResultsThe existence of the VOF was established by classical and recentpost-mortem fiber dissection studies (Martino and Garcia-Por-rero 2013; see Yeatman,Weiner et al. 2014 for a review on classic-al studies). But the relationship between the VOF corticalprojection zones and early visual field maps was unknown.Here, we used diffusion MRI and fiber tractography to identifythe posterior portion of the VOF in 10 hemispheres (see Supple-mentary Materials and Methods). We then assessed the strengthof the statistical evidence supporting the existence of the VOFgiven the measured diffusion signal (Pestilli et al. 2014). Finally,we used fMRI to characterize the VOF cortical projections withrespect to the dorsal and ventral visual field maps.
VOF Identification and Statistical Evaluation
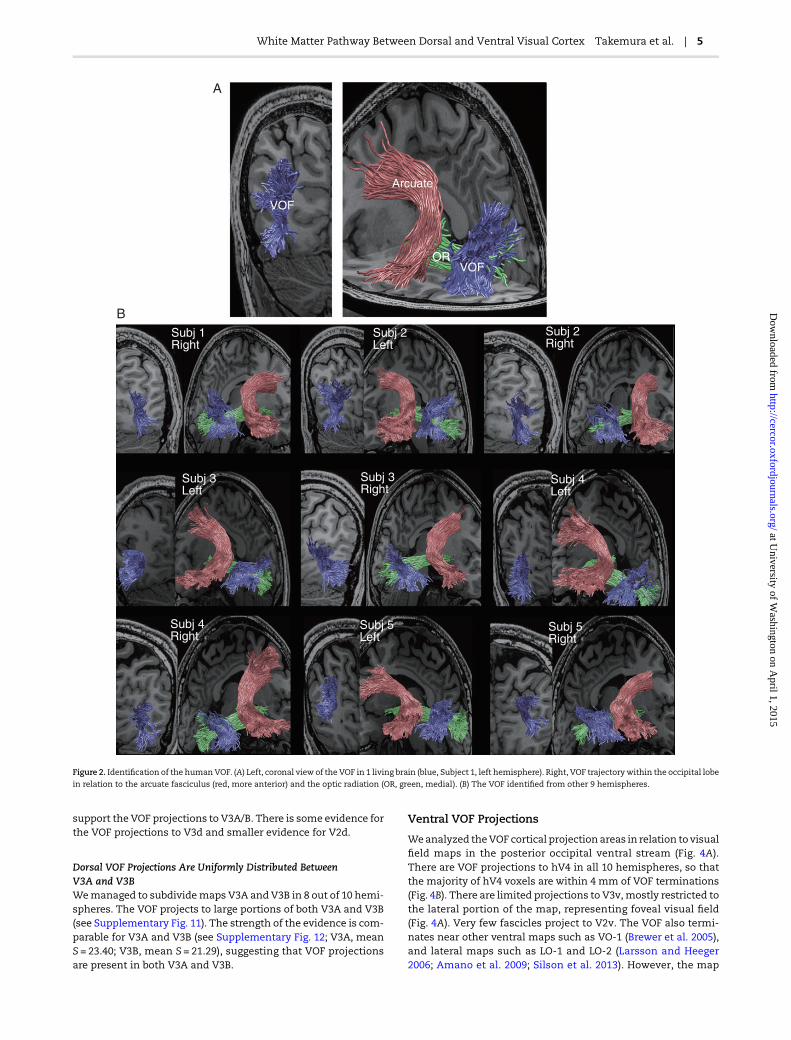
Figure 2A shows the VOF identified in 1 representative hemi-sphere (see Supplementary Materials and Methods, and Supple-mentary Fig. 2). The VOF projects to both the dorsal part ofoccipital cortex and the lateral portion of ventral occipital cortex.The VOF is located posterior to the arcuate fasciculus (Martinoand Garcia-Porrero 2013) and lateral to the optic radiation(Fig. 2A). We identified the VOF in 10 hemispheres (Fig. 2B) in aconsistent position relative to the posterior segment of the arcu-ate fasciculus and the optic radiation. The mean VOF length is3.7 cm (SD = 0.3 cm, N = 10) and its volume is 2.3 mL (SD = 0.5 mL,N = 10). The range of sizes is similar to that observed in the sur-face area of visual field maps (Dougherty et al. 2003). The VOF lo-cation can be inferred from the PDDmap generated by a diffusiontensor fit (Pajevic and Pierpaoli 1999; Wakana et al. 2004; Yeat-man et al. 2013). Supplementary Figure 3 shows the location ofthe posterior portion of the VOF identified using tractography(Tournier et al. 2012; Pestilli et al. 2014) and projected on thePDD of representative brain slices. The VOF location is blue, indi-cating a primarily vertical (superior–inferior) PDD. Supplemen-tary Figure 4 also shows the location of VOF identified from aPDD map in Human Connectome Project dataset (Van Essenet al. 2013).
We used the LiFE algorithm (Pestilli et al. 2014; see Supple-mentary Materials andMethods and Supplementary Fig. 2) to es-tablish the strength of evidence in favor of the VOF. The LiFEalgorithm treats a connectome (the complete set of white mattertracts and connections in a brain volume; Sporns et al. 2005;Hagmann et al. 2010) as amodel of themeasured diffusion signal.LiFE uses the connectome model to generate synthetic diffusionsignals. While generating synthetic diffusion signal, LiFE elimi-nates fascicles that do not contribute to the diffusion prediction(false alarm fascicles; Pestilli et al. 2014). The RMSE between the
synthetic and the measured signal measures the accuracy of theconnectome model. The connectome without false alarm fasci-cles is called the optimized connectome.
We used LiFE to compute the accuracy of several optimizedconnectome models; each was constructed using different trac-tography (minimum radius of curvature; Tournier et al. 2012)and constrained spherical deconvolution parameters (Lmax; seeSupplementary Materials and Methods; Tournier et al. 2007,2012). The accuracy of the optimized connectome derived usingthe recommended parameters (Lmax = 8; minimum radius ofcurvature = 1 mm; Tournier et al. 2012) was equal or better thanother choices (see Supplementary Figs 5 and 6; also Supplemen-tal Materials and Methods). All subsequent analyses wereperformed using the recommended parameters.
Finally, we used LiFE to evaluate the strength of evidence(S; Pestilli et al. 2014) supporting the existence of the VOF. S iscomputed by removing the VOF from the optimized connectomeand recalculating the prediction error (see Virtual lesion inSupplementary Materials and Methods). The mean strength ofevidence is S = 28.89 (28.98, 29.80, 41.33, 27.55, and 19.68 for lefthemispheres; 29.91, 32.81, 31.85, 30.11, and 16.90 for right hemi-spheres). Supplementary Figure 9 shows the comparison of the Son the VOF and othermajor fascicles reported in a previous study(Pestilli et al. 2014). The evidence on the VOF is smaller than sev-eral major fascicles (SLF, ILF, and Arcuate) but comparable withrelatively smaller fascicles (e.g., Uncinate). Hence, there is visibleevidence (see Supplementary Figs 3 and 4) and very strong statis-tical evidence supporting the existence of the VOF in the humanbrain.
Dorsal VOF Projections
Next,we established the dorsal and ventral visualfieldmaps con-taining the VOF cortical projections. The visual field map bound-aries and pRFs were measured using fMRI (see SupplementaryMaterials and Methods; Dumoulin and Wandell 2008). Figure 3Ashows the cortical projection areas of the posterior portion ofthe VOF on the dorsal cortical surface of 2 hemispheres.
Figure 3B describes the proportion of the voxels in each mapthat are within a specific distance (1.5, 3, and 4.5 mm) of a dorsalVOF termination. There is amajor dorsal VOF projection to V3A/B.Across all hemispheres, the majority of VOF terminations arewithin 4 mm of V3A/B. We frequently observe projections toneighboring V3d as well. Across 10 hemispheres, 82.0% of theseposterior VOF dorsal cortical projections terminate near V3A/Bor V3d, but theyare rarely near V2d, V1, or the intraparietal sulcus(IPS) maps. The anterior portion of the VOF contains additionalprojection zones in more anterior dorsal and ventral cortex.These results are robust to the choice of diffusion model andtractography parameters (see Supplementary Figs 7 and 8).
Strong Evidence Supporting VOF Projections to V3A/BTo test the strength of the evidence supporting the VOF projec-tions to V3A/B, we compared the connectome prediction errorwith the VOF fascicles projecting to V3A/B removed (lesionedconnectome) or not (unlesioned connectome). The predictionerror is substantially higher when these fascicles are removed.The mean strength of the evidence (S) for the VOF projectionsto V3A/B is 25.72 (see Supplementary Fig. 10).
We repeated the analysis for V3d and V2d. Evidence for VOFprojections for V3d is lower, S = 15.34 and is small for V2d(mean S = 6.53; see Supplementary Fig. 10). The data strongly
4 | Cerebral Cortex
at University of W
ashington on April 1, 2015
http://cercor.oxfordjournals.org/D
ownloaded from
support the VOF projections to V3A/B. There is some evidence forthe VOF projections to V3d and smaller evidence for V2d.
Dorsal VOF Projections Are Uniformly Distributed BetweenV3A and V3BWemanaged to subdividemaps V3A and V3B in 8 out of 10 hemi-spheres. The VOF projects to large portions of both V3A and V3B(see Supplementary Fig. 11). The strength of the evidence is com-parable for V3A and V3B (see Supplementary Fig. 12; V3A, meanS = 23.40; V3B, mean S = 21.29), suggesting that VOF projectionsare present in both V3A and V3B.
Ventral VOF Projections
Weanalyzed theVOF cortical projection areas in relation tovisualfield maps in the posterior occipital ventral stream (Fig. 4A).There are VOF projections to hV4 in all 10 hemispheres, so thatthe majority of hV4 voxels are within 4 mm of VOF terminations(Fig. 4B). There are limited projections to V3v, mostly restricted tothe lateral portion of the map, representing foveal visual field(Fig. 4A). Very few fascicles project to V2v. The VOF also termi-nates near other ventral maps such as VO-1 (Brewer et al. 2005),and lateral maps such as LO-1 and LO-2 (Larsson and Heeger2006; Amano et al. 2009; Silson et al. 2013). However, the map
A
B
Figure 2. Identification of the humanVOF. (A) Left, coronal view of the VOF in 1 living brain (blue, Subject 1, left hemisphere). Right, VOF trajectory within the occipital lobe
in relation to the arcuate fasciculus (red, more anterior) and the optic radiation (OR, green, medial). (B) The VOF identified from other 9 hemispheres.
White Matter Pathway Between Dorsal and Ventral Visual Cortex Takemura et al. | 5
at University of W
ashington on April 1, 2015
http://cercor.oxfordjournals.org/D
ownloaded from
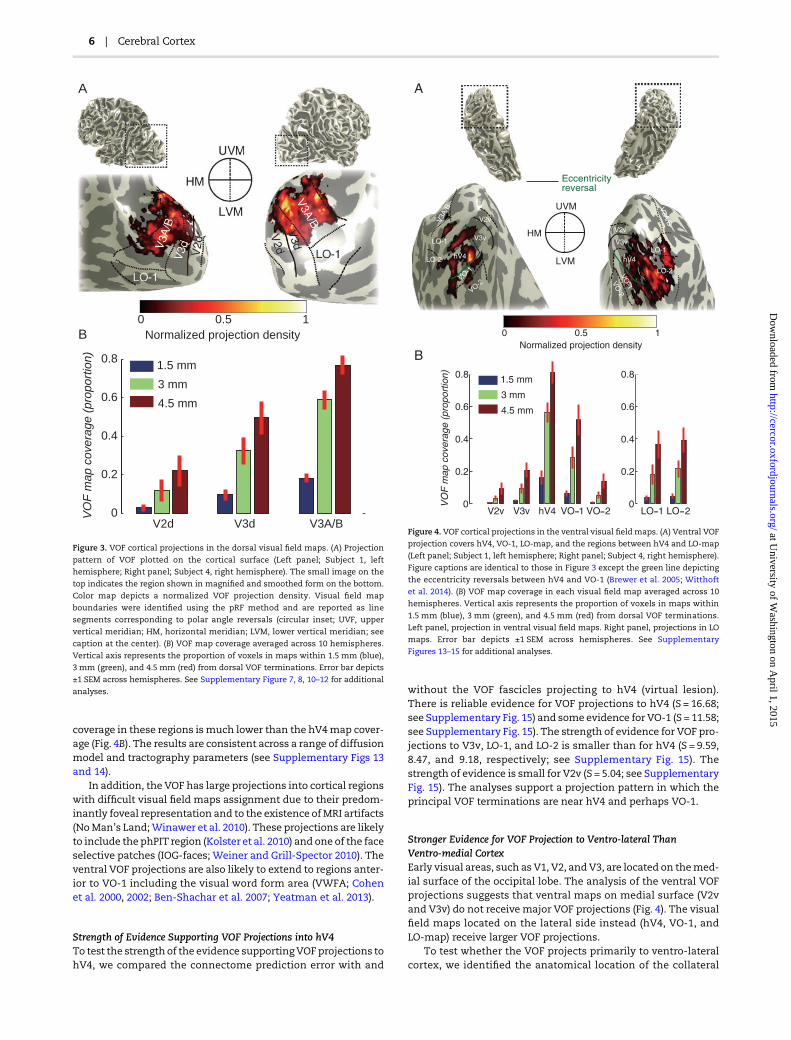
coverage in these regions ismuch lower than the hV4map cover-age (Fig. 4B). The results are consistent across a range of diffusionmodel and tractography parameters (see Supplementary Figs 13and 14).
In addition, the VOF has large projections into cortical regionswith difficult visual field maps assignment due to their predom-inantly foveal representation and to the existence ofMRI artifacts(NoMan’s Land;Winawer et al. 2010). These projections are likelyto include the phPIT region (Kolster et al. 2010) and one of the faceselective patches (IOG-faces; Weiner and Grill-Spector 2010). Theventral VOF projections are also likely to extend to regions anter-ior to VO-1 including the visual word form area (VWFA; Cohenet al. 2000, 2002; Ben-Shachar et al. 2007; Yeatman et al. 2013).
Strength of Evidence Supporting VOF Projections into hV4To test the strength of the evidence supportingVOFprojections tohV4, we compared the connectome prediction error with and
without the VOF fascicles projecting to hV4 (virtual lesion).There is reliable evidence for VOF projections to hV4 (S = 16.68;see Supplementary Fig. 15) and some evidence for VO-1 (S = 11.58;see Supplementary Fig. 15). The strength of evidence for VOF pro-jections to V3v, LO-1, and LO-2 is smaller than for hV4 (S = 9.59,8.47, and 9.18, respectively; see Supplementary Fig. 15). Thestrength of evidence is small for V2v (S = 5.04; see SupplementaryFig. 15). The analyses support a projection pattern in which theprincipal VOF terminations are near hV4 and perhaps VO-1.
Stronger Evidence for VOF Projection to Ventro-lateral ThanVentro-medial CortexEarly visual areas, such as V1, V2, and V3, are located on themed-ial surface of the occipital lobe. The analysis of the ventral VOFprojections suggests that ventral maps on medial surface (V2vand V3v) do not receive major VOF projections (Fig. 4). The visualfield maps located on the lateral side instead (hV4, VO-1, andLO-map) receive larger VOF projections.
To test whether the VOF projects primarily to ventro-lateralcortex, we identified the anatomical location of the collateral
Normalized projection density0 0.5 1
VO
F m
ap c
over
age
(pro
port
ion) 1.5 mm
3 mm
4.5 mm
V2d V3d V3A/B0
0.2
0.4
0.6
0.8
A
B
Figure 3. VOF cortical projections in the dorsal visual field maps. (A) Projection
pattern of VOF plotted on the cortical surface (Left panel; Subject 1, left
hemisphere; Right panel; Subject 4, right hemisphere). The small image on the
top indicates the region shown in magnified and smoothed form on the bottom.
Color map depicts a normalized VOF projection density. Visual field map
boundaries were identified using the pRF method and are reported as line
segments corresponding to polar angle reversals (circular inset; UVF, upper
vertical meridian; HM, horizontal meridian; LVM, lower vertical meridian; see
caption at the center). (B) VOF map coverage averaged across 10 hemispheres.
Vertical axis represents the proportion of voxels in maps within 1.5 mm (blue),
3 mm (green), and 4.5 mm (red) from dorsal VOF terminations. Error bar depicts
±1 SEM across hemispheres. See Supplementary Figure 7, 8, 10–12 for additional
analyses.
A
B
Figure 4. VOF cortical projections in the ventral visual field maps. (A) Ventral VOF
projection covers hV4, VO-1, LO-map, and the regions between hV4 and LO-map
(Left panel; Subject 1, left hemisphere; Right panel; Subject 4, right hemisphere).
Figure captions are identical to those in Figure 3 except the green line depicting
the eccentricity reversals between hV4 and VO-1 (Brewer et al. 2005; Witthoft
et al. 2014). (B) VOF map coverage in each visual field map averaged across 10
hemispheres. Vertical axis represents the proportion of voxels in maps within
1.5 mm (blue), 3 mm (green), and 4.5 mm (red) from dorsal VOF terminations.
Left panel, projection in ventral visual field maps. Right panel, projections in LO
maps. Error bar depicts ±1 SEM across hemispheres. See Supplementary
Figures 13–15 for additional analyses.
6 | Cerebral Cortex
at University of W
ashington on April 1, 2015
http://cercor.oxfordjournals.org/D
ownloaded from
sulcus (CoS; see Supplementary Fig. 16A and B) in each hemi-sphere. The CoS separates ventro-lateral from ventro-medialVOF fascicles (see Supplementary Fig. 16C). We then tested thestrength of the evidence supporting VOF projections to eitherside of CoS by computing S for the medial and lateral fascicles.The scatter plot compares the strength of the evidence support-ing lateral compared with that for medial-ventral VOF projec-tions (see Supplementary Fig. 16D). The strength of theevidence supporting VOF projections into ventro-lateral cortexis substantially larger than that for ventro-medial projections.Hence, the VOF mainly connects dorsal and ventro-lateralregions.
DiscussionThe dorsal and ventralmap connectionsmediated by the VOFareillustrated schematically in Figure 5. Dorsal VOF projections aredense in V3A/B and extend to V3d (green). Ventral VOF projec-tions cover a wide area on the ventral surface, principally onthe lateral surface (pink). VOF cortical projections terminate inhV4, VO-1, and LO-1/LO-2 as well as the cortical region betweenthese maps, which has not yet been definitively mapped (NoMan’s Land; Winawer et al. 2010).
VOF and Visual Field Map Functionality
The anatomy suggests that the VOF carries signals between ventralregions that encode object properties including form, identify, andcolor information (Zeki et al. 1991; Malach et al. 1995; McKeefry andZeki 1997; Cohen et al. 2000; Wade et al. 2002, 2008) and dorsal re-gions that map spatial location to action plans (Tootell et al. 1997;Tsao et al. 2003; Fischer et al. 2012; Merriam et al. 2013).
A number of previous fMRI studies reported concurrent acti-vation in dorsal and ventral regions for particular sets of stimulias well as a clear similarity between some dorsal and ventralareas in terms of stimulus selectivity. For example, Grill-Spectorand colleagues (1998) compared cortical activation for motion-defined form stimuli and moving noise stimuli. They found con-current activation in dorsal (V3A) and ventral stream (LO) regionsfor motion-defined stimuli, suggesting that communicationbetween the dorsal and ventral streams plays a role in cue
invariance in object recognition. Complimenting these findings,there are studies showing object-selective responses in dorsalregions (Grill-Spector et al. 2000; James et al. 2002; Fang and He2005; Konen and Kastner 2008; Vinberg and Grill-Spector 2008).Rokers and colleagues (2009) reported that in addition to hMT+and V3A, LO also showed selectivity for 3-dimensional motion.Costagli and colleagues (2014) measured the cortical responseto increments and decrements of motion coherence, and identi-fied that V3B and hV4 similarly showed positive responses toboth increments and decrements. Other lines of studies (Döven-cioglu et al. 2013; Murphy et al. 2013) demonstrated that V3B is in-volved in stereo cue integration (disparity, texture, and shade),which could be the outcome of dorsal-ventral communication.A recent study (Saber et al. 2015) showed that saccade planningevokes BOLD activity not only in dorsal (V3A/B, IPS0) but also inventral visual areas (hV4, VO-1). All of these studies suggest sub-stantial communication between the dorsal and ventral maps.The anatomical description of the VOF makes it the likely path-way to carry signals coordinating dorsal and ventral streamprocessing.
Comparison Between Human and Macaque
There are many functional and structural differences betweenvisual cortex in human and macaque. For example, concerningthe visual field maps, interspecies differences have been identi-fied in the position of V4 (McKeefry and Zeki 1997; Wade et al.2008; Arcaro et al. 2009; Winawer et al. 2010; Goddard et al.2011; Witthoft et al. 2014), the volume of V3 (Brewer et al. 2002;Dougherty et al. 2003; Lyon and Connolly 2012), and responsesto moving stimuli in V3A (Tootell et al. 1997; Vanduffel et al.2001). Moreover, there are no certain homologies between thehuman V3B (Smith et al. 1998; Press et al. 2001) and the LO-maps (Larsson and Heeger 2006; Amano et al. 2009) andmacaquemaps. All of these maps have been identified as VOF termina-tions in this study.
Given these significant interspecies differences, it is import-ant to understand white matter tracts and their cortical projec-tion zones in human directly. Identifying the path of the whitematter tracts in humans has the added advantage that propertiesof the tracts can be studied in relation to health, disease, and de-velopment (Dougherty et al. 2007; Fields 2008; Thomas et al. 2009;Thiebaut de Schotten et al. 2011; Thomason andThompson 2011;Lebel et al. 2012; Wandell et al. 2012; Yeatman, Dougherty, Ben-Shachar et al. 2012; Johnson et al. 2013; Wandell and Yeatman2013; Ogawa et al. 2014; Tavor et al. 2014; Yeatman, Wandellet al. 2014; Allen et al. 2015; Gomez et al. 2015).
The present study extends post-mortemmacaque brain stud-ies (Felleman and Van Essen 1991; Ungerleider et al. 2008) to invivo methods in the human brain. We have learned that theVOF is amajor tract occupying a substantial volume of the occipi-tal whitematter.We show that its path and projections can be re-liably defined using modern diffusion MRI methods in livingbrains. This is the first study to characterize the cortical projec-tions of the VOF in relation to the visual field maps.
Early Hubs of Ventro-Dorsal Visual Communication
Primate V2 and V3 have split representations of the contralateralhemifield, with dorsal and ventral regions responding to stimuliin the lower andupper quarterfields, respectively. In humans, thevisual field maps adjacent and anterior to V3 are not split: thesemaps have a full hemifield representation confined within thedorsal (V3A/B) and ventral (hV4 and VO-1) surfaces (Tootell
Figure 5. The VOF communication diagram. Schematic diagram of the VOF
projections. Visual field topography was described in a flattened format for the
right hemisphere (Larsson and Heeger 2006). Gray regions depict the projection
zone of VOF (light gray, dorsal; dark gray, ventral).
White Matter Pathway Between Dorsal and Ventral Visual Cortex Takemura et al. | 7
at University of W
ashington on April 1, 2015
http://cercor.oxfordjournals.org/D
ownloaded from
et al. 1997; Press et al. 2001; Brewer et al. 2005; Arcaro et al. 2009;Winawer et al. 2010; Goddard et al. 2011; Wandell and Winawer2011). Because of their hemifield representation, these mapsare natural candidates for information hubs that communicatebetween ventral and dorsal streams. We have shown that theVOF communicates preferentially between these maps. Futuremeasurements and models will benefit from mapping the func-tional responses of these maps in humans and by consideringtheir potential role as communication hubs between dorsal andventral cortex.
ConclusionMany cognitive activities such as reading this page require fastand accurate coordination between motor actions (e.g., eyemovements) and object identification (e.g., word recognition;Vidyasagar and Pammer 2010). The human brain comprisesdistinct cortical regions specialized for seeing objects and pro-cessing spatial information that are separated by several centi-meters in ventral and dorsal occipital cortex. The anatomy ofthe human brain requires a major white matter communicationpathway between the dorsal and ventral streams. The VOF is astrong candidate for channeling communication between dorsaland ventral visual streams. Characterizing the VOF in individual,living human brains provides a new opportunity for understand-ing how signals pass between dorsal and ventral visual cortexand to understand the role of these signals in health and disease.
Supplementary MaterialSupplementary material can be found at: http://www.cercor.oxfordjournals.org/.
FundingThis workwas supported by NSF BCS-1228397 (to B.A.W.), NEI fel-lowship F32 EY022294-02 (to A.R.), and NEI grant R00-EY022116(to J.W.). H.T. was supported by Grant-in-Aid for JSPS fellows,JSPS Institutional Program for Young Researcher Overseas Visitsand JSPS Postdoctoral Fellowships for Research Abroad.
NotesWe thank L. Michael Perry for technical assistance, KendrickN. Kay for help preprocessing some of the data. Nathan Witthoftfor helping identifying the Collateral Sulcus (CoS, see Supplemen-tary Fig. 16) and Kevin S. Weiner, Adam Kohn, Samir Menon forcomments on an earlier version of the manuscript. Data wereprovided in part by the Human Connectome Project, WU-MinnConsortium (Van Essen, D. and Ugurbil, K., 1U54MH091657).Conflict of Interest: None declared.
ReferencesAllen B, Spiegel DP, Thompson B, Pestilli F, Rokers B. 2015. Altered
white matter in early visual pathways of human amblyopes.Vision Res. [Epub ahead of print].
Amano K, Wandell BA, Dumoulin SO. 2009. Visual field maps,population receptive field sizes, and visual field coverage inthe human MT+ complex. J Neurophysiol. 102:2704–2718.
Arcaro MJ, McMains SA, Singer BD, Kastner S. 2009. Retinotopicorganization of human ventral visual cortex. J Neurosci.29:10638–10652.
Bartels A, Zeki S. 2000. The architecture of the colour centre in thehuman visual brain: new results and a review. Eur J Neurosci.12:172–193.
Ben-Shachar M, Dougherty RF, Deutsch GK, Wandell BA. 2007.Differential sensitivity to words and shapes in ventral occipi-to-temporal cortex. Cereb Cortex. 17:1604–1611.
Brewer AA, Liu J, Wade AR, Wandell BA. 2005. Visual field mapsand stimulus selectivity in human ventral occipital cortex.Nat Neurosci. 8:1102–1109.
Brewer AA, Press WA, Logothetis NK, Wandell BA. 2002. Visualareas inmacaque cortexmeasured using functionalmagneticresonance imaging. J Neurosci. 22:10416–10426.
Catani M, Howard RJ, Pajevic S, Jones DK. 2002. Virtual in vivointeractive dissection of white matter fasciculi in thehuman brain. NeuroImage. 17:77–94.
Cohen L, Dehaene S, Naccache L, Lehericy S, Dehaene-Lambertz G, Henaff MA, Michel F. 2000. The visual wordform area: spatial and temporal characterization of an initialstage of reading in normal subjects and posterior split-brainpatients. Brain. 123(Pt 2):291–307.
Cohen L, Lehericy S, Chochon F, Lemer C, Rivaud S, Dehaene S.2002. Language-specific tuning of visual cortex? Functionalproperties of the Visual Word Form Area. Brain. 125:1054–1069.
Costagli M, Ueno K, Sun P, Gardner JL, Wan X, Ricciardi E,Pietrini P, Tanaka K, Cheng K. 2014. Functional signalers ofchanges in visual stimuli: cortical responses to incrementsand decrements in motion coherence. Cereb Cortex.24:110–118.
DeYoe EA, Bandettini P, Neitz J, Miller D, Winans P. 1994. Func-tional magnetic resonance imaging (FMRI) of the humanbrain. J Neurosci Methods. 54:171–187.
Dougherty RF, Ben-ShacharM, Deutsch GK, Hernandez A, Fox GR,Wandell BA. 2007. Temporal-callosal pathway diffusivity pre-dicts phonological skills in children. Proc Natl Acad Sci USA.104:8556–8561.
Dougherty RF, Koch VM, Brewer AA, Fischer B, Modersitzki J,Wandell BA. 2003. Visual field representations andlocations of visual areas V1/2/3 in human visual cortex. JVis. 3:586–598.
Dövencioglu D, Ban H, Schofield AJ, Welchman AE. 2013. Percep-tual integration for qualitatively different 3-D cues in thehuman brain. J Cogn Neurosci. 25:1527–1541.
Dumoulin SO, Wandell BA. 2008. Population receptive field esti-mates in human visual cortex. NeuroImage. 39:647–660.
Engel SA, Glover GH, Wandell BA. 1997. Retinotopic organizationin human visual cortex and the spatial precision of functionalMRI. Cereb Cortex. 7:181–192.
Engel SA, Rumelhart DE, Wandell BA, Lee AT, Glover GH,Chichilnisky EJ, Shadlen MN. 1994. fMRI of human visual cor-tex. Nature. 369:525.
Fang F, He S. 2005. Cortical responses to invisible objects in thehuman dorsal and ventral pathways. Nat Neurosci.8:1380–1385.
Felleman DJ, Van Essen DC. 1991. Distributed hierarchical pro-cessing in the primate cerebral cortex. Cereb Cortex. 1:1–47.
Fields RD. 2008. White matter in learning, cognition and psychi-atric disorders. Trends Neurosci. 31:361–370.
Fischer E, Bulthoff HH, Logothetis NK, Bartels A. 2012. Humanareas V3A and V6 compensate for self-induced planar visualmotion. Neuron. 73:1228–1240.
Fischl B. 2012. FreeSurfer. NeuroImage. 62:774–781.Friston KJ, Ashburner J. 2004. Generative and recognition models
for neuroanatomy. NeuroImage. 23:21–24.
8 | Cerebral Cortex
at University of W
ashington on April 1, 2015
http://cercor.oxfordjournals.org/D
ownloaded from
Goddard E, Mannion DJ, McDonald JS, Solomon SG, Clifford CW.2011. Color responsiveness argues against a dorsal compo-nent of human V4. J Vis. 11(4):3.
Gomez J, Pestilli F, Witthoft N, Golarai G, Liberman A,Poltoratski S, Yoon J, Grill-Spector K. 2015. Functionally de-fined white matter reveals segregated pathways in humanventral temporal cortex associatedwith category-specific pro-cessing. Neuron. 85:216–227.
Goodale MA, Milner AD. 1992. Separate visual pathways for per-ception and action. Trends Neurosci. 15:20–25.
Grill-Spector K, Kourtzi Z, KanwisherN. 2001. The lateral occipitalcomplex and its role in object recognition. Vision Res.41:1409–1422.
Grill-Spector K, Kushnir T, Edelman S, Itzchak Y, Malach R. 1998.Cue-invariant activation in object-related areas of the humanoccipital lobe. Neuron. 21:191–202.
Grill-Spector K, Kushnir T, Hendler T,MalachR. 2000. The dynam-ics of object-selective activation correlate with recognitionperformance in humans. Nat Neurosci. 3:837–843.
Hagmann P, Cammoun L, Gigandet X, Gerhard S, Grant PE,Wedeen V, Meuli R, Thiran JP, Honey CJ, Sporns O. 2010. MRconnectomics: principles and challenges. J NeurosciMethods. 194:34–45.
Honey CJ, Sporns O. 2008. Dynamical consequences of lesions incortical networks. Hum Brain Mapp. 29:802–809.
Hua K, Zhang J, Wakana S, Jiang H, Li X, Reich DS, Calabresi PA,Pekar JJ, van Zijl PC, Mori S. 2008. Tract probability maps instereotaxic spaces: analyses of white matter anatomy andtract-specific quantification. NeuroImage. 39:336–347.
James TW, Humphrey GK, Gati JS, Menon RS, Goodale MA. 2002.Differential effects of viewpoint on object-driven activationin dorsal and ventral streams. Neuron. 35:793–801.
Johnson RT, Yeatman JD,Wandell BA, BuonocoreMH, Amaral DG,Nordahl CW. 2013. Diffusion properties of major whitemattertracts in young, typically developing children. NeuroImage.88C:143–154.
Kolster H, Peeters R, OrbanGA. 2010. The retinotopic organizationof the human middle temporal area MT/V5 and its corticalneighbors. J Neurosci. 30:9801–9820.
Konen CS, Kastner S. 2008. Two hierarchically organized neuralsystems for object information in human visual cortex. NatNeurosci. 11:224–231.
Kravitz DJ, Saleem KS, Baker CI, Ungerleider LG, Mishkin M. 2013.The ventral visual pathway: an expanded neural frameworkfor the processing of object quality. Trends Cogn Sci. 17:26–49.
Kriegeskorte N, Sorger B, Naumer M, Schwarzbach J, van denBoogert E, HussyW, Goebel R. 2003. Human cortical object rec-ognition from a visual motion flowfield. J Neurosci.23:1451–1463.
Larsson J, Heeger DJ. 2006. Two retinotopic visual areas in humanlateral occipital cortex. J Neurosci. 26:13128–13142.
Lebel C, GeeM, Camicioli R, Wieler M, MartinW, Beaulieu C. 2012.Diffusion tensor imaging of white matter tract evolution overthe lifespan. NeuroImage. 60:340–352.
Lyon DC, Connolly JD. 2012. The case for primate V3. Proc Biol Sci.279:625–633.
MalachR, Reppas JB, BensonRR, KwongKK, JiangH, KennedyWA,Ledden PJ, Brady TJ, Rosen BR, Tootell RB. 1995. Object-relatedactivity revealed by functional magnetic resonance imagingin human occipital cortex. Proc Natl Acad Sci USA.92:8135–8139.
Martino J, Garcia-Porrero JA. 2013. In reply: Wernicke’s perpen-dicular fasciculus and vertical portion of the superior longitu-dinal fasciculus. Neurosurgery. 73(2):E382–E383.
McKeefry DJ, Burton MP, Vakrou C, Barrett BT, Morland AB. 2008.Induced deficits in speed perception by transcranial magneticstimulation of human cortical areas V5/MT+ and V3A.J Neurosci. 28:6848–6857.
McKeefry DJ, Zeki S. 1997. The position and topography of thehuman colour centre as revealed by functional magnetic res-onance imaging. Brain. 120(Pt 12):2229–2242.
Merriam EP, Gardner JL, Movshon JA, Heeger DJ. 2013. Modulationof visual responses by gaze direction in human visual cortex.J Neurosci. 33:9879–9889.
MurphyAP, BanH,WelchmanAE. 2013. Integration of texture anddisparity cues to surface slant in dorsal visual cortex.J Neurophysiol. 110:190–203.
Ogawa S, Takemura H, Horiguchi H, Terao M, Haji T, Pestilli F,Yeatman JD, Tsuneoka H, Wandell BA, Masuda Y. 2014.White matter consequences of retinal receptor and ganglioncell damage. Invest Ophthalmol Vis Sci. 55:6976–6986.
Pajevic S, Pierpaoli C. 1999. Color schemes to represent the orien-tation of anisotropic tissues from diffusion tensor data: appli-cation towhitematterfiber tractmapping in the humanbrain.Magn Reson Med. 42:526–540.
Pestilli F, Yeatman JD, RokemA, Kay KN,Wandell BA. 2014. Evalu-ation and statistical inference for human connectomes. NatMethods. 11:1058–1063.
Press WA, Brewer AA, Dougherty RF, Wade AR, Wandell BA. 2001.Visual areas and spatial summation in human visual cortex.Vision Res. 41:1321–1332.
Reese TG, Heid O, Weisskoff RM, Wedeen VJ. 2003. Reduction ofeddy-current-induced distortion in diffusion MRI using atwice-refocused spin echo. Magn Reson Med. 49:177–182.
RokemA, Yeatman JD, Pestilli F, Kay KN, Mezer A, van derWalt S,Wandell BA. 2015. Evaluating the accuracy of diffusion MRImodels in white matter. PLoS ONE. in press.
Rokers B, Cormack LK, Huk AC. 2009. Disparity- and velocity-based signals for three-dimensional motion perception inhuman MT+. Nat Neurosci. 12:1050–1055.
Saber GT, Pestilli F, Curtis CE. 2015. Saccade planning evokestopographically specific activity in the dorsal and ventralstreams. J Neurosci. 35:245–252.
Schluppeck D, Glimcher P, Heeger DJ. 2005. Topographic organ-ization for delayed saccades in human posterior parietal cor-tex. J Neurophysiol. 94:1372–1384.
SerenoMI, Dale AM, Reppas JB, Kwong KK, Belliveau JW, Brady TJ,Rosen BR, Tootell RB. 1995. Borders of multiple visual areas inhumans revealed by functional magnetic resonance imaging.Science. 268:889–893.
Silson EH, McKeefry DJ, Rodgers J, Gouws AD, Hymers M,Morland AB. 2013. Specialized and independent processingof orientation and shape in visual field maps LO1 and LO2.Nat Neurosci. 16:267–269.
Silver MA, Kastner S. 2009. Topographic maps in human frontaland parietal cortex. Trends Cogn Sci. 13:488–495.
Silver MA, Ress D, Heeger DJ. 2005. Topographic maps of visualspatial attention in human parietal cortex. J Neurophysiol.94:1358–1371.
Smith AT, Greenlee MW, Singh KD, Kraemer FM, Hennig J. 1998.The processing of first- and second-order motion in humanvisual cortex assessed by functional magnetic resonance im-aging (fMRI). J Neurosci. 18:3816–3830.
SpornsO,TononiG,Kotter R. 2005. Thehumanconnectome: a struc-tural description of the human brain. PLoS Comp Biol. 1:e42.
Swisher JD, HalkoMA,Merabet LB, McMains SA, Somers DC. 2007.Visual topography of human intraparietal sulcus. J Neurosci.27:5326–5337.
White Matter Pathway Between Dorsal and Ventral Visual Cortex Takemura et al. | 9
at University of W
ashington on April 1, 2015
http://cercor.oxfordjournals.org/D
ownloaded from
Tavor I, Yablonski M, Mezer A, Rom S, Assaf Y, Yovel G. 2014. Sep-arate parts of occipito-temporal white matter fibers are asso-ciated with recognition of faces and places. NeuroImage.86:123–130.
Thiebaut de Schotten M, Dell’Acqua F, Forkel SJ, Simmons A,Vergani F, Murphy DG, Catani M. 2011. A lateralized brainnetwork for visuospatial attention. Nat Neurosci.14:1245–1246.
Thomas C, Avidan G, Humphreys K, Jung KJ, Gao F, Behrmann M.2009. Reduced structural connectivity in ventral visual cortexin congenital prosopagnosia. Nat Neurosci. 12:29–31.
Thomason ME, Thompson PM. 2011. Diffusion imaging, whitematter, and psychopathology. Annu Rev Clin Psychol. 7:63–85.
Tolias AS, Keliris GA, Smirnakis SM, Logothetis NK. 2005. Neu-rons in macaque area V4 acquire directional tuning afteradaptation to motion stimuli. Nat Neurosci. 8:591–593.
Tootell RB, Hadjikhani N, Hall EK, Marrett S, Vanduffel W,Vaughan JT, Dale AM. 1998. The retinotopy of visual spatial at-tention. Neuron. 21:1409–1422.
Tootell RB, Mendola JD, Hadjikhani NK, Ledden PJ, Liu AK,Reppas JB, Sereno MI, Dale AM. 1997. Functional analysis ofV3A and related areas in human visual cortex. J Neurosci.17:7060–7078.
Tournier JD, Calamante F, Connelly A. 2012. MRtrix: diffusiontractography in crossing fiber regions. Int J Imag SystTechnol. 22:53–66.
Tournier JD, Calamante F, Connelly A. 2007. Robust determin-ation of the fibre orientation distribution in diffusion MRI:non-negativity constrained super-resolved spherical decon-volution. NeuroImage. 35:1459–1472.
Tsao DY, Vanduffel W, Sasaki Y, Fize D, Knutsen TA,Mandeville JB, Wald LL, Dale AM, Rosen BR, Van Essen DC,et al. 2003. Stereopsis activates V3A and caudal intraparietalareas in macaques and humans. Neuron. 39:555–568.
Ungerleider LG, Galkin TW, Desimone R, Gattass R. 2008. Corticalconnections of area V4 in the macaque. Cereb Cortex.18:477–499.
Ungerleider LG, Mishkin M. 1982. Two cortical visual systems. In:Ingle DJ, Goodale MA, Mansfield RJW, editors. The analysis ofvisual behavior. Cambridge (MA): MIT Press. p. 549–586.
Vanduffel W, Fize D, Mandeville JB, Nelissen K, Van Hecke P,Rosen BR, Tootell RB, Orban GA. 2001. Visual motion process-ing investigated using contrast agent-enhanced fMRI inawake behaving monkeys. Neuron. 32:565–577.
Van Essen DC, Smith SM, Barch DM, Behrens TE, Yacoub E,Ugurbil K, Consortium WU-MH. 2013. The WU-Minn HumanConnectome Project: an overview. NeuroImage. 80:62–79.
Vidyasagar TR, Pammer K. 2010. Dyslexia: a deficit in visuo-spa-tial attention, not in phonological processing. Trends CognSci. 14:57–63.
Vinberg J, Grill-Spector K. 2008. Representation of shapes, edges,and surfaces acrossmultiple cues in the human visual cortex.J Neurophysiol. 99:1380–1393.
Wade A, AugathM, Logothetis N,Wandell B. 2008. fMRImeasure-ments of color in macaque and human. J Vis. 8(10):6.
Wade AR, Brewer AA, Rieger JW, Wandell BA. 2002. Functionalmeasurements of human ventral occipital cortex: retinotopyand colour. Philos Trans R Soc Lond B Biol Sci. 357:963–973.
Wakana S, Jiang H, Nagae-Poetscher LM, van Zijl PC, Mori S. 2004.Fiber tract-based atlas of human white matter anatomy.Radiology. 230:77–87.
Wandell BA, Dumoulin SO, Brewer AA. 2007. Visual field maps inhuman cortex. Neuron. 56:366–383.
Wandell BA, Rauschecker AM, Yeatman JD. 2012. Learning to seewords. Annu Rev Psychol. 63:31–53.
Wandell BA, Winawer J. 2011. Imaging retinotopic maps in thehuman brain. Vision Res. 51:718–737.
Wandell BA, Yeatman JD. 2013. Biological development of readingcircuits. Curr Opin Neurobiol. 23:261–268.
Wedeen VJ, Rosene DL, Wang R, Dai G, Mortazavi F, Hagmann P,Kaas JH, Tseng WY. 2012. The geometric structure of thebrain fiber pathways. Science. 335:1628–1634.
Weiner KS, Grill-Spector K. 2010. Sparsely-distributed organiza-tion of face and limb activations in human ventral temporalcortex. NeuroImage. 52:1559–1573.
Wernicke C. 1881. Lehrbuch der Gehirnkrankheiten für Aerzteund Studirende. Kassel: Theodor Fischer.
Winawer J, Horiguchi H, Sayres RA, Amano K, Wandell BA. 2010.Mapping hV4 and ventral occipital cortex: the venous eclipse.J Vis. 10(5):1.
Witthoft N, Nguyen ML, Golarai G, Larocque KF, Liberman A,Smith ME, Grill-Spector K. 2014. Where is human V4? Predict-ing the location of hV4 and VO1 from cortical folding. CerebCortex. 24:2401–2408.
Yeatman JD, Dougherty RF, Ben-Shachar M, Wandell BA. 2012.Development of white matter and reading skills. Proc NatlAcad Sci USA. 109:E3045–E3053.
Yeatman JD, Dougherty RF, Myall NJ, Wandell BA, Feldman HM.2012. Tract profiles of white matter properties: automatingfiber-tract quantification. PLoS ONE. 7:e49790.
Yeatman JD, Rauschecker AM,Wandell BA. 2013. Anatomy of thevisual word form area: adjacent cortical circuits and long-range white matter connections. Brain Lang. 125:146–155.
Yeatman JD, Wandell BA, Mezer AA. 2014. Lifespan maturationand degeneration of human brain white matter. NatCommun. 5:4932.
Yeatman JD,Weiner KS, Pestilli F, RokemA,Mezer A,Wandell BA.2014. The vertical occipital fasciculus: a century of contro-versy resolved by in vivo measurements. Proc Natl Acad SciUSA. 111:E5214–E5223.
Yushkevich PA, Piven J, Hazlett HC, Smith RG, Ho S, Gee JC,Gerig G. 2006. User-guided 3D active contour segmentationof anatomical structures: significantly improved efficiencyand reliability. NeuroImage. 31:1116–1128.
Zeki S,Watson JD, Lueck CJ, Friston KJ, Kennard C, Frackowiak RS.1991. A direct demonstration of functional specialization inhuman visual cortex. J Neurosci. 11:641–649.
Zhang W, Olivi A, Hertig SJ, van Zijl P, Mori S. 2008. Automatedfiber tracking of human brain white matter using diffusiontensor imaging. NeuroImage. 42:771–777.
10 | Cerebral Cortex
at University of W
ashington on April 1, 2015
http://cercor.oxfordjournals.org/D
ownloaded from


![D V High [Dorsal] Low [Dorsal] No Dorsal Graded Dorsal Concentration Created by Mother Hierarchy of Gene Action in D/V Patterning Mesoderm Genes Neuroectoderm](https://img.pdfslide.us/doc/110x75/56649d3f5503460f94a18b80/d-v-high-dorsal-low-dorsal-no-dorsal-graded-dorsal-concentration-created.jpg)