Embed Size (px)
Citation preview

INTERNATIONAL JOURNAL ON SMART SENSING AND INTELLIGENT SYSTEMS VOL. 9, NO. 2, JUNE 2016
709
A MACHINE VISION SYSTEM FOR ESTIMATION OF
THEAFLAVINS AND THEARUBIGINS IN ORTHODOX BLACK
TEA Amitava Akuli a*, Abhra Pal a, Gopinath Bej a, Tamal Dey a, Arunangshu Ghosh b , Bipan Tudu b,
Nabarun Bhattacharyya a,c and Rajib Bandyopadhyay b,c aCentre for Development of Advanced Computing, Kolkata 700 091, India.
bDepartment of Instrumentation and Electronics Engineering, Jadavpur University, Kolkata, India. cLaboratory of Artificial Sensory Systems, ITMO University, St. Petersburg, Russia
Email: a* [email protected]
Submitted: Jan. 30, 2016 Accepted: Mar. 31, 2016 Published: June 1, 2016
Abstract — Orthodox black tea quality depends upon the amount of certain organic compounds present and out of these, theaflavins (TF) and thearubigins (TR) are the most important ones While TF is responsible for attractive golden colour, increased brightness and astringency in tea liquor, TR is reddish brown, reduces the brightness of tea liquor and contribute mostly for the ashy taste of the liquor with minor improvement in astringency. The rapid estimation of TF and TR thus may resolve the problem of certain uncertainty or ambiguity that may arise during quality assessment of tea by the tea tasters. In this paper, a new method for rapid measurement of concentration of TF and TR is described using a machine vision system taking images of tea liquor and employing artificial neural networks (ANN). The results show good correlation of estimated values of TF and TR with the actual concentrations obtained using ultraviolet-visible spectrophotometer (UV-VIS).
Index Terms: Theaflavins (TF); Thearubigins (TR); Machine Vision System; Orthodox black tea; UV-VIS
spectrophotometer; Generalised Regression Neural Network (GRNN); Back propagation multilayer
perceptrons (BP-MLP); Radial Basis Function Network (RBFN);
Amitava Akuli, Abhra Pal, Gopinath Bej, Tamal Dey, Arunangshu Ghosh, Bipan Tudu, Nabarun Bhattacharyya and Rajib Bandyopadhyay, A MACHINE VISION SYSTEM FOR ESTIMATION OF THEAFLAVINS AND THEARUBIGINS IN ORTHODOX BLACK TEA
710
I. INTRODUCTION
Orthodox black tea is mainly grown in the Himalyan foothill and Nilgiri regions in India and is a
highly priced tea in the worldwide market because of its impressive colour, exciting aroma and
exhilarating flavor. Orthodox black tea is rolled with machinery (popularly known as the rolling
table) in a manner that mimics hand-rolling. Production of orthodox black tea involves certain
processing stages like withering, rolling, fermentation, drying, grading or sorting and packaging.
All the stages are associated with several bio-chemical reactions, which produce a large number
of organic compounds and the concentrations of these compounds in the finished product
determine the quality of made tea. During black tea processing, the conversion of catechins to
theaflavins (TF) starts as soon as tea leaves are plucked from the garden. But this conversion
process is very slow [1, 2]. During withering, the moisture level of plucked tea leaf is reduced to
a large extent with the flow of air in a controlled manner. The main oxidation starts in the next
stage known as rolling, where the cellular structure of withered leaf is broken and the enzyme
‘polyphenol oxidase’ comes in contact with catechins to form quinines followed by theaflavins
and thearubigins. This continues more vigorously in the fermentation step. During drying, tea
leaves are treated with hot air to kill the enzymes for arresting further oxidation and increasing
shelf life. After sorting, the packaged tea is finally sent to the auction centers for valuation on the
basis of organoleptic testing. [3] During organoleptic testing, human experts evaluate the quality
of made tea based on its physical appearance, liquor, infusion colour, brightness, aroma, taste etc.
Table I
Chemical constituents responsible for colour formation in Orthodox BLACK Tea
Compounds Colour
Theaflavins Yellowish brown
Thearubigins Reddish brown
Flavonol glycosides Light yellow
Phephorbide Brownish
Pheophytin Blackish
Among several bio-chemical compounds [4] in finished tea, Theaflavins (TF) and Thearubigins
(TR) are the characteristic pigments produced during tea processing and their presence

INTERNATIONAL JOURNAL ON SMART SENSING AND INTELLIGENT SYSTEMS VOL. 9, NO. 2, JUNE 2016
711
contributes in the formation of the colour and brightness of tea liquor. The ratio of TF and TR is
considered as an important quality index by the tea scientists [4] and in certain cases, it also helps
to resolve the uncertainty and ambiguity in defining the quality scores assigned by the tea tasters
during organoleptic testing [5]. Theaflavins are low molecular weight compounds and golden
yellow (yellowish brown) in colour. They contribute about 0.5 to 2% of dry weight (depending
on tea clone and processing parameters). On the other hand, thearubigins are high molecular
weight compounds and reddish brown in colour. They constitute about 6 to 18% of dry weight
[6]. In early 1960s, Woods and Roberts recognized the possible existence of relationship between
black tea theaflavins and sensory evaluation [7]. Similar relationship is also reported in a few
literatures [8, 9, 10, 11]. These studies led to the view that TF is the main objective quality
indicator in black tea. Literature survey reveals some significant relationship between theaflavin
content and the price of tea [9, 12 and 13]. A list of chemical constituents responsible for the
formation of colour in black tea is shown in Table- I. [14, 16]. The presence of TF enhances the
brightness and the taste of astringency in tea liquor, whereas the presence of thearubigins is
responsible for reduction in brightness, adds colour and ashy taste with slight improvement in
astringency [3, 5, 14, 15].
Presently in the tea industry, assessment of tea quality is carried out by the organoleptic senses of
vision, nose and taste of “Tea Tasters” who may be influenced by psychological (e.g. mental
state), physiological (i.e. age, sex etc) factors. Thus, the quality index assigned by the tea taster is
subjective, and sometimes produces inconsistent results. Instrumental methods using
spectrophotometry and High performance Liquid Chromatography (HPLC) are routinely used by
the tea scientists to determine the above bio-chemical compounds [7, 16, 17, 18, 19] in tea for
looking into the factors that affect tea quality. The instrumental analysis methods [20, 21, 22] are
accurate, reliable and repeatable, and the repeatability and reproducibility of the analysis results
are restricted only by the quality of the sample preparation. However, some major limitations of
the analytical instrumental methods are high procurement cost of the instruments, longer
throughput time, cumbersome methods of sample preparation, requirement of skilled operators,
costly reagents for sample preparation and high maintenance cost. These factors result in
limitations of the instrumental systems especially in tea auction centers and tea tasting
laboratories where a large number of samples are handled every day. These motivate us thinking
of a low cost, rapid and objective quality analysis instrument. Recently, the use of electronic

Amitava Akuli, Abhra Pal, Gopinath Bej, Tamal Dey, Arunangshu Ghosh, Bipan Tudu, Nabarun Bhattacharyya and Rajib Bandyopadhyay, A MACHINE VISION SYSTEM FOR ESTIMATION OF THEAFLAVINS AND THEARUBIGINS IN ORTHODOX BLACK TEA
712
tongue for estimation of TF [3, 5] and TR [5] was reported which uses voltametric technique to
estimate the concentration of chemical compounds. Use of machine vision was reported to find
out Tea Quality Index (TQI) during fermentation [23]. This paper proposes an image processing
technique to calculate colour and dimensional features of tea particle to obtain Tea Quality Index.
Quality analysis of tea grades is proposed by taking image of tea particle using a microscope with
5X magnification and an artificial neural network is employed to differentiate among various
grades of tea. [24]. Mohit Sharma et al. [25] makes an attempt to study the colour change during
fermentation using RGB (red, green, blue) colour model. Surajit Borah et al. [26, 27] describe
the use of machine vision system to detect the end point of fermentation using RGB and HSI
(Hue, Saturation and Intensity colour model) colour analysis. It is determined by measuring
dissimilarity between the end point fermentation colour with the colour of test images under
fermentation. Amit Laddi et al. [28] investigate optimum light illumination intensity for
maximum discrimination of the Indian black tea varieties using machine vision. The technique
involves acquisition and analysis of color information of brewed tea liquor using PCA technique
with different illumination intensity. The study reveals that color attributes are significant
parameters for discriminating Indian black tea varieties. Gagandeep Singh Gill et. al. [29]
presents an overview of various computer vision based algorithms for colour and texture analysis
with a special orientation towards monitoring and grading of made tea. Arvind Kumar et. al. [30]
presents an image analysis system for analysis of tea liquor by applying L*a*b* colour model
based histogram colour matching technique. B.M.T. Lekamge et. al. [31] presents a novel hybrid
method to identify the stalk particles using fuzzy logic based image processing technique for
colour separation. The literature review reveals that several studies have been carried out on
image processing based application for quality estimation of finished tea and the tea leaves under
fermentation. But, no research and development effort has been observed for estimation of TF
and TR content directly from appearance of tea liquor. In this work, a machine vision system has
been developed for the quantitative estimation of TF and TR in orthodox black tea which is
proposed to be rapid with sample preparation technique. The machine vision system is trained
first with the target data (in our case the concentration of TF and TR) which is obtained by
standard instrumental technique using UV-Vis spectrophotometer. After training with known
data, it can be used to estimate the concentrations of TF and TR of unknown samples. The
estimations of TF and TR are considered as function approximation problem. Multilayer feed-

INTERNATIONAL JOURNAL ON SMART SENSING AND INTELLIGENT SYSTEMS VOL. 9, NO. 2, JUNE 2016
713
forward neural network (also known as multilayer preceptrons or MLP) has capability to
approximate any arbitrary functions [32]. This paper explores the application of different data
analysis techniques i.e. Back-Propagation Multi Layer Perceptrons (BPMLP), Radial Basis
Function Network (RBFN) [33] and Generalised Regression Neural Network (GRNN) [34, 35]
for calibration of the machine vision system. Also the validation of the results is done by testing
with different sets of tea sample using the developed machine vision system by comparing with
the value obtained by instrumental analysis.
II. MATERIALS & METHODS
In this experiment, each orthodox black tea sample (made tea) was divided into two portions. One
portion is used for analysis of TF and TR using spectrophotometric technique and the other
portion is used to prepare the tea liquor for analysis using electronic vision system. The
operational flowchart for the experimentation is shown in Fig. 1.
Development of Correlation Model
Unknown TeaSample
Tea Sample (For Model Development)
Estimation of% TF, % TR
Preperation of TeaExtract
Spectrophotometry
% o
f T
F
% o
f T
R
Preperation of TeaLiquor
Electronic VisionSystem
Colour Analysis andFeature Extraction
Colour Image
Fig. 1. Operational Flow chart of the overall experiment

Amitava Akuli, Abhra Pal, Gopinath Bej, Tamal Dey, Arunangshu Ghosh, Bipan Tudu, Nabarun Bhattacharyya and Rajib Bandyopadhyay, A MACHINE VISION SYSTEM FOR ESTIMATION OF THEAFLAVINS AND THEARUBIGINS IN ORTHODOX BLACK TEA
714
The materials and the methodology to estimate the content of TF and TR are describing below.
A. Sample collection
Two leaves and a bud shoot were harvested from tea bushes (Camellia sinensis (L.) O. Kuntze) of
Chinary clone with a regular plucking interval of seven days produced at Tea Experimental Farm
of the Institute of Himalayan Bio-Resource Technology (IHBT), Palampur. In this experiment, a
total of 36 different tea samples had been used which were produced during the three flushing
seasons - Early, Rains and Backend. These tea samples were prepared from good quality clone
namely Chinary produced at Kangra Vally in North India and plucked between the month of
April and July. The orthodox black tea samples were processed at the Experimental Tea Factory.
During processing, tea leaves were subjected to withering under ambient air at constant flow for
16-18 h; rolled using a ‘peizy’ roller for 0.5 h, fermented for 3 h, and dried with hot air at 95°C in
a miniature dryer. 25 gm each of orthodox black tea sample, processed at different conditions in
order to get wide variations in TF, TR parameters, were taken for experimentation. The TF and
TR content of the each orthodox black tea sample had been determined using spectrophotometry
and presented to machine vision system for image analysis. The TF values obtained among 36
samples varied from 0.354 to 0.635 with an average of 0.504 and standard deviation of 0.078.
On the other hand, TR ranges obtained were 3.015 to 5.421 with an average of 3.84 and standard
deviation of 0.78 which indicates the wider variation in the TR values. Also, the samples were
presented to a tea taster to grade the sample based on quality score ranging from 1 to 10.
B. Estimation of theaflavins and thearubigins using spectrophotometry
Theaflavins and thearubigins were analyzed from tea infusion, prepared with boiling water.
Absorbance/Optical Density (OD) of test solutions was measured on a Shimadzu ® UV-2450
UV-Vis spectrophotometer. Estimation of theaflavins and thearubigins was first developed by
Ullah [36].
1) Preparation of tea extract for TF and TR analysis:
Each black tea sample was extracted in triplicate for the determination of the thearubigin
fractions following the method described in Association of official Analytical Chemists (AOAC)
[37]. To determine TF and TR, 50 mL of the cool, well-shaken and filtered standard tea infusion
were mixed with 50 mL of ethyl acetate.

INTERNATIONAL JOURNAL ON SMART SENSING AND INTELLIGENT SYSTEMS VOL. 9, NO. 2, JUNE 2016
715
STEP 1: Preparation of Solution A: A 4 mL portion of the ethyl acetate layer was taken and
made up to 25 mL with methanol.
STEP 2: Preparation of Solution B: 25 mL of the remaining initial ethyl acetate layer were
partitioned with 25 mL of 2.5% aqueous sodium hydrogen carbonate and the aqueous layer is
discarded. A 4 ml portion of the washed ethyl acetate layer was made up to 25 ml with methanol.
STEP 3: Preparation of Solution C: 2 mL of saturated oxalic acid aqueous solution and 6 ml of
water were added to a 2 mL portion of the aqueous layer left from the first extraction with ethyl
acetate, and diluted to 25 ml with methanol.
STEP 4: Preparation of blank sample is done similarly as stated above without mixing the tea
extract.
STEP 5: Measurement of Absorbance: The absorbance of solutions A, B and C at 380 nm was
obtained using a UV-VIS spectrophotometer-2450, Shimadzu ® against blank [36, 37].
2) Calculation of TF & TR from absorbance reading
Calculation of TF and TR value using spectrophotometry is obtained using equation (1) and (2)
[36, 37].
125.2% ETF ×= (1)
E1 = Absorbance of Solution A at 380 nm after setting the reference point of the instrument using
blank.
[ ])]100/(*9*733.0[
)(25.6*02.0*375%
WDM
ABAAACTR
−+= (2)
AA= Absorbance of solution A at 380 nm after setting the reference point of the instrument using
blank
AB= Absorbance of solution B at 380 nm setting the reference point of the instrument using
blank
AC= Absorbance of solution C at 380 nm setting the reference point of the instrument using
blank.
WDM= Weight in gm of dry matter (5 gm)

Amitava Akuli, Abhra Pal, Gopinath Bej, Tamal Dey, Arunangshu Ghosh, Bipan Tudu, Nabarun Bhattacharyya and Rajib Bandyopadhyay, A MACHINE VISION SYSTEM FOR ESTIMATION OF THEAFLAVINS AND THEARUBIGINS IN ORTHODOX BLACK TEA
716
C. The Machine Vision Set up
The Machine Vision System (Fig. 2) consists of the following elements:
1) Lighting arrangement
For image acquisition, samples are illuminated using four high intensity white DOME LEDs
(equivalent to D65 standard light source). Four LEDs are arranged as a square configuration, 35
cm above the sample. The light intensity inside the enclosed cabinet is measured using a light
sensor (silicon based), mounted at one corner of the sample holder. A separate light intensity
controller constantly compares the sensor output to the preset signal level and changes the power
supply output to keep the light intensity constant irrespective of power supply voltage and any
variation due to aging, ensuring uniform illumination on the system tray where tea liquor cup is
placed in the predefined slot.
2) Digital camera for image acquisition
A low cost, colour digital camera, model C905 (Logitech ®) is located vertically over the sample
at a distance of 30 cm. The angle between the camera lens and the lighting source axis is
approximately 45 degree. The camera is interfaced with PC/ laptop using Universal Serial Bus
(USB2.0) communication. To avoid the varying ambient illumination conditions, the entire
system is placed inside a cabinet whose internal surface is painted. Images are taken using the
following camera settings: manual mode, manually adjusted fixed focus, no zoom, no flash with
resolution of 640x480 (N x M) pixels and storage in 24 bit BMP format. The white balance of the
camera is set in auto mode.
Computer
CameraLight
Computer interface(USB Cable)
EnclosedCabinet
Door
Tea Liquor Sample
SampleContainer
Fig. 2 Schematic diagram of Electronic Vision System
Fig. 3 Electronic Vision System (E-VISION)

INTERNATIONAL JOURNAL ON SMART SENSING AND INTELLIGENT SYSTEMS VOL. 9, NO. 2, JUNE 2016
717
D. Image analysis and feature extraction
Images of the tea liquor samples are captured by the camera. (steps for preparation of tea liquor is
explained in Section E) Image processing and analysis steps are described below. Developed
Electronic vision system is shown in Fig. 3.
1) Pre-processing of the Image: Though the images are taken inside a cabinet under a fixed
illumination of light with intensity 110 Lux using 4 white LEDs, but, there are some noises in the
image. These noises include the suspended tea particles in the liquor and the water bubbles
formed during preparation of the tea liquor. To remove the above noise, a median filter with 5x5
window size is found to provide reasonably good performance. This filter operation is applied in
each colour plane (Red, Green, Blue) of the image separately.
2) Segmentation of the liquor image: Experimentally, it is observed that for all the sets of the
liquor images, the R (Red) value is dominating over B (Blue) and G (Green) values. So, R image
plane is considered during image segmentation of the liquor image from the rest or background
image. By observing the histogram of R plane of the image, a fixed threshold value is chosen.
Segmented image is a binary image where ‘0’ and ‘1’ represent background and liquor image
respectively. The localization of the pixel in the binary image is used to extract the liquor image
in the processed RGB colour image.
3) Extraction of features: The construction of the bowl containing tea liquor is concave shape
with an open top which causes the variation in depth of the tea liquor (from the liquor surface to
the inside wall of the bowl) inside the bowl. As a result, the colour is more predominant and
uniform in the middle portion marked as location ‘C’ in Fig. 4 when compared with any other
sides, marked as N, S, E, W. More specifically, the colour values R and G are found to be
decreasing from the middle region (C) to any side (N, S, E or W). But, very little change in blue
(B) value is observed. The plot with average R, G, B values of the images taken at different
locations in the sample holder (bowl) is shown in Fig.5.

Amitava Akuli, Abhra Pal, Gopinath Bej, Tamal Dey, Arunangshu Ghosh, Bipan Tudu, Nabarun Bhattacharyya and Rajib Bandyopadhyay, A MACHINE VISION SYSTEM FOR ESTIMATION OF THEAFLAVINS AND THEARUBIGINS IN ORTHODOX BLACK TEA
718
The change in colour value is also observed to be a function of depth of the tea liquor in the tea
tasting bowl. Therefore, colour features at five locations at C (middle), N (North), S (South), E
(East), W (West) are chosen. The image of size 40 x 40 (d=40) pixels are cropped from the center
of the actual image that produces almost uniform colour. Also, the image size of 40x40 (d=40)
from each location (N, S, E, W) were cropped. For each cropped image, the values of R, G, B are
calculated. Thereafter, the conversion is performed from device dependent RGB colour plane to
device independent CIE L*a*b colour plane. The L*a*b plane is chosen as it can describe all the
colours visible by the human eye and matches with human perception. ‘L’ represents the
luminance or lightness component which is ranging from 0 (black) to 100 (white), ‘a’ (green to
red), ‘b’ (blue to yellow) are two chromatic components varying from -128° to 127° [39]. Our
objective is to estimate the TF, TR values from the colour images. Based on the assumption and
initial observation, six features are selected for colour analysis for each cropped image. The
features are average ‘L’, average ‘a’, average ‘b’, standard deviation of ‘L’, standard deviation of
‘a’ and standard deviation ‘b’. Considering the cropped images at five locations, we have total 30
features for each image. List of features are shown in the Table- II.
Image W
idth (M)
Image Length (N)
Liquor Image (diameter = n)
d
d
C EW
N
S
2d 2d
2dd d
d
n/2
Fig. 4. Captured image with marking of different
regions (C, N, W, S, E) from where colour based
different image features were extracted.
Fig.5 Average R, G, B intensity of the images
at different locations in the sample holder
(bowl)

INTERNATIONAL JOURNAL ON SMART SENSING AND INTELLIGENT SYSTEMS VOL. 9, NO. 2, JUNE 2016
719
Table II
List of extracted features according to figure 4
Features Description
Lc, ac, bc Average L, a, b value of cropped image at location C
LN, aN, bN Average L, a, b value of cropped image at location N
LW, aW, bW Average L, a, b value of cropped image at location W
Ls, as, bs Average L, a, b value of cropped image at location S
LE, aE, bE Average L, a, b value of cropped image at location E
Lcs,acs, bcs Standard deviation of L, a, b value of cropped image at location C
LNs, aNs, bNs Standard deviation of L, a, b value of cropped image at location N
LWs, aWs, bWs Standard deviation of L, a, b value of cropped image at location W
LSs, aSs, bSs Standard deviation of L, a, b value of cropped image at location S
LEs, aEs, bEs Standard deviation of L, a, b value of cropped image at location E
E. Preparation of tea liquor
The tea liquor samples for the vision system were prepared by boiling 100 ml of de-ionized water
poured over 2.5 gm of dry tea. The solution was allowed to brew for 5 min, after which it was
stirred well for mixing uniformly. The liquor was separated into another beaker so that the
residual leaves remain at the bottom. The liquor was allowed to cool (at 50-60° C) before it is
filtered using ‘Whatman’ filter paper to get a clear solution. The sample was then presented to
Electronic Vision System and 5 images were recorded for each of 36 orthodox black tea samples.
The same samples were also evaluated by a professional tea taster for quality evaluation.
III. DATA ANALYSIS
A. Principal component analysis (PCA)
PCA [38, 40] is a linear feature extraction technique which is used as a visualization tool for
observing high dimensional data distributions into information rich, reduced dimension (typically
two or three) coordinate system. By using PCA, data may be expressed and presented in a way to
highlight their inherent similarities and differences. This technique calculates the projection of
the input data set on the orthogonal axis those are aligned in the direction of maximum variance
Amitava Akuli, Abhra Pal, Gopinath Bej, Tamal Dey, Arunangshu Ghosh, Bipan Tudu, Nabarun Bhattacharyya and Rajib Bandyopadhyay, A MACHINE VISION SYSTEM FOR ESTIMATION OF THEAFLAVINS AND THEARUBIGINS IN ORTHODOX BLACK TEA
720
in the input data. The PCA technique is applied on the liquor image data after feature extraction
and the plots are presented in the next section.
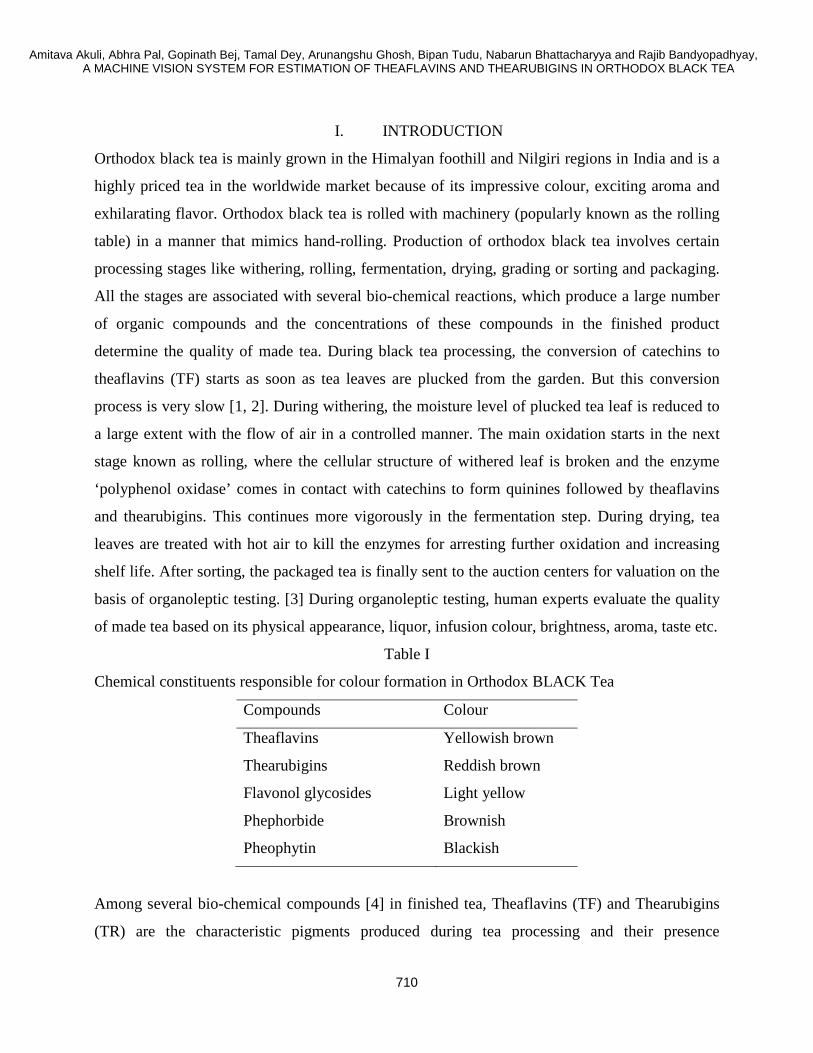
B. Artificial Neural Network frame work
Artificial neural network (ANN) using multi-layer perceptrons often exceeds the performance of
other function approximators for arbitrary, complex and nonlinear input-output mappings. The
performance of the following artificial neural network framework has been considered.
1) Back-Propagation Multi-Layer Perceptrons (BPMLP)
An artificial neural network technique like back-propagation-multi-layer perceptrons (BPMLP)
can be applied to perform function approximation task for prediction of TF, TR content in a tea
sample. A three layer BP-MLP model with single input and output layer and one hidden layer has
been considered in our problem. The input layer has been connected with image features (30
input nodes) and the output layer has been configured with either TF or TR value. It is observed
that the convergence during learning process had been found with acceptable level of accuracy
with only one hidden layer with 35 neurons. In our problem, the learning rate of the hidden layer
had been considered at 0.5 and ‘TANSIG’ is used as the activation function on hidden layer out
puts. While, ‘PURELIN’ (linear function used in MATLAB ® 10.0) is used as activation
function in the output layer and the learning rate in the output layer is considered as 0.1. Number
of iteration (Epoch) was considered as 1500.
2) Generalized Regression neural network (GRNN)
General Regression Neural Network (GRNN) [34, 35] can perform estimation on any arbitrary
function having linear or non-linear relationship between the dependent and independent
variables. The estimated result can meet the optimal regression surface even on the samples of
sparse data. GRNN is a feed forward neural network architecture implemented on supervised
learning process. It has four layers - input, pattern (Gaussian Function), summation, and the
output layer. Input layer receives the input signal and passes it to the pattern layer for further
processing. The pattern layer calculates the Euclidean distance between the input vector and
training vector and passes this value to next layer i.e. summation layer as an activation function
(Gaussian Function). Summation layer has two neurons - one is the numerator and the other one

INTERNATIONAL JOURNAL ON SMART SENSING AND INTELLIGENT SYSTEMS VOL. 9, NO. 2, JUNE 2016
721
is the denominator. The numerator neuron calculates the weighted sum where a weight
corresponds to a training sample output. Denominator neuron calculates un-weighted sum of
outputs from the pattern layer. The output layer calculates the output by dividing numerator by
denominator. In our case, GRNN has 30 input nodes corresponding to 30 image features. Since,
our problem is a function approximation problem, the output layer has only one node i.e, either
TF or TR value. The value of spread constant is considered as 1.0.
3) Radial Basis Function Network (RBFN)
RBFN [33] consists of an input layer, a hidden layer and an output layer. Hidden nodes which
are known as radial centers, implement the radial basis function i.e. Gaussian function and the
output layer implements the linear summation function. During training, the weights of the
hidden layer to the output layer are updated and finalized. RBFNN keeps on adding neurons to
the hidden layer of a radial basis network till it reaches the acceptable level of accuracy by
minimizing the mean squared error. For the development of artificial neural network using RBF,
input layer consisting of 30 neurons and output layer with single neuron are considered.
Implementation of RBFNN had been done using MATLAB ®, where, spread constant is
considered as 1.0 and sum squared error (SSE) value is considered as 0.02. Parameters chosen for
three ANN architectures are shown in Table III.
Table III
Artificial neural network architecture
BP-MLP GRNN RBFNN
Input Node: 30 Input Node: 30 Input Node: 30
Hidden Node: 35
Output Node: 1 Output Node: 1 Output Node: 1
Learning rate at Hidden Layer: 0.5 Spread constant: 1.0 Spread constant: 1.0
Learning rate at output layer: 0.1 SSE: 0.02
Epoch – 1500

Amitava Akuli, Abhra Pal, Gopinath Bej, Tamal Dey, Arunangshu Ghosh, Bipan Tudu, Nabarun Bhattacharyya and Rajib Bandyopadhyay, A MACHINE VISION SYSTEM FOR ESTIMATION OF THEAFLAVINS AND THEARUBIGINS IN ORTHODOX BLACK TEA
722
IV. RESULTS AND ANALYSIS
Experiments were carried out under standard laboratory conditions with 36 tea samples using
developed electronic vision system. The image of the liquor was taken five times for each
sample. Thus, 180 images were captured and the images were analyzed using an image analysis
program for initial processing followed by feature extraction. Finally, the data analyses were
performed using MATLAB 7.0 ®.
A. Data exploration using PCA for extraction of clustering information
The PCA analysis was carried out with selected 33 orthodox black tea samples having significant
variation in of TF and TR values. This would be helpful for initial exploration regarding the
formation of representative clusters. The plots with TF and TR values are presented in Fig 5(a)
and Fig. 5(b), respectively. The colours of markers specify values of TF and TR within the range
specified by the plot legend. The PCA plots indicate the tendency to form clusters corresponding
to the tea samples with closer TF and TR values, respectively. The PCA plot with Fig. 6(a)
reveals the formation of good clusters produced by the tea sample with lower TF values indicated
by blue (X), green ( ) and red ( ) markers. Notable overlaps have been observed due to a
lesser amount of variation obtained in the TF values. The cyan (*), magenta () markers
indicating TF values overlapping with each other. Fig. 6(b) presents the PCA plot of electronic
vision image analysis results for TR analysis with 33 tea samples. Formation of notable clusters
have been found with the tea sample with lower TR values indicated by blue (*), red () and
Fig. 6 (a) PCA plot showing clusters with TF Fig. 6 (b) PCA plot showing clusters with TR

INTERNATIONAL JOURNAL ON SMART SENSING AND INTELLIGENT SYSTEMS VOL. 9, NO. 2, JUNE 2016
723
green (O) markers. Though, the magenta () markers indicating highest TR values overlap with
other group indicating by cyan (), but, blue (*), red ( ), green (O) ones can be separable.
The PCA plot reveals a complex and non-linear relationship between the colour image features
and TF- TR content. This motivates us to develop a mathematical model to differentiate among
the overlapping clusters. The next section discusses about the choosing an appropriate model for
efficient predication of TF and TR value.
B. Development of Artificial Neural Network models for prediction of TF and TR
1) Preparation of dataset for calibration and testing
For each of the 180 images captured, 30 image features are obtained. Thus, the total data set
obtained is of size 30×180. The dataset is divided into training set of size 30×125 (70%) and test
set of size 30×55 (30%). The testing results are compared with the actual values obtained using
spectrophotometry. K-Fold (K=10 in our case) cross validation technique is applied to validate
the neural network models.
2) Selection of the performance parameters
As indicated earlier, three types of neural networks were employed in this study. Hence, in order
to compare the performance of the ANN techniques i.e. BPMLP, RBF and GRNN, the following
performance parameters are considered as shown in Table IV.
Table IV
Performance parameters
Abbr. Definition
MPPA Mean Percentage Prediction Accuracy
MPE Mean Prediction Error
MinPE Minimum Value of Prediction Error
SDPE Standard Deviation of Prediction Error
WPPA Worst Percentage Prediction Accuracy
MSPE Mean Square Prediction Error
MaxPE Maximum Value of Prediction Error
Amitava Akuli, Abhra Pal, Gopinath Bej, Tamal Dey, Arunangshu Ghosh, Bipan Tudu, Nabarun Bhattacharyya and Rajib Bandyopadhyay, A MACHINE VISION SYSTEM FOR ESTIMATION OF THEAFLAVINS AND THEARUBIGINS IN ORTHODOX BLACK TEA
724
These performance parameters were calculated on the results obtained after executing the 10 fold
cross validation technique. The important performance indicating parameters among the above
are MPPA, MSPA and WPPA, in order of priority. While MPPA and MSPA indicate the
efficiency of mapping, WPPA indicates the lower bound of predication accuracy.
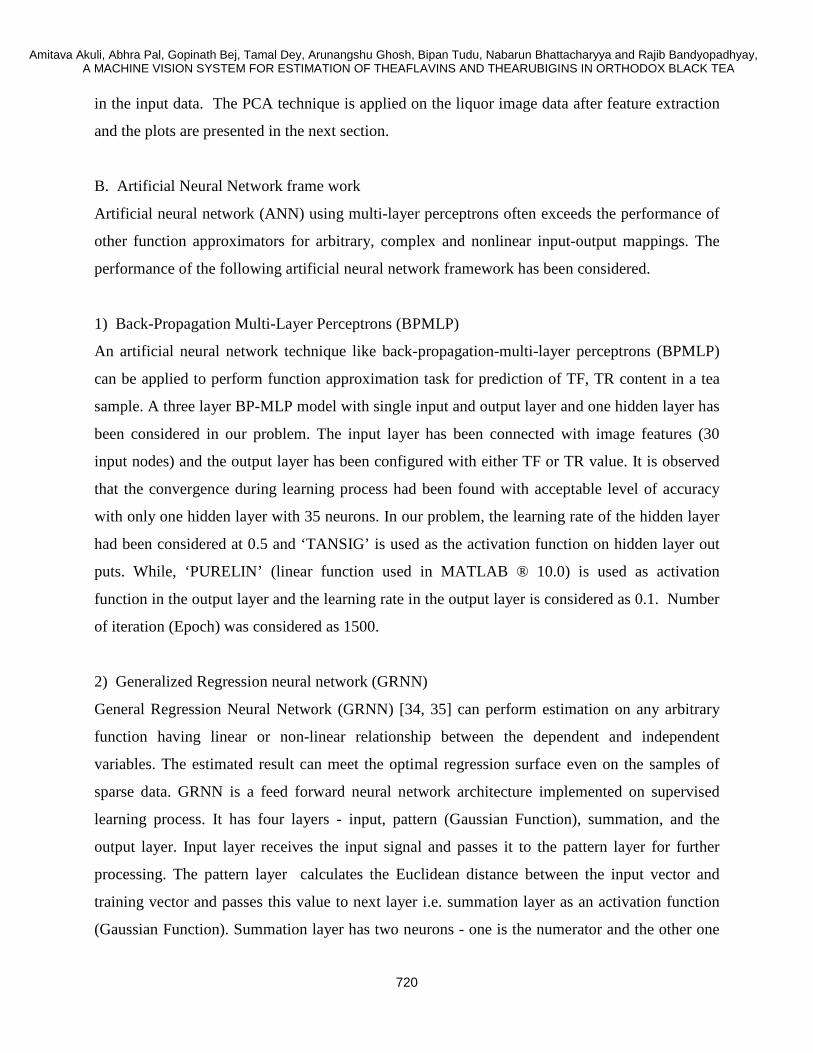
3) Comparison among neural network models for the prediction of TF and TR values
As mentioned earlier, a total of 180 images for 36 different tea samples have been used for
testing the proposed technique of TF & TR content estimation. Three models have been validated
for the whole set of data with 10–fold cross validation technique. Results of 10-fold cross
validation technique are presented in TABLE V and TABLE VI for prediction of TF and TR
respectively using BPMLP, RBFN and GRNN.
Table V
Result of 10 Fold cross validation for prediction average accuracy of % TF
Fold No BPMLP GRNN RBFN
1 86.95 85.69 87.18
2 85.81 82.24 81.65
3 85.83 80.05 83.28
4 87.27 88.39 88.93
5 86.83 87.73 85.49
6 81.69 84.17 88.32
7 88.11 88.33 89.12
8 88.81 90.68 90.19
9 85.04 84.86 85.99
10 96.15 95.71 95.77
Average 87.25 86.79 87.59
Std 3.50 4.23 3.73

INTERNATIONAL JOURNAL ON SMART SENSING AND INTELLIGENT SYSTEMS VOL. 9, NO. 2, JUNE 2016
725
Table VI
Result of 10 Fold cross validation for prediction average accuracy of % TR
Fold No BPMLP GRNN RBFN
1 92.37 92.02 91.51
2 75.54 75.10 76.27
3 73.73 77.25 76.74
4 65.16 66.33 66.55
5 92.68 93.79 91.67
6 89.76 90.46 87.76
7 92.98 92.94 92.83
8 95.07 95.90 95.23
9 92.70 92.36 92.88
10 89.11 89.05 89.98
Average 85.91 86.52 86.14
Std 10.43 9.96 9.54
4) Performance analysis on selected prediction models
Summary of the performance for prediction of TF and TR using three ANN models viz. BP-
MLP, RBFN and GRNN are shown in Table VII and VIII.
Table VII
Performance summary of models developed for TF
Performance
Parameters
MPPA MPE MSPE SDPE MinPE MaxPE WPPA
BP-MLP 87.253 0.015 0.006 0.08 0.133 0.213 66.049
RBFN 87.592 0.015 0.006 0.078 0.135 0.201 66.243
GRNN 86.794 0.016 0.007 0.081 0.136 0.198 65.98
Amitava Akuli, Abhra Pal, Gopinath Bej, Tamal Dey, Arunangshu Ghosh, Bipan Tudu, Nabarun Bhattacharyya and Rajib Bandyopadhyay, A MACHINE VISION SYSTEM FOR ESTIMATION OF THEAFLAVINS AND THEARUBIGINS IN ORTHODOX BLACK TEA
726
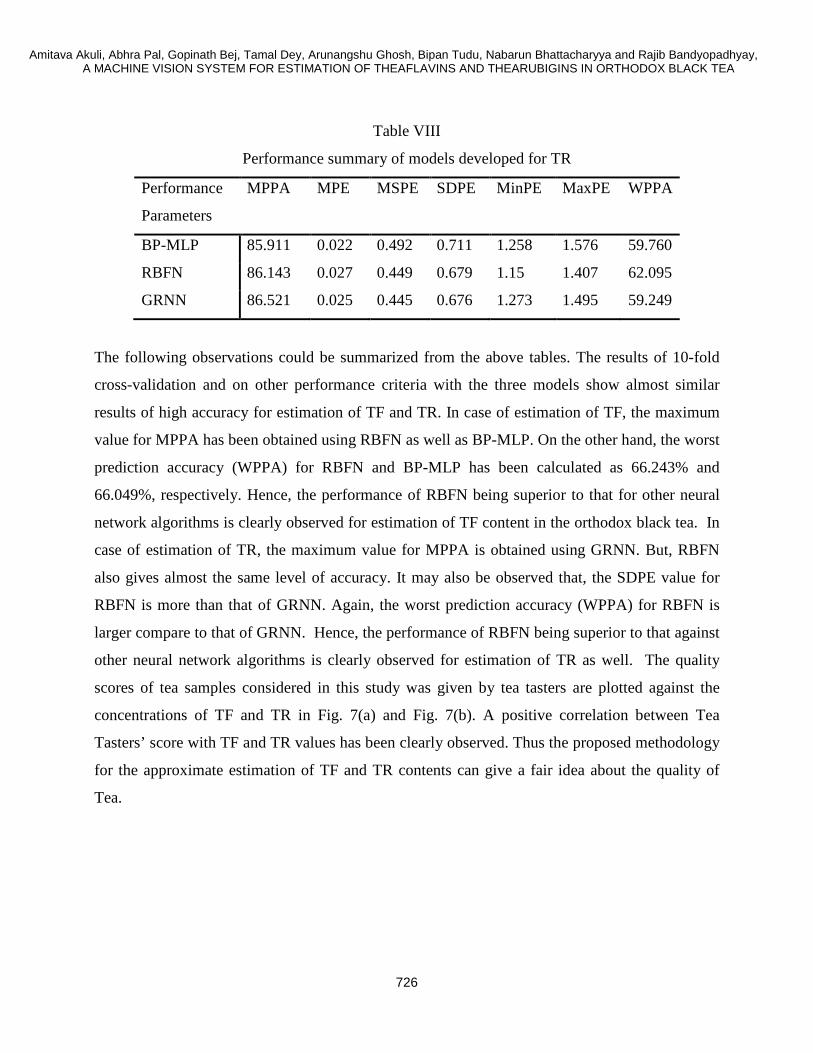
Table VIII
Performance summary of models developed for TR
Performance
Parameters
MPPA MPE MSPE SDPE MinPE MaxPE WPPA
BP-MLP 85.911 0.022 0.492 0.711 1.258 1.576 59.760
RBFN 86.143 0.027 0.449 0.679 1.15 1.407 62.095
GRNN 86.521 0.025 0.445 0.676 1.273 1.495 59.249
The following observations could be summarized from the above tables. The results of 10-fold
cross-validation and on other performance criteria with the three models show almost similar
results of high accuracy for estimation of TF and TR. In case of estimation of TF, the maximum
value for MPPA has been obtained using RBFN as well as BP-MLP. On the other hand, the worst
prediction accuracy (WPPA) for RBFN and BP-MLP has been calculated as 66.243% and
66.049%, respectively. Hence, the performance of RBFN being superior to that for other neural
network algorithms is clearly observed for estimation of TF content in the orthodox black tea. In
case of estimation of TR, the maximum value for MPPA is obtained using GRNN. But, RBFN
also gives almost the same level of accuracy. It may also be observed that, the SDPE value for
RBFN is more than that of GRNN. Again, the worst prediction accuracy (WPPA) for RBFN is
larger compare to that of GRNN. Hence, the performance of RBFN being superior to that against
other neural network algorithms is clearly observed for estimation of TR as well. The quality
scores of tea samples considered in this study was given by tea tasters are plotted against the
concentrations of TF and TR in Fig. 7(a) and Fig. 7(b). A positive correlation between Tea
Tasters’ score with TF and TR values has been clearly observed. Thus the proposed methodology
for the approximate estimation of TF and TR contents can give a fair idea about the quality of
Tea.

INTERNATIONAL JOURNAL ON SMART SENSING AND INTELLIGENT SYSTEMS VOL. 9, NO. 2, JUNE 2016
727
Fig.7 (a) Plot of TF (%) with Tea Tasters’ Quality Scores.
Fig. 7 (b) Plot of TR (%) with Tea Tasters’ Quality Scores.
V. CONCLUSIONS
Theaflavins and Thearubigins are two very important chemical constituents for the formation of
tea liquor colour and brightness and the estimation of these chemical constituents gives a fair idea
about the quality of orthodox black tea. In this paper, an electronic vision system using low cost
digital camera and illumination set up has been described to estimate the TF and TR content.
Image of liquor sample is directly captured by the camera and image analysis techniques have
been employed for extraction of different colour features. The PCA analysis shows a tendency to
form different clusters. But, the formation of overlapping cluster indicates a non linear
relationship among the colour image data with TF and TR values. The performance of estimation
accuracy of TF and TR using three neural network techniques i.e. BP-MLP, GRNN and RBFN

Amitava Akuli, Abhra Pal, Gopinath Bej, Tamal Dey, Arunangshu Ghosh, Bipan Tudu, Nabarun Bhattacharyya and Rajib Bandyopadhyay, A MACHINE VISION SYSTEM FOR ESTIMATION OF THEAFLAVINS AND THEARUBIGINS IN ORTHODOX BLACK TEA
728
has been presented. The results of 10-fold cross-validation and on other performance criteria with
the three models show almost similar results of high accuracy thus establishing the efficacy of the
proposed solution for approximate TF and TR content. However, the performance of RBFN
being superior to that for other neural network algorithms is clearly observed for estimation of TF
content in the orthodox black tea. RBF models for TR shows performances better than BP-MLP
and can be compared with GRNN, except for the MPPA, WPPA values. The work presented here
suggests that an electronic vision can be applied to determine the approximate TF and TR content
in tea. However further research is required to study the effect of other chromatic compounds like
phephorbide, pheophytin and their effect on colour formation in tea liquor. All in all, the
proposed electronic vision method promises a new and rapid method for quality analysis of
orthodox black tea by facilitating instant estimation of important bio-chemical compounds of tea.
REFERENCES
[1] E.A.H. Roberts, The Phenolic substances of manufactured tea, their origin as enzymic
oxidation products in fermentation, Journal of the Science of Food and Agriculture 9 (1950),
212-216
[2] M. Obanda, P. Okinda Owuor, Richard Mangoka. Changes in the chemical and sensory
quality parameters of black tea due to variations of fermentation time and temperature, Food
Chemistry 75 (2001), 395–404.
[3] A. Ghosh, P. Tamuly, N. Bhattacharyya, B. Tudu, N. Gogoi, R. Bandyopadhyay, Estimation
of Theaflavin content in black tea using electronic tongue, Journal of Food Engineering 110
(2012), 71-79
[4] R.S.S. Kumar, N.N. Muraleedharan, S. Murugesan , G. Kottur, M.P. Anand, A. Nishadh,
Biochemical quality characteristics of CTC black teas of South India and their relation to
organoleptic evaluation, Food Chemistry 129 (2011), 847-853
[5] A. Ghosh, B. Tudu, P. Tamuly, N. Bhattacharyya, R. Bandyopadhyay, Prediction of
theaflavin and thearubigin content in black tea using a voltammetric electronic tongue,
Chemometrics and Intelligent Laboratory Systems 116 (2012), 57-66
[6] A. K. Biswas, A. R. Sarkar, Biological and Chemical factors affecting the valuation of North
East Indian Teas, Journal of the Science of Food and Agriculture 24 (1973), 1457-1477

INTERNATIONAL JOURNAL ON SMART SENSING AND INTELLIGENT SYSTEMS VOL. 9, NO. 2, JUNE 2016
729
[7] E.A.H. Roberts, R. F. Smith, Spectrophotometric measurements of theaflavins and
thearubigins in black tea liquors in assessment of quality of teas, Analyst (London) 86,
(1961), 94-98
[8] S. B. Deb, M. R. Ullah, The role of Theaflavins and Therubigins in the evaluation of black
tea, Two and a Bud 15 (1968), 101-102
[9] P. J. Hilton, R. T. Ellis, Estimation of market value of Central African Tea by theaflavins
analysis, Journal of the Science of Food and Agriculture 23 (1972), 227-232
[10] A. G. Devis, Theaflavins - objective quality indicators, Tea and Coffee Trade Journal 155
(1983), 34
[11] R. T. Ellis, J. B. Cloughley, The importance of theaflavins in black tea liquors, International
Tea Journal 2 (1981), 7-8
[12] E. A. H. Roberts, Chemistry of manufacturing in North East India, Journal of the Science of
Food and Agriculture 9 (1958), 381-390
[13] E. A.H. Roberts, Economic Importance of flavonoid substances: tea fermentation, In: T. A.
Geissmann, The chemistry of flavonoid compounds, Pergamon Press, Oxford UK, (1962),
468-512
[14] A. Akuli, A. Pal, R. Joshi, T. Dey, N. Bhattacharyya, A New Method For Rapid Detection Of
Total Colour (TC), Theaflavins (TF), Thearubigins (TR) and Brighness (TB) In Orthodox Tea
Using Electronic Vision System, IEEE International Conference on Sensing Technology,
(2012), 23-28
[15] A. Akuli, A. Pal , A. Ghosh, N. Bhattacharyya, Estimation of Theaflavins (TF) and
Thearubigin (TR) ration in Black Tea Liquor using E-Vision System, AIP International
Conference on Olfaction and Electronic nose, Volume 1362 (2011), 253-254
[16] P. K. Mahanta, Colour and flavour characteristics of made tea, In: H. F. Linkens, J. F.
Jackson (Eds.), Modern method of plant analysis, Spinger-Verlag (1988), 221-295
[17] P. J. Hilton, Tea, In: F. D. Snell & L. C. Ettre (Eds), Encyclopedia of industrial chemical
analysis, Jhon Wiley, New York (1973), 455-516
[18] M. R. Ullah, N. Gogoi, D. Baruah, The effect of withering on fermentation of tea leaf and
development of liquor character of black tea, Journal of the Science of Food and Agriculture
35 (1984), 1142-1147

Amitava Akuli, Abhra Pal, Gopinath Bej, Tamal Dey, Arunangshu Ghosh, Bipan Tudu, Nabarun Bhattacharyya and Rajib Bandyopadhyay, A MACHINE VISION SYSTEM FOR ESTIMATION OF THEAFLAVINS AND THEARUBIGINS IN ORTHODOX BLACK TEA
730
[19] A. Robertson, D. S. Bendall, Production and HPLC analysis of black tea theaflavins and
thearubigins during in vitro oxidation, Phytochemistry 22 (1983), 883-887
[20] R. G. Bailey, I. McDowell, H. E. Nursten, Use of HPLC photodiode array detection in a study
of nature of black tea liquor, Journal of the Science of Food and Agriculture 52(4), (1990),
509-525
[21] L. P. Wright, J. P. Aucamp, Z. Apostolides, Analysis of black tea theaflavins by non-acqeous
capillary electrophoresis, Journal of Chromatography A 919 (1), (2001), 205-213
[22] H. Y. Hsiao, R. L. C. Chen, T. Cheng, Determination of Tea fermentation degree by a rapid
micellar electrokinetic chromatography, Food Chemistry 120 (2), (2010), 632-636
[23] Gurpreet Singh, Neel Kamal, Machine Vision System for Tea Quality Determination - Tea
Quality Index (TQI), IOSR Journal of Engineering (IOSRJEN), 3 (7), (2013), 46-50
[24] Suprijanto, A.Rakhmawati, E. Yuliastuti, Compact Computer Vision/or Black Tea Qualify
Evaluation Based on the Black Tea Particles, IEEE/2nd International Conference on
Instrumentation Control and Automation (2011), 87-91
[25] Mohit Sharma, Edathiparambil Vareed Thomas, Electronic vision study of tea grains color
during Infusion, International Journal of Engineering Science Invention 2 (4), (2013), 52-58
[26] Surajit Borah, Manabendra Bhuyan, Computer based system for matching colours during the
monitoring of tea fermentation, International Journal of Food Science and Technology 40,
(2005), 675–682
[27] S Borah, M Bhuyan, Quality indexing by machine vision during fermentation in black tea
manufacturing, Sixth International Conference on Quality Control by Artificial Vision, SPIE,
5132 (2003), 468-475
[28] Amit Laddi, Neelam Rup Prakash, Shashi Sharma, Amod Kumar, Discrimination analysis of
Indian tea varieties based upon color under optimum illumination, Journal of Food
Measurement and Characterization, 7 (2), 2013, 60-65
[29] Gagandeep Singh Gill, Amod Kumar, Ravinder Agarwal, Monitoring and grading of tea by
computer vision – A review, Journal of Food Engineering, 106 (1), (2011), 13–19
[30] Arvind Kumar, Harjeet Singh, Shashi Sharma, Amod Kumar, Color Analysis of Black Tea
Liquor using Image Processing Techniques, IJECT 2(3), (2011), 292-296

INTERNATIONAL JOURNAL ON SMART SENSING AND INTELLIGENT SYSTEMS VOL. 9, NO. 2, JUNE 2016
731
[31] B.M.T. Lekamge, D.A.A.C. Ratnaweera, A Hybrid Approach for Online Tea Color
Separation, IEEE international conference on Industrial and Information Systems (ICIIS),
(2011), 70-75
[32] S. Haykin, Neural Networs - A comprehensive foundation, 2 nd Ed, Pearson Education, Asia
(2001)
[33] http://www.csc.kth.se/utbildning/kth/kurser/DD2432/ann14/forelasningsanteckningar/RBFN
Ntutorial.pdf
[34] Donald F. SpechtI, A General Regression Neural Network, IEEE transactions on neural
networks, vol. 2. NO. 6. (1991)
[35] Matthias M. Bauer, General Regression Neural Network, GRNN-A Neural Network for
Technical Use, A thesis submitted in partial fulfillment of the requirements of the degree of
Master of Science (Chemical Engineering)at the University of Wisconsin-Madison (2000)
[36] M.R. Ullah, A rapid procedure for estimating theaflavins and thearubigins of black tea, Two
Bud 33 (1986), 46-48.
[37] AOAC, Official Methods of Analysis, Association of official Analytical Chemists,
Washington DC, USA Sec 15.049-15.054, (1971) 239
[38] N. Bhattacharyya, R. Bandyopadhyay, M. Bhuyan, B, Tudu, D. Ghosh, A. jana, Electronic
Nose for black tea classification and correlation of measurements with "Tea Taster" marks,
IEEE Transaction on Measurement and Instrumentation 57 (7) (2008), 1313-1321
[39] Rafael C. Gonzalez, Richard E. Woods, Digital Image Processing, Prentice Hall, 2nd Ed,
(2002)
[40] M. E. Wall, A. Rachtsteiner, L. M. Rocha, Singular value decomposition and principal
component analysis, In: A practical approach to micro array data analysis, D. P. Berrar, W.
Dibitzky, M. Granzow, eds, Kluwer Norwell, MA (2003), 91-109.
![Current Cybersecurity Maturity Models: How Effective in ...ceur-ws.org/Vol-2348/paper16.pdf · Smart Healthcare and Safety Systems awareness, visibility and accountability [2], and](https://img.pdfslide.us/doc/110x75/5e0d0831d59073136e0dd75b/current-cybersecurity-maturity-models-how-effective-in-ceur-wsorgvol-2348.jpg)