Embed Size (px)
Citation preview

A Machine Learning Proposal for Predicting the Success Rate of IT-Projects Based on Project
Metrics Before Initiation
Author: Nathalie Esmée Janssen University of Twente
P.O. Box 217, 7500AE Enschede The Netherlands
ABSTRACT
Thus far, the influence of information technology (IT) has grown tremendously
with regards to all different aspects of today’s society. As a result, many IT-
projects have been initiated however the success rates are rather limited. As a
matter of fact, research has shown that approximately 1 out of 3 IT-projects fail.
Over the years, a number of researchers started to examine predictive techniques
to see to what extent it is possible to predict success. Various models are proposed,
however until now, none of them is focused on predicting success before initiation.
With the use of extensive literature research to critical success factors and project
metrics, a new set of variables is given that is fully focused on IT-projects.
Moreover, this set was validated through interviews with experts and a survey
after which average importance scores were given to each critical success factor
and metric. Lastly, general measurements are provided for each project metric
that has a significant influence on the success of a project. This way, the conducted
study provided a solid base for the development of a prediction model that will
validate the results of this thesis once an appropriate dataset has been found.
Therefore, this thesis serves as a guideline for future research on how to predict
the success of IT-projects based on project metrics before initiation.
Graduation Committee members:
Dr. A.B.J.M. Wijnhoven
Dr. M. de Visser
Keywords Project Success, Critical Success Factors, Project Management, Success Rate Prediction, Prediction Instrument
This is an open-access article under the terms of the Creative Commons Attribution License, which permits the use, distribution and reproduction in any medium, provided the original work is properly cited.
CC-BY-NC
2
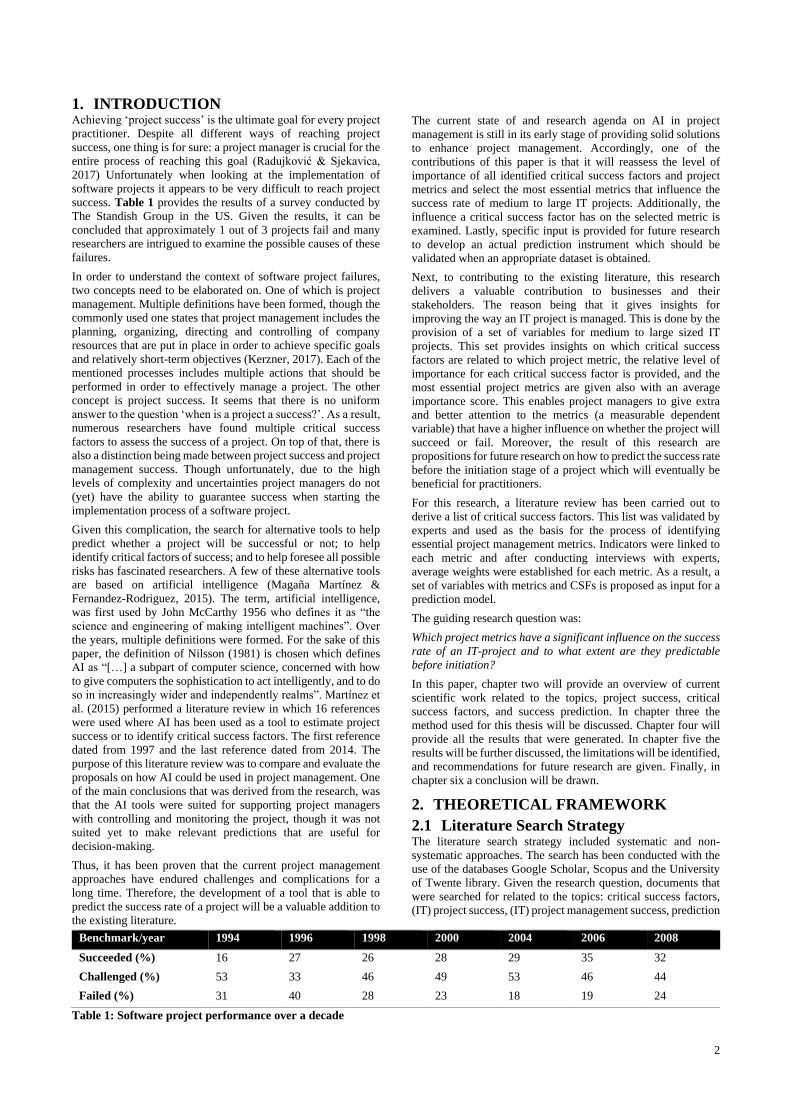
1. INTRODUCTION Achieving ‘project success’ is the ultimate goal for every project
practitioner. Despite all different ways of reaching project
success, one thing is for sure: a project manager is crucial for the
entire process of reaching this goal (Radujković & Sjekavica,
2017) Unfortunately when looking at the implementation of
software projects it appears to be very difficult to reach project
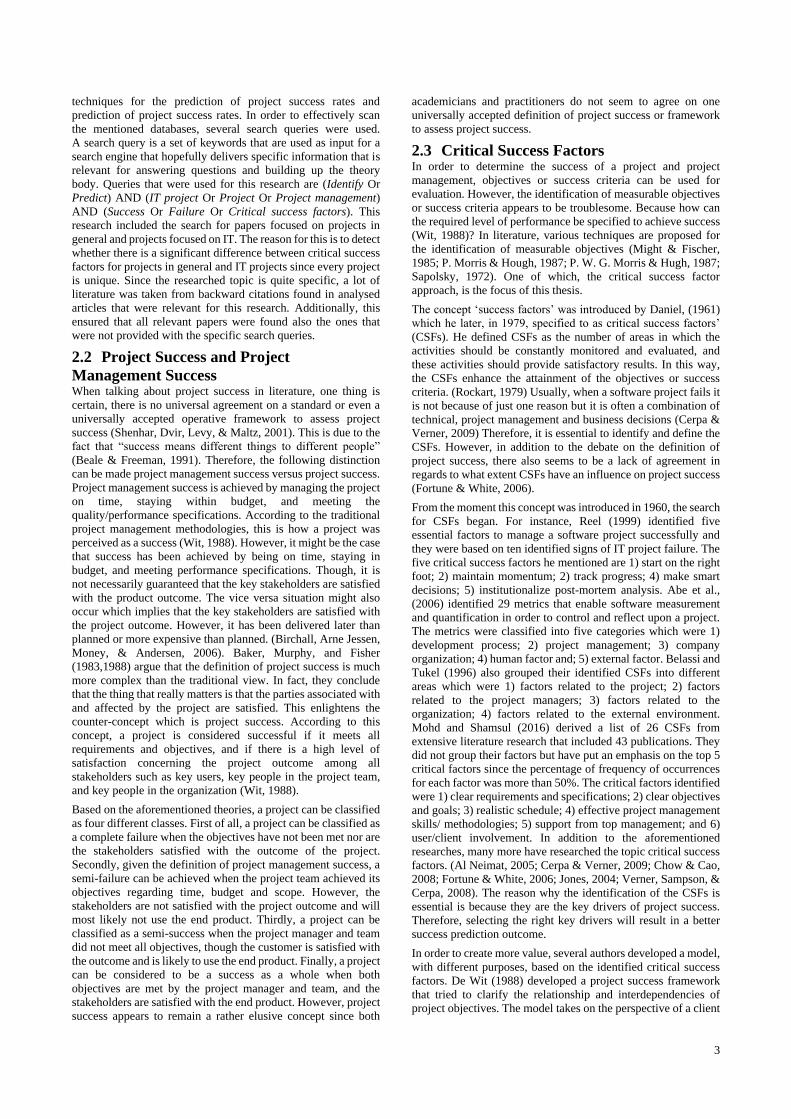
success. Table 1 provides the results of a survey conducted by
The Standish Group in the US. Given the results, it can be
concluded that approximately 1 out of 3 projects fail and many
researchers are intrigued to examine the possible causes of these
failures.
In order to understand the context of software project failures,
two concepts need to be elaborated on. One of which is project
management. Multiple definitions have been formed, though the
commonly used one states that project management includes the
planning, organizing, directing and controlling of company
resources that are put in place in order to achieve specific goals
and relatively short-term objectives (Kerzner, 2017). Each of the
mentioned processes includes multiple actions that should be
performed in order to effectively manage a project. The other
concept is project success. It seems that there is no uniform
answer to the question ‘when is a project a success?’. As a result,
numerous researchers have found multiple critical success
factors to assess the success of a project. On top of that, there is
also a distinction being made between project success and project
management success. Though unfortunately, due to the high
levels of complexity and uncertainties project managers do not
(yet) have the ability to guarantee success when starting the
implementation process of a software project.
Given this complication, the search for alternative tools to help
predict whether a project will be successful or not; to help
identify critical factors of success; and to help foresee all possible
risks has fascinated researchers. A few of these alternative tools
are based on artificial intelligence (Magaña Martínez &
Fernandez-Rodriguez, 2015). The term, artificial intelligence,
was first used by John McCarthy 1956 who defines it as “the
science and engineering of making intelligent machines”. Over
the years, multiple definitions were formed. For the sake of this
paper, the definition of Nilsson (1981) is chosen which defines
AI as “[…] a subpart of computer science, concerned with how
to give computers the sophistication to act intelligently, and to do
so in increasingly wider and independently realms”. Martínez et
al. (2015) performed a literature review in which 16 references
were used where AI has been used as a tool to estimate project
success or to identify critical success factors. The first reference
dated from 1997 and the last reference dated from 2014. The
purpose of this literature review was to compare and evaluate the
proposals on how AI could be used in project management. One
of the main conclusions that was derived from the research, was
that the AI tools were suited for supporting project managers
with controlling and monitoring the project, though it was not
suited yet to make relevant predictions that are useful for
decision-making.
Thus, it has been proven that the current project management
approaches have endured challenges and complications for a
long time. Therefore, the development of a tool that is able to
predict the success rate of a project will be a valuable addition to
the existing literature.
Table 1: Software project performance over a decade
The current state of and research agenda on AI in project
management is still in its early stage of providing solid solutions
to enhance project management. Accordingly, one of the
contributions of this paper is that it will reassess the level of
importance of all identified critical success factors and project
metrics and select the most essential metrics that influence the
success rate of medium to large IT projects. Additionally, the
influence a critical success factor has on the selected metric is
examined. Lastly, specific input is provided for future research
to develop an actual prediction instrument which should be
validated when an appropriate dataset is obtained.
Next, to contributing to the existing literature, this research
delivers a valuable contribution to businesses and their
stakeholders. The reason being that it gives insights for
improving the way an IT project is managed. This is done by the
provision of a set of variables for medium to large sized IT
projects. This set provides insights on which critical success
factors are related to which project metric, the relative level of
importance for each critical success factor is provided, and the
most essential project metrics are given also with an average
importance score. This enables project managers to give extra
and better attention to the metrics (a measurable dependent
variable) that have a higher influence on whether the project will
succeed or fail. Moreover, the result of this research are
propositions for future research on how to predict the success rate
before the initiation stage of a project which will eventually be
beneficial for practitioners.
For this research, a literature review has been carried out to
derive a list of critical success factors. This list was validated by
experts and used as the basis for the process of identifying
essential project management metrics. Indicators were linked to
each metric and after conducting interviews with experts,
average weights were established for each metric. As a result, a
set of variables with metrics and CSFs is proposed as input for a
prediction model.
The guiding research question was:
Which project metrics have a significant influence on the success
rate of an IT-project and to what extent are they predictable
before initiation?
In this paper, chapter two will provide an overview of current
scientific work related to the topics, project success, critical
success factors, and success prediction. In chapter three the
method used for this thesis will be discussed. Chapter four will
provide all the results that were generated. In chapter five the
results will be further discussed, the limitations will be identified,
and recommendations for future research are given. Finally, in
chapter six a conclusion will be drawn.
2. THEORETICAL FRAMEWORK
2.1 Literature Search Strategy The literature search strategy included systematic and non-
systematic approaches. The search has been conducted with the
use of the databases Google Scholar, Scopus and the University
of Twente library. Given the research question, documents that
were searched for related to the topics: critical success factors,
(IT) project success, (IT) project management success, prediction
Benchmark/year 1994 1996 1998 2000 2004 2006 2008
Succeeded (%)
Challenged (%)
Failed (%)
16
53
31
27
33
40
26
46
28
28
49
23
29
53
18
35
46
19
32
44
24
3
techniques for the prediction of project success rates and
prediction of project success rates. In order to effectively scan
the mentioned databases, several search queries were used.
A search query is a set of keywords that are used as input for a
search engine that hopefully delivers specific information that is
relevant for answering questions and building up the theory
body. Queries that were used for this research are (Identify Or
Predict) AND (IT project Or Project Or Project management)
AND (Success Or Failure Or Critical success factors). This
research included the search for papers focused on projects in
general and projects focused on IT. The reason for this is to detect
whether there is a significant difference between critical success
factors for projects in general and IT projects since every project
is unique. Since the researched topic is quite specific, a lot of
literature was taken from backward citations found in analysed
articles that were relevant for this research. Additionally, this
ensured that all relevant papers were found also the ones that
were not provided with the specific search queries.
2.2 Project Success and Project
Management Success When talking about project success in literature, one thing is
certain, there is no universal agreement on a standard or even a
universally accepted operative framework to assess project
success (Shenhar, Dvir, Levy, & Maltz, 2001). This is due to the
fact that “success means different things to different people”
(Beale & Freeman, 1991). Therefore, the following distinction
can be made project management success versus project success.
Project management success is achieved by managing the project
on time, staying within budget, and meeting the
quality/performance specifications. According to the traditional
project management methodologies, this is how a project was
perceived as a success (Wit, 1988). However, it might be the case
that success has been achieved by being on time, staying in
budget, and meeting performance specifications. Though, it is
not necessarily guaranteed that the key stakeholders are satisfied
with the product outcome. The vice versa situation might also
occur which implies that the key stakeholders are satisfied with
the project outcome. However, it has been delivered later than
planned or more expensive than planned. (Birchall, Arne Jessen,
Money, & Andersen, 2006). Baker, Murphy, and Fisher
(1983,1988) argue that the definition of project success is much
more complex than the traditional view. In fact, they conclude
that the thing that really matters is that the parties associated with
and affected by the project are satisfied. This enlightens the
counter-concept which is project success. According to this
concept, a project is considered successful if it meets all
requirements and objectives, and if there is a high level of
satisfaction concerning the project outcome among all
stakeholders such as key users, key people in the project team,
and key people in the organization (Wit, 1988).
Based on the aforementioned theories, a project can be classified
as four different classes. First of all, a project can be classified as
a complete failure when the objectives have not been met nor are
the stakeholders satisfied with the outcome of the project.
Secondly, given the definition of project management success, a
semi-failure can be achieved when the project team achieved its
objectives regarding time, budget and scope. However, the
stakeholders are not satisfied with the project outcome and will
most likely not use the end product. Thirdly, a project can be
classified as a semi-success when the project manager and team
did not meet all objectives, though the customer is satisfied with
the outcome and is likely to use the end product. Finally, a project
can be considered to be a success as a whole when both
objectives are met by the project manager and team, and the
stakeholders are satisfied with the end product. However, project
success appears to remain a rather elusive concept since both
academicians and practitioners do not seem to agree on one
universally accepted definition of project success or framework
to assess project success.
2.3 Critical Success Factors In order to determine the success of a project and project
management, objectives or success criteria can be used for
evaluation. However, the identification of measurable objectives
or success criteria appears to be troublesome. Because how can
the required level of performance be specified to achieve success
(Wit, 1988)? In literature, various techniques are proposed for
the identification of measurable objectives (Might & Fischer,
1985; P. Morris & Hough, 1987; P. W. G. Morris & Hugh, 1987;
Sapolsky, 1972). One of which, the critical success factor
approach, is the focus of this thesis.
The concept ‘success factors’ was introduced by Daniel, (1961)
which he later, in 1979, specified to as critical success factors’
(CSFs). He defined CSFs as the number of areas in which the
activities should be constantly monitored and evaluated, and
these activities should provide satisfactory results. In this way,
the CSFs enhance the attainment of the objectives or success
criteria. (Rockart, 1979) Usually, when a software project fails it
is not because of just one reason but it is often a combination of
technical, project management and business decisions (Cerpa &
Verner, 2009) Therefore, it is essential to identify and define the
CSFs. However, in addition to the debate on the definition of
project success, there also seems to be a lack of agreement in
regards to what extent CSFs have an influence on project success
(Fortune & White, 2006).
From the moment this concept was introduced in 1960, the search
for CSFs began. For instance, Reel (1999) identified five
essential factors to manage a software project successfully and
they were based on ten identified signs of IT project failure. The
five critical success factors he mentioned are 1) start on the right
foot; 2) maintain momentum; 2) track progress; 4) make smart
decisions; 5) institutionalize post-mortem analysis. Abe et al.,
(2006) identified 29 metrics that enable software measurement
and quantification in order to control and reflect upon a project.
The metrics were classified into five categories which were 1)
development process; 2) project management; 3) company
organization; 4) human factor and; 5) external factor. Belassi and
Tukel (1996) also grouped their identified CSFs into different
areas which were 1) factors related to the project; 2) factors
related to the project managers; 3) factors related to the
organization; 4) factors related to the external environment.
Mohd and Shamsul (2016) derived a list of 26 CSFs from
extensive literature research that included 43 publications. They
did not group their factors but have put an emphasis on the top 5
critical factors since the percentage of frequency of occurrences
for each factor was more than 50%. The critical factors identified
were 1) clear requirements and specifications; 2) clear objectives
and goals; 3) realistic schedule; 4) effective project management
skills/ methodologies; 5) support from top management; and 6)
user/client involvement. In addition to the aforementioned
researches, many more have researched the topic critical success
factors. (Al Neimat, 2005; Cerpa & Verner, 2009; Chow & Cao,
2008; Fortune & White, 2006; Jones, 2004; Verner, Sampson, &
Cerpa, 2008). The reason why the identification of the CSFs is
essential is because they are the key drivers of project success.
Therefore, selecting the right key drivers will result in a better
success prediction outcome.
In order to create more value, several authors developed a model,
with different purposes, based on the identified critical success
factors. De Wit (1988) developed a project success framework
that tried to clarify the relationship and interdependencies of
project objectives. The model takes on the perspective of a client
4
for a commercial oil-field development project. The identified
limitation admits that this framework is not yet an operational
framework that can be used for different projects. Additionally,
this research concludes that an objective measurement of success
of a project is an illusion due to the uniqueness of all projects and
due to all different perceptions on success from different
stakeholders. In contrary to these conclusions, Fortune and White
(2006) argue that they are able to capture different stakeholder
viewpoints and use critical success factors in order to state
whether a project is a success or a failure at a certain moment in
time. 63 publications were reviewed which led to the
identification of 27 CSFs. Based on all the identified factors, they
developed a formal system model (FSM). This model is used to
conceptualize a moment in time as a system, followed by a
comparison of this outcome to the FSM. Thereafter the extent to
which the components are successfully working without failure
will be evaluated. Additionally, it shows to a certain extent how
factors are related to one another. Cerpa and Verner (2009) also
developed a map in which relationships between the most
important failure factors were depicted, however it did not show
whether a causal relationship was present. To the contrary,
Rodriguez-Repiso et al., (2007) introduced the approach of using
Fuzzy Cognitive Maps (FCM) for modelling critical success
factors and defining the relationships among them. An FCM
combines fuzzy logic and neural networks and is able to indicate
whether a relationship between factors is either positive or
negative. In order to make this model even more valuable, fuzzy
weights are a valuable addition. With these weights, not only the
direction of the relationships is shown but also the magnitude of
the change.
2.4 Prediction of Project Success Due to the high complexity and uncertainties, the development
and implementation process of an IT project has a high failure
rate. Even though software programs are being developed since
the 1960s, the ability to substantially increase the success rate of
IT projects is still not fully developed (Cerpa, Bardeen,
Kitchenham, & Verner, 2010). The aforementioned approach to
mitigate the high risk of failure was to identify and focus on the
critical success factors. Additionally, researchers started to build
models that are able to predict the success probability of a(n) (IT)
project (Reyes, Cerpa, Candia-Véjar, & Bardeen, 2011). In order
to capture all papers in which an AI-tool has been proposed for
success prediction or critical success factor identification,
Martínez and Rodriguez (2015) performed a literature review
and a structured analysis. Sixteen publications were found from
which several algorithms were proposed for the prediction
project success which will be explained in the following sections.
2.4.1 Bayesian Classifier Abe et al., (2006) predicted the final status of a software
development project with the use of the Bayesian Classifier.
After the selection and validation process of metrics, the
Bayesian classifier was applied to classify the project as either
successful or unsuccessful. The results, however, are limited to
only three viewpoints with regard to success which are focused
on 1) the quality of the product, 2) the cost of development and
3) the duration of the project. The prediction is based on a set of
metrics of which some of them are strongly related to one of the
viewpoints. However, for some of the metrics, there is not a
direct relation to one of the viewpoints which were then left out
of the prediction model. As a result, a metric that could
potentially have an impact on success, in general, is excluded
which may lead to an incomplete prediction outcome. Also, it is
unclear whether a project was seen as a success in general when
the prediction for one of the success viewpoints was
unsuccessful. Lastly, in order to build the Bayesian model, the
assumption of independence among the predictors is taken. Even
though it is hardly possible to have a dataset with independent
predictors the results generated by this classifier is surprisingly
well.
2.4.2 Super Vector Machine and Fast-Messy
Genetic Algorithm Cheng, Wu, & Wu, (2010) Proposes an evolutionary support
vector machine inference model (ESIM) which is a hybrid that
integrates a support vector machine (SVM) with a fast-messy
genetic algorithm (fmGA). The SVM is a learning machine for
two-group classification problems, which was first suggested by
Cortes and Vapnik (1995). The data is separated by a decision
boundary and the data points that are closest to this boundary are
the so-called support vectors. The aim is to maximize the margin
between the support vectors and the decision boundary because
this will lead to a lower generalization error. If it is minimised,
the SVM will be susceptible to overfitting which will lead to poor
performance. The fmGA was introduced by Goldberg et al.,
(1993) which can identify optimal solutions efficiently for large-
scale permutation problems. Therefore, this method was added
to the ESIM for optimization purposes. Furthermore, to improve
the accuracy, K-means clustering was used to aggregate similar
data and identify discrepancies between clustered categories. The
generated results show that the combination of these AI tools is
a feasible and effective approach. However, the dataset used for
this research contains typical construction projects, therefore, it
would be interesting to evaluate the performance with medium
to large IT-projects data.
2.4.3 Logistic Regression Cerpa et al., (2010) proposed a logistic regression (LR) model
for a set of variables to predict project success. LR is another
technique for classification problems of which the outcome is
measured with a dichotomous variable. The utilized dataset
contained heterogeneous data which was collected from multiple
companies and was tested against a homogenous dataset that
contained data from only one company. The focus of this
research was to identify the right cut-off point in order to
optimize the accuracy rate and the authors stressed the
importance of taking into account the context of the project for
doing so. The question raised is: “Is it more desirable to
accurately predict a failure, or to accurately predict a success?”.
For software projects the cost of failure and the cost of success
appear to be relatively equal, so the cut-off that gave the best
overall accuracy might be more important than the accuracy of
only one classification.
Despite the positive results and findings, this model excluded
variables when values were missing which results in a less
accurate prediction outcome. Therefore, other analysis methods
should be employed to validate the results generated from the
standard logistic regression model.
3. METHODOLOGY
3.1 Prediction Instrument Development for
Complex Domains In order to develop a predictive model, the Prediction instrument
development for complex domains (Spoel, 2016) has been
utilized as an inspiration. This prediction instrument
development for complex domains is based on intelligence meta-
synthesis and consists of a preparation stage and three stages.
Due to the scope limitations of this thesis, the focus is only laying
on the preparation stage and stage one. Within the preparation
stage, the research domain and goal variable are defined. In stage
one, assumptions and hypotheses on factors that are influencing
what is predicted are gathered based on literature research and
experts’ views through qualitative methods.
5
Given the research question, the research domain is IT-projects
and the goal variable can be defined as predicting the success
rates of IT-projects. Given this, stage one was initiated which
consisted out of two parts. The first part included an extensive
and critical literature review. As mentioned in section 2.1.,
specific search queries have been used in order to perform
efficient literature research. Before full papers were analysed,
their abstracts were read and based on that it was chosen to
analyse the full paper or not. As a result, 58 papers were chosen
to be relevant and valuable for this thesis. From this literature
review, a list was derived that consisted of 59 critical success
factors that have a potential influence on the success of an IT-
project.
From literature, it was assumed that the stakeholders with the
highest influence on project success were the client, project
manager, project team and organization. The organization as a
stakeholder was included due to the impact of the project on its
revenue, reputation and their impact on the project with regards
to providing a satisfying working environment, having adequate
resources in place and providing support from senior
management. Thus, in order to structure the factors that were
found, they were grouped into categories that related to one of
the four important stakeholders.
Moreover, while observing and classifying the factors to a
category, a few factors were removed. This was due to
irrelevance or because they were merged into one factor due to
the fact that different authors meant the same but used a slightly
different formulation. Eventually, a list of 39 critical success
factors remained of which 17 factors were related to the project
manager, 8 factors related to the project team, 5 factors related to
the client and 9 factors related to the organization.
Lastly, when the factors were classified according to important
stakeholders, the CSFs were again put in classes according to
which KPI they were related. Within the category ‘project
manager related factors’ the five classes that appeared were 1)
project manager capabilities, 2) scope and goal of the project, 3)
planning, 4) quality, and 5) project management methodology.
Within the ‘project team related factors’ three classes were
formulated, 1) working environment, 2) method for way of
working, and 3) team member capabilities. For the ‘client-related
factors’ two classes arose which were 1) budget, and 2) client
involvement. Finally, three classes appeared for the
‘organizational related factors’ which were 1) support and
involvement of the organization, 2) working environment, and 3)
availability of resources.
The objective for these classifications was to eventually
formulate the most important metrics that will be included in the
predictive model. The essence of defining metrics is because
project management metrics are being used to estimate or gauge
how well the performance of a component is, in contrast to the
critical success factors that only evaluate the state the project is
in. Therefore, the use of project management metrics is a way to
measure the success of a project. (Whiting, 2002).
The second part of stage one was to find the right experts to
conduct a semi-structured interview. First of all, research
regarding which companies are engaged in IT-projects in the
region of Twente was conducted. Next to this, only companies
engaged in larger projects were chosen since the scope of this
thesis considers medium to high complex IT-projects that entail
high and many risks. Eventually, four experts were found that
agreed on participating in an interview and fill out a
questionnaire. All these experts were male between the age of 25
and 45 and had significant experience in the field of this research.
The reason why a semi-structured interview was conducted, was
due to the fact that it was desired to have an additional open
discussion that could possibly give more insights. In addition to
the interview, a questionnaire was created with a 7-point Likert
scale in which the experts had to assess the importance of each
CSF and metric that was formulated. These scores were
evaluated and eventually, weights were calculated for every CSF
and metric by looking at the average scores.
4. RESULTS
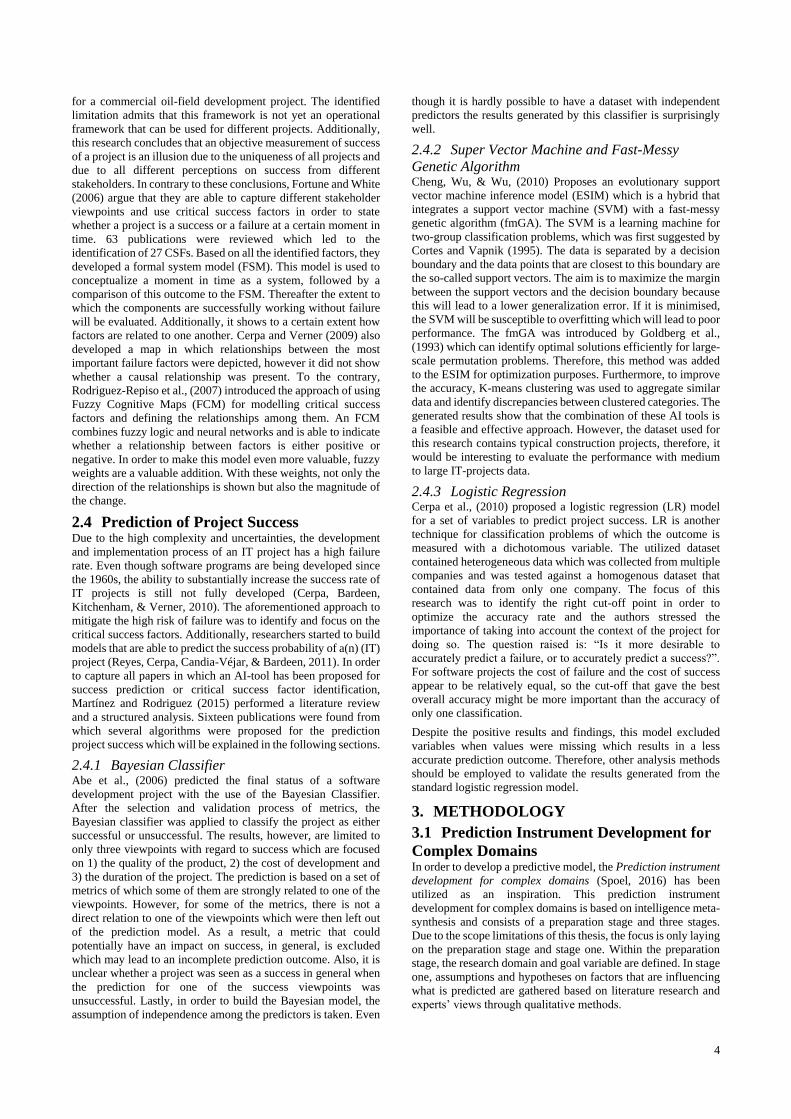
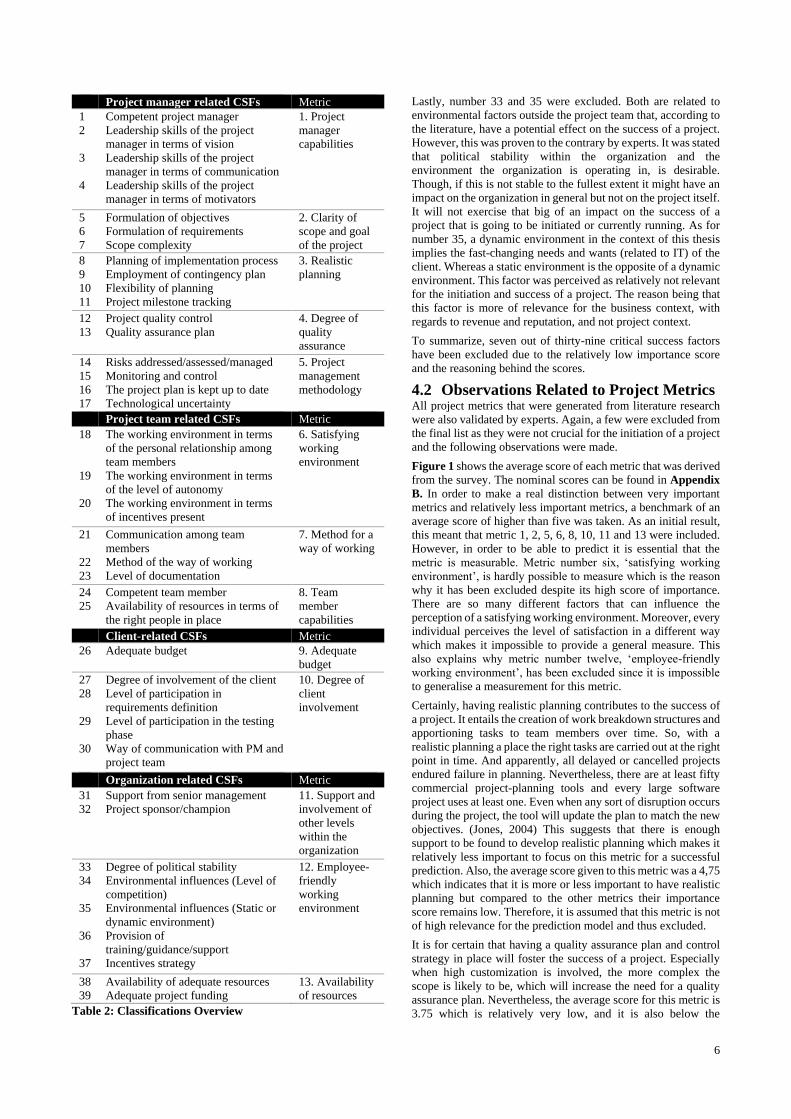
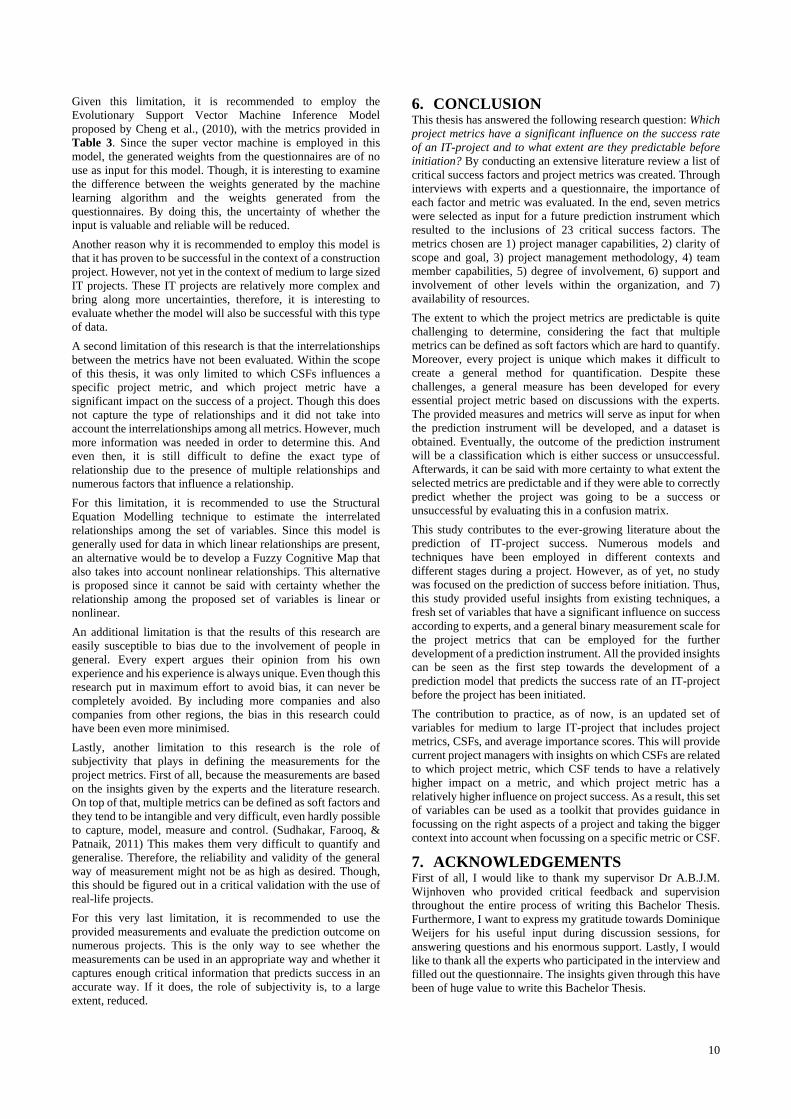
4.1 Observations Related to CSFs The results presented in Table 2 were generated based on stage
one of the prediction instrument development. All critical
success factors that were identified during the literature research
were noted down and were validated with four experts through a
survey and an interview. The average scores can be found in
Appendix A. Some factors were excluded from the final list as
they were not crucial for the initiation of a project due to the
following observations.
First of all, number 12 was considered to be relatively less
important. The reason being that project quality control, a
continuous activity, takes place when the project is initiated.
Even then, this factor is perceived to be quite stable by the
experts, and it is even self-evident that quality control takes part
throughout the whole project. The fact remains that project
quality control is of less importance compared to the other CSFs
when it comes to deciding whether to initiate a project or not.
Secondly, number 9 was not included in the final list. The
literature stated that there is a higher chance of success with a
contingency plan in place. However, in practice it is not
necessary to have a contingency plan developed when the actual
project has not been initiated yet. By all means, it is important to
take into account possible risks and how they should be
mitigated. Though these are considered in the risk analysis which
is part of the project plan. Developing a full contingency plan is
of more relevance when the project has been running for a while
and some major complications are coming up. For initiation, an
extensive and critical risk analysis is sufficient enough.
Then, number 17 was rejected due to the availability of many
technological solutions. In literature, this factor was perceived as
important since the higher the technological uncertainty, the
lesser the chance the project will be a success due to all the risks
and uncertainties that come along with high technological
uncertainty. However, nowadays there are e.g. multiple Saas-
solutions and licenses to receive access to the most advanced
technologies. Unless the project is concerned with innovation,
technological uncertainty is not really an issue anymore since
most technologies are already on the market. This insight was
given by an expert and has been validated by Choudhary (2007).
Therefore, this CSF is not perceived as an important factor for
the decision to start a project.
Another observation that was made, is that number 20 and 37 are
closely related and are therefore excluded. The reason why this
factor was included was because in literature it is stated that the
behaviour of people can positively change in terms of motivation
when incentives are in place. According to Skinners’ Operant
Conditioning theory, behaviour that is followed by pleasant
consequences (incentives) is likely to be repeated (Skinner,
1963). However, in practice, the incentive strategy does not work
in the long term. Since, medium to large IT-projects take on six
months at a minimum, having an incentive strategy in place is
not attainable. Given this time span, it’s hard to say when an
incentive would have been given if this was in place. On top of
that, if the motivation is driven by only incentives it should be
questioned whether the project manager or team member,
whomever it may concern, should be involved in the project.
6
Project manager related CSFs Metric
1
2
3
4
Competent project manager
Leadership skills of the project
manager in terms of vision
Leadership skills of the project
manager in terms of communication
Leadership skills of the project
manager in terms of motivators
1. Project
manager
capabilities
5
6
7
Formulation of objectives
Formulation of requirements
Scope complexity
2. Clarity of
scope and goal
of the project
8
9
10
11
Planning of implementation process
Employment of contingency plan
Flexibility of planning
Project milestone tracking
3. Realistic
planning
12
13
Project quality control
Quality assurance plan
4. Degree of
quality
assurance
14
15
16
17
Risks addressed/assessed/managed
Monitoring and control
The project plan is kept up to date
Technological uncertainty
5. Project
management
methodology
Project team related CSFs Metric
18
19
20
The working environment in terms
of the personal relationship among
team members
The working environment in terms
of the level of autonomy
The working environment in terms
of incentives present
6. Satisfying
working
environment
21
22
23
Communication among team
members
Method of the way of working
Level of documentation
7. Method for a
way of working
24
25
Competent team member
Availability of resources in terms of
the right people in place
8. Team
member
capabilities
Client-related CSFs Metric
26 Adequate budget 9. Adequate
budget
27
28
29
30
Degree of involvement of the client
Level of participation in
requirements definition
Level of participation in the testing
phase
Way of communication with PM and
project team
10. Degree of
client
involvement
Organization related CSFs Metric
31
32
Support from senior management
Project sponsor/champion
11. Support and
involvement of
other levels
within the
organization
33
34
35
36
37
Degree of political stability
Environmental influences (Level of
competition)
Environmental influences (Static or
dynamic environment)
Provision of
training/guidance/support
Incentives strategy
12. Employee-
friendly
working
environment
38
39
Availability of adequate resources
Adequate project funding
13. Availability
of resources
Table 2: Classifications Overview
Lastly, number 33 and 35 were excluded. Both are related to
environmental factors outside the project team that, according to
the literature, have a potential effect on the success of a project.
However, this was proven to the contrary by experts. It was stated
that political stability within the organization and the
environment the organization is operating in, is desirable.
Though, if this is not stable to the fullest extent it might have an
impact on the organization in general but not on the project itself.
It will not exercise that big of an impact on the success of a
project that is going to be initiated or currently running. As for
number 35, a dynamic environment in the context of this thesis
implies the fast-changing needs and wants (related to IT) of the
client. Whereas a static environment is the opposite of a dynamic
environment. This factor was perceived as relatively not relevant
for the initiation and success of a project. The reason being that
this factor is more of relevance for the business context, with
regards to revenue and reputation, and not project context.
To summarize, seven out of thirty-nine critical success factors
have been excluded due to the relatively low importance score
and the reasoning behind the scores.
4.2 Observations Related to Project Metrics All project metrics that were generated from literature research
were also validated by experts. Again, a few were excluded from
the final list as they were not crucial for the initiation of a project
and the following observations were made.
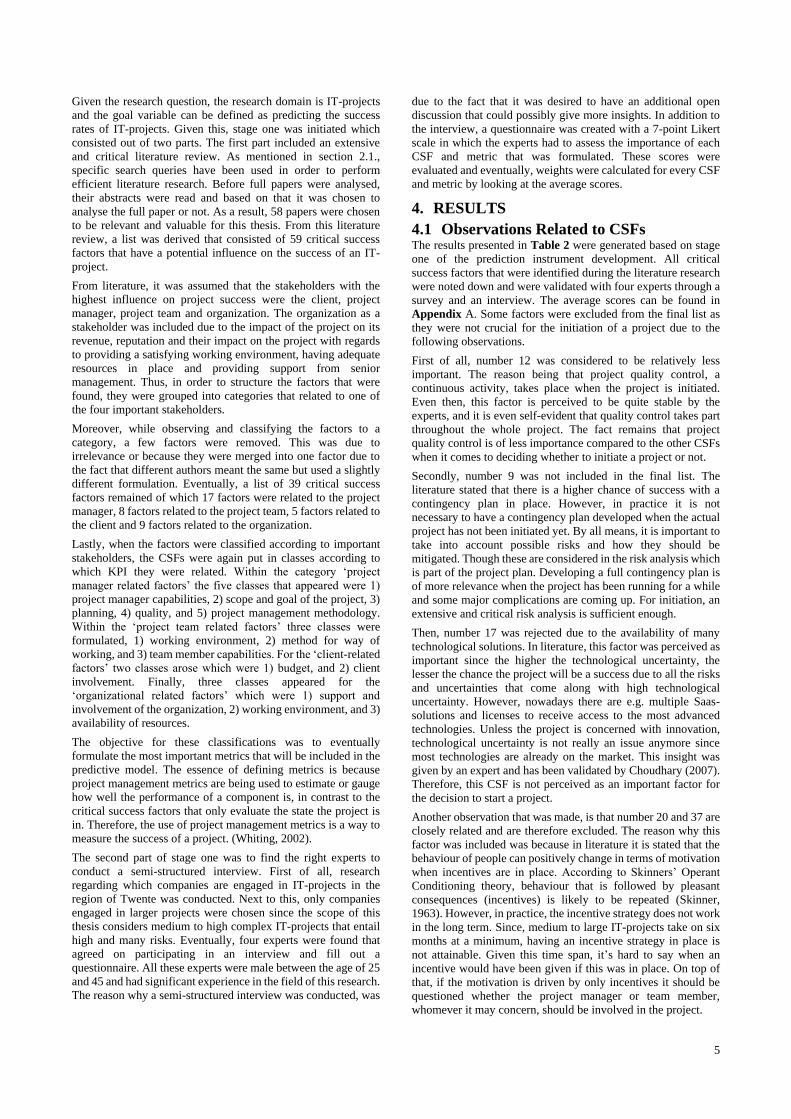
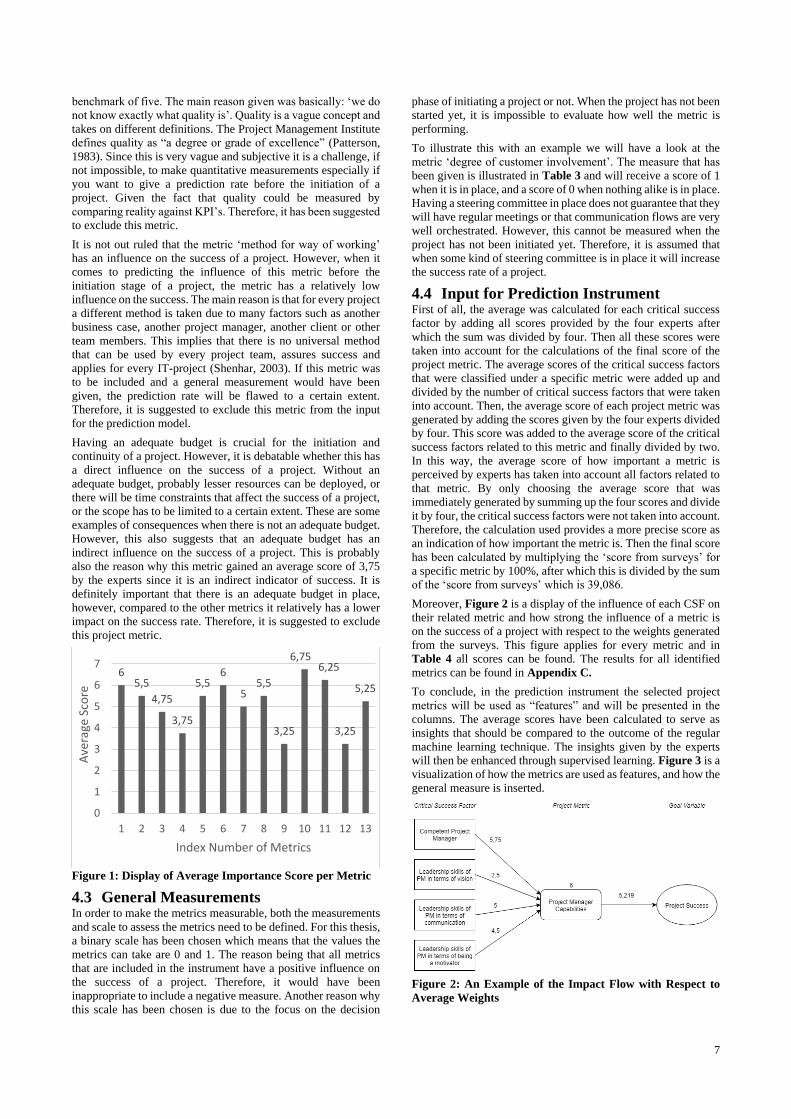
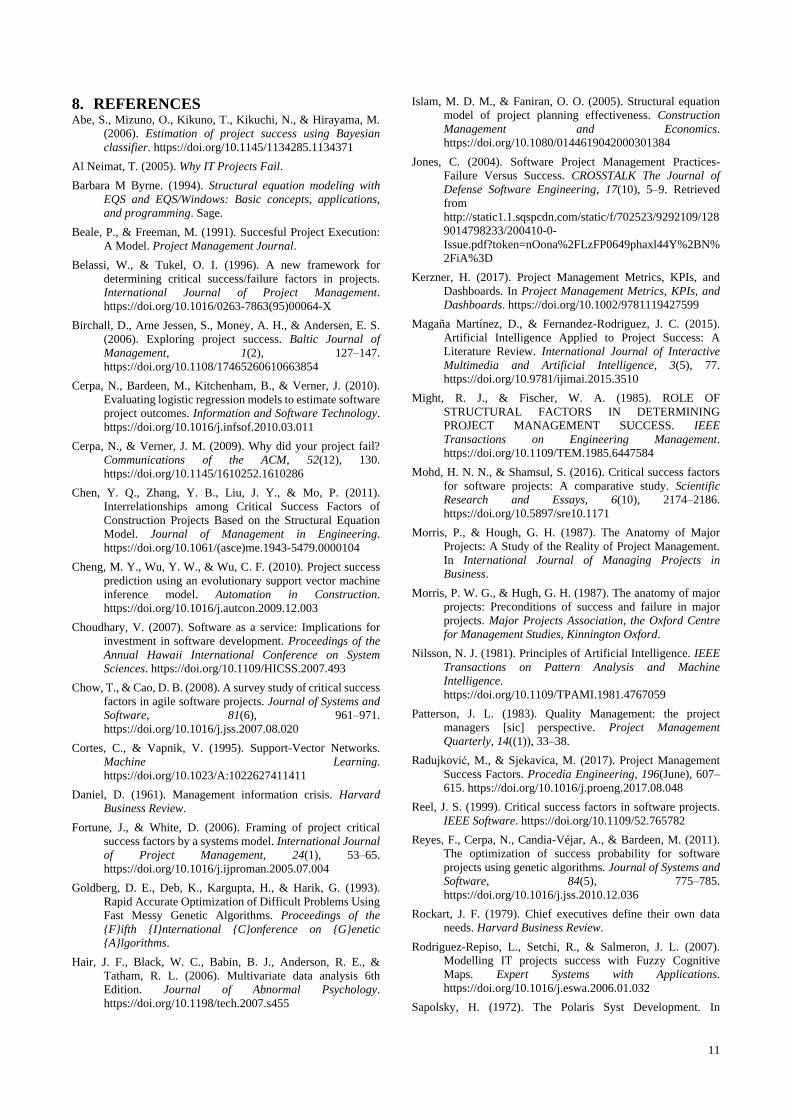
Figure 1 shows the average score of each metric that was derived
from the survey. The nominal scores can be found in Appendix
B. In order to make a real distinction between very important
metrics and relatively less important metrics, a benchmark of an
average score of higher than five was taken. As an initial result,
this meant that metric 1, 2, 5, 6, 8, 10, 11 and 13 were included.
However, in order to be able to predict it is essential that the
metric is measurable. Metric number six, ‘satisfying working
environment’, is hardly possible to measure which is the reason
why it has been excluded despite its high score of importance.
There are so many different factors that can influence the
perception of a satisfying working environment. Moreover, every
individual perceives the level of satisfaction in a different way
which makes it impossible to provide a general measure. This
also explains why metric number twelve, ‘employee-friendly
working environment’, has been excluded since it is impossible
to generalise a measurement for this metric.
Certainly, having realistic planning contributes to the success of
a project. It entails the creation of work breakdown structures and
apportioning tasks to team members over time. So, with a
realistic planning a place the right tasks are carried out at the right
point in time. And apparently, all delayed or cancelled projects
endured failure in planning. Nevertheless, there are at least fifty
commercial project-planning tools and every large software
project uses at least one. Even when any sort of disruption occurs
during the project, the tool will update the plan to match the new
objectives. (Jones, 2004) This suggests that there is enough
support to be found to develop realistic planning which makes it
relatively less important to focus on this metric for a successful
prediction. Also, the average score given to this metric was a 4,75
which indicates that it is more or less important to have realistic
planning but compared to the other metrics their importance
score remains low. Therefore, it is assumed that this metric is not
of high relevance for the prediction model and thus excluded.
It is for certain that having a quality assurance plan and control
strategy in place will foster the success of a project. Especially
when high customization is involved, the more complex the
scope is likely to be, which will increase the need for a quality
assurance plan. Nevertheless, the average score for this metric is
3.75 which is relatively very low, and it is also below the
7
benchmark of five. The main reason given was basically: ‘we do
not know exactly what quality is’. Quality is a vague concept and
takes on different definitions. The Project Management Institute
defines quality as “a degree or grade of excellence” (Patterson,
1983). Since this is very vague and subjective it is a challenge, if
not impossible, to make quantitative measurements especially if
you want to give a prediction rate before the initiation of a
project. Given the fact that quality could be measured by
comparing reality against KPI’s. Therefore, it has been suggested
to exclude this metric.
It is not out ruled that the metric ‘method for way of working’
has an influence on the success of a project. However, when it
comes to predicting the influence of this metric before the
initiation stage of a project, the metric has a relatively low
influence on the success. The main reason is that for every project
a different method is taken due to many factors such as another
business case, another project manager, another client or other
team members. This implies that there is no universal method
that can be used by every project team, assures success and
applies for every IT-project (Shenhar, 2003). If this metric was
to be included and a general measurement would have been
given, the prediction rate will be flawed to a certain extent.
Therefore, it is suggested to exclude this metric from the input
for the prediction model.
Having an adequate budget is crucial for the initiation and
continuity of a project. However, it is debatable whether this has
a direct influence on the success of a project. Without an
adequate budget, probably lesser resources can be deployed, or
there will be time constraints that affect the success of a project,
or the scope has to be limited to a certain extent. These are some
examples of consequences when there is not an adequate budget.
However, this also suggests that an adequate budget has an
indirect influence on the success of a project. This is probably
also the reason why this metric gained an average score of 3,75
by the experts since it is an indirect indicator of success. It is
definitely important that there is an adequate budget in place,
however, compared to the other metrics it relatively has a lower
impact on the success rate. Therefore, it is suggested to exclude
this project metric.
Figure 1: Display of Average Importance Score per Metric
4.3 General Measurements In order to make the metrics measurable, both the measurements
and scale to assess the metrics need to be defined. For this thesis,
a binary scale has been chosen which means that the values the
metrics can take are 0 and 1. The reason being that all metrics
that are included in the instrument have a positive influence on
the success of a project. Therefore, it would have been
inappropriate to include a negative measure. Another reason why
this scale has been chosen is due to the focus on the decision
phase of initiating a project or not. When the project has not been
started yet, it is impossible to evaluate how well the metric is
performing.
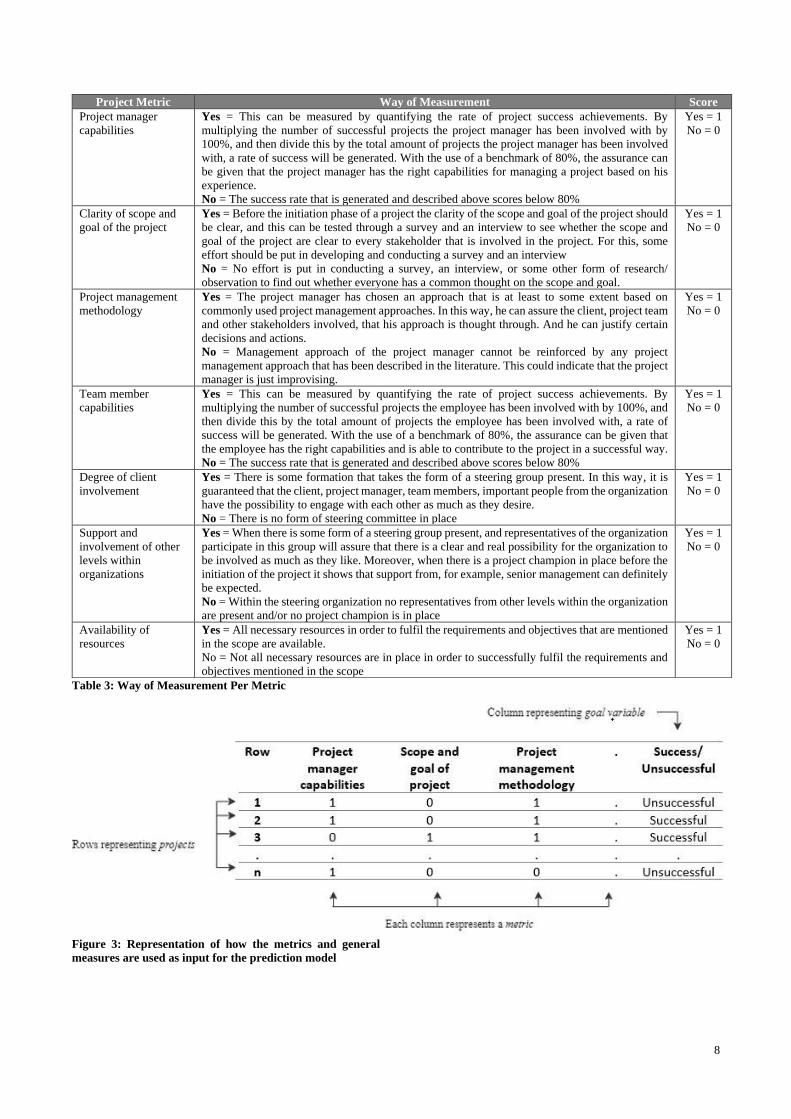
To illustrate this with an example we will have a look at the
metric ‘degree of customer involvement’. The measure that has
been given is illustrated in Table 3 and will receive a score of 1
when it is in place, and a score of 0 when nothing alike is in place.
Having a steering committee in place does not guarantee that they
will have regular meetings or that communication flows are very
well orchestrated. However, this cannot be measured when the
project has not been initiated yet. Therefore, it is assumed that
when some kind of steering committee is in place it will increase
the success rate of a project.
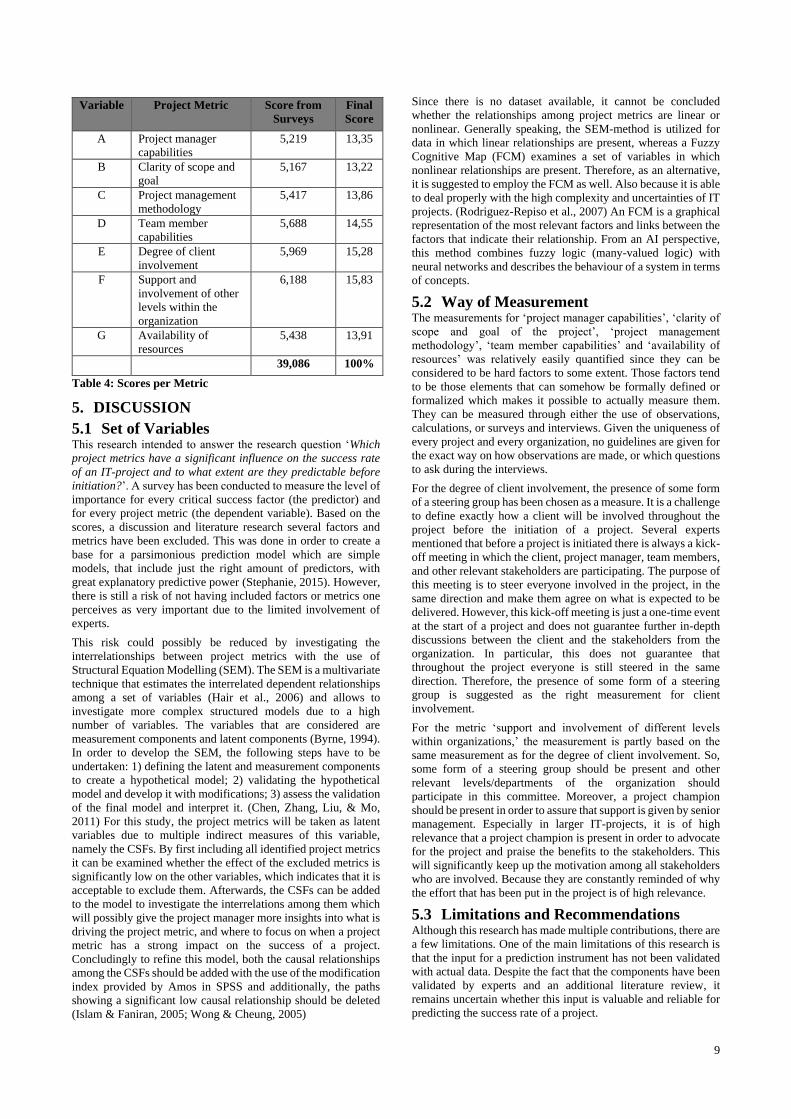
4.4 Input for Prediction Instrument First of all, the average was calculated for each critical success
factor by adding all scores provided by the four experts after
which the sum was divided by four. Then all these scores were
taken into account for the calculations of the final score of the
project metric. The average scores of the critical success factors
that were classified under a specific metric were added up and
divided by the number of critical success factors that were taken
into account. Then, the average score of each project metric was
generated by adding the scores given by the four experts divided
by four. This score was added to the average score of the critical
success factors related to this metric and finally divided by two.
In this way, the average score of how important a metric is
perceived by experts has taken into account all factors related to
that metric. By only choosing the average score that was
immediately generated by summing up the four scores and divide
it by four, the critical success factors were not taken into account.
Therefore, the calculation used provides a more precise score as
an indication of how important the metric is. Then the final score
has been calculated by multiplying the ‘score from surveys’ for
a specific metric by 100%, after which this is divided by the sum
of the ‘score from surveys’ which is 39,086.
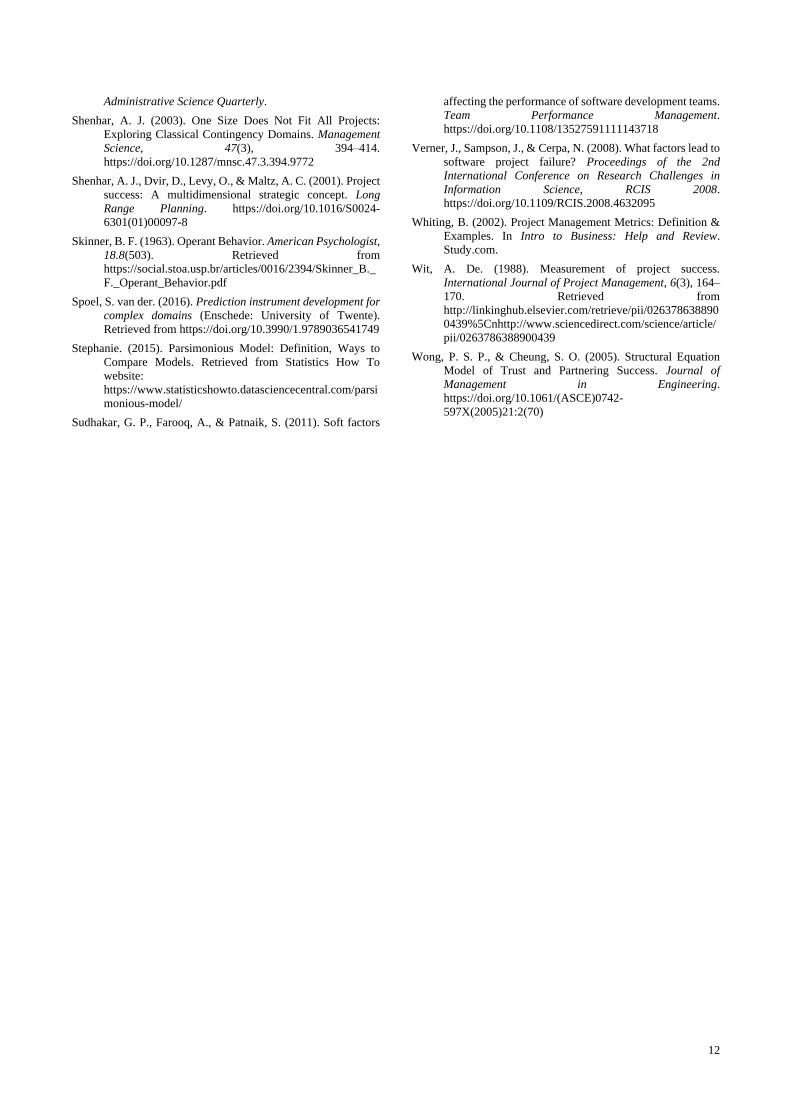
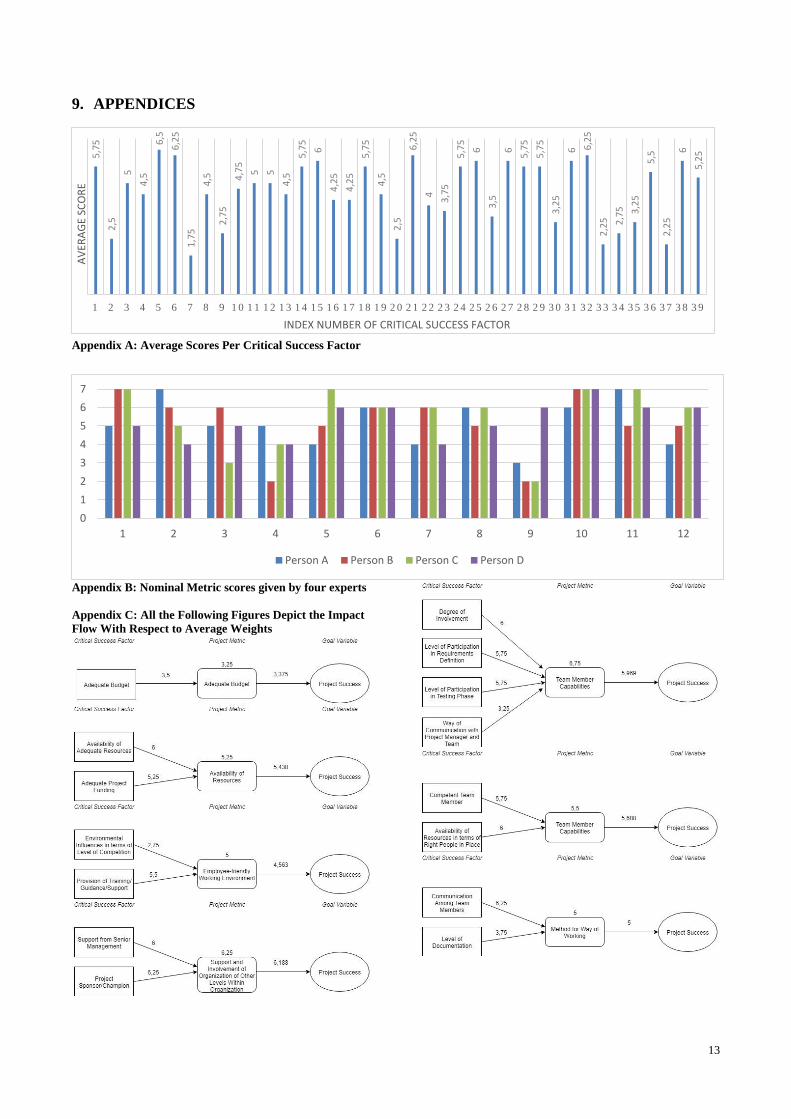
Moreover, Figure 2 is a display of the influence of each CSF on
their related metric and how strong the influence of a metric is
on the success of a project with respect to the weights generated
from the surveys. This figure applies for every metric and in
Table 4 all scores can be found. The results for all identified
metrics can be found in Appendix C.
To conclude, in the prediction instrument the selected project
metrics will be used as “features” and will be presented in the
columns. The average scores have been calculated to serve as
insights that should be compared to the outcome of the regular
machine learning technique. The insights given by the experts
will then be enhanced through supervised learning. Figure 3 is a
visualization of how the metrics are used as features, and how the
general measure is inserted.
Figure 2: An Example of the Impact Flow with Respect to
Average Weights
65,5
4,75
3,75
5,56
55,5
3,25
6,756,25
3,25
5,25
0
1
2
3
4
5
6
7
1 2 3 4 5 6 7 8 9 10 11 12 13
Ave
rage
Sco
re
Index Number of Metrics
8
Table 3: Way of Measurement Per Metric
Figure 3: Representation of how the metrics and general
measures are used as input for the prediction model
Project Metric Way of Measurement Score
Project manager
capabilities
Yes = This can be measured by quantifying the rate of project success achievements. By
multiplying the number of successful projects the project manager has been involved with by
100%, and then divide this by the total amount of projects the project manager has been involved
with, a rate of success will be generated. With the use of a benchmark of 80%, the assurance can
be given that the project manager has the right capabilities for managing a project based on his
experience.
No = The success rate that is generated and described above scores below 80%
Yes = 1
No = 0
Clarity of scope and
goal of the project
Yes = Before the initiation phase of a project the clarity of the scope and goal of the project should
be clear, and this can be tested through a survey and an interview to see whether the scope and
goal of the project are clear to every stakeholder that is involved in the project. For this, some
effort should be put in developing and conducting a survey and an interview
No = No effort is put in conducting a survey, an interview, or some other form of research/
observation to find out whether everyone has a common thought on the scope and goal.
Yes = 1
No = 0
Project management
methodology
Yes = The project manager has chosen an approach that is at least to some extent based on
commonly used project management approaches. In this way, he can assure the client, project team
and other stakeholders involved, that his approach is thought through. And he can justify certain
decisions and actions.
No = Management approach of the project manager cannot be reinforced by any project
management approach that has been described in the literature. This could indicate that the project
manager is just improvising.
Yes = 1
No = 0
Team member
capabilities
Yes = This can be measured by quantifying the rate of project success achievements. By
multiplying the number of successful projects the employee has been involved with by 100%, and
then divide this by the total amount of projects the employee has been involved with, a rate of
success will be generated. With the use of a benchmark of 80%, the assurance can be given that
the employee has the right capabilities and is able to contribute to the project in a successful way.
No = The success rate that is generated and described above scores below 80%
Yes = 1
No = 0
Degree of client
involvement
Yes = There is some formation that takes the form of a steering group present. In this way, it is
guaranteed that the client, project manager, team members, important people from the organization
have the possibility to engage with each other as much as they desire.
No = There is no form of steering committee in place
Yes = 1
No = 0
Support and
involvement of other
levels within
organizations
Yes = When there is some form of a steering group present, and representatives of the organization
participate in this group will assure that there is a clear and real possibility for the organization to
be involved as much as they like. Moreover, when there is a project champion in place before the
initiation of the project it shows that support from, for example, senior management can definitely
be expected.
No = Within the steering organization no representatives from other levels within the organization
are present and/or no project champion is in place
Yes = 1
No = 0
Availability of
resources
Yes = All necessary resources in order to fulfil the requirements and objectives that are mentioned
in the scope are available.
No = Not all necessary resources are in place in order to successfully fulfil the requirements and
objectives mentioned in the scope
Yes = 1
No = 0
9
Table 4: Scores per Metric
5. DISCUSSION
5.1 Set of Variables This research intended to answer the research question ‘Which
project metrics have a significant influence on the success rate
of an IT-project and to what extent are they predictable before
initiation?’. A survey has been conducted to measure the level of
importance for every critical success factor (the predictor) and
for every project metric (the dependent variable). Based on the
scores, a discussion and literature research several factors and
metrics have been excluded. This was done in order to create a
base for a parsimonious prediction model which are simple
models, that include just the right amount of predictors, with
great explanatory predictive power (Stephanie, 2015). However,
there is still a risk of not having included factors or metrics one
perceives as very important due to the limited involvement of
experts.
This risk could possibly be reduced by investigating the
interrelationships between project metrics with the use of
Structural Equation Modelling (SEM). The SEM is a multivariate
technique that estimates the interrelated dependent relationships
among a set of variables (Hair et al., 2006) and allows to
investigate more complex structured models due to a high
number of variables. The variables that are considered are
measurement components and latent components (Byrne, 1994).
In order to develop the SEM, the following steps have to be
undertaken: 1) defining the latent and measurement components
to create a hypothetical model; 2) validating the hypothetical
model and develop it with modifications; 3) assess the validation
of the final model and interpret it. (Chen, Zhang, Liu, & Mo,
2011) For this study, the project metrics will be taken as latent
variables due to multiple indirect measures of this variable,
namely the CSFs. By first including all identified project metrics
it can be examined whether the effect of the excluded metrics is
significantly low on the other variables, which indicates that it is
acceptable to exclude them. Afterwards, the CSFs can be added
to the model to investigate the interrelations among them which
will possibly give the project manager more insights into what is
driving the project metric, and where to focus on when a project
metric has a strong impact on the success of a project.
Concludingly to refine this model, both the causal relationships
among the CSFs should be added with the use of the modification
index provided by Amos in SPSS and additionally, the paths
showing a significant low causal relationship should be deleted
(Islam & Faniran, 2005; Wong & Cheung, 2005)
Since there is no dataset available, it cannot be concluded
whether the relationships among project metrics are linear or
nonlinear. Generally speaking, the SEM-method is utilized for
data in which linear relationships are present, whereas a Fuzzy
Cognitive Map (FCM) examines a set of variables in which
nonlinear relationships are present. Therefore, as an alternative,
it is suggested to employ the FCM as well. Also because it is able
to deal properly with the high complexity and uncertainties of IT
projects. (Rodriguez-Repiso et al., 2007) An FCM is a graphical
representation of the most relevant factors and links between the
factors that indicate their relationship. From an AI perspective,
this method combines fuzzy logic (many-valued logic) with
neural networks and describes the behaviour of a system in terms
of concepts.
5.2 Way of Measurement The measurements for ‘project manager capabilities’, ‘clarity of
scope and goal of the project’, ‘project management
methodology’, ‘team member capabilities’ and ‘availability of
resources’ was relatively easily quantified since they can be
considered to be hard factors to some extent. Those factors tend
to be those elements that can somehow be formally defined or
formalized which makes it possible to actually measure them.
They can be measured through either the use of observations,
calculations, or surveys and interviews. Given the uniqueness of
every project and every organization, no guidelines are given for
the exact way on how observations are made, or which questions
to ask during the interviews.
For the degree of client involvement, the presence of some form
of a steering group has been chosen as a measure. It is a challenge
to define exactly how a client will be involved throughout the
project before the initiation of a project. Several experts
mentioned that before a project is initiated there is always a kick-
off meeting in which the client, project manager, team members,
and other relevant stakeholders are participating. The purpose of
this meeting is to steer everyone involved in the project, in the
same direction and make them agree on what is expected to be
delivered. However, this kick-off meeting is just a one-time event
at the start of a project and does not guarantee further in-depth
discussions between the client and the stakeholders from the
organization. In particular, this does not guarantee that
throughout the project everyone is still steered in the same
direction. Therefore, the presence of some form of a steering
group is suggested as the right measurement for client
involvement.
For the metric ‘support and involvement of different levels
within organizations,’ the measurement is partly based on the
same measurement as for the degree of client involvement. So,
some form of a steering group should be present and other
relevant levels/departments of the organization should
participate in this committee. Moreover, a project champion
should be present in order to assure that support is given by senior
management. Especially in larger IT-projects, it is of high
relevance that a project champion is present in order to advocate
for the project and praise the benefits to the stakeholders. This
will significantly keep up the motivation among all stakeholders
who are involved. Because they are constantly reminded of why
the effort that has been put in the project is of high relevance.
5.3 Limitations and Recommendations Although this research has made multiple contributions, there are
a few limitations. One of the main limitations of this research is
that the input for a prediction instrument has not been validated
with actual data. Despite the fact that the components have been
validated by experts and an additional literature review, it
remains uncertain whether this input is valuable and reliable for
predicting the success rate of a project.
Variable Project Metric Score from
Surveys
Final
Score
A Project manager
capabilities
5,219 13,35
B Clarity of scope and
goal
5,167 13,22
C Project management
methodology
5,417 13,86
D Team member
capabilities
5,688 14,55
E Degree of client
involvement
5,969 15,28
F Support and
involvement of other
levels within the
organization
6,188 15,83
G Availability of
resources
5,438 13,91
39,086 100%
10
Given this limitation, it is recommended to employ the
Evolutionary Support Vector Machine Inference Model
proposed by Cheng et al., (2010), with the metrics provided in
Table 3. Since the super vector machine is employed in this
model, the generated weights from the questionnaires are of no
use as input for this model. Though, it is interesting to examine
the difference between the weights generated by the machine
learning algorithm and the weights generated from the
questionnaires. By doing this, the uncertainty of whether the
input is valuable and reliable will be reduced.
Another reason why it is recommended to employ this model is
that it has proven to be successful in the context of a construction
project. However, not yet in the context of medium to large sized
IT projects. These IT projects are relatively more complex and
bring along more uncertainties, therefore, it is interesting to
evaluate whether the model will also be successful with this type
of data.
A second limitation of this research is that the interrelationships
between the metrics have not been evaluated. Within the scope
of this thesis, it was only limited to which CSFs influences a
specific project metric, and which project metric have a
significant impact on the success of a project. Though this does
not capture the type of relationships and it did not take into
account the interrelationships among all metrics. However, much
more information was needed in order to determine this. And
even then, it is still difficult to define the exact type of
relationship due to the presence of multiple relationships and
numerous factors that influence a relationship.
For this limitation, it is recommended to use the Structural
Equation Modelling technique to estimate the interrelated
relationships among the set of variables. Since this model is
generally used for data in which linear relationships are present,
an alternative would be to develop a Fuzzy Cognitive Map that
also takes into account nonlinear relationships. This alternative
is proposed since it cannot be said with certainty whether the
relationship among the proposed set of variables is linear or
nonlinear.
An additional limitation is that the results of this research are
easily susceptible to bias due to the involvement of people in
general. Every expert argues their opinion from his own
experience and his experience is always unique. Even though this
research put in maximum effort to avoid bias, it can never be
completely avoided. By including more companies and also
companies from other regions, the bias in this research could
have been even more minimised.
Lastly, another limitation to this research is the role of
subjectivity that plays in defining the measurements for the
project metrics. First of all, because the measurements are based
on the insights given by the experts and the literature research.
On top of that, multiple metrics can be defined as soft factors and
they tend to be intangible and very difficult, even hardly possible
to capture, model, measure and control. (Sudhakar, Farooq, &
Patnaik, 2011) This makes them very difficult to quantify and
generalise. Therefore, the reliability and validity of the general
way of measurement might not be as high as desired. Though,
this should be figured out in a critical validation with the use of
real-life projects.
For this very last limitation, it is recommended to use the
provided measurements and evaluate the prediction outcome on
numerous projects. This is the only way to see whether the
measurements can be used in an appropriate way and whether it
captures enough critical information that predicts success in an
accurate way. If it does, the role of subjectivity is, to a large
extent, reduced.
6. CONCLUSION This thesis has answered the following research question: Which
project metrics have a significant influence on the success rate
of an IT-project and to what extent are they predictable before
initiation? By conducting an extensive literature review a list of
critical success factors and project metrics was created. Through
interviews with experts and a questionnaire, the importance of
each factor and metric was evaluated. In the end, seven metrics
were selected as input for a future prediction instrument which
resulted to the inclusions of 23 critical success factors. The
metrics chosen are 1) project manager capabilities, 2) clarity of
scope and goal, 3) project management methodology, 4) team
member capabilities, 5) degree of involvement, 6) support and
involvement of other levels within the organization, and 7)
availability of resources.
The extent to which the project metrics are predictable is quite
challenging to determine, considering the fact that multiple
metrics can be defined as soft factors which are hard to quantify.
Moreover, every project is unique which makes it difficult to
create a general method for quantification. Despite these
challenges, a general measure has been developed for every
essential project metric based on discussions with the experts.
The provided measures and metrics will serve as input for when
the prediction instrument will be developed, and a dataset is
obtained. Eventually, the outcome of the prediction instrument
will be a classification which is either success or unsuccessful.
Afterwards, it can be said with more certainty to what extent the
selected metrics are predictable and if they were able to correctly
predict whether the project was going to be a success or
unsuccessful by evaluating this in a confusion matrix.
This study contributes to the ever-growing literature about the
prediction of IT-project success. Numerous models and
techniques have been employed in different contexts and
different stages during a project. However, as of yet, no study
was focused on the prediction of success before initiation. Thus,
this study provided useful insights from existing techniques, a
fresh set of variables that have a significant influence on success
according to experts, and a general binary measurement scale for
the project metrics that can be employed for the further
development of a prediction instrument. All the provided insights
can be seen as the first step towards the development of a
prediction model that predicts the success rate of an IT-project
before the project has been initiated.
The contribution to practice, as of now, is an updated set of
variables for medium to large IT-project that includes project
metrics, CSFs, and average importance scores. This will provide
current project managers with insights on which CSFs are related
to which project metric, which CSF tends to have a relatively
higher impact on a metric, and which project metric has a
relatively higher influence on project success. As a result, this set
of variables can be used as a toolkit that provides guidance in
focussing on the right aspects of a project and taking the bigger
context into account when focussing on a specific metric or CSF.
7. ACKNOWLEDGEMENTS First of all, I would like to thank my supervisor Dr A.B.J.M.
Wijnhoven who provided critical feedback and supervision
throughout the entire process of writing this Bachelor Thesis.
Furthermore, I want to express my gratitude towards Dominique
Weijers for his useful input during discussion sessions, for
answering questions and his enormous support. Lastly, I would
like to thank all the experts who participated in the interview and
filled out the questionnaire. The insights given through this have
been of huge value to write this Bachelor Thesis.
11
8. REFERENCES Abe, S., Mizuno, O., Kikuno, T., Kikuchi, N., & Hirayama, M.
(2006). Estimation of project success using Bayesian
classifier. https://doi.org/10.1145/1134285.1134371
Al Neimat, T. (2005). Why IT Projects Fail.
Barbara M Byrne. (1994). Structural equation modeling with
EQS and EQS/Windows: Basic concepts, applications,
and programming. Sage.
Beale, P., & Freeman, M. (1991). Succesful Project Execution:
A Model. Project Management Journal.
Belassi, W., & Tukel, O. I. (1996). A new framework for
determining critical success/failure factors in projects.
International Journal of Project Management.
https://doi.org/10.1016/0263-7863(95)00064-X
Birchall, D., Arne Jessen, S., Money, A. H., & Andersen, E. S.
(2006). Exploring project success. Baltic Journal of
Management, 1(2), 127–147.
https://doi.org/10.1108/17465260610663854
Cerpa, N., Bardeen, M., Kitchenham, B., & Verner, J. (2010).
Evaluating logistic regression models to estimate software
project outcomes. Information and Software Technology.
https://doi.org/10.1016/j.infsof.2010.03.011
Cerpa, N., & Verner, J. M. (2009). Why did your project fail?
Communications of the ACM, 52(12), 130.
https://doi.org/10.1145/1610252.1610286
Chen, Y. Q., Zhang, Y. B., Liu, J. Y., & Mo, P. (2011).
Interrelationships among Critical Success Factors of
Construction Projects Based on the Structural Equation
Model. Journal of Management in Engineering.
https://doi.org/10.1061/(asce)me.1943-5479.0000104
Cheng, M. Y., Wu, Y. W., & Wu, C. F. (2010). Project success
prediction using an evolutionary support vector machine
inference model. Automation in Construction.
https://doi.org/10.1016/j.autcon.2009.12.003
Choudhary, V. (2007). Software as a service: Implications for
investment in software development. Proceedings of the
Annual Hawaii International Conference on System
Sciences. https://doi.org/10.1109/HICSS.2007.493
Chow, T., & Cao, D. B. (2008). A survey study of critical success
factors in agile software projects. Journal of Systems and
Software, 81(6), 961–971.
https://doi.org/10.1016/j.jss.2007.08.020
Cortes, C., & Vapnik, V. (1995). Support-Vector Networks.
Machine Learning.
https://doi.org/10.1023/A:1022627411411
Daniel, D. (1961). Management information crisis. Harvard
Business Review.
Fortune, J., & White, D. (2006). Framing of project critical
success factors by a systems model. International Journal
of Project Management, 24(1), 53–65.
https://doi.org/10.1016/j.ijproman.2005.07.004
Goldberg, D. E., Deb, K., Kargupta, H., & Harik, G. (1993).
Rapid Accurate Optimization of Difficult Problems Using
Fast Messy Genetic Algorithms. Proceedings of the
{F}ifth {I}nternational {C}onference on {G}enetic
{A}lgorithms.
Hair, J. F., Black, W. C., Babin, B. J., Anderson, R. E., &
Tatham, R. L. (2006). Multivariate data analysis 6th
Edition. Journal of Abnormal Psychology.
https://doi.org/10.1198/tech.2007.s455
Islam, M. D. M., & Faniran, O. O. (2005). Structural equation
model of project planning effectiveness. Construction
Management and Economics.
https://doi.org/10.1080/0144619042000301384
Jones, C. (2004). Software Project Management Practices-
Failure Versus Success. CROSSTALK The Journal of
Defense Software Engineering, 17(10), 5–9. Retrieved
from
http://static1.1.sqspcdn.com/static/f/702523/9292109/128
9014798233/200410-0-
Issue.pdf?token=nOona%2FLzFP0649phaxl44Y%2BN%
2FiA%3D
Kerzner, H. (2017). Project Management Metrics, KPIs, and
Dashboards. In Project Management Metrics, KPIs, and
Dashboards. https://doi.org/10.1002/9781119427599
Magaña Martínez, D., & Fernandez-Rodriguez, J. C. (2015).
Artificial Intelligence Applied to Project Success: A
Literature Review. International Journal of Interactive
Multimedia and Artificial Intelligence, 3(5), 77.
https://doi.org/10.9781/ijimai.2015.3510
Might, R. J., & Fischer, W. A. (1985). ROLE OF
STRUCTURAL FACTORS IN DETERMINING
PROJECT MANAGEMENT SUCCESS. IEEE
Transactions on Engineering Management.
https://doi.org/10.1109/TEM.1985.6447584
Mohd, H. N. N., & Shamsul, S. (2016). Critical success factors
for software projects: A comparative study. Scientific
Research and Essays, 6(10), 2174–2186.
https://doi.org/10.5897/sre10.1171
Morris, P., & Hough, G. H. (1987). The Anatomy of Major
Projects: A Study of the Reality of Project Management.
In International Journal of Managing Projects in
Business.
Morris, P. W. G., & Hugh, G. H. (1987). The anatomy of major
projects: Preconditions of success and failure in major
projects. Major Projects Association, the Oxford Centre
for Management Studies, Kinnington Oxford.
Nilsson, N. J. (1981). Principles of Artificial Intelligence. IEEE
Transactions on Pattern Analysis and Machine
Intelligence.
https://doi.org/10.1109/TPAMI.1981.4767059
Patterson, J. L. (1983). Quality Management: the project
managers [sic] perspective. Project Management
Quarterly, 14((1)), 33–38.
Radujković, M., & Sjekavica, M. (2017). Project Management
Success Factors. Procedia Engineering, 196(June), 607–
615. https://doi.org/10.1016/j.proeng.2017.08.048
Reel, J. S. (1999). Critical success factors in software projects.
IEEE Software. https://doi.org/10.1109/52.765782
Reyes, F., Cerpa, N., Candia-Véjar, A., & Bardeen, M. (2011).
The optimization of success probability for software
projects using genetic algorithms. Journal of Systems and
Software, 84(5), 775–785.
https://doi.org/10.1016/j.jss.2010.12.036
Rockart, J. F. (1979). Chief executives define their own data
needs. Harvard Business Review.
Rodriguez-Repiso, L., Setchi, R., & Salmeron, J. L. (2007).
Modelling IT projects success with Fuzzy Cognitive
Maps. Expert Systems with Applications.
https://doi.org/10.1016/j.eswa.2006.01.032
Sapolsky, H. (1972). The Polaris Syst Development. In
12
Administrative Science Quarterly.
Shenhar, A. J. (2003). One Size Does Not Fit All Projects:
Exploring Classical Contingency Domains. Management
Science, 47(3), 394–414.
https://doi.org/10.1287/mnsc.47.3.394.9772
Shenhar, A. J., Dvir, D., Levy, O., & Maltz, A. C. (2001). Project
success: A multidimensional strategic concept. Long
Range Planning. https://doi.org/10.1016/S0024-
6301(01)00097-8
Skinner, B. F. (1963). Operant Behavior. American Psychologist,
18.8(503). Retrieved from
https://social.stoa.usp.br/articles/0016/2394/Skinner_B._
F._Operant_Behavior.pdf
Spoel, S. van der. (2016). Prediction instrument development for
complex domains (Enschede: University of Twente).
Retrieved from https://doi.org/10.3990/1.9789036541749
Stephanie. (2015). Parsimonious Model: Definition, Ways to
Compare Models. Retrieved from Statistics How To
website:
https://www.statisticshowto.datasciencecentral.com/parsi
monious-model/
Sudhakar, G. P., Farooq, A., & Patnaik, S. (2011). Soft factors
affecting the performance of software development teams.
Team Performance Management.
https://doi.org/10.1108/13527591111143718
Verner, J., Sampson, J., & Cerpa, N. (2008). What factors lead to
software project failure? Proceedings of the 2nd
International Conference on Research Challenges in
Information Science, RCIS 2008.
https://doi.org/10.1109/RCIS.2008.4632095
Whiting, B. (2002). Project Management Metrics: Definition &
Examples. In Intro to Business: Help and Review.
Study.com.
Wit, A. De. (1988). Measurement of project success.
International Journal of Project Management, 6(3), 164–
170. Retrieved from
http://linkinghub.elsevier.com/retrieve/pii/026378638890
0439%5Cnhttp://www.sciencedirect.com/science/article/
pii/0263786388900439
Wong, P. S. P., & Cheung, S. O. (2005). Structural Equation
Model of Trust and Partnering Success. Journal of
Management in Engineering.
https://doi.org/10.1061/(ASCE)0742-
597X(2005)21:2(70)
13
9. APPENDICES
Appendix A: Average Scores Per Critical Success Factor
Appendix B: Nominal Metric scores given by four experts
Appendix C: All the Following Figures Depict the Impact
Flow With Respect to Average Weights
0
1
2
3
4
5
6
7
1 2 3 4 5 6 7 8 9 10 11 12
Person A Person B Person C Person D
5,7
5
2,5
5
4,5
6,5
6,2
5
1,7
5
4,5
2,7
5
4,7
5
5 5
4,5
5,7
5
6
4,2
5
4,2
5
5,7
5
4,5
2,5
6,2
5
4
3,7
5
5,7
5
6
3,5
6
5,7
5
5,7
5
3,2
5
6 6,2
5
2,2
5 2,7
5 3,2
5
5,5
2,2
5
6
5,2
5
1 2 3 4 5 6 7 8 9 1 0 1 1 1 2 1 3 1 4 1 5 1 6 1 7 1 8 1 9 2 0 2 1 2 2 2 3 2 4 2 5 2 6 2 7 2 8 2 9 3 0 3 1 3 2 3 3 3 4 3 5 3 6 3 7 3 8 3 9
AV
ERA
GE
SCO
RE
INDEX NUMBER OF CRITICAL SUCCESS FACTOR
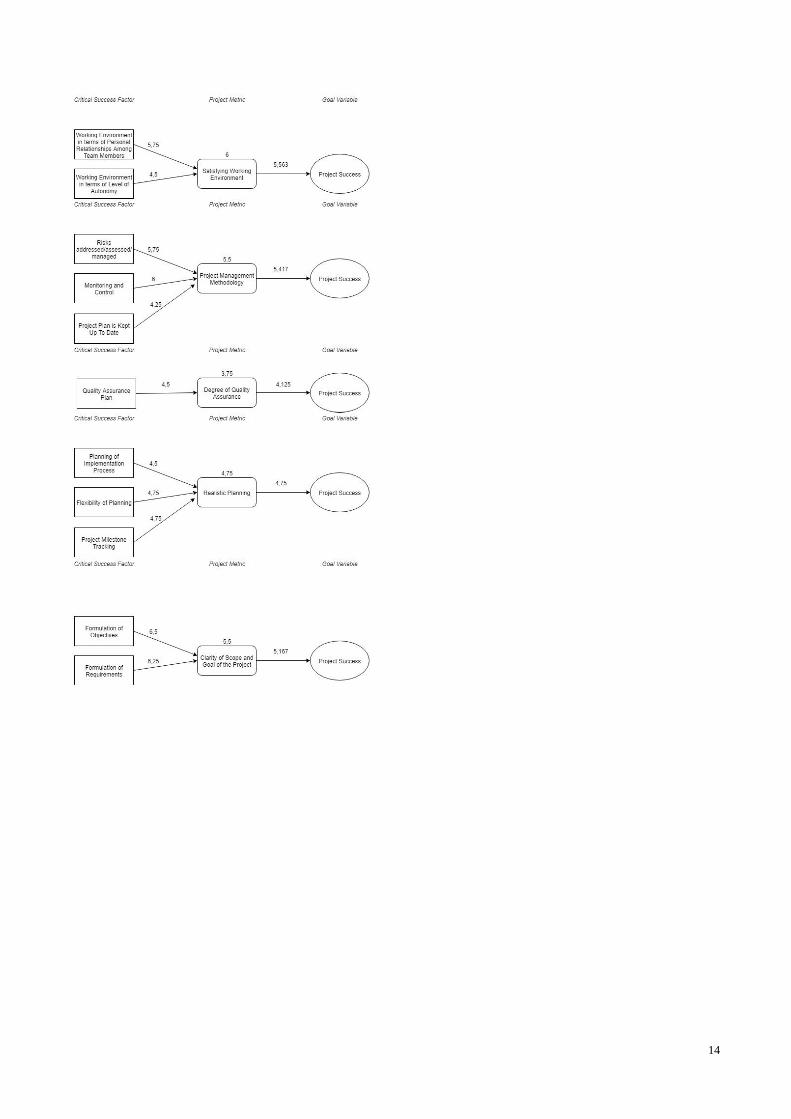
14