Embed Size (px)
Citation preview
© 2020, IJSRCSE All Rights Reserved 13
International Journal of Scientific Research in ___________________________ Research Paper . Computer Science and Engineering Vol.8, Issue.3, pp.13-25, June (2020) E-ISSN: 2320-7639
A Machine Learning Approach for Diagnosing Meningococcal
Meningitis
Solomon Osarumwense Alile1*
, Moses Eromosele Bello2
1,2Computer Science, Faculty of Physical Sciences, University of Benin, Benin City, Nigeria
*Corresponding Author: [email protected], Tel.: +234-7036-4440-86
Available online at: www.isroset.org
Received: 29/May/2020, Accepted: 06/June/2020, Online: 30/June/2020
Abstract— Meningococcal Meningitis is a hazardous sickness brought about by meningococcal microbes called Neisseria
meningitidis which offers ascend to irritation of the meninges which influences people extending from babies, more established youngsters and grown-ups in particular old enough. The manifestations of this sickness are fatigue, nausea,
seizures, vomiting, stiff neck, cold, sleepiness, skin rash, spasm, cough, loss of appetite, fever just to name a yet a couple.
In late past, a few systems have been created to analyze this endemic malady; however they created a great deal of bogus
negative during testing and couldn't distinguish meningococcal meningitis, its overlapping symptoms and serogroup types.
Thus, in this paper, we proposed and simulated a model to anticipate meningococcal meningitis and its serogroup types
utilizing an AI strategy called Bayesian Belief Network. The model was structured utilizing Bayes Server and tried with
data gathered from meningitis medical repository. The model had a 99.99% forecast precision, 97.12% sensitivity of
Meningococcal Meningitis disease, 95.42% sensitivity of Serogroup type A, Serogroup type B, Serogroup type C, and
Neisseria Meningitidis in that order.
Keywords— Meningococcal Meningitis; Bacteria Meningitis; Neisseria Meningitidis; Prediction; Detection; Machine
Learning; Bayesian Belief Network Component
I. INTRODUCTION
The nervous system is an exceptionally unpredictable piece
of the human body that facilitates its activities and tangible
data by transmitting signs to and from various pieces of its
body. In vertebrates, there exist two subsystems which
make the nerbous system; they are to be specific the central
nervous system (CNS) and the peripheral nervous system
(PNS) [1]. The PNS comprises predominantly of nerves,
which are encased packs of the long filaments or axons
that associate the CNS to each other piece of the body. The
CNS includes the brain and spinal cord. Moreover, the
CNS has a layer called the meninges which fill in as the defensive layer for the brain and spinal cord. Due the
sensitivity of this layer, it is dependent upon oddities
which change the smooth activity of this layer. One of such
abnormalities is an irresistible infection called meningitis.
Meningitis is an intense aggravation of the meninges that
covers the brain and spinal cord [2]. On the other hand,
there are a few kinds of organisms that cause meningitis
and are ordered into viruses and bacterium. Viruses that
cause viral meningitis are enteroviruses, herpes simplex
infection, varicella zoster virus, flu infection while
bacterium that causes microbes meningitis are streptococci type B, Neisseria meningitidis, Streptococcus pneumoniae
and Haemophilus Influenzae type B. Of all the previously
mentioned instances of meningitis caused by viruses and
bacteria, Neisseria meningitidis is the most terrifying of
all. Neisseria meningitidis can be recognized from other
bacterium causing meningitis by means of the fast spread of skin rash which is a particular component of
meningococcal meningitis. Meningococcal meningitis is
characterized as a bacterial type of meningitis that is
normally brought about by Neisseria meningitidis,
streptococcus pneumonia and haemophilus influenzae type
B thus causing aggravation or growing of the meninges
which fills in as the defensive layer for the brain and spinal
cord and accompanied with the skin rash. It is additionally
called cerebrospinal meningitis (CSM) [3]. The symptoms
of this disease are fatigue, nausea, seizures, vomiting, stiff
neck, cold, sleepiness, skin rash, spasm, cough, loss of
appetite, fever to give some examples. Be that as it may, the infection influences individuals of any age going from
babies, youngsters, the youthful and old with the hatching
period for this illness in people is supposed to be between
2 to 10 days after contact with the disease.
It was expressed that meningococcal malady is of two
clinical structures to be specific meningococcal
septicaemia which is less normal and meningococcal
meningitis which is the most widely recognized type of
bacteria meningitis that causes plagues. Also,
meningococcal infection is viewed as an endemic and plague ailment, with the two structures causing broad
contamination, passing, tenacious neurological deficiency,
for example, deafness. What's more, different
imperfections of this ailment are loss of limbs, mental
retardation and paralysis. On the other hand, there are three
Int. J. Sci. Res. in Computer Science and Engineering Vol.8, Issue.3, June 2020
© 2020, IJSRCSE All Rights Reserved 14
serogroups of meningococcal ailment; they are serogroup
A, B and C individually which are liable for 90% of the
aforementioned ailment. Essentially, the previously
mentioned serogroups have inclination of causing
pestilences and the danger of scourge meningococcal
meningitis changes between the serogroups. Of
quintessence is serogroup A meningococcus since it has been in times passed proven to be the major cause of
epidemic meningococcal disease and has taken
over the continent of Africa for the duration of both
epidemic and endemic era. [4].
World Health Organization (WHO) revealed that the
pervasiveness of meningococcal meningitis in Sub-Sahara
Africa with 30,000 affirmed cases announced every year in
this locale. The sickness influences individuals running
from untimely infants, babies, little children and grown-
ups. The malady is transmitted from individual to
individual through droplets of respiratory or throat secretions from bearer of the infection. The malady could
spread because of close and drawn out contact, for
example, kissing, sneezing and coughing on someone,
smoking and living in close quarters with the carrier [5].
The transmission of the infection can happen in mass get-
togethers, for example, celebrations and religious
pilgrimages. Meningococcal Meningitis as a crippling
infection has represented numerous passings and huge long
haul outcome of any current ailment in patient and stays a
principal worldwide general medical problem with the
seriousness level ranging from asymptomatic, mild, moderate, severe and critical separately [6].
On the other hand, this malady can likewise emerge
because of components viewed as non-irresistible, for
example, utilization of certain prescriptions, malignant
growth and auto-safe ailments just to give some examples.
Furthermore, it was assessed that the developing number of
meningitis cases overall rose from 2.5 million in 1990 to
2.82 million in 2016. Thus in 2015, WHO and Institute for
Health Metrics and Evaluation (IHME) assessed passings
because of meningitis contamination in all ages which
remained at 290,000 and 320,000 separately. Besides, the evaluated number of passings contrasted because of the
trouble in separating between neonatal sepsis and
meningitis with the utilization of oral post-mortem and
absence of diagnostic tests, for example, lumbar puncture
(LP) and cerebrospinal fluid (CSF) examination. In time
past, because of the endemic and pandemic nature of
meningococcal meningitis, clinical techniques have been
used in diagnosing this infection in the method of LP and
CSF separately [7].
Cerebrospinal liquid (CSF) examination is a technique for scanning for conditions that influences the brain and spine.
Besides, it is a sequence of laboratory tests conducted on a
CSF sample [8].
A CSF test is generally recovered by conducting a lumbar
puncture also called spinal tap. Be that as it may, the
investigation of the gathered CSF sample is to measure and
observe in particular fluid pressure, proteins, glucose,
bacteria and viruses just to make reference to yet a couple.
Lumbar Puncture (LP) is characterized as a kind of test
used to diagnose severe infections, for example,
meningitis, disorder of the central nervous system. It is led
at a patient's lower back, which is the lumbar area with the sole point of extracting cerebrospinal fluid (a fluid that
encompasses the brain and spinal cord to shield them from
supporting injury) by means of insertion of needle between
two lumbar bones of the spinal cord [9].
Additionally, clinical work forces regularly use LP to
present sedative prescriptions or chemotherapy drugs into
the cerebrospinal fluid. Be that as it may, a few hours or
days after the lumbar puncture procedure has been
conducted, a patient begins to experience headaches,
nausea, rapid heart rate and low blood pressure. This
delayed consequence of lumbar puncture technique is called post-lumbar puncture cerebral pain.
Also, the technique for diagnosing of meningococcal
meningitis by means of lumbar puncture is very intrusive
and life undermining. Subsequently, there is need to
structure a non-intrusive strategy for diagnosing the
sickness. Consequently, the utilization of AI procedure to
analyze this illness will fill in as an elective which will
help give data that can be used to protect against this sort
of illness before its actual incubation. Previously, a few AI
strategies have been applied in anticipating bacteria meningitis in works of [10, 11, 12, 13,14,15,16 and 17] yet
they produced a great deal of bogus negative during testing
and couldn't distinguish meningococcal meningitis, its
serogroup types and the overlapping symptoms the illness
imparts to other brain furthermore, spinal cord diseases.
In this paper, a directed AI strategy called Bayesian Belief
Network (BBN) was used in diagnosing meningococcal
meningitis, serogroup types and its symptoms. BBN is a
multifaceted probabilistic network that consolidates expert
knowledge and experimental datasets. It plans a route for
cause and effect associations between variables and trains them with likelihood that demonstrates the level where one
variable is probably going to impact another. In this paper,
BBN was our strategy of decision in light of its ability to
make prescient inference.
However, the remainder of the paper is organized as
follows: Section II contains related works on
meningococcal meningitis diagnosis using machine
learning techniques, Section III contains the methodology
utilized in diagnosing meningococcal meningitis which is
supervised machine learning technique called Bayesian Belief Network, Section IV contains the simulation, results
and discussion and Section V concludes research work
with future directions.
Int. J. Sci. Res. in Computer Science and Engineering Vol.8, Issue.3, June 2020
© 2020, IJSRCSE All Rights Reserved 15
II. RELATED WORK
In [10], a system that used an AI approach called
probabilistic neural network (PNN) to separate bacterial
from viral meningitis was developed. The system
characterized between bacterial from viral meningitis and
had a 98% detection precision from dataset. Notwithstanding the high recognition precision, it had the
accompanying issues: the system’ neural network learning
process requires a great deal of time and very costly; it
likewise has a moderate combination speed and less
generalizing performance issue. Moreover, the system
neglected to identify meningococcal meningitis, its
serogroup types and the covering indications the ailment
imparts to other brain and spinal cord diseases.
In [11], an information based system to analyze meningitis
among newborn children and youngsters utilizing fuzzy
cognitive mapping (FCM) was created. The system identified meningitis with 95% exactness, 83.3%
sensitivity and 80% particularity individually. Be that as it
may, the system had the accompanying issues: it couldn't
make bi-directional surmising on the dataset, the
guidelines produced for the FCM are now and again one-
sided and the thinking module proved unable handle issue
of uncertainty. Then again, the system neglected to identify
meningococcal meningitis, its serogroup types and the
covering indications the sickness imparts to other brain and
spinal cord illnesses.
In [12], a system that utilized fuzzy logic and technique for
order performance by similarity to ideal solution (TOPSIS)
to group meningitis in grown-ups was developed. The
proposed system identified meningitis with a high
discovery precision. Be that as it may, the system had the
accompanying issues: the system thinking module couldn't
deal with issue of uncertainty; it was likewise unfit to
make bi-directional inference on the dataset, TOPSIS has
issue of vulnerability in gaining loads just by means of
target techniques. Furthermore, the system neglected to
identify meningococcal meningitis, its serogroup types and
the covering side effects the malady imparts to other brain and spinal cord maladies.
In [13], an expert system that used fuzzy logic in
diagnosing bacterial meningitis and aseptic meningitis was
created. The proposed expert system had 89%
identification precision, 92% particularity and 97%
sensitivity individually. Be that as it may, the system had
the accompanying issues: the system thinking module
couldn't deal with issue of uncertainty; it was additionally
unfit to make bi-directional induction on the dataset.
Moreover, the system neglected to recognize meningococcal meningitis, its serogroup types and the
covering side effects the malady imparts to other brain
also, spinal cord illnesses.
In [14], a specialized system called Bacterial Meningitis
Diagnosis System (BMDS) that utilized fuzzy logic to
analyze bacteria meningitis was designed. BMDS helped
clinical work force to safe existences of patients
languishing from Bacterial Meningitis and had high
discovery exactness. Nonetheless, the system had the
accompanying issues: the system thinking module couldn't
deal with issue of uncertainty; it was likewise incapable to
make bi-directional surmising on the dataset. Moreover, the system neglected to distinguish meningococcal
meningitis, its serogroup types and the covering side
effects the ailment imparts to other brain and spinal cord
maladies.
In [15], a system that utilized artificial neural network
(ANN) to analyze cerebrospinal meningitis (CSM) was
created. The proposed system had 94.7% discovery
exactness. Despite the high recognition precision, it had
the following issues: the system neural network learning
process requires a great deal of time and very costly; a
moderate intermingling speed and less summing up performance issue. Moreover, the system neglected to
recognize cerebrospinal meningitis (CSM), its serogroup
types and the covering indications the malady imparts to
other brain and spinal cord infections.
In [16], a system that used a few Machine Learning (ML)
approaches, for example, Adaptative Boosting (AdaBoost),
Choice Tree, Gradient Boosting, K-Nearest Neighbors
(KNN), Logistic Regression, Random Forest and Support
Vector Machines (SVM) to analyze meningitis was
created. Of the considerable number of methods utilized, Decision Tree calculation had the best identification
precision of 94.56% on preparing information and 96.18%
exactness on testing information, individually. Be that as it
may, regardless of the high recognition precision, it had the
accompanying issues: choice trees are shaky which implies
that a little change in information can prompt a huge
change in the structure of the ideal choice tree created and
they are likewise frequently moderately off base.
Moreover, the system neglected to identify meningococcal
meningitis, its serogroup types and the covering side
effects the illness imparts to other brain and spinal cord
diseases.
In [17], an open and coordinated clinical choice
emotionally supportive network that analyzed meningitis
utilizing tree-based machine learning called Decision Trees
was created. The system determined meningitis to have
88% detection accuracy. Conversely, the system had the
accompanying issues: choice trees are unsteady implying
that a slight change in information can lead to a generally
tremendous change in the structure of the ideal choice tree
made and they are likewise frequently truly erroneous.
Furthermore, the system neglected to distinguish meningococcal meningitis, its serogroup types and the
covering side effects the sickness imparts to other brain
and spinal cord diseases.
Int. J. Sci. Res. in Computer Science and Engineering Vol.8, Issue.3, June 2020
© 2020, IJSRCSE All Rights Reserved 16
III. METHODOLOGY
Machine learning is a lot of strategies for producing
models that delineate or forecast utilizing data or past
experience. Be that as it may, there are a few sorts of AI
namely Supervised Learning: it trains data and
incorporates wanted outputs (for example Bayesian Belief Networks, Neural Networks, Deep learning and so on.),
Unsupervised Learning: it trains data and does exclude
wanted yields (for example Grouping, Dimensionality
Reduction), Semi-Supervised Learning: it trains data and
incorporates hardly any ideal outcome and Reinforcement
Learning: it gains from succession of activities (Temporal
Difference Learning, Q-learning) [18]. In this paper, we
expect to utilize managed AI method called Bayesian
Belief Network because of its prescient ability dependent
on past experience and example information available to its
during training and testing of observed datasets.
Bayesian Belief Network (BBN) is directed acyclic
graphical model that utilizes likelihood to show conditional
dependencies that prevails among nodes on a graph [19]. It
is a complex probabilistic system that blends expert
information and exploratory datasets. It designs out course
of circumstances and logical results connections between
factors and encodes them with probability that signify the
amount wherein one variable is plausible to impact
another. Furthermore, Bayesian Belief Network strives on
the Bayes hypothesis which is relies on probability.
The Bayes hypothesis is represented in the mathematical
equation below:
P(a|b) = P(b|a)P(a) P(b)
Where,
P(a) is the probability of event “a” happening without any
information about event “b”. It is called the “Prior”.
P(a/b) is the conditional probability of event “a” happening
given that event “b” has already occurred. It is otherwise
called the “Posterior”.
P(b/a) is the conditional probability of event “b” happening
given that event “a” has already occurred. It is called the “Likelihood”.
P(b) is the probability of event “b” happening without any
information about event “a”. It is called the “Marginal
Likelihood”.
The Naive Bayes classifiers are regularly spoken to as a
sort of directed acyclic graph (DAG). The Directed
Acyclic Graph (DAG) comprises of vertices representing
random variables and arrows connecting pairs of nodes.
Figure 1 shows a pictorial representation of a Bayesian
Belief Network.
Figure 1. A Pictorial Representation of a Bayesian Belief
Network
A few preferences of this model are: it is very speedy in
making inferences, the resulting probabilities are quite
easy to decipher, the learning algorithm is very
straightforward and the model sufficiently consolidates
with utility functions to make optimal inferences. In this
paper, we expect to recognize meningococcal meningitis,
serogroup types also, its symptoms utilizing a managed AI
procedure called Bayesian Belief Network (BBN). A
model comprising of 67 nodes where a few nodes speak to a type of ailment illness or elements that impact diagnosis
of meningococcal meningitis, serogroup types and its side
effects will be planned utilizing Bayes Server. A
meningococcal meningitis dataset will be utilized to train
and test the system. Utilizing the Pareto Principle, 80% of
the dataset will be utilized to prepare the model while the
remainder will be utilized in testing the model. The point
of the model is to accomplish an elevated level of
identification exactness with the utilization of the covering
indications and serogroup sorts of meningococcal
meningitis.
IV. SIMULATION, RESULTS AND DISCUSSION
The simulation was performed utilizing a meningitis
dataset in training, testing and predicting meningococcal
meningitis which was retrieved from [20]. In addition,
previews of used dataset, designed BBN model for
identifying meningococcal meningitis, its symptoms and
serogroup types, BBN model convergence chart,
loglikelihood batch query chart, feature importance of
nodes chart, in-sample anomaly detection chart, mesh query plot of neisseria meningitidis being the cause of
meningococcal meningitis infection, likelihood plots of
serogroups, neisseria meningitidis, bacteria meningitis and
neisseria meningitidis (joined) causing epidemic
meningococcal meningitis, loglikelihood graph for
detecting meningococcal meningitis and likelihood against
loglikelihood plot for predicting meningococcal meningitis
were taken during the simulation process which appears
beneath in figures 2, 3, 4, 5, 6, 7, 8,9,10,11,12,13,14 and
15 respectively with the results discussed underneath the
diagrams. Nevertheless, the utilized dataset include mix of
ailments and parts thought about in the identification of meningococcal meningitis signifying 67 with each sickness
and factor having a value which addresses the probability
Cj
P=(B1|C1
)
P=(B1|C1
)
P=(B1|C1
)
Int. J. Sci. Res. in Computer Science and Engineering Vol.8, Issue.3, June 2020
© 2020, IJSRCSE All Rights Reserved 17
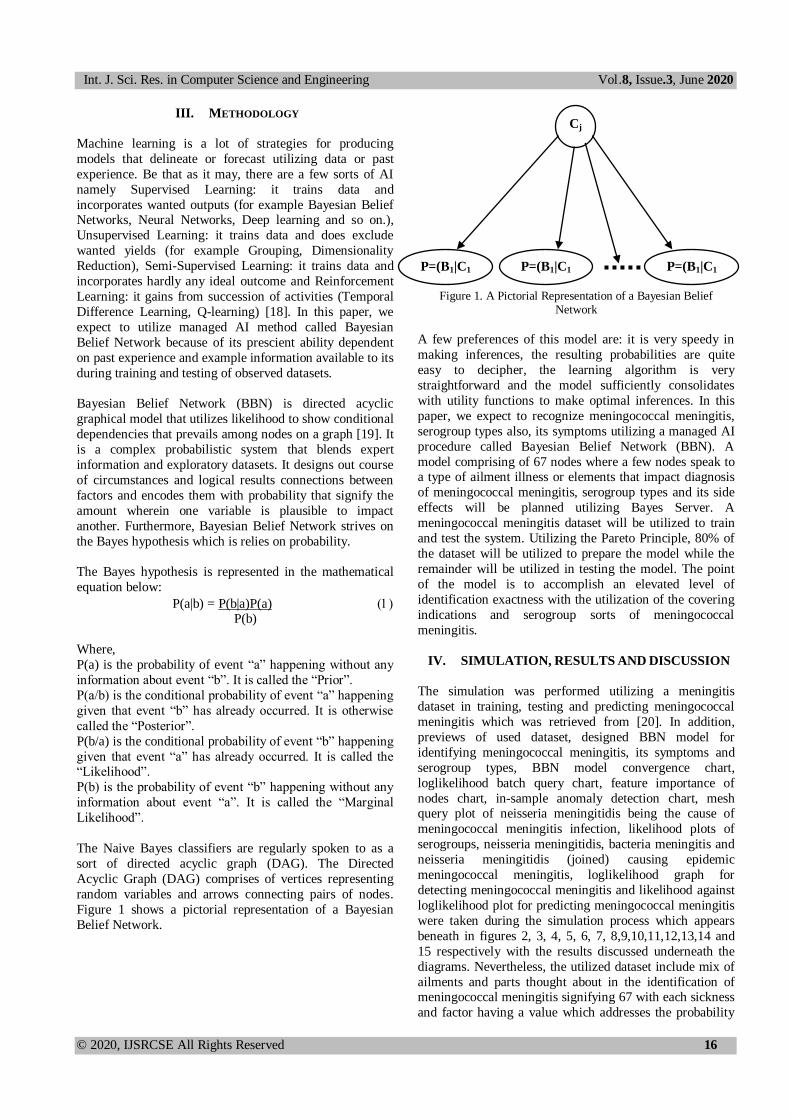
of such ailment malady and factor causing meningococcal
meningitis disease. The ailments and components are: Age
< 1, Age > 1, agitation, anemia, bacteria meningitis,
behavior changes, blue lips, body ache, cerebral malaria,
chest pain, cold, cognitive impairment, coma, continuous
fever, cough, delirium, dehydration, disturbed sleep habits,
emotional disturbances, fatigue, fever, haemophilus influenza, hallucinations, headache, hyperactive delirium,
hypoactive delirium, impaired consciousness, incubation
period (2 to 10 days), influenza, intermittent fever, joint
pain, loss of appetite, malaria fever, meningococcal
disease, meningococcal meningitis, meningococcal
septicaemia, mild jaundice, mixed delirium, moaning,
muscle pain, nausea, nasal congestion, neisseria
meningitidis (NM), neutropenic fever, pel-ebstein fever,
pneumonia, quartan fever, quotidian fever, reduced
awareness of environment, remittent fever, restlessness,
runny nose, seizures, serogroup A, serogroup B, serogroup
C, skin rash, sleepiness, sluggishness, spasm, sore throat, stiff neck, streptococcus pneumonia, sweating, tertian
fever, typhoid fever, vomiting and yellow fever
respectively.
Figure 2 beneath shows a sample the dataset.
Figure 2. Snapshot of Dataset
The Bayesian Belief Network model was structured
utilizing Bayes-Server platform. The Bayesian Belief
Network (BBN) for foreseeing meningococcal meningitis,
its serogroup types and symptoms were structured with the
end goal that the nodes on the system are connected
dependent on the likelihood of a malady sickness coming
about to another and factor impacting another factor. In our
model for a case to be signified as meningococcal meningitis, the sicknesses, disease causing agents and
different components taken into cognizance in the
diagnosis of meningococcal meningitis are: Age < 1, Age
> 1, agitation, anemia, bacteria meningitis, behavior
changes, blue lips, body ache, cerebral malaria, chest pain,
cold, cognitive impairment, coma, continuous fever,
cough, delirium, dehydration, disturbed sleep habits,
emotional disturbances, fatigue, fever, haemophilus
influenza, hallucinations, headache, hyperactive delirium,
hypoactive delirium, impaired consciousness, incubation
period (2 to 10 days), influenza, intermittent fever, joint pain, loss of appetite, malaria fever, meningococcal
disease, meningococcal septicaemia, mild jaundice, mixed
delirium, moaning, muscle pain, nausea, nasal congestion,
neisseria meningitides (NS), neutropenic fever, pel-ebstein
fever, pneumonia, quartan fever, quotidian fever, reduced
awareness of environment, remittent fever, restlessness,
runny nose, seizures, serogroup A, serogroup B, serogroup
C, skin rash, sleepiness, sluggishness, spasm, sore throat, stiff neck, streptococcus pneumonia, sweating, tertian
fever, typhoid fever, vomiting and yellow fever
respectively.
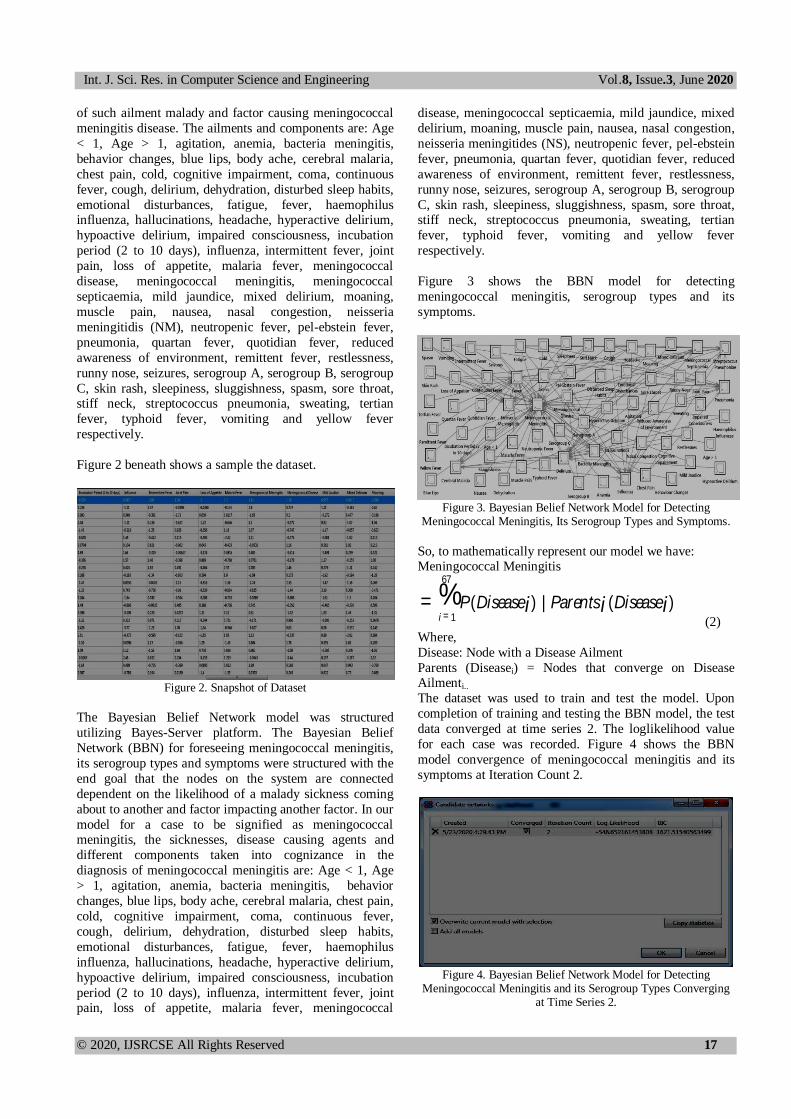
Figure 3 shows the BBN model for detecting
meningococcal meningitis, serogroup types and its
symptoms.
Figure 3. Bayesian Belief Network Model for Detecting
Meningococcal Meningitis, Its Serogroup Types and Symptoms.
So, to mathematically represent our model we have: Meningococcal Meningitis
(2)
Where,
Disease: Node with a Disease Ailment
Parents (Diseasei) = Nodes that converge on Disease Ailmenti..
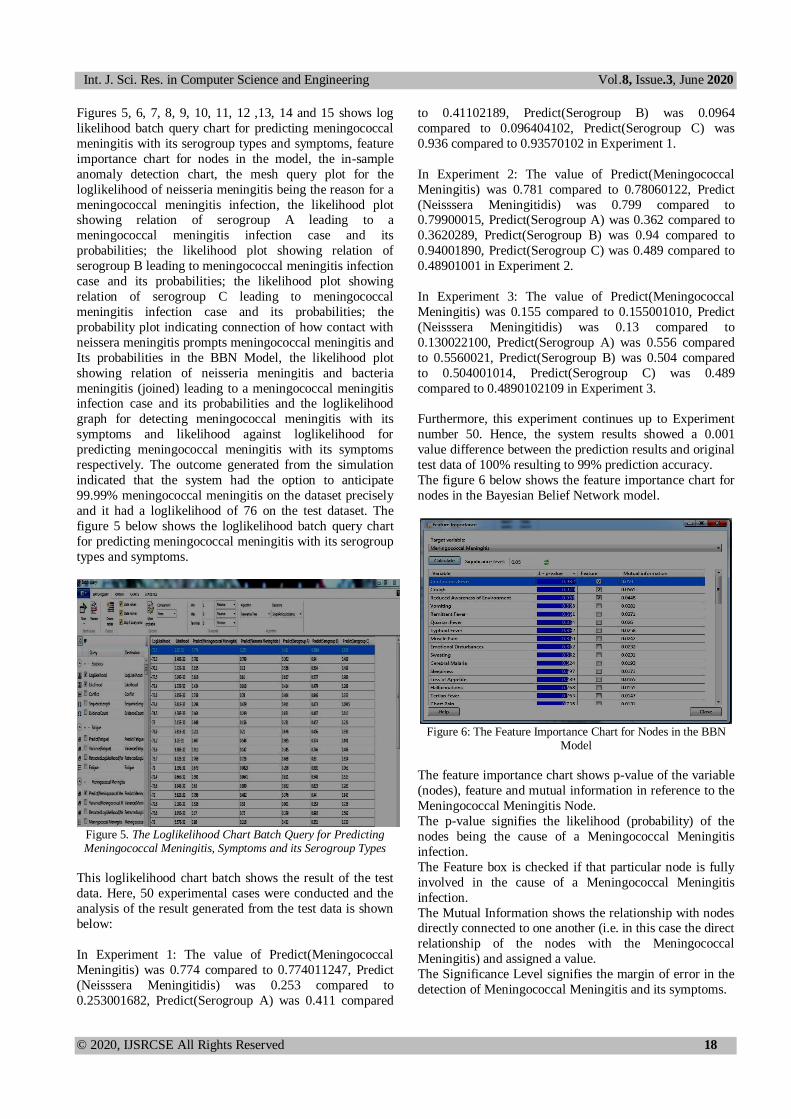
The dataset was used to train and test the model. Upon
completion of training and testing the BBN model, the test
data converged at time series 2. The loglikelihood value
for each case was recorded. Figure 4 shows the BBN
model convergence of meningococcal meningitis and its
symptoms at Iteration Count 2.
Figure 4. Bayesian Belief Network Model for Detecting
Meningococcal Meningitis and its Serogroup Types Converging at Time Series 2.
= P(Diseasei )i = 1
67
% | Parentsi (Diseasei )
Int. J. Sci. Res. in Computer Science and Engineering Vol.8, Issue.3, June 2020
© 2020, IJSRCSE All Rights Reserved 18
Figures 5, 6, 7, 8, 9, 10, 11, 12 ,13, 14 and 15 shows log
likelihood batch query chart for predicting meningococcal
meningitis with its serogroup types and symptoms, feature
importance chart for nodes in the model, the in-sample
anomaly detection chart, the mesh query plot for the
loglikelihood of neisseria meningitis being the reason for a
meningococcal meningitis infection, the likelihood plot showing relation of serogroup A leading to a
meningococcal meningitis infection case and its
probabilities; the likelihood plot showing relation of
serogroup B leading to meningococcal meningitis infection
case and its probabilities; the likelihood plot showing
relation of serogroup C leading to meningococcal
meningitis infection case and its probabilities; the
probability plot indicating connection of how contact with
neissera meningitis prompts meningococcal meningitis and
Its probabilities in the BBN Model, the likelihood plot
showing relation of neisseria meningitis and bacteria
meningitis (joined) leading to a meningococcal meningitis infection case and its probabilities and the loglikelihood
graph for detecting meningococcal meningitis with its
symptoms and likelihood against loglikelihood for
predicting meningococcal meningitis with its symptoms
respectively. The outcome generated from the simulation
indicated that the system had the option to anticipate
99.99% meningococcal meningitis on the dataset precisely
and it had a loglikelihood of 76 on the test dataset. The
figure 5 below shows the loglikelihood batch query chart
for predicting meningococcal meningitis with its serogroup
types and symptoms.
Figure 5. The Loglikelihood Chart Batch Query for Predicting Meningococcal Meningitis, Symptoms and its Serogroup Types
This loglikelihood chart batch shows the result of the test
data. Here, 50 experimental cases were conducted and the
analysis of the result generated from the test data is shown
below:
In Experiment 1: The value of Predict(Meningococcal
Meningitis) was 0.774 compared to 0.774011247, Predict
(Neisssera Meningitidis) was 0.253 compared to
0.253001682, Predict(Serogroup A) was 0.411 compared
to 0.41102189, Predict(Serogroup B) was 0.0964
compared to 0.096404102, Predict(Serogroup C) was
0.936 compared to 0.93570102 in Experiment 1.
In Experiment 2: The value of Predict(Meningococcal
Meningitis) was 0.781 compared to 0.78060122, Predict
(Neisssera Meningitidis) was 0.799 compared to 0.79900015, Predict(Serogroup A) was 0.362 compared to
0.3620289, Predict(Serogroup B) was 0.94 compared to
0.94001890, Predict(Serogroup C) was 0.489 compared to
0.48901001 in Experiment 2.
In Experiment 3: The value of Predict(Meningococcal
Meningitis) was 0.155 compared to 0.155001010, Predict
(Neisssera Meningitidis) was 0.13 compared to
0.130022100, Predict(Serogroup A) was 0.556 compared
to 0.5560021, Predict(Serogroup B) was 0.504 compared
to 0.504001014, Predict(Serogroup C) was 0.489
compared to 0.4890102109 in Experiment 3.
Furthermore, this experiment continues up to Experiment
number 50. Hence, the system results showed a 0.001
value difference between the prediction results and original
test data of 100% resulting to 99% prediction accuracy.
The figure 6 below shows the feature importance chart for
nodes in the Bayesian Belief Network model.
Figure 6: The Feature Importance Chart for Nodes in the BBN
Model
The feature importance chart shows p-value of the variable
(nodes), feature and mutual information in reference to the
Meningococcal Meningitis Node.
The p-value signifies the likelihood (probability) of the
nodes being the cause of a Meningococcal Meningitis
infection.
The Feature box is checked if that particular node is fully
involved in the cause of a Meningococcal Meningitis
infection.
The Mutual Information shows the relationship with nodes directly connected to one another (i.e. in this case the direct
relationship of the nodes with the Meningococcal
Meningitis) and assigned a value.
The Significance Level signifies the margin of error in the
detection of Meningococcal Meningitis and its symptoms.
Int. J. Sci. Res. in Computer Science and Engineering Vol.8, Issue.3, June 2020
© 2020, IJSRCSE All Rights Reserved 19
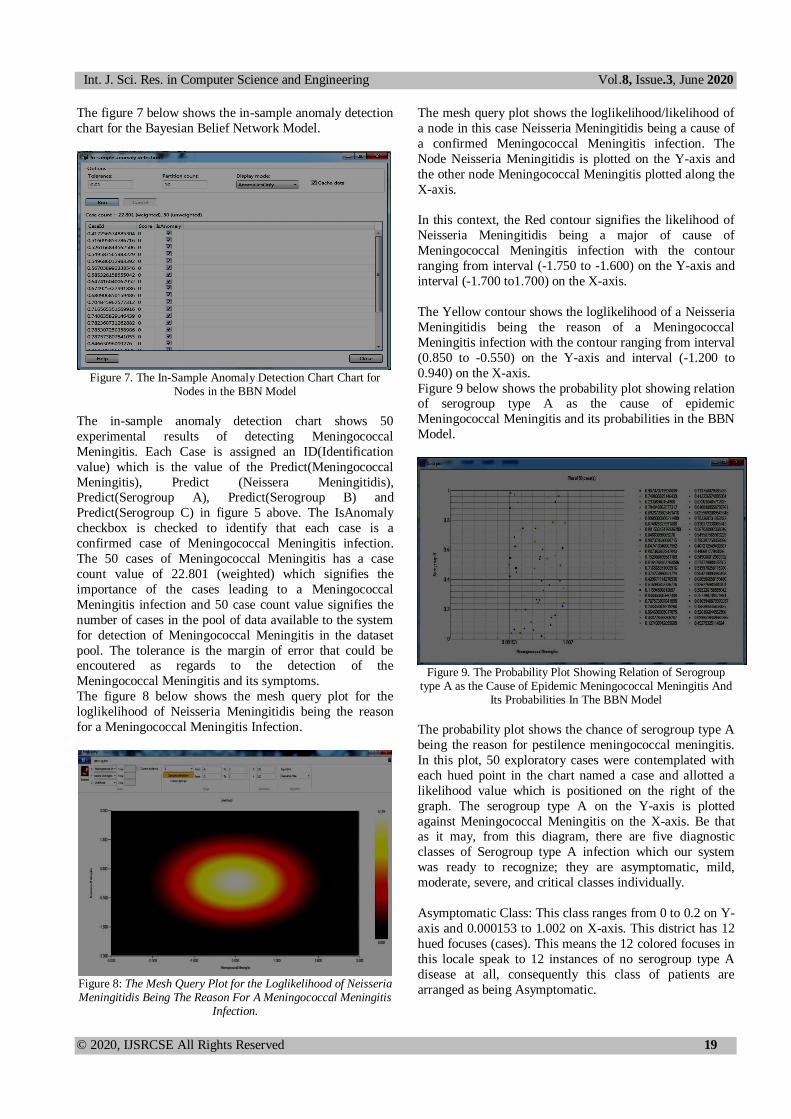
The figure 7 below shows the in-sample anomaly detection
chart for the Bayesian Belief Network Model.
Figure 7. The In-Sample Anomaly Detection Chart Chart for
Nodes in the BBN Model
The in-sample anomaly detection chart shows 50
experimental results of detecting Meningococcal
Meningitis. Each Case is assigned an ID(Identification
value) which is the value of the Predict(Meningococcal
Meningitis), Predict (Neissera Meningitidis), Predict(Serogroup A), Predict(Serogroup B) and
Predict(Serogroup C) in figure 5 above. The IsAnomaly
checkbox is checked to identify that each case is a
confirmed case of Meningococcal Meningitis infection.
The 50 cases of Meningococcal Meningitis has a case
count value of 22.801 (weighted) which signifies the
importance of the cases leading to a Meningococcal
Meningitis infection and 50 case count value signifies the
number of cases in the pool of data available to the system
for detection of Meningococcal Meningitis in the dataset
pool. The tolerance is the margin of error that could be encoutered as regards to the detection of the
Meningococcal Meningitis and its symptoms.
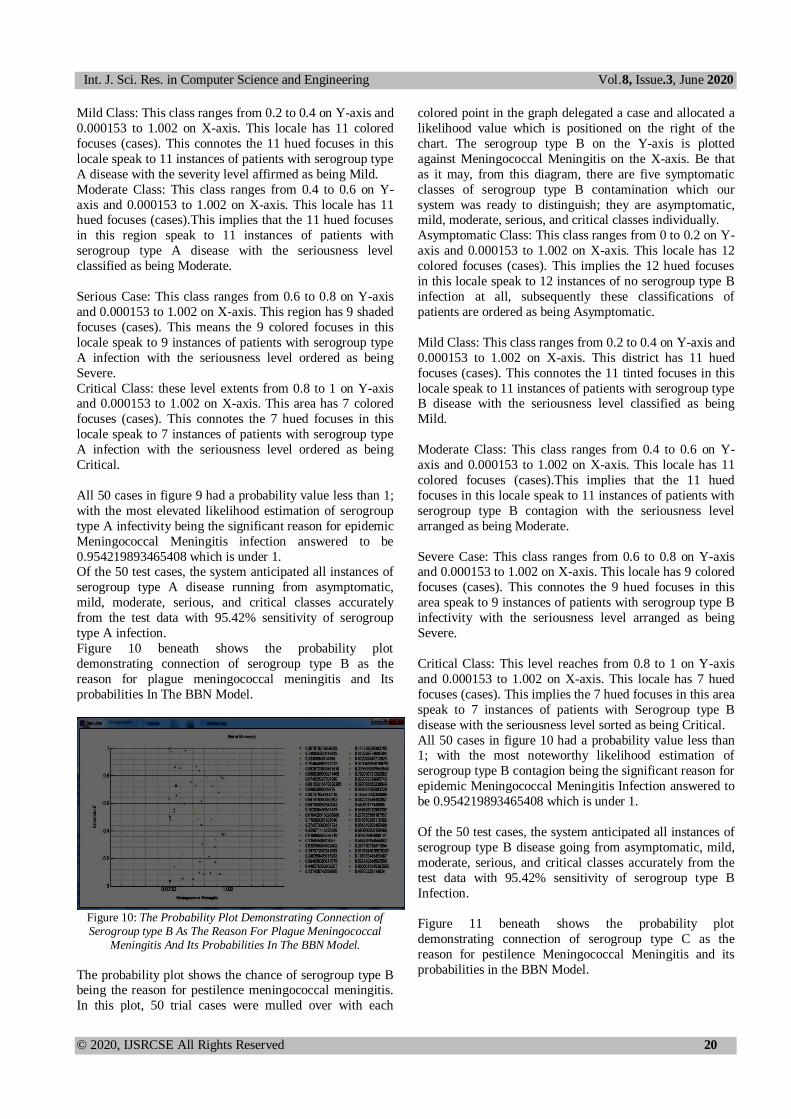
The figure 8 below shows the mesh query plot for the
loglikelihood of Neisseria Meningitidis being the reason
for a Meningococcal Meningitis Infection.
Figure 8: The Mesh Query Plot for the Loglikelihood of Neisseria Meningitidis Being The Reason For A Meningococcal Meningitis
Infection.
The mesh query plot shows the loglikelihood/likelihood of
a node in this case Neisseria Meningitidis being a cause of
a confirmed Meningococcal Meningitis infection. The
Node Neisseria Meningitidis is plotted on the Y-axis and
the other node Meningococcal Meningitis plotted along the
X-axis.
In this context, the Red contour signifies the likelihood of
Neisseria Meningitidis being a major of cause of
Meningococcal Meningitis infection with the contour
ranging from interval (-1.750 to -1.600) on the Y-axis and
interval (-1.700 to1.700) on the X-axis.
The Yellow contour shows the loglikelihood of a Neisseria
Meningitidis being the reason of a Meningococcal
Meningitis infection with the contour ranging from interval
(0.850 to -0.550) on the Y-axis and interval (-1.200 to
0.940) on the X-axis.
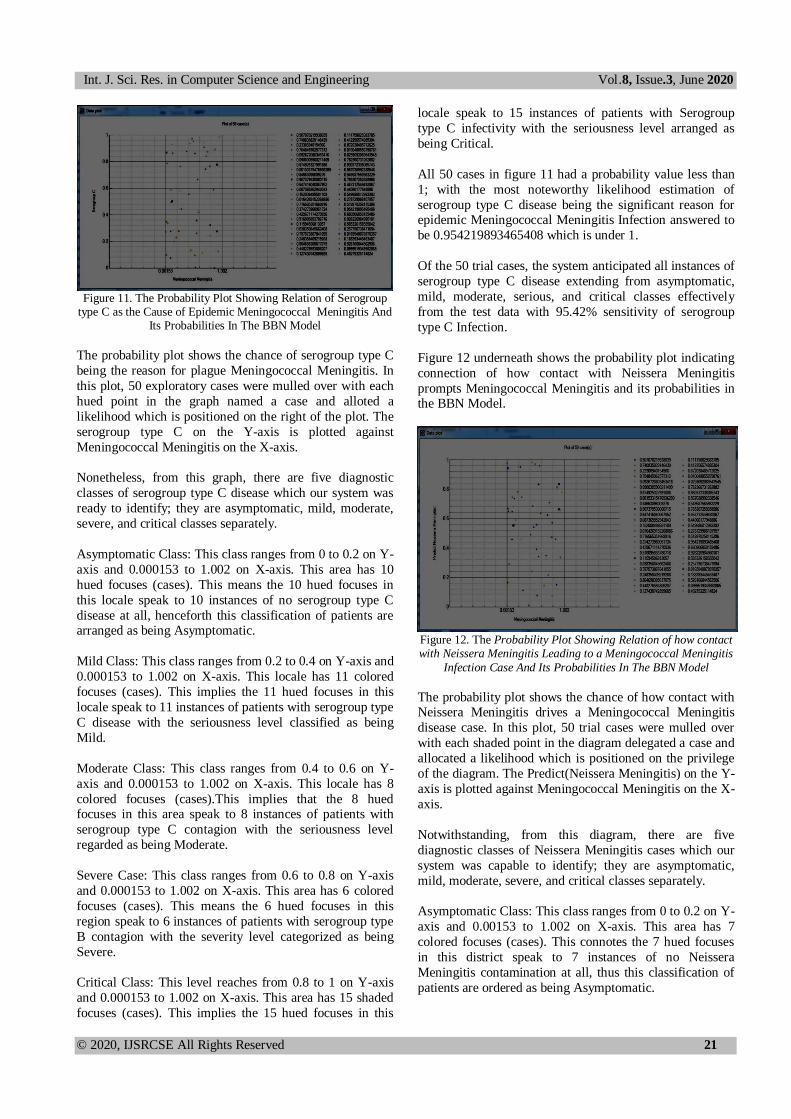
Figure 9 below shows the probability plot showing relation of serogroup type A as the cause of epidemic
Meningococcal Meningitis and its probabilities in the BBN
Model.
Figure 9. The Probability Plot Showing Relation of Serogroup
type A as the Cause of Epidemic Meningococcal Meningitis And Its Probabilities In The BBN Model
The probability plot shows the chance of serogroup type A
being the reason for pestilence meningococcal meningitis.
In this plot, 50 exploratory cases were contemplated with
each hued point in the chart named a case and allotted a
likelihood value which is positioned on the right of the
graph. The serogroup type A on the Y-axis is plotted
against Meningococcal Meningitis on the X-axis. Be that as it may, from this diagram, there are five diagnostic
classes of Serogroup type A infection which our system
was ready to recognize; they are asymptomatic, mild,
moderate, severe, and critical classes individually.
Asymptomatic Class: This class ranges from 0 to 0.2 on Y-
axis and 0.000153 to 1.002 on X-axis. This district has 12
hued focuses (cases). This means the 12 colored focuses in
this locale speak to 12 instances of no serogroup type A
disease at all, consequently this class of patients are
arranged as being Asymptomatic.
Int. J. Sci. Res. in Computer Science and Engineering Vol.8, Issue.3, June 2020
© 2020, IJSRCSE All Rights Reserved 20
Mild Class: This class ranges from 0.2 to 0.4 on Y-axis and
0.000153 to 1.002 on X-axis. This locale has 11 colored
focuses (cases). This connotes the 11 hued focuses in this
locale speak to 11 instances of patients with serogroup type
A disease with the severity level affirmed as being Mild.
Moderate Class: This class ranges from 0.4 to 0.6 on Y-
axis and 0.000153 to 1.002 on X-axis. This locale has 11 hued focuses (cases).This implies that the 11 hued focuses
in this region speak to 11 instances of patients with
serogroup type A disease with the seriousness level
classified as being Moderate.
Serious Case: This class ranges from 0.6 to 0.8 on Y-axis
and 0.000153 to 1.002 on X-axis. This region has 9 shaded
focuses (cases). This means the 9 colored focuses in this
locale speak to 9 instances of patients with serogroup type
A infection with the seriousness level ordered as being
Severe.
Critical Class: these level extents from 0.8 to 1 on Y-axis and 0.000153 to 1.002 on X-axis. This area has 7 colored
focuses (cases). This connotes the 7 hued focuses in this
locale speak to 7 instances of patients with serogroup type
A infection with the seriousness level ordered as being
Critical.
All 50 cases in figure 9 had a probability value less than 1;
with the most elevated likelihood estimation of serogroup
type A infectivity being the significant reason for epidemic
Meningococcal Meningitis infection answered to be
0.954219893465408 which is under 1. Of the 50 test cases, the system anticipated all instances of
serogroup type A disease running from asymptomatic,
mild, moderate, serious, and critical classes accurately
from the test data with 95.42% sensitivity of serogroup
type A infection.
Figure 10 beneath shows the probability plot
demonstrating connection of serogroup type B as the
reason for plague meningococcal meningitis and Its
probabilities In The BBN Model.
Figure 10: The Probability Plot Demonstrating Connection of Serogroup type B As The Reason For Plague Meningococcal
Meningitis And Its Probabilities In The BBN Model.
The probability plot shows the chance of serogroup type B being the reason for pestilence meningococcal meningitis.
In this plot, 50 trial cases were mulled over with each
colored point in the graph delegated a case and allocated a
likelihood value which is positioned on the right of the
chart. The serogroup type B on the Y-axis is plotted
against Meningococcal Meningitis on the X-axis. Be that
as it may, from this diagram, there are five symptomatic
classes of serogroup type B contamination which our
system was ready to distinguish; they are asymptomatic, mild, moderate, serious, and critical classes individually.
Asymptomatic Class: This class ranges from 0 to 0.2 on Y-
axis and 0.000153 to 1.002 on X-axis. This locale has 12
colored focuses (cases). This implies the 12 hued focuses
in this locale speak to 12 instances of no serogroup type B
infection at all, subsequently these classifications of
patients are ordered as being Asymptomatic.
Mild Class: This class ranges from 0.2 to 0.4 on Y-axis and
0.000153 to 1.002 on X-axis. This district has 11 hued
focuses (cases). This connotes the 11 tinted focuses in this
locale speak to 11 instances of patients with serogroup type B disease with the seriousness level classified as being
Mild.
Moderate Class: This class ranges from 0.4 to 0.6 on Y-
axis and 0.000153 to 1.002 on X-axis. This locale has 11
colored focuses (cases).This implies that the 11 hued
focuses in this locale speak to 11 instances of patients with
serogroup type B contagion with the seriousness level
arranged as being Moderate.
Severe Case: This class ranges from 0.6 to 0.8 on Y-axis and 0.000153 to 1.002 on X-axis. This locale has 9 colored
focuses (cases). This connotes the 9 hued focuses in this
area speak to 9 instances of patients with serogroup type B
infectivity with the seriousness level arranged as being
Severe.
Critical Class: This level reaches from 0.8 to 1 on Y-axis
and 0.000153 to 1.002 on X-axis. This locale has 7 hued
focuses (cases). This implies the 7 hued focuses in this area
speak to 7 instances of patients with Serogroup type B
disease with the seriousness level sorted as being Critical.
All 50 cases in figure 10 had a probability value less than 1; with the most noteworthy likelihood estimation of
serogroup type B contagion being the significant reason for
epidemic Meningococcal Meningitis Infection answered to
be 0.954219893465408 which is under 1.
Of the 50 test cases, the system anticipated all instances of
serogroup type B disease going from asymptomatic, mild,
moderate, serious, and critical classes accurately from the
test data with 95.42% sensitivity of serogroup type B
Infection.
Figure 11 beneath shows the probability plot
demonstrating connection of serogroup type C as the
reason for pestilence Meningococcal Meningitis and its
probabilities in the BBN Model.
Int. J. Sci. Res. in Computer Science and Engineering Vol.8, Issue.3, June 2020
© 2020, IJSRCSE All Rights Reserved 21
Figure 11. The Probability Plot Showing Relation of Serogroup type C as the Cause of Epidemic Meningococcal Meningitis And
Its Probabilities In The BBN Model
The probability plot shows the chance of serogroup type C
being the reason for plague Meningococcal Meningitis. In
this plot, 50 exploratory cases were mulled over with each
hued point in the graph named a case and alloted a
likelihood which is positioned on the right of the plot. The
serogroup type C on the Y-axis is plotted against
Meningococcal Meningitis on the X-axis.
Nonetheless, from this graph, there are five diagnostic
classes of serogroup type C disease which our system was
ready to identify; they are asymptomatic, mild, moderate,
severe, and critical classes separately.
Asymptomatic Class: This class ranges from 0 to 0.2 on Y-
axis and 0.000153 to 1.002 on X-axis. This area has 10
hued focuses (cases). This means the 10 hued focuses in
this locale speak to 10 instances of no serogroup type C
disease at all, henceforth this classification of patients are arranged as being Asymptomatic.
Mild Class: This class ranges from 0.2 to 0.4 on Y-axis and
0.000153 to 1.002 on X-axis. This locale has 11 colored
focuses (cases). This implies the 11 hued focuses in this
locale speak to 11 instances of patients with serogroup type
C disease with the seriousness level classified as being
Mild.
Moderate Class: This class ranges from 0.4 to 0.6 on Y-
axis and 0.000153 to 1.002 on X-axis. This locale has 8
colored focuses (cases).This implies that the 8 hued focuses in this area speak to 8 instances of patients with
serogroup type C contagion with the seriousness level
regarded as being Moderate.
Severe Case: This class ranges from 0.6 to 0.8 on Y-axis
and 0.000153 to 1.002 on X-axis. This area has 6 colored
focuses (cases). This means the 6 hued focuses in this
region speak to 6 instances of patients with serogroup type
B contagion with the severity level categorized as being
Severe.
Critical Class: This level reaches from 0.8 to 1 on Y-axis
and 0.000153 to 1.002 on X-axis. This area has 15 shaded
focuses (cases). This implies the 15 hued focuses in this
locale speak to 15 instances of patients with Serogroup
type C infectivity with the seriousness level arranged as
being Critical.
All 50 cases in figure 11 had a probability value less than
1; with the most noteworthy likelihood estimation of
serogroup type C disease being the significant reason for epidemic Meningococcal Meningitis Infection answered to
be 0.954219893465408 which is under 1.
Of the 50 trial cases, the system anticipated all instances of
serogroup type C disease extending from asymptomatic,
mild, moderate, serious, and critical classes effectively
from the test data with 95.42% sensitivity of serogroup
type C Infection.
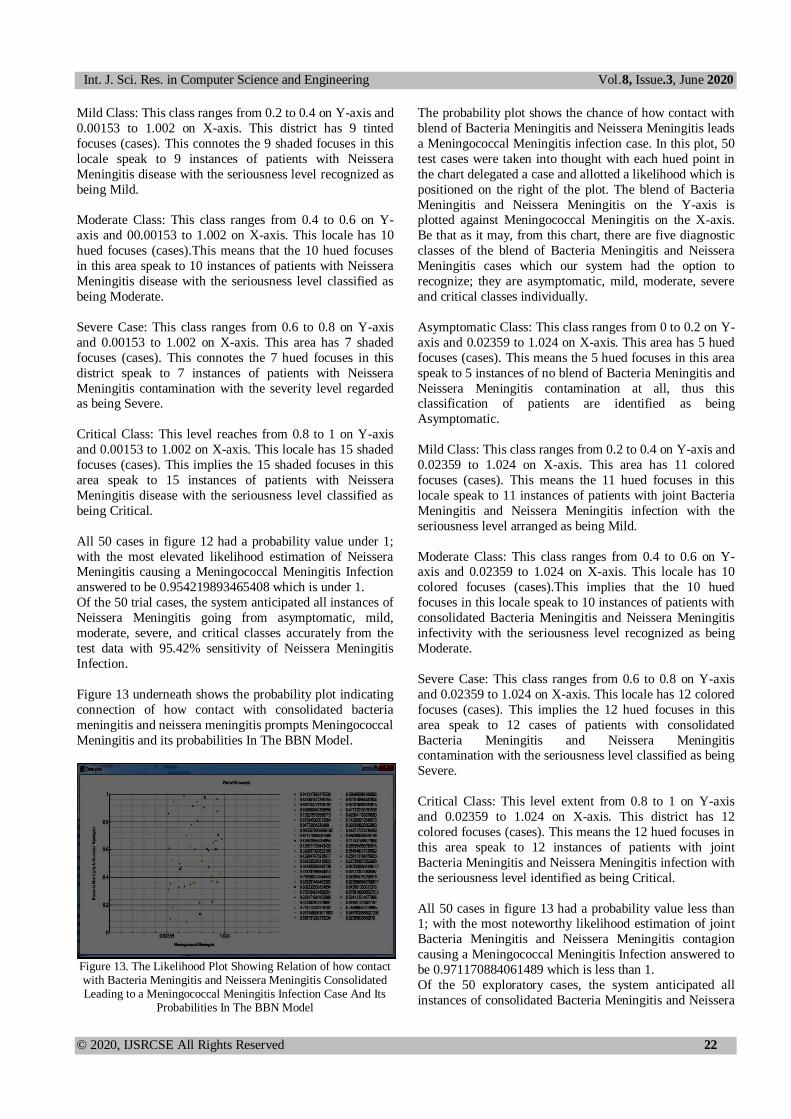
Figure 12 underneath shows the probability plot indicating
connection of how contact with Neissera Meningitis
prompts Meningococcal Meningitis and its probabilities in the BBN Model.
Figure 12. The Probability Plot Showing Relation of how contact with Neissera Meningitis Leading to a Meningococcal Meningitis
Infection Case And Its Probabilities In The BBN Model
The probability plot shows the chance of how contact with Neissera Meningitis drives a Meningococcal Meningitis
disease case. In this plot, 50 trial cases were mulled over
with each shaded point in the diagram delegated a case and
allocated a likelihood which is positioned on the privilege
of the diagram. The Predict(Neissera Meningitis) on the Y-
axis is plotted against Meningococcal Meningitis on the X-
axis.
Notwithstanding, from this diagram, there are five
diagnostic classes of Neissera Meningitis cases which our
system was capable to identify; they are asymptomatic,
mild, moderate, severe, and critical classes separately.
Asymptomatic Class: This class ranges from 0 to 0.2 on Y-
axis and 0.00153 to 1.002 on X-axis. This area has 7
colored focuses (cases). This connotes the 7 hued focuses
in this district speak to 7 instances of no Neissera
Meningitis contamination at all, thus this classification of
patients are ordered as being Asymptomatic.
Int. J. Sci. Res. in Computer Science and Engineering Vol.8, Issue.3, June 2020
© 2020, IJSRCSE All Rights Reserved 22
Mild Class: This class ranges from 0.2 to 0.4 on Y-axis and
0.00153 to 1.002 on X-axis. This district has 9 tinted
focuses (cases). This connotes the 9 shaded focuses in this
locale speak to 9 instances of patients with Neissera
Meningitis disease with the seriousness level recognized as
being Mild.
Moderate Class: This class ranges from 0.4 to 0.6 on Y-
axis and 00.00153 to 1.002 on X-axis. This locale has 10
hued focuses (cases).This means that the 10 hued focuses
in this area speak to 10 instances of patients with Neissera
Meningitis disease with the seriousness level classified as
being Moderate.
Severe Case: This class ranges from 0.6 to 0.8 on Y-axis
and 0.00153 to 1.002 on X-axis. This area has 7 shaded
focuses (cases). This connotes the 7 hued focuses in this
district speak to 7 instances of patients with Neissera
Meningitis contamination with the severity level regarded as being Severe.
Critical Class: This level reaches from 0.8 to 1 on Y-axis
and 0.00153 to 1.002 on X-axis. This locale has 15 shaded
focuses (cases). This implies the 15 shaded focuses in this
area speak to 15 instances of patients with Neissera
Meningitis disease with the seriousness level classified as
being Critical.
All 50 cases in figure 12 had a probability value under 1;
with the most elevated likelihood estimation of Neissera Meningitis causing a Meningococcal Meningitis Infection
answered to be 0.954219893465408 which is under 1.
Of the 50 trial cases, the system anticipated all instances of
Neissera Meningitis going from asymptomatic, mild,
moderate, severe, and critical classes accurately from the
test data with 95.42% sensitivity of Neissera Meningitis
Infection.
Figure 13 underneath shows the probability plot indicating
connection of how contact with consolidated bacteria
meningitis and neissera meningitis prompts Meningococcal
Meningitis and its probabilities In The BBN Model.
Figure 13. The Likelihood Plot Showing Relation of how contact with Bacteria Meningitis and Neissera Meningitis Consolidated Leading to a Meningococcal Meningitis Infection Case And Its
Probabilities In The BBN Model
The probability plot shows the chance of how contact with
blend of Bacteria Meningitis and Neissera Meningitis leads
a Meningococcal Meningitis infection case. In this plot, 50
test cases were taken into thought with each hued point in
the chart delegated a case and allotted a likelihood which is
positioned on the right of the plot. The blend of Bacteria
Meningitis and Neissera Meningitis on the Y-axis is plotted against Meningococcal Meningitis on the X-axis.
Be that as it may, from this chart, there are five diagnostic
classes of the blend of Bacteria Meningitis and Neissera
Meningitis cases which our system had the option to
recognize; they are asymptomatic, mild, moderate, severe
and critical classes individually.
Asymptomatic Class: This class ranges from 0 to 0.2 on Y-
axis and 0.02359 to 1.024 on X-axis. This area has 5 hued
focuses (cases). This means the 5 hued focuses in this area
speak to 5 instances of no blend of Bacteria Meningitis and
Neissera Meningitis contamination at all, thus this classification of patients are identified as being
Asymptomatic.
Mild Class: This class ranges from 0.2 to 0.4 on Y-axis and
0.02359 to 1.024 on X-axis. This area has 11 colored
focuses (cases). This means the 11 hued focuses in this
locale speak to 11 instances of patients with joint Bacteria
Meningitis and Neissera Meningitis infection with the
seriousness level arranged as being Mild.
Moderate Class: This class ranges from 0.4 to 0.6 on Y-axis and 0.02359 to 1.024 on X-axis. This locale has 10
colored focuses (cases).This implies that the 10 hued
focuses in this locale speak to 10 instances of patients with
consolidated Bacteria Meningitis and Neissera Meningitis
infectivity with the seriousness level recognized as being
Moderate.
Severe Case: This class ranges from 0.6 to 0.8 on Y-axis
and 0.02359 to 1.024 on X-axis. This locale has 12 colored
focuses (cases). This implies the 12 hued focuses in this
area speak to 12 cases of patients with consolidated
Bacteria Meningitis and Neissera Meningitis contamination with the seriousness level classified as being
Severe.
Critical Class: This level extent from 0.8 to 1 on Y-axis
and 0.02359 to 1.024 on X-axis. This district has 12
colored focuses (cases). This means the 12 hued focuses in
this area speak to 12 instances of patients with joint
Bacteria Meningitis and Neissera Meningitis infection with
the seriousness level identified as being Critical.
All 50 cases in figure 13 had a probability value less than 1; with the most noteworthy likelihood estimation of joint
Bacteria Meningitis and Neissera Meningitis contagion
causing a Meningococcal Meningitis Infection answered to
be 0.971170884061489 which is less than 1.
Of the 50 exploratory cases, the system anticipated all
instances of consolidated Bacteria Meningitis and Neissera
Int. J. Sci. Res. in Computer Science and Engineering Vol.8, Issue.3, June 2020
© 2020, IJSRCSE All Rights Reserved 23
Meningitis prompting Meningococcal Meningitis disease
case going from asymptomatic, mild, moderate, severe and
critical classes effectively from the test data with 97.11%
sensitivity of the blend of Bacteria Meningitis and Neissera
Meningitis being the reason for a meningococcal
meningitis infection.
Besides, with the severity level of Meningococcal
Meningtitis, Neissera Meningitis, consolidated Bacteria
Meningitis and Neissera Meningitis, Serogroup Type A,B
and C already attained, we intend to plot the graph for the
loglikelihood graph for detecting Meningococcal
Meningitis with its indications; likelihood against
loglikelihood chart for predicting Meningococcal
Meningitis and also unravel the loglikelihood value for
detecting Meningococcal Meningitis; and prediction
accuracy of the BBN model which will be discussed in
figure 14 and 15 below.
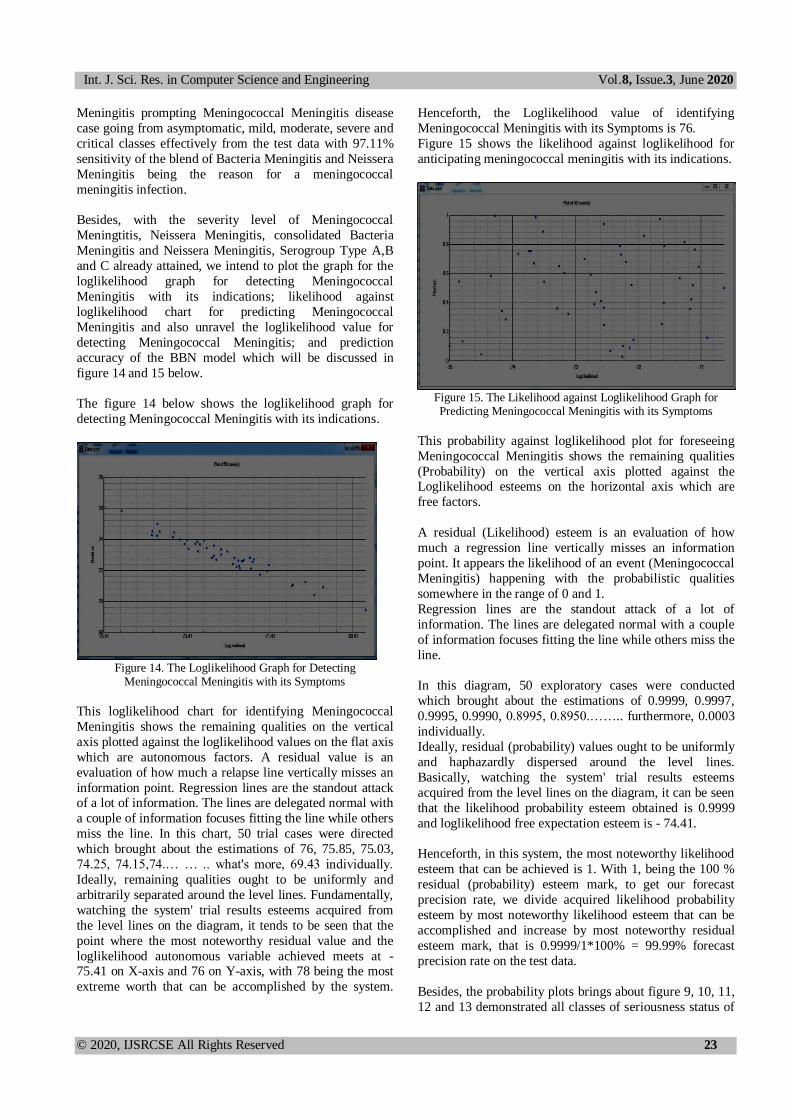
The figure 14 below shows the loglikelihood graph for
detecting Meningococcal Meningitis with its indications.
Figure 14. The Loglikelihood Graph for Detecting
Meningococcal Meningitis with its Symptoms
This loglikelihood chart for identifying Meningococcal
Meningitis shows the remaining qualities on the vertical
axis plotted against the loglikelihood values on the flat axis
which are autonomous factors. A residual value is an
evaluation of how much a relapse line vertically misses an
information point. Regression lines are the standout attack of a lot of information. The lines are delegated normal with
a couple of information focuses fitting the line while others
miss the line. In this chart, 50 trial cases were directed
which brought about the estimations of 76, 75.85, 75.03,
74.25, 74.15,74.… … .. what's more, 69.43 individually.
Ideally, remaining qualities ought to be uniformly and
arbitrarily separated around the level lines. Fundamentally,
watching the system' trial results esteems acquired from
the level lines on the diagram, it tends to be seen that the
point where the most noteworthy residual value and the
loglikelihood autonomous variable achieved meets at - 75.41 on X-axis and 76 on Y-axis, with 78 being the most
extreme worth that can be accomplished by the system.
Henceforth, the Loglikelihood value of identifying
Meningococcal Meningitis with its Symptoms is 76.
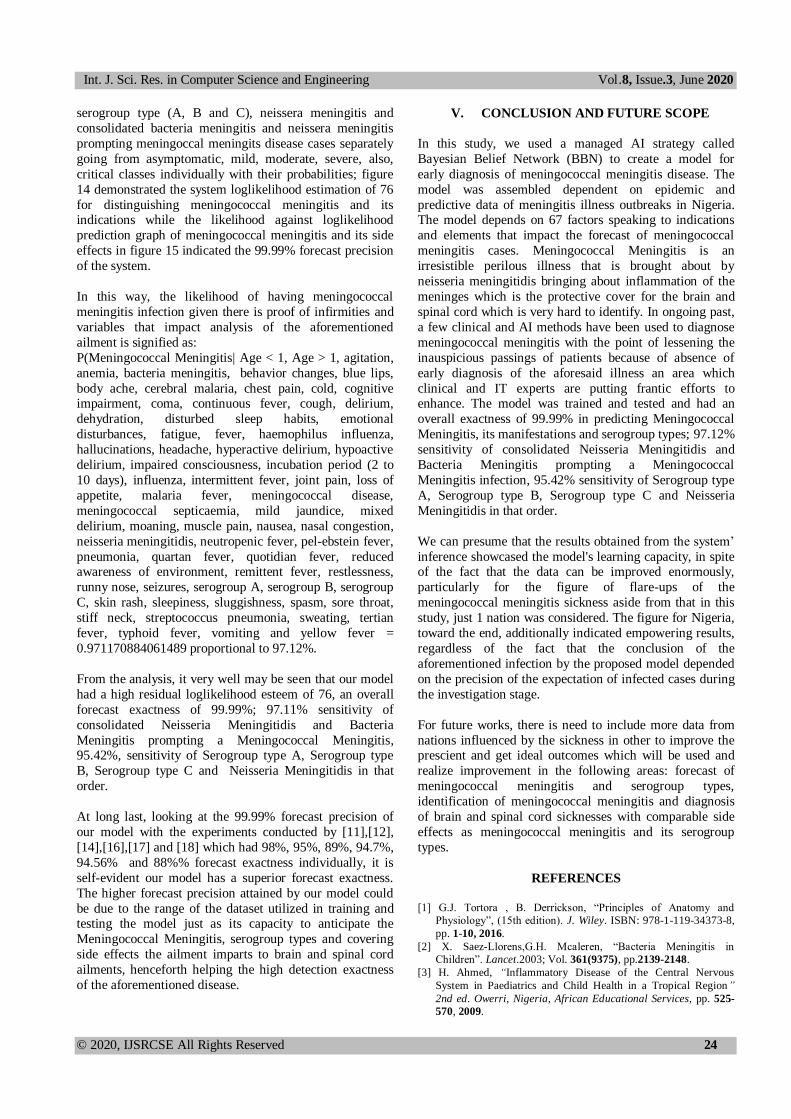
Figure 15 shows the likelihood against loglikelihood for
anticipating meningococcal meningitis with its indications.
Figure 15. The Likelihood against Loglikelihood Graph for Predicting Meningococcal Meningitis with its Symptoms
This probability against loglikelihood plot for foreseeing
Meningococcal Meningitis shows the remaining qualities
(Probability) on the vertical axis plotted against the Loglikelihood esteems on the horizontal axis which are
free factors.
A residual (Likelihood) esteem is an evaluation of how
much a regression line vertically misses an information
point. It appears the likelihood of an event (Meningococcal
Meningitis) happening with the probabilistic qualities
somewhere in the range of 0 and 1.
Regression lines are the standout attack of a lot of
information. The lines are delegated normal with a couple
of information focuses fitting the line while others miss the
line.
In this diagram, 50 exploratory cases were conducted
which brought about the estimations of 0.9999, 0.9997,
0.9995, 0.9990, 0.8995, 0.8950.…….. furthermore, 0.0003
individually.
Ideally, residual (probability) values ought to be uniformly
and haphazardly dispersed around the level lines.
Basically, watching the system' trial results esteems
acquired from the level lines on the diagram, it can be seen
that the likelihood probability esteem obtained is 0.9999
and loglikelihood free expectation esteem is - 74.41.
Henceforth, in this system, the most noteworthy likelihood
esteem that can be achieved is 1. With 1, being the 100 %
residual (probability) esteem mark, to get our forecast
precision rate, we divide acquired likelihood probability
esteem by most noteworthy likelihood esteem that can be
accomplished and increase by most noteworthy residual
esteem mark, that is 0.9999/1*100% = 99.99% forecast
precision rate on the test data.
Besides, the probability plots brings about figure 9, 10, 11,
12 and 13 demonstrated all classes of seriousness status of
Int. J. Sci. Res. in Computer Science and Engineering Vol.8, Issue.3, June 2020
© 2020, IJSRCSE All Rights Reserved 24
serogroup type (A, B and C), neissera meningitis and
consolidated bacteria meningitis and neissera meningitis
prompting meningoccal meningits disease cases separately
going from asymptomatic, mild, moderate, severe, also,
critical classes individually with their probabilities; figure
14 demonstrated the system loglikelihood estimation of 76
for distinguishing meningococcal meningitis and its indications while the likelihood against loglikelihood
prediction graph of meningococcal meningitis and its side
effects in figure 15 indicated the 99.99% forecast precision
of the system.
In this way, the likelihood of having meningococcal
meningitis infection given there is proof of infirmities and
variables that impact analysis of the aforementioned
ailment is signified as:
P(Meningococcal Meningitis| Age < 1, Age > 1, agitation,
anemia, bacteria meningitis, behavior changes, blue lips,
body ache, cerebral malaria, chest pain, cold, cognitive impairment, coma, continuous fever, cough, delirium,
dehydration, disturbed sleep habits, emotional
disturbances, fatigue, fever, haemophilus influenza,
hallucinations, headache, hyperactive delirium, hypoactive
delirium, impaired consciousness, incubation period (2 to
10 days), influenza, intermittent fever, joint pain, loss of
appetite, malaria fever, meningococcal disease,
meningococcal septicaemia, mild jaundice, mixed
delirium, moaning, muscle pain, nausea, nasal congestion,
neisseria meningitidis, neutropenic fever, pel-ebstein fever,
pneumonia, quartan fever, quotidian fever, reduced awareness of environment, remittent fever, restlessness,
runny nose, seizures, serogroup A, serogroup B, serogroup
C, skin rash, sleepiness, sluggishness, spasm, sore throat,
stiff neck, streptococcus pneumonia, sweating, tertian
fever, typhoid fever, vomiting and yellow fever =
0.971170884061489 proportional to 97.12%.
From the analysis, it very well may be seen that our model
had a high residual loglikelihood esteem of 76, an overall
forecast exactness of 99.99%; 97.11% sensitivity of
consolidated Neisseria Meningitidis and Bacteria
Meningitis prompting a Meningococcal Meningitis, 95.42%, sensitivity of Serogroup type A, Serogroup type
B, Serogroup type C and Neisseria Meningitidis in that
order.
At long last, looking at the 99.99% forecast precision of
our model with the experiments conducted by [11],[12],
[14],[16],[17] and [18] which had 98%, 95%, 89%, 94.7%,
94.56% and 88%% forecast exactness individually, it is
self-evident our model has a superior forecast exactness.
The higher forecast precision attained by our model could
be due to the range of the dataset utilized in training and testing the model just as its capacity to anticipate the
Meningococcal Meningitis, serogroup types and covering
side effects the ailment imparts to brain and spinal cord
ailments, henceforth helping the high detection exactness
of the aforementioned disease.
V. CONCLUSION AND FUTURE SCOPE
In this study, we used a managed AI strategy called
Bayesian Belief Network (BBN) to create a model for
early diagnosis of meningococcal meningitis disease. The
model was assembled dependent on epidemic and
predictive data of meningitis illness outbreaks in Nigeria. The model depends on 67 factors speaking to indications
and elements that impact the forecast of meningococcal
meningitis cases. Meningococcal Meningitis is an
irresistible perilous illness that is brought about by
neisseria meningitidis bringing about inflammation of the
meninges which is the protective cover for the brain and
spinal cord which is very hard to identify. In ongoing past,
a few clinical and AI methods have been used to diagnose
meningococcal meningitis with the point of lessening the
inauspicious passings of patients because of absence of
early diagnosis of the aforesaid illness an area which
clinical and IT experts are putting frantic efforts to enhance. The model was trained and tested and had an
overall exactness of 99.99% in predicting Meningococcal
Meningitis, its manifestations and serogroup types; 97.12%
sensitivity of consolidated Neisseria Meningitidis and
Bacteria Meningitis prompting a Meningococcal
Meningitis infection, 95.42% sensitivity of Serogroup type
A, Serogroup type B, Serogroup type C and Neisseria
Meningitidis in that order.
We can presume that the results obtained from the system’
inference showcased the model's learning capacity, in spite of the fact that the data can be improved enormously,
particularly for the figure of flare-ups of the
meningococcal meningitis sickness aside from that in this
study, just 1 nation was considered. The figure for Nigeria,
toward the end, additionally indicated empowering results,
regardless of the fact that the conclusion of the
aforementioned infection by the proposed model depended
on the precision of the expectation of infected cases during
the investigation stage.
For future works, there is need to include more data from
nations influenced by the sickness in other to improve the prescient and get ideal outcomes which will be used and
realize improvement in the following areas: forecast of
meningococcal meningitis and serogroup types,
identification of meningococcal meningitis and diagnosis
of brain and spinal cord sicknesses with comparable side
effects as meningococcal meningitis and its serogroup
types.
REFERENCES
[1] G.J. Tortora , B. Derrickson, “Principles of Anatomy and
Physiology”, (15th edition). J. Wiley. ISBN: 978-1-119-34373-8,
pp. 1-10, 2016.
[2] X. Saez-Llorens,G.H. Mcaleren, “Bacteria Meningitis in
Children”. Lancet.2003; Vol. 361(9375), pp.2139-2148.
[3] H. Ahmed, “Inflammatory Disease of the Central Nervous
System in Paediatrics and Child Health in a Tropical Region”
2nd ed. Owerri, Nigeria, African Educational Services, pp. 525-
570, 2009.
Int. J. Sci. Res. in Computer Science and Engineering Vol.8, Issue.3, June 2020
© 2020, IJSRCSE All Rights Reserved 25
[4] World Health Organization, “WHO Report on Global
Surveillance of Epidemic-prone Infectious Diseases-
Meningococcal Disease”, WHO/CDS/CSR/2000.1, Chapter 5:
Meningococcal Disease.pdf, pp. 55-61, 2000.
[5] Health Department, Republic of South Africa, "Guidelines for the
Management, Prevention and Control of Meningococcal Disease
in South Africa 2011". ISBN: 978-1-920031-63-3, pp. 1-48,
2011.
[6] J.R. Zunt, N.J. Kassebaum, N. Blake, L. Glennie, C. Wright, E.
Nichols et. al, “Global, Regional, and National Burden of
Meningitis, 1990–2016: A Systematic Analysis for the Global
Burden of Disease Study 2016”. Lancet Neurol, 17(12): pp.1061–
1082, 2018.
[7] WHO Technical Task Force, “Defeating Meningitis By 2030:
Baseline Situation Analysis”. The 2010 MenAfriVac vaccine
launch in Burkina Faso PATH/Gabe Bienczycki. pp. 1-54, 2010.
[8] A.P. Hrishi, S. Manikandah, “Cerebral Spinal Fluid (CSF)
Analysis and Interpretation In Neurocritical Care for Acute
Neurological Conditions”. Indian Journal of Critical Care
Medicine, Vol. 23(2), pp. 115-119, 2019. doi: 10.5005/jp-
journals-10071-23197.
[9] Doherty, C.M and Forbes, R.B.:“Diagnostic Lumbar Puncture”.
The Ulster Medical Journal, Vol. 83(2), pp. 93-102, 2014.
[10] K. Revett, F. Gorunescu, M. Gorunescu, M. Ene, “A Machine
Learning Approach to Differentiating Bacterial From Viral
Meningitis”. IEEE. Reprinted from IEEE John Vincent Atanasoff
2006. International Symposium on Modern Computing (JVA'06).
IEEE, Los Alamitos, USA, ISBN 0769526438, pp. 155-162,
2006.
[11] V.K. Mago, R. Mehta, R. Woolrych, E.I. Papageorgiou,
"Supporting Meningitis Diagnosis Amongst Infants and Children
Through The Use of Fuzzy Cognitive Mapping". BMC Medical
Informatics and Decision Making, Vol. 12(98), pp: 1-12, 2012.
[12] M. Langarizadeh, H. Khajehpour, M. Eftekhari, “A Fuzzy
Expert System for Distinguishing between Bacterial and Aseptic
Meningitis” Iranian Journal of Medical Physics, Vol. 12(1), pp.
1-6, Winter 2015.
[13] W. Ritha, W.L, Merline, “Risk Factors of Meningitis in Adults-
An Analysis Using Fuzzy Cognitive Map with TOPSIS”.
International Journal of Scientific and Innovative Mathematical
Research (IJSIMR) Vol. 2(4), pp. 418-425, April 2014, ISSN
2347-307X (Print) & ISSN 2347-3142 (Online).
[14] N.D. Oye, L.L. Thomas, “Fuzzy Model for Diagnosis of
Bacterial Meningitis”. International Journal of Computer
Applications Technology and Research, Vol. 8(2), pp. 33-51,
2019, ISSN: 2319–8656.
[15] A.M. Abubakar, K.A. Abdulsalam, J.A. Adebisi, “Application of
Artificial Neural Network for Diagnosis of Cerebrospinal
Meningitis”. Journal of Engineering Research, Special Edition,
Vol. 24(2), pp.12-25, December 2019.
[16] K. Zaccari, E.C. Marujo, “Machine Learning for Aiding
Meningitis Diagnosis in Pediatric Patients”. World Academy of
Science, Engineering and Technology International Journal of
Medical and Health Sciences, Vol. 13(9), pp. 411-419, 2019,
ISNI:0000000091950263.
[17] V.M. Lelis, E. Guzman, M-V. Belmonte,“Non-Invasive
Meningitis Diagnosis Using Decision Trees”. IEEE Access, Vol.
8, pp. 18394-18407, January 29, 2020., Digital Object Identifier
10.1109/ACCESS.2020.2966397.
[18] A. Simon, M.S. Deo, S. Venkatesan, D.R.R. Babu, “Machine
Learning and its Applications”. International Journal of
Electrical Sciences & Engineering (IJESE), Vol. 1(1), pp. 22-24,
2015.
[19] I. Ben-Gal, F. Ruggeri, F. Faltin, R. Kenett, “Bayesian
Networks”. Encyclopedia of Statistics in Quality and Reliability.
John Wiley and Sons, Ltd. www.eng.tau.ac.il/bengal/BN.pdf/. pp.
1-6, 2007.
[20] Kaggle Datasets, “Disease Outbreaks in Nigeria Datasets:
Predicting Meningitis Disease Outbreaks Using Machine
Learning”, 2020.
Authors Profile
Mr. Solomon Osarumwense Alile obtained a Diploma in
Data Processing degree from University of Benin in 2004,
B.Sc. degree in Computer Science in 2012 from Lagos
StateUniversity (LASU), Ojo, Lagos and M.Sc in
Computer Science from University of Benin in 2019. He
is a Cisco Certified Network Associate (Routing and
Switching) and System Engineer. He is a corporate
member of Nigerian Institution of Professional Engineers
and Scientists (NIPES), and member of the following societies namely: International Computer Science and
Engineering Society (ICSES), Institute For Engineering
Research and Publication (IFERP), International
Association of Engineers (IAENG), International
Association of Engineers Society of Computer Science
(ISCS), International Association of Engineers Society of
Wireless Networks (ISWN), International Association of
Engineers Society of Scientific Computing (ISSC),
International Association of Engineers Society of Internet
Computingand Web Services (ISICWS), International
Association of Engineers Society of Information System
Engineering (ISISE), International Association of Engineers Society of Data Mining (ISDM), International
Association of Engineers Society of Artificial Intelligence
(ISAI), and International Association of Engineers Society
of Software Engineering (ISSE). He has published more
than 10 research papers in reputed international journals
which covers the area of cybersecurity and application of
artificial intelligence in health diagnosis, all of which are
available online. His skills are Machine Learning,
Supervised Learning, Computer Networking, Routing and
Switching and Network Security. His area of interest
includes Information Technology, Machine Learning and Cybersecurity. He is currently conducting research works
in the area of cybersecurity and development of AI Based
Systems.
Mr Moses Eromosele Bello obtained Ordinary National
Diploma in Computer Science from Auchi Polythenic in
2010, Bachelor of Science and Master of Science from
University of Benin, Benin City in year 2014 and 2019
respectively. He is a member of Nigeria Computer Society
(NCS) since 2019. He has published more than 11 research
papers in reputed international journals and are available
online. His skills are Machine Learning, Supervised Learning, Neural Networks, Artificial Intelligence and Java
Programming. His main research work focuses on machine
learning and development of AI Based Systems.