Embed Size (px)
Citation preview
SOFTWARE—PRACTICE AND EXPERIENCE, VOL. 26(11), 1277–1299 (NOVEMBER 1996)
A Machine-Independent Debugger
DAVID R. HANSON AND MUKUND RAGHAVACHARI
Department of Computer Science, Princeton University, 35 Olden Street,Princeton, NJ 08544 U.S.A.
(email: {drh,mrm}@cs.princeton.edu)
SUMMARY
cdb is a simple, source-level debugger for ANSI/ISO C programs compiled by lcc, aretargetable C compiler. cdb is completely independent of its target architecture. Thisindependence is achieved by embedding a small amount of itself — a ‘nub’ — in the pro-gram to be debugged and by having the compiler emit machine-independent symbol-tabledata and related code. This paper describes the design of a nub interface for debugging,a target-independent implementation of this interface for cdb, and the implementationof cdb itself. When compared to platform-specific debuggers, cdb’s implementation isminuscule: the nub, debugger, and associated communications routines take about 1500lines of C, and fewer than 600 lines were added to lcc’s front end to emit symbol tablesand breakpoint hooks. All this code is machine independent.
KEY WORDS debuggers; retargetable compilers; programming environments; lcc
INTRODUCTION
Source-level debuggers are notoriously machine-dependent programs. Most debuggersdepend not only on the machine on which they run, but also depend on the compil-ers, linkers, and operating systems with which they collaborate. These dependenciesusually involve arcane data formats, complicated protocols, or obscure and even un-documented system calls.
Debuggers depend on compilers because compilers and linkers generate the sym-bol tables and object code that debuggers must read to interpret user input, displaysource-level values, and to find source-code locations. Debuggers depend on machinearchitectures because most debuggers use hardware-specific facilities for implement-ing breakpoints and single stepping. Debuggers depend on operating systems becausedebuggers must arrange to access the address space of the program being debugged— the target — and they must control the target’s execution. The situation is evenmore complicated in debuggers for concurrent languages.
Building a source-level debugger for a new machine, even for an existing language, isa complex and time-consuming process that can easily dwarf the effort needed to buildthe compiler. It usually involves rewriting most of the code that deals with symboltables and with object-code formats, because these vary widely with architecturesand operating systems. Similarly, each architecture and operating system has its ownfacilities for accessing and controlling the target. gdb,1 a widely used debugger on
CCC 0038–0644/96/111277–23 Received 9 November 1995c©1996 by John Wiley & Sons, Ltd. Revised 29 February 1996
1278 D. R. HANSON AND M. RAGHAVACHARI
many Unix platforms, illustrates the complexity involved even for a single operatingsystem: gdb is more than 150,000 lines of C of which over 47,000 is machine dependent.
This paper describes the design for a debugger that disentangles the machine-dependent parts of a debugger from its machine-independent parts, and a prototypeof a minimal debugger for ANSI/ISO C that is almost totally machine independent.This debugger, cdb, illustrates the advantages of the design and exposes areas whereit falls short of its goals.cdb and the design strategy on which it is based capitalize on and extend recent work
on machine-independent debuggers. ldb,2, 3 a retargetable debugger for ANSI/ISO C,uses a variety of techniques to isolate architecture, compiler, and operating systemdependencies. It uses a programmable symbol-table format in which the form of thesymbol table is machine independent but its content is machine dependent; the de-bugger itself simply interprets symbol table ‘programs.’ ldb loads a small, mostlymachine-dependent debug nub4 with the target and communicates with it to manipu-late breakpoints and to access the target’s address space. ldb evaluates C expressionsby using a variant of its companion compiler, lcc,5 to compile C expressions and emitcode in the same language used for its symbol tables, which ldb is already equippedto interpret. These techniques collaborate effortlessly to make ldb a cross debugger:it can run on one architecture and debug a target running on different architectureelsewhere on the network.
These techniques each sound simple and even obvious in theory, but ldb shows thatit can be excruciatingly laborious to combine them effectively in practice to build arealistic, retargetable source-level debugger. cdb is simpler than ldb because it’s aminimalist design: it takes a few of the components of the ldb approach and stripsthem down as much as possible, and, wherever possible, it avoids a priori assumptionsabout how these components can be combined. For example, the cdb design saysnothing about symbol-table formats. It provides only a mechanism for debuggers toaccess the target’s symbol table as if it were just another address space; compilers anddebuggers must agree on the representation details. cdb also omits easily separablefacilities, such as expression evaluation.
DESIGN
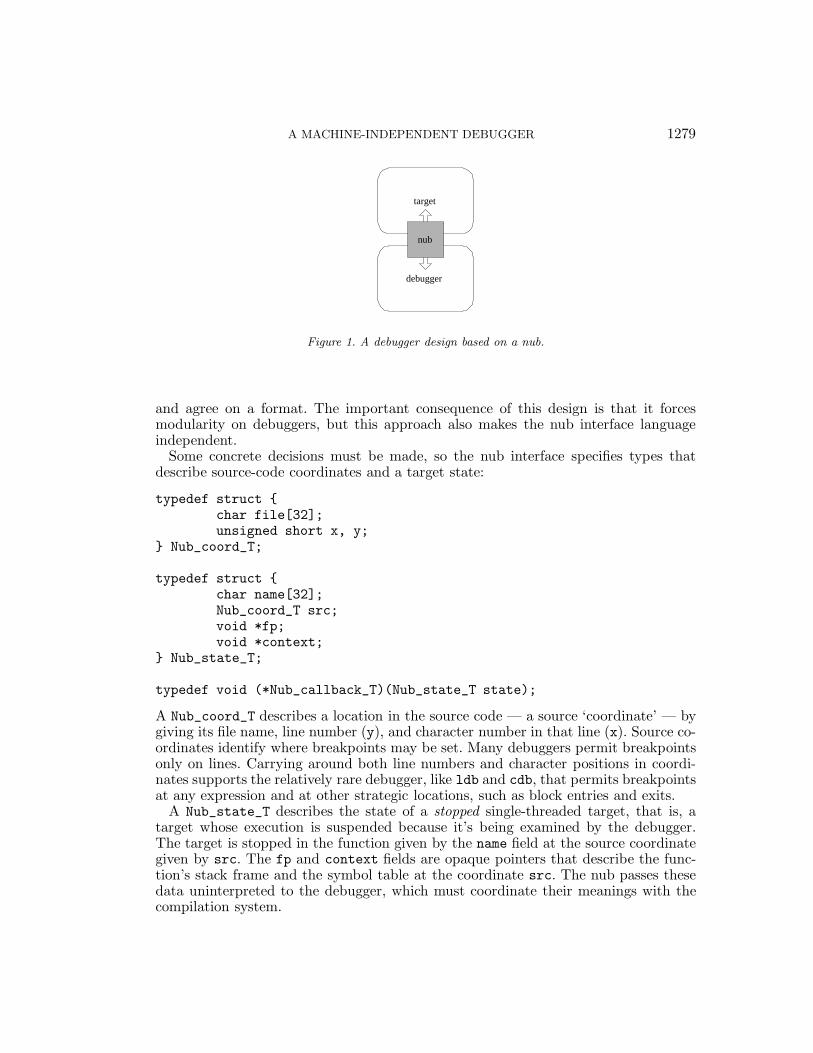
All communication between a debugger and a target funnels through a nub, as de-picted in Figure 1. The details of the nub interface define what the debugger can doto and with the target, and thus constrain the debugger’s design space. The nub in-terface is small so that its implementation will be small. The interface is independentof the environment, but its implementation is not; a particular nub implementationmight depend on everything — the target architecture, language, compiler, linker, andoperating system. The cdb nub, on the other hand, depends only on the compilationand operating systems. As described below, cdb has almost no dependencies on thetarget architecture.
The nub is simply a conduit for opaque data, which reduces the tension between asmall nub interface and one that’s rich enough to support practical debuggers. Theproducers and consumers of this data must agree on its format and interpretation.Symbol-table data is the prime example. The nub interface permits a debugger to readand write ‘address spaces’ associated with the target; the debugger and the compilationsystem must collaborate to dedicate one of these address spaces to the symbol table
A MACHINE-INDEPENDENT DEBUGGER 1279
target
debugger
nub
Figure 1. A debugger design based on a nub.
and agree on a format. The important consequence of this design is that it forcesmodularity on debuggers, but this approach also makes the nub interface languageindependent.
Some concrete decisions must be made, so the nub interface specifies types thatdescribe source-code coordinates and a target state:
typedef struct {char file[32];unsigned short x, y;
} Nub_coord_T;
typedef struct {char name[32];Nub_coord_T src;void *fp;void *context;
} Nub_state_T;
typedef void (*Nub_callback_T)(Nub_state_T state);
A Nub_coord_T describes a location in the source code — a source ‘coordinate’ — bygiving its file name, line number (y), and character number in that line (x). Source co-ordinates identify where breakpoints may be set. Many debuggers permit breakpointsonly on lines. Carrying around both line numbers and character positions in coordi-nates supports the relatively rare debugger, like ldb and cdb, that permits breakpointsat any expression and at other strategic locations, such as block entries and exits.
A Nub_state_T describes the state of a stopped single-threaded target, that is, atarget whose execution is suspended because it’s being examined by the debugger.The target is stopped in the function given by the name field at the source coordinategiven by src. The fp and context fields are opaque pointers that describe the func-tion’s stack frame and the symbol table at the coordinate src. The nub passes thesedata uninterpreted to the debugger, which must coordinate their meanings with thecompilation system.
1280 D. R. HANSON AND M. RAGHAVACHARI
Nub_callback_T is a function pointer type that describes the callback functions inthe debugger that are called by the nub in response to breakpoints and interrupts.These callbacks are passed to the functions
void _Nub_init(Nub_callback_T startup, Nub_callback_T fault);Nub_callback_T _Nub_set (Nub_coord_T src, Nub_callback_T onbreak);Nub_callback_T _Nub_remove(Nub_coord_T src);
_Nub_init initializes the nub and establishes a start-up function and a fault handler.The nub arranges to call startup after the target has been loaded but before it beginsexecution. All the values in the Nub_state_T passed to startup are null, except forcontext, which represents the symbol table before execution, which usually holds justglobals and types. Debuggers usually permit users to explore the target before it beginsexecution in order to, for example, examine initialized data and set breakpoints. Whenstartup returns, the target begins execution.
If a fault occurs in the target, the nub regains control and calls fault, which usuallypermits users to examine the target’s corpse before it’s discarded. When fault returns,the target terminates._Nub_set and _Nub_remove set and remove breakpoints. Debuggers must implement
higher level debugging features, like conditional breakpoints, using these lower levelnub functions. _Nub_set sets a breakpoint at the coordinate given by src and arrangesto call the breakpoint handler onbreak the next time execution reaches src. The nubuses the most recently specified handler for all breakpoints. _Nub_set returns theprevious handler, if a breakpoint was already set at src; otherwise, it returns null._Nub_set also returns null when src does not describe a valid source coordinate._Nub_remove removes the breakpoint set at src and returns the handler; if there isno breakpoint at src or src does not describe a valid source coordinate, _Nub_removereturns null.
As cdb illustrates below, debuggers often work with incomplete source coordinates,i.e., _Nub_coord_Ts in which name is the null string or x or y is zero. The nub function
extern void _Nub_src(Nub_coord_T src,void apply(int i, Nub_coord_T *src, void *cl), void *cl);
accepts an incomplete coordinate, src, and calls apply for each coordinate in thetarget that ‘matches’ src. Coordinates x and y match if their nonzero fields are equal.For example, the coordinate {"", 0, 17}matches every coordinate for line 17 in everymodule of the target. For each matching coordinate, apply is called with the index ofthe coordinate, a pointer to a _Nub_coord_T for the coordinate, and cl, which is aclient-specific pointer value.
Breakpoint and fault handlers are called with a _Nub_state_T for the function inwhich the breakpoint or fault occurred. They can call
int _Nub_frame(int n, Nub_state_T *state);
to traverse the target’s stack. n names a stack frame, where the top frame at the topof the stack is frame 0 and increasing numbers identify older frames. If n specifies avalid frame, _Nub_frame sets *state to a _Nub_state_T for that frame and returnsn. If n specifies a nonexistent frame, _Nub_frame sets *state to a _Nub_state_T forthe frame at the bottom of the stack and returns that frame number. If there is nostack, _Nub_frame returns −1.
A MACHINE-INDEPENDENT DEBUGGER 1281
Debuggers call
int _Nub_fetch(int space, void *address, void *buf, int nbytes);int _Nub_store(int space, void *address, void *buf, int nbytes);
to read and write the target’s address spaces. Both functions accept an integral addressspace identifier, an address in that space, a pointer to a buffer, and a byte count._Nub_fetch copies nbytes from successive locations beginning at address into bufand returns the number of bytes actually read. _Nub_store copies nbytes from bufinto successive locations at address and returns the number of bytes actually written.The return value is different than nbytes when, collectively, space, address, andnbytes specify inaccessible locations.
A target usually has numerous address spaces, but the purpose of each addressspace is specific to a compiler, nub, and debugger, and hence operating system. Thesespaces need not correspond to actual locations in the target, or even to anything loadedwith target. In Unix environments, for example, targets have spaces for code, data,symbols, types, and strings, and only the first two spaces are in the target’s addressspace; the others are in its executable file. In cdb, all these address spaces are loadedwith the target, but the address space model permits the debugger to be unaware ofthis cdb-specific implementation strategy.
Segments, register sets, and stacks are examples of plausible address spaces in otherenvironments. The form of the nub calls is independent of the environment, but thedata passed back and forth is not, because it depends on the host machine, operatingsystem, and compilation tools. The only constraint imposed by this model is that thesespaces be accessed by read and write operations.
A particular implementation of the nub interface might serve more than one com-pilation system or more than one debugger. For example, a Unix nub implementationthat understood Unix-style executable files and symbol-table formats could supporttraditional source-level debuggers, like gdb1 and dbx,6 and high-level debuggers, likeDuel.7 But different debugger design goals would often yield different nub implemen-tations, even on the same architecture. The sections that follow describe cdb and itsnub, which were designed to be as machine independent as possible.
EXAMPLE: CDB
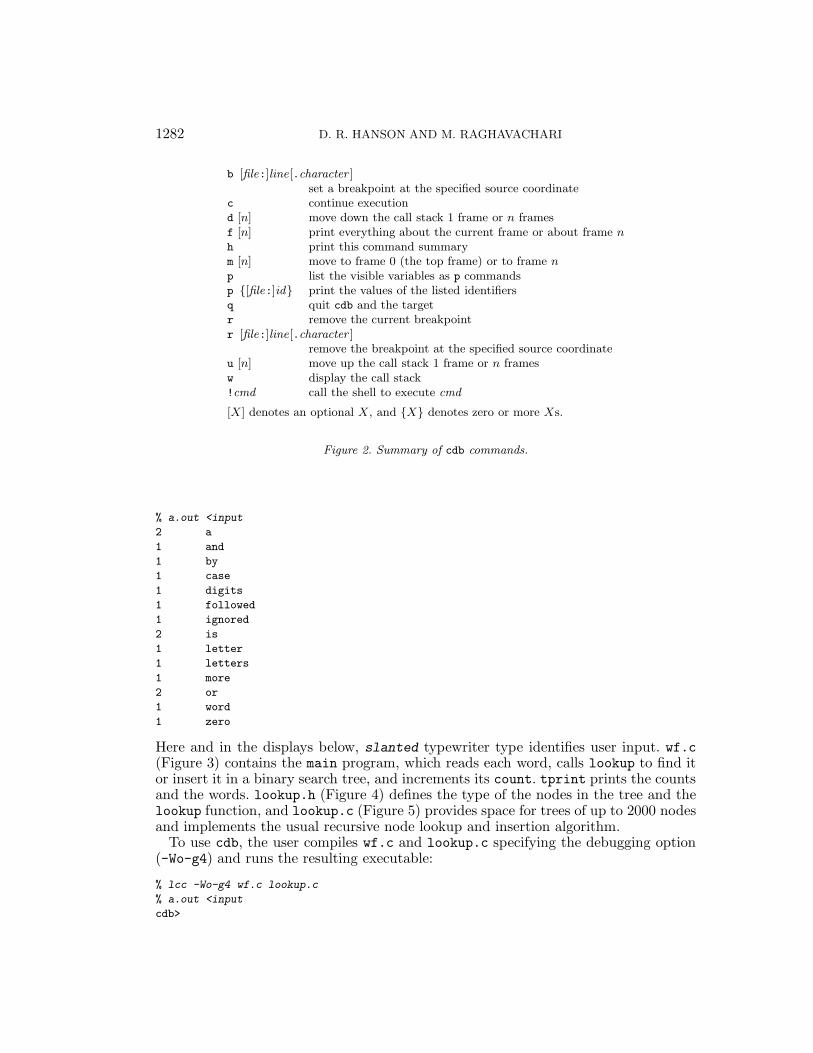
cdb is a simple source-level debugger for C programs compiled by lcc.5 Its command-line interpreter accepts a small set of one-letter commands that set and remove break-points, display the values of variables, and walk up and down the runtime stack.Figure 2 summarizes the cdb commands. cdb’s command repertoire is intentionallyfrugal. The user-interface component is the one least affected by the nub, so a sim-ple, command-line interface suffices here; a programmable, graphical user interface isunder construction.
Figures 3, 4, and 5 list the source code used as a running example in this sectionand in the next one. The code implements a word-frequency program, which prints, inalphabetic order, each word in the standard input and the number of times it occurs.A word is a letter followed by zero or more letters or digits, and case is ignored. Forexample, if the file input contains the text of the previous sentence:
1282 D. R. HANSON AND M. RAGHAVACHARI
b [file:]line[.character ]set a breakpoint at the specified source coordinate
c continue executiond [n] move down the call stack 1 frame or n framesf [n] print everything about the current frame or about frame nh print this command summarym [n] move to frame 0 (the top frame) or to frame np list the visible variables as p commandsp {[file:]id} print the values of the listed identifiersq quit cdb and the targetr remove the current breakpointr [file:]line[.character ]
remove the breakpoint at the specified source coordinateu [n] move up the call stack 1 frame or n framesw display the call stack!cmd call the shell to execute cmd
[X] denotes an optional X, and {X} denotes zero or more Xs.
Figure 2. Summary of cdb commands.
% a.out <input2 a1 and1 by1 case1 digits1 followed1 ignored2 is1 letter1 letters1 more2 or1 word1 zero
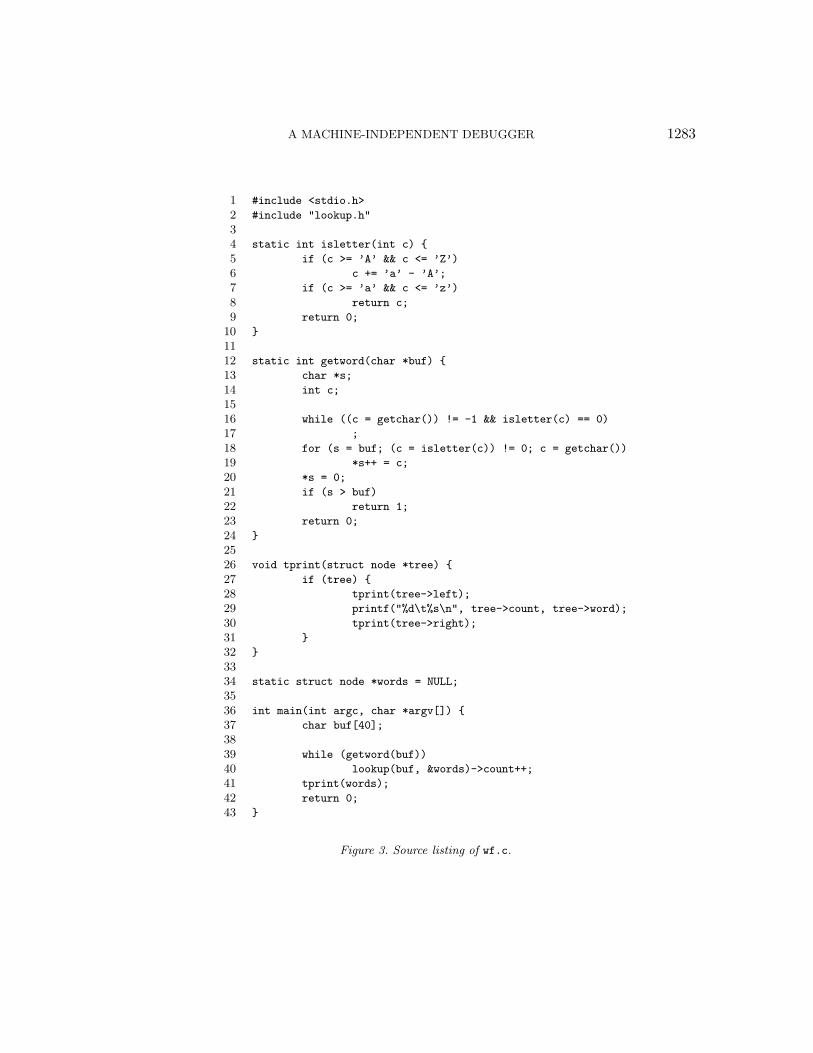
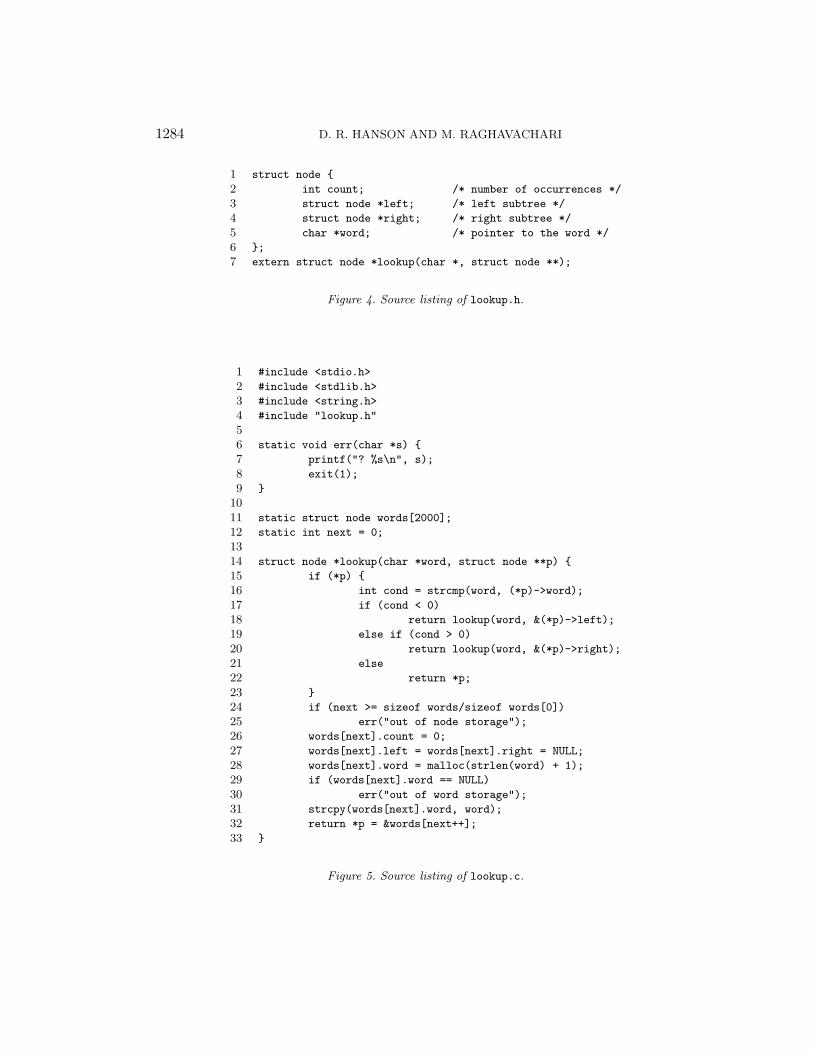
Here and in the displays below, slanted typewriter type identifies user input. wf.c(Figure 3) contains the main program, which reads each word, calls lookup to find itor insert it in a binary search tree, and increments its count. tprint prints the countsand the words. lookup.h (Figure 4) defines the type of the nodes in the tree and thelookup function, and lookup.c (Figure 5) provides space for trees of up to 2000 nodesand implements the usual recursive node lookup and insertion algorithm.
To use cdb, the user compiles wf.c and lookup.c specifying the debugging option(-Wo-g4) and runs the resulting executable:
% lcc -Wo-g4 wf.c lookup.c% a.out <inputcdb>
A MACHINE-INDEPENDENT DEBUGGER 1283
1 #include <stdio.h>2 #include "lookup.h"34 static int isletter(int c) {5 if (c >= ’A’ && c <= ’Z’)6 c += ’a’ - ’A’;7 if (c >= ’a’ && c <= ’z’)8 return c;9 return 0;
10 }1112 static int getword(char *buf) {13 char *s;14 int c;1516 while ((c = getchar()) != -1 && isletter(c) == 0)17 ;18 for (s = buf; (c = isletter(c)) != 0; c = getchar())19 *s++ = c;20 *s = 0;21 if (s > buf)22 return 1;23 return 0;24 }2526 void tprint(struct node *tree) {27 if (tree) {28 tprint(tree->left);29 printf("%d\t%s\n", tree->count, tree->word);30 tprint(tree->right);31 }32 }3334 static struct node *words = NULL;3536 int main(int argc, char *argv[]) {37 char buf[40];3839 while (getword(buf))40 lookup(buf, &words)->count++;41 tprint(words);42 return 0;43 }
Figure 3. Source listing of wf.c.
1284 D. R. HANSON AND M. RAGHAVACHARI
1 struct node {2 int count; /* number of occurrences */3 struct node *left; /* left subtree */4 struct node *right; /* right subtree */5 char *word; /* pointer to the word */6 };7 extern struct node *lookup(char *, struct node **);
Figure 4. Source listing of lookup.h.
1 #include <stdio.h>2 #include <stdlib.h>3 #include <string.h>4 #include "lookup.h"56 static void err(char *s) {7 printf("? %s\n", s);8 exit(1);9 }
1011 static struct node words[2000];12 static int next = 0;1314 struct node *lookup(char *word, struct node **p) {15 if (*p) {16 int cond = strcmp(word, (*p)->word);17 if (cond < 0)18 return lookup(word, &(*p)->left);19 else if (cond > 0)20 return lookup(word, &(*p)->right);21 else22 return *p;23 }24 if (next >= sizeof words/sizeof words[0])25 err("out of node storage");26 words[next].count = 0;27 words[next].left = words[next].right = NULL;28 words[next].word = malloc(strlen(word) + 1);29 if (words[next].word == NULL)30 err("out of word storage");31 strcpy(words[next].word, word);32 return *p = &words[next++];33 }
Figure 5. Source listing of lookup.c.
A MACHINE-INDEPENDENT DEBUGGER 1285
As detailed in the next section, the -Wo-g4 option causes lcc to emit cdb-style symboltables and to load cdb’s start-up code and nub with the target. The start-up codepasses control to cdb as if there was a breakpoint at the beginning of the target, andcdb prompts the user for debugger commands. At this point, the user can explore thetarget, set breakpoints, etc., and can start the target with a c command.cdb can set breakpoints on ‘stopping points’,3 which include individual expressions
and the entry and exit points of compound statements. For example, there are sevenstopping points in lines 16–19 of Figure 3’s wf.c as illustrated by the diamonds (♦)below.
16 while (♦(c = getchar()) != -1 && ♦isletter(c) == 0)17 ♦;18 for (♦s = buf; ♦(c = isletter(c)) != 0; ♦c = getchar())19 ♦*s++ = c;
cdb’s b and r commands accept incomplete source coordinates and use _Nub_src toenumerate the set of coordinates that match the one specified. If there’s only one suchmatch, the command accepts that one. If several coordinates match, the commandlists renditions of itself for the matching coordinates and instructions for continuing, sousers rarely have to type more than a line number, and never have to count characters.For example,
cdb> b 18Sweep and send one of the following commands:b wf.c:18.7b wf.c:18.40b wf.c:18.16b lookup.c:18.11
lists the three stopping points in wf.c’s line 18 and the one in lookup.c’s line 18. Theuser can use the mouse to sweep and send the desired commands. A more sophisticatedGUI might display the source code and flash possible breakpoints as the mouse gotnear them, and the user could set or remove a breakpoint by simply clicking on thedesired stopping point.
Once the user is done exploring the target, the c command continues its execution:
cdb> b 17Sweep and send one of the following commands:b wf.c:17.3b lookup.c:17.7cdb> b lookup.c:17.7To remove this breakpoint, sweep and send the command:r lookup.c:17.7cdb> cstopped in lookup at lookup.c:17.70 lookup(word=(char *)0Xeffffac0 "word",p=(struct node **)0X81a8)cdb>
Here, a breakpoint is set on lookup.c’s line 17, which is just before the lookup func-tion decides which recursive call to make. As shown, when a breakpoint is set, the bcommand emits the appropriate r command for removing the breakpoint.
1286 D. R. HANSON AND M. RAGHAVACHARI
When execution hits a breakpoint, control is passed back to cdb, which announcesthe breakpoint and prints a synopsis of the current function call in the target. Asillustrated above, cdb prints values in source-level terms whenever possible; for ex-ample, word is a pointer to a string, so both the pointer value (an address) and thenull-terminated string are printed. p’s value is a pointer to a pointer to a struct node,and only its value can be easily printed.
When a breakpoint occurs, cdb establishes a focus, which denotes a particular stop-ping point in a specific instance of a particular function. cdb’s commands that listvariables and values use the focus to resolve names. For example, a bare p commandlists the variables visible at the focus. For the breakpoint above, these include lookup’slocals, its arguments, and all the globals in both lookup.c and wf.c:
cdb> pp condp pp wordp lookup.c:nextp lookup.c:wordsp wf.c:words
The visible variables are printed as p commands so that user can use the mouse tosweep and send the desired commands.
File-scope static variables pose a dilemma. When lookup.c is compiled, its nextand words are visible only in the function lookup. They are not visible in err or in anyfunction in wf.c. But debugging is fundamentally different than compiling, becausethe former focuses on exploring the entire target, not compiling its components. Theuser might well stop the target in lookup for the express purpose of checking theevolution of the tree rooted at wf.c’s words. The user must be able to specify file-scope statics defined in any module, and must be able to distinguish between thosewith identical names, like words, which is defined in both lookup.c and wf.c.cdb resolves this dilemma by permitting file names to prefix file-scope statics, and
a bare p command prints them that way, too, as illustrated above. Thus,
cdb> p lookup.c:wordslookup.c:words={[0]={count=1,left=(struct node *)0X0,right=(struct node *)0X0,
word=(char *)0X149a0 "a"}[1]={count=0,left=(struct node *)0X0,right=(struct node *)0X0,word=(char *)0X0}[1999]={count=0,left=(struct node *)0X0,right=(struct node *)0X0,word=(char *)0X0}}
prints lookup.c’s words.This example also shows how cdb prints arrays and structures. It uses type infor-
mation to print the details of structured values, when possible. For arrays whose sizeis known, it prints the first and last elements and all the elements in between, exceptthat it omits the second and succeeding elements of a run of elements with equal val-ues, which is illustrated by the omission of elements 2–1998 in the display above. Forstructures and unions, it prints the names and values of the fields.
Continuing the target six times reaches a recursive call to lookup for the word‘letter’:
A MACHINE-INDEPENDENT DEBUGGER 1287
cdb> cstopped in lookup at lookup.c:17.70 lookup(word=(char *)0Xf7fffac0 "is",p=(struct node **)0X81a8)cdb> cstopped in lookup at lookup.c:17.70 lookup(word=(char *)0Xf7fffac0 "is",p=(struct node **)0X8b84)cdb> cstopped in lookup at lookup.c:17.70 lookup(word=(char *)0Xf7fffac0 "a",p=(struct node **)0X81a8)cdb> cstopped in lookup at lookup.c:17.70 lookup(word=(char *)0Xf7fffac0 "letter",p=(struct node **)0X81a8)cdb> cstopped in lookup at lookup.c:17.70 lookup(word=(char *)0Xf7fffac0 "letter",p=(struct node **)0X8b84)cdb> cstopped in lookup at lookup.c:17.70 lookup(word=(char *)0Xf7fffac0 "letter",p=(struct node **)0X8b90)
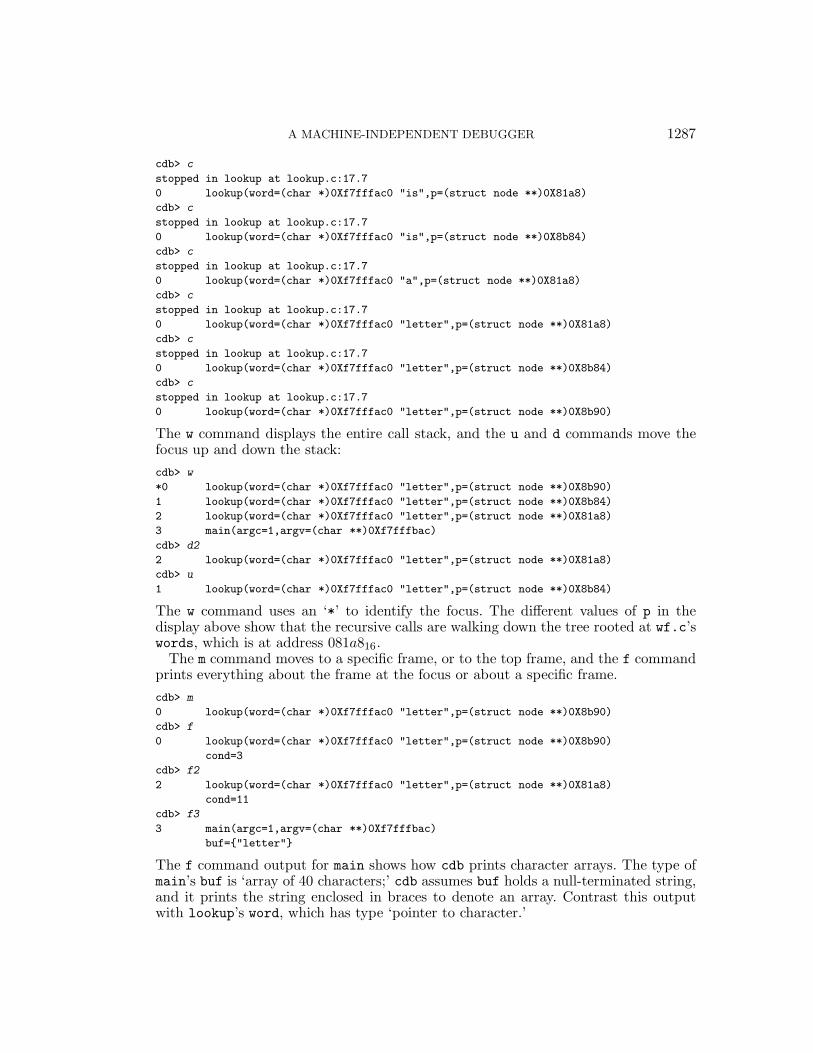
The w command displays the entire call stack, and the u and d commands move thefocus up and down the stack:cdb> w*0 lookup(word=(char *)0Xf7fffac0 "letter",p=(struct node **)0X8b90)1 lookup(word=(char *)0Xf7fffac0 "letter",p=(struct node **)0X8b84)2 lookup(word=(char *)0Xf7fffac0 "letter",p=(struct node **)0X81a8)3 main(argc=1,argv=(char **)0Xf7fffbac)cdb> d22 lookup(word=(char *)0Xf7fffac0 "letter",p=(struct node **)0X81a8)cdb> u1 lookup(word=(char *)0Xf7fffac0 "letter",p=(struct node **)0X8b84)
The w command uses an ‘*’ to identify the focus. The different values of p in thedisplay above show that the recursive calls are walking down the tree rooted at wf.c’swords, which is at address 081a816.
The m command moves to a specific frame, or to the top frame, and the f commandprints everything about the frame at the focus or about a specific frame.cdb> m0 lookup(word=(char *)0Xf7fffac0 "letter",p=(struct node **)0X8b90)cdb> f0 lookup(word=(char *)0Xf7fffac0 "letter",p=(struct node **)0X8b90)
cond=3cdb> f22 lookup(word=(char *)0Xf7fffac0 "letter",p=(struct node **)0X81a8)
cond=11cdb> f33 main(argc=1,argv=(char **)0Xf7fffbac)
buf={"letter"}
The f command output for main shows how cdb prints character arrays. The type ofmain’s buf is ‘array of 40 characters;’ cdb assumes buf holds a null-terminated string,and it prints the string enclosed in braces to denote an array. Contrast this outputwith lookup’s word, which has type ‘pointer to character.’
1288 D. R. HANSON AND M. RAGHAVACHARI
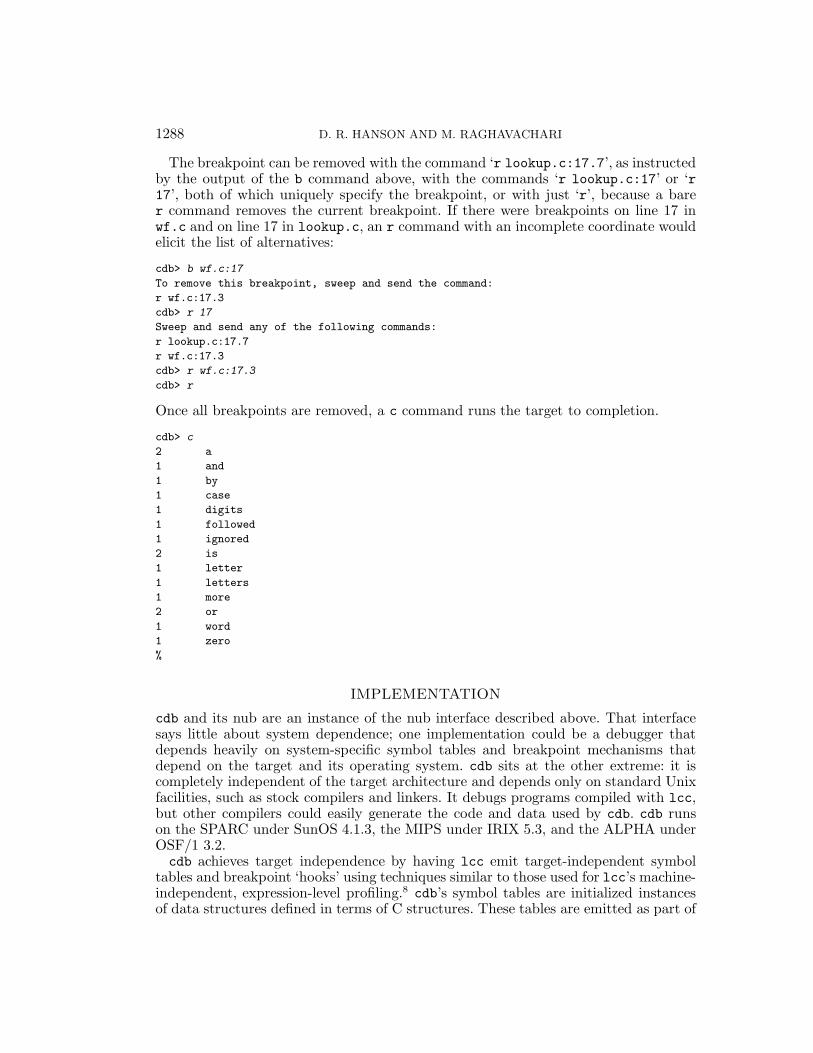
The breakpoint can be removed with the command ‘r lookup.c:17.7’, as instructedby the output of the b command above, with the commands ‘r lookup.c:17’ or ‘r17’, both of which uniquely specify the breakpoint, or with just ‘r’, because a barer command removes the current breakpoint. If there were breakpoints on line 17 inwf.c and on line 17 in lookup.c, an r command with an incomplete coordinate wouldelicit the list of alternatives:
cdb> b wf.c:17To remove this breakpoint, sweep and send the command:r wf.c:17.3cdb> r 17Sweep and send any of the following commands:r lookup.c:17.7r wf.c:17.3cdb> r wf.c:17.3cdb> r
Once all breakpoints are removed, a c command runs the target to completion.
cdb> c2 a1 and1 by1 case1 digits1 followed1 ignored2 is1 letter1 letters1 more2 or1 word1 zero%
IMPLEMENTATION
cdb and its nub are an instance of the nub interface described above. That interfacesays little about system dependence; one implementation could be a debugger thatdepends heavily on system-specific symbol tables and breakpoint mechanisms thatdepend on the target and its operating system. cdb sits at the other extreme: it iscompletely independent of the target architecture and depends only on standard Unixfacilities, such as stock compilers and linkers. It debugs programs compiled with lcc,but other compilers could easily generate the code and data used by cdb. cdb runson the SPARC under SunOS 4.1.3, the MIPS under IRIX 5.3, and the ALPHA underOSF/1 3.2.cdb achieves target independence by having lcc emit target-independent symbol
tables and breakpoint ‘hooks’ using techniques similar to those used for lcc’s machine-independent, expression-level profiling.8 cdb’s symbol tables are initialized instancesof data structures defined in terms of C structures. These tables are emitted as part of
A MACHINE-INDEPENDENT DEBUGGER 1289
the target, just like any other initialized data. Breakpoints are supported by emittingcode at each stopping point at compile time. During execution, this code tests ifa breakpoint is set at the stopping point. The initialized data structures and thebreakpoint code are target independent, and they are generated by additions to lcc’sfront end. Technically, the phrase ‘lcc emits . . .,’ which appears often below, shouldbe the more accurate but verbose ‘the lcc front end builds intermediate code fromwhich its back end emits . . .’
Injecting debugging code and data at the intermediate-code level is similar in spiritto injecting debugging code at the source level. Surprisingly, intermediate code is ofteneasier to generate, because it avoids issues of syntax, name spaces, and temporaries,for example. More important, it also avoids issues of undefined and implementation-defined behaviors, which riddle the ANSI/ISO standard for C. The compiler must makechoices when it enters these murky semantic regions anyway, and the intermediate codereveals its decisions, which the source code hides.
Instrumenting intermediate code or its equivalent to support debugging is commonin interpreted environments9 and for higher-level languages. Heymann10 describes a100% portable debugger for a high-level language that is compiled into C. In thiscase, C code to support runtime debugging is injected during compilation. The issuesdescribed above don’t intrude here, because the compiler controls both the debuggingcode and the C code generated for the source high-level program. Similar techniquescould be used in Modula-311 compilers that emit C.smld12 is a machine-independent debugger for Standard ML,13 and it’s implemented
as part of the Standard ML of New Jersey compiler.14 This compiler uses a treeintermediate representation based on the lambda calculus, and smld adds debugginghooks by editing these trees in one or more of SML-NJ’s many passes. This approachis particularly appealing for ML, because ML is a ‘safe’ language — a buggy programcannot corrupt itself or the debugging code. Unfortunately, similar assurances cannotapply to C and cdb, because C is not a safe language.
By the measures established by other debuggers, cdb is tiny, even considering thatcdb’s facilities are meager compared with those of other debuggers. Table I lists cdb’scomponents, gives their sizes in nonblank source-code lines, and summarizes theirpurposes. All the C code in Table I is completely target independent. cdbld is a smallshell script that runs before the Unix linker; it ties together the symbol tables fromseparately compiled modules, as described below. In theory, cdbld might have to bereplaced completely for each environment, because it depends on the target’s linkerand related utilities. For all cdb’s current Unix targets, however, only four lines ofcdbld are target dependent.stab.c is the addition to lcc’s front end; it emits the symbol tables, the stopping-
point data, and the breakpoint hooks. Most of stab.c emits data; building interme-diate code for breakpoint hooks and function entries takes fewer than 150 lines. lcc’s‘event hooks’5 are used to inject this code, so stab.c is a separable addition to thefront end.nub.c implements the _Nub_* functions described above. There are two ways to
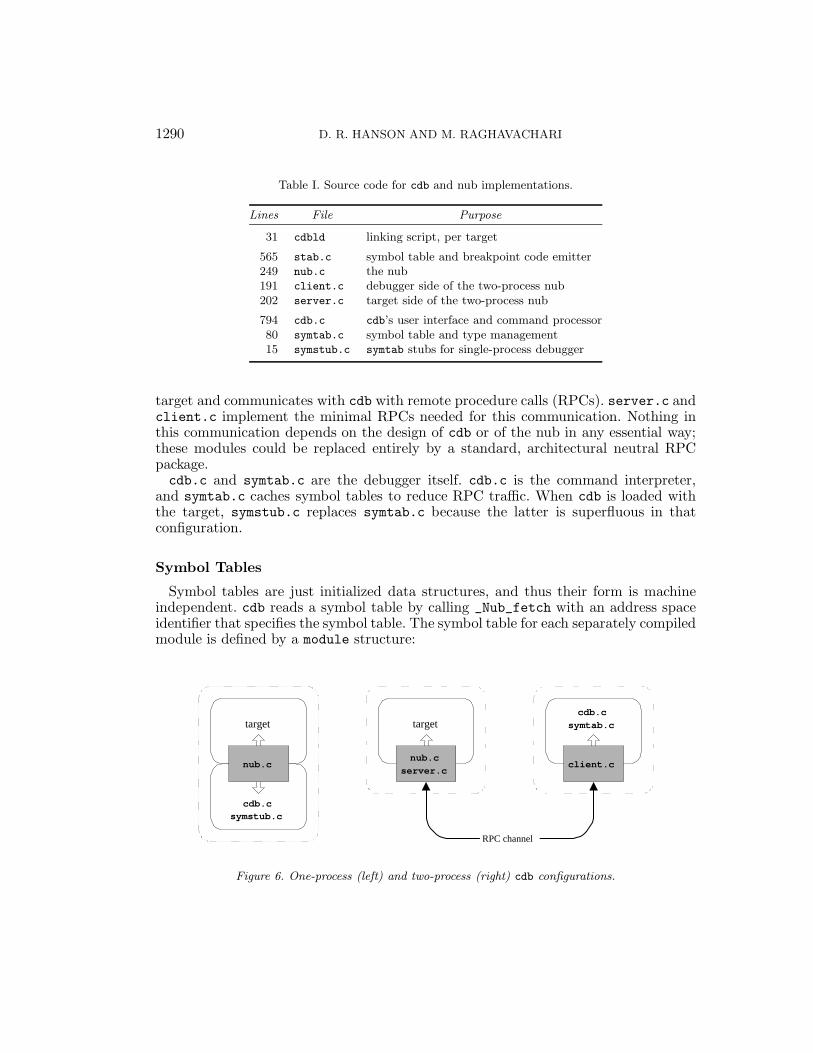
configure cdb, as illustrated in Figure 6. The same nub and cdb code are used in bothconfigurations. cdb can be loaded with the target in a single process, as depicted bythe left diagram in Figure 6. This configuration is particularly useful on systems thatdo not support processes or interprocess communication well. The right diagram inFigure 6 shows cdb’s default, two-process configuration. The nub is loaded with the
1290 D. R. HANSON AND M. RAGHAVACHARI
Table I. Source code for cdb and nub implementations.
Lines File Purpose
31 cdbld linking script, per target
565 stab.c symbol table and breakpoint code emitter249 nub.c the nub191 client.c debugger side of the two-process nub202 server.c target side of the two-process nub
794 cdb.c cdb’s user interface and command processor80 symtab.c symbol table and type management15 symstub.c symtab stubs for single-process debugger
target and communicates with cdb with remote procedure calls (RPCs). server.c andclient.c implement the minimal RPCs needed for this communication. Nothing inthis communication depends on the design of cdb or of the nub in any essential way;these modules could be replaced entirely by a standard, architectural neutral RPCpackage.cdb.c and symtab.c are the debugger itself. cdb.c is the command interpreter,
and symtab.c caches symbol tables to reduce RPC traffic. When cdb is loaded withthe target, symstub.c replaces symtab.c because the latter is superfluous in thatconfiguration.
Symbol Tables
Symbol tables are just initialized data structures, and thus their form is machineindependent. cdb reads a symbol table by calling _Nub_fetch with an address spaceidentifier that specifies the symbol table. The symbol table for each separately compiledmodule is defined by a module structure:
target
cdb.csymstub.c
nub.c
target
nub.c
server.c
cdb.c
symtab.c
client.c
RPC channel
Figure 6. One-process (left) and two-process (right) cdb configurations.
A MACHINE-INDEPENDENT DEBUGGER 1291
struct module {union scoordinate *coordinates;char **files;struct ssymbol *link;
};
coordinates points to an array of scoordinate structures, one for each stoppingpoint in the module, files points to a null-terminated array of pointers to strings thatname the source files comprising the module, and link points to a dummy symbol-table entry called the link, which is used to connect the symbol tables from separatelycompiled modules that make up the program. scoordinate structures, which give thestopping points in the module, are described below.
Symbol-table entries are emitted for each identifier in the module as initializedinstances of symbol structures:
struct ssymbol {int offset;void *address;char *name;char *file;unsigned char scope;unsigned char sclass;struct stype *type;struct ssymbol *uplink;
};
The values of the name, file, scope, and sclass fields give the identifier’s name,the name of the file in which the identifier is defined, and small integers that denoteits scope and storage class. For a local or a parameter, the offset field holds itsmachine-independent frame offset; for a global or a static, the address field holds itsaddress.
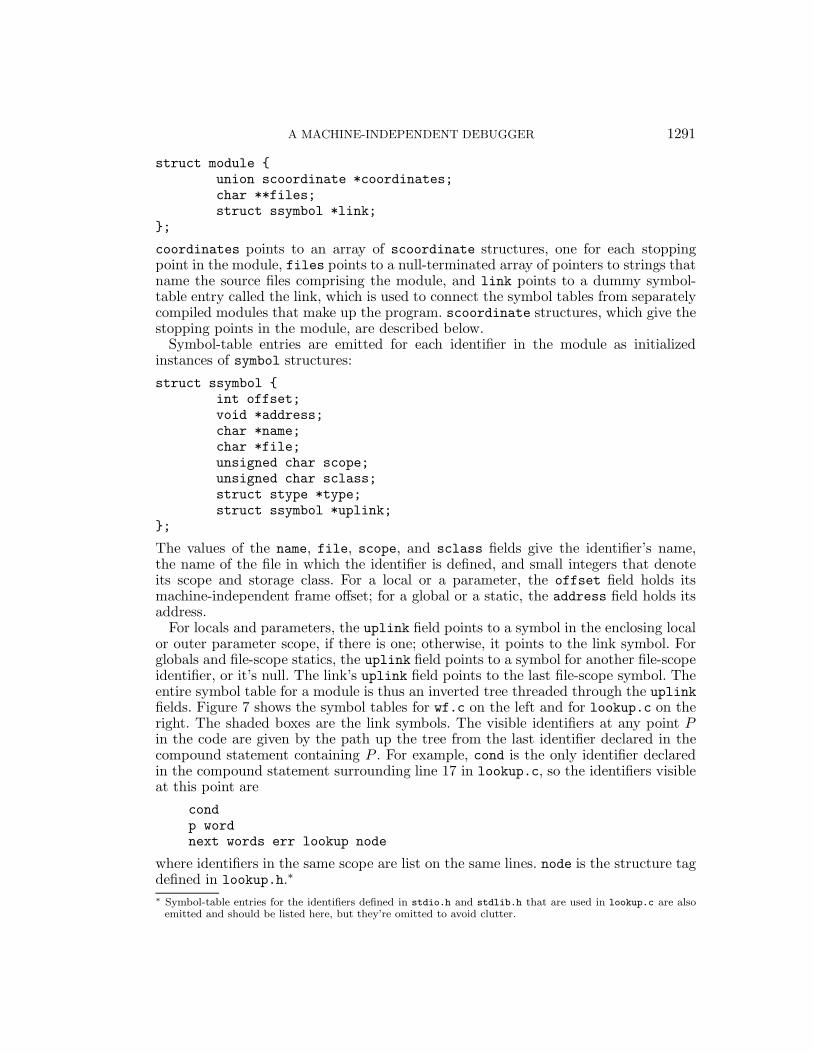
For locals and parameters, the uplink field points to a symbol in the enclosing localor outer parameter scope, if there is one; otherwise, it points to the link symbol. Forglobals and file-scope statics, the uplink field points to a symbol for another file-scopeidentifier, or it’s null. The link’s uplink field points to the last file-scope symbol. Theentire symbol table for a module is thus an inverted tree threaded through the uplinkfields. Figure 7 shows the symbol tables for wf.c on the left and for lookup.c on theright. The shaded boxes are the link symbols. The visible identifiers at any point Pin the code are given by the path up the tree from the last identifier declared in thecompound statement containing P . For example, cond is the only identifier declaredin the compound statement surrounding line 17 in lookup.c, so the identifiers visibleat this point are
condp wordnext words err lookup node
where identifiers in the same scope are list on the same lines. node is the structure tagdefined in lookup.h.∗
∗ Symbol-table entries for the identifiers defined in stdio.h and stdlib.h that are used in lookup.c are alsoemitted and should be listed here, but they’re omitted to avoid clutter.
1292 D. R. HANSON AND M. RAGHAVACHARI
s word p
cond
next words err
nodelookup
c buf tree argc argv
bufs c
words main tprint getword
nodelookupisletter
Figure 7. Symbol tables for wf.c (left) and lookup.c (right).
The symbol tables shown in Figure 7 are for separately compiled modules. Whenmodules are linked to form a program, the file-scope symbols from all modules mustbe combined into a single list that’s visible from every function in every module. Thislist is threaded through the uplink fields so that the symbol-table search can proceedas described above. The purpose of the link symbols shown in Figure 7 is to pointto this list. When several files are linked for debugging with cdb, cdbld (the linkingscript listed in Table I) generates an initialized array of pointers to module structures,one for each file, terminated with a null pointer. For example, cdbld generates
extern struct module __module__V309159f22d5b;extern struct module __module__V309159f12d59;struct module *_Nub_modules[] = {
&__module__V309159f22d5b,&__module__V309159f12d59,0
};
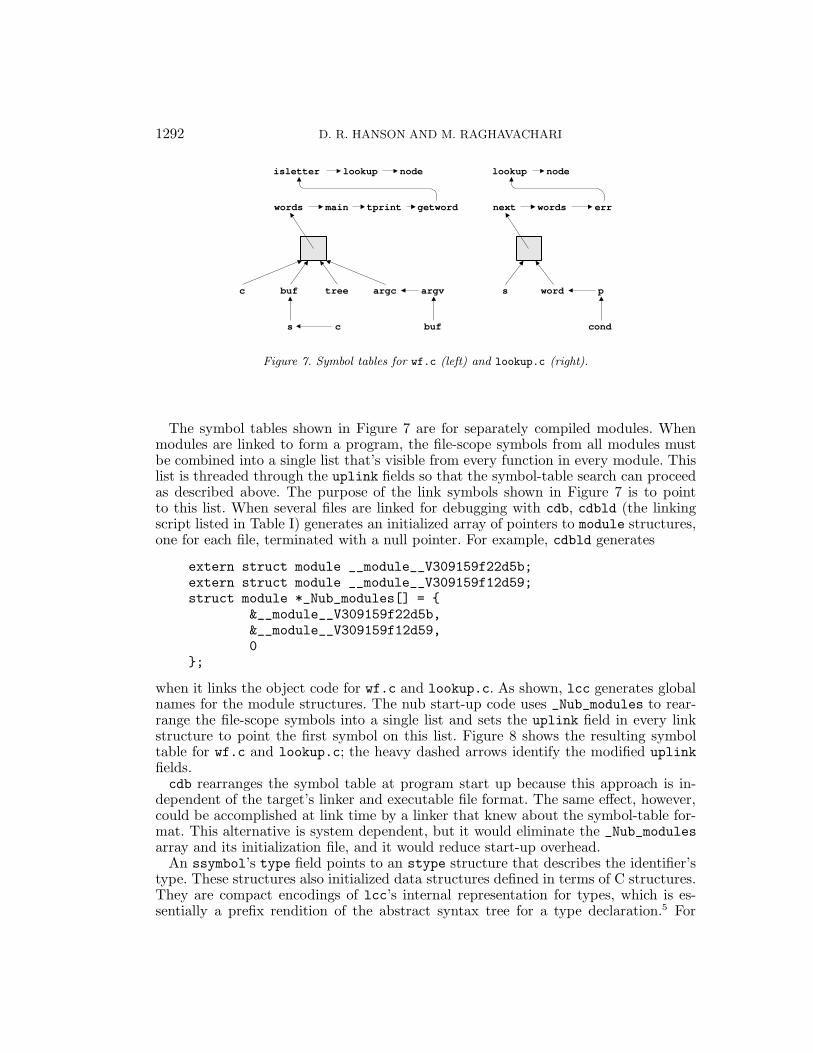
when it links the object code for wf.c and lookup.c. As shown, lcc generates globalnames for the module structures. The nub start-up code uses _Nub_modules to rear-range the file-scope symbols into a single list and sets the uplink field in every linkstructure to point the first symbol on this list. Figure 8 shows the resulting symboltable for wf.c and lookup.c; the heavy dashed arrows identify the modified uplinkfields.cdb rearranges the symbol table at program start up because this approach is in-
dependent of the target’s linker and executable file format. The same effect, however,could be accomplished at link time by a linker that knew about the symbol-table for-mat. This alternative is system dependent, but it would eliminate the _Nub_modulesarray and its initialization file, and it would reduce start-up overhead.
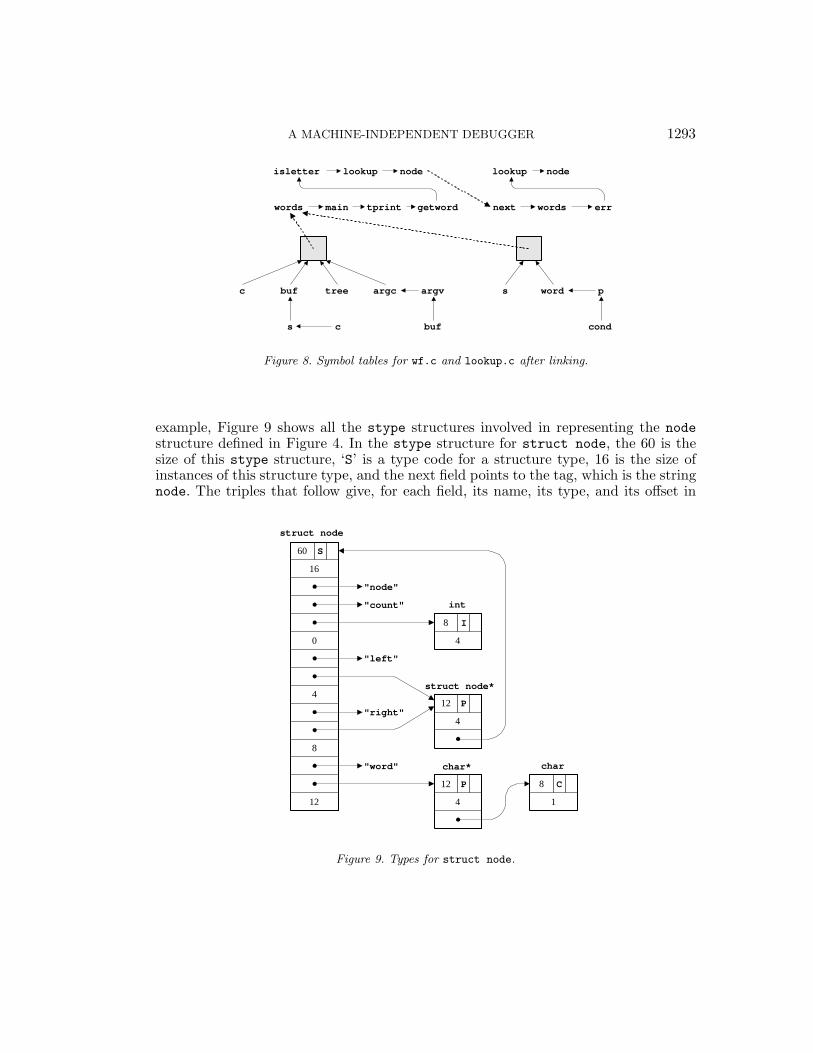
An ssymbol’s type field points to an stype structure that describes the identifier’stype. These structures also initialized data structures defined in terms of C structures.They are compact encodings of lcc’s internal representation for types, which is es-sentially a prefix rendition of the abstract syntax tree for a type declaration.5 For
A MACHINE-INDEPENDENT DEBUGGER 1293
c buf tree argc argv
bufs c
words main tprint getword
nodelookupisletter
s word p
cond
next words err
nodelookup
Figure 8. Symbol tables for wf.c and lookup.c after linking.
example, Figure 9 shows all the stype structures involved in representing the nodestructure defined in Figure 4. In the stype structure for struct node, the 60 is thesize of this stype structure, ‘S’ is a type code for a structure type, 16 is the size ofinstances of this structure type, and the next field points to the tag, which is the stringnode. The triples that follow give, for each field, its name, its type, and its offset in
"count"
0
"left"
4
"right"
8
"word"
12
16
"node"
60 S
4
8 I
4
12 P
4
12 P
1
8 C
struct node
int
struct node*
char* char
Figure 9. Types for struct node.
1294 D. R. HANSON AND M. RAGHAVACHARI
bytes.∗ The other stype structures have similar interpretations.cdb traverses stype structures as it prints values. The type codes determine how a
value is printed and how it should be traversed, if it’s an aggregate type or a pointertype. cdb follows pointers for some noncircular types; for example, it prints the pointervalue and the null-terminated string for a char*, and it prints the pointer and itsinteger referent for an int*.cdb uses _Nub_fetch to fetch values from the target’s address space, including
pointers. _Nub_fetch’s return value identifies invalid addresses; the size of all val-ues is known, so when _Nub_fetch returns fewer bytes than requested, the address isinvalid. Symbol-table entries, types, and strings are all constant data, and they arecached lazily by cdb’s symtab.c module. _Nub_fetch is called only the first time thesedata are referenced; subsequent references use the cached copies.
Breakpoints
The coordinates field of the module structure points to an array of one-wordscoordinate structures:
union scoordinate {int i;struct { unsigned int y:16,x:10,index:5,flag:1; } le;struct { unsigned int flag:1,index:5,x:10,y:16; } be;
};
The le and be fields are used on, respectively, little endians and big endians, andlcc, the nub, and cdb determine the endianness dynamically and use the correct field.The x and y fields hold a character position and line number, and the index fieldholds the index for the file name in the array of file names pointed to by the module’sfiles field. The coordinates arrays are used to implement _Nub_src and the nub’sbreakpoint functions.
The flag field is one when a breakpoint is set at the corresponding stopping point.For each stopping point, lcc emits code that’s equivalent to
(module.coordinates[n].i < 0 && _Nub_bp(n, tail), e)
where n is the index of the stopping point and e is the expression at that stoppingpoint. scoordinate is defined carefully so that the flag field is the sign bit.
tail is a pointer to the ssymbol structure corresponding to the innermost symbolvisible at the stopping point. The tail value supplies the symbol-table context for thatbreakpoint; these are the values stored in the context fields of _Nub_state_Ts. Forexample, the lone stopping point on line 24 in lookup.c is the 14th one in that module,so that line is compiled as if it were written as
if ((__module__V309159f22d5b.coordinates[14].i < 0&& _Nub_bp(14, &L36), next >= sizeof words/sizeof words[0]))
where L36 is the ssymbol structure for lookup’s p.To set a breakpoint, _Nub_set simply lights the flag bit in the appropriate coor-
dinate and saves the address of the debugger’s breakpoint callback function. When∗ For bit fields, the offset encodes the offset and field size in bits.
A MACHINE-INDEPENDENT DEBUGGER 1295
lookupp=0X8690
0
down links
up links
_Nub_tos
lookupp=0X81a8
2lookup
p=0X8b841 main 3
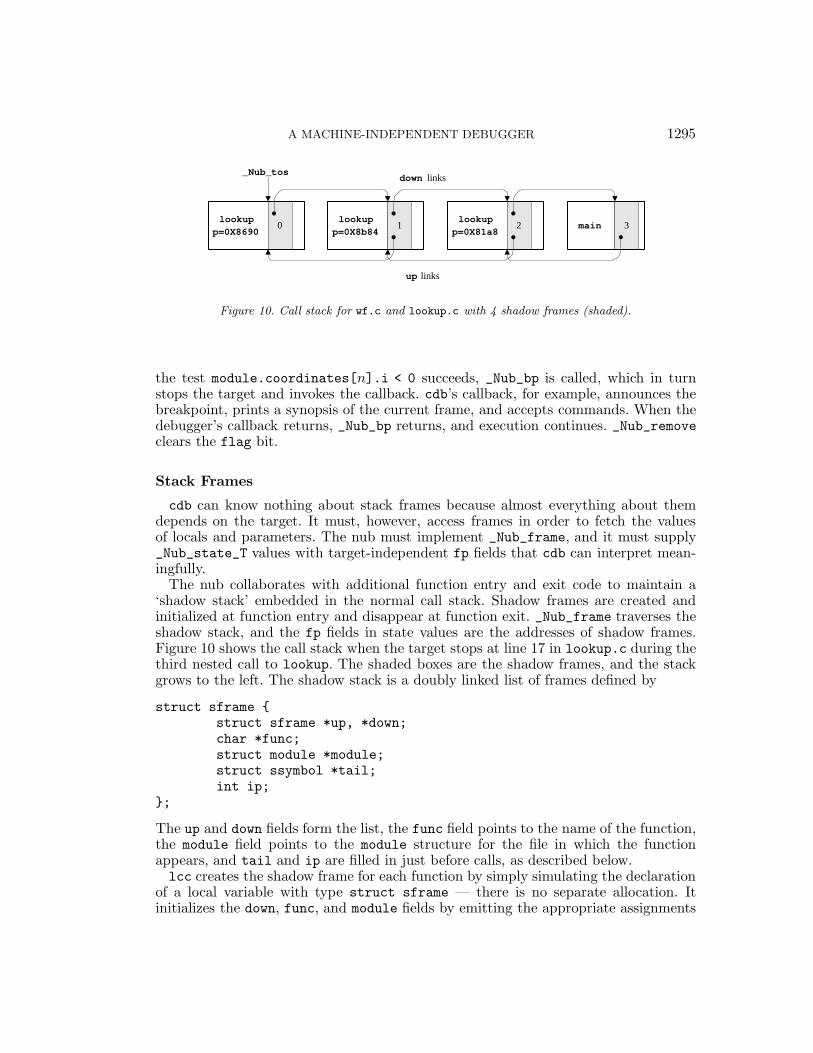
Figure 10. Call stack for wf.c and lookup.c with 4 shadow frames (shaded).
the test module.coordinates[n].i < 0 succeeds, _Nub_bp is called, which in turnstops the target and invokes the callback. cdb’s callback, for example, announces thebreakpoint, prints a synopsis of the current frame, and accepts commands. When thedebugger’s callback returns, _Nub_bp returns, and execution continues. _Nub_removeclears the flag bit.
Stack Frames
cdb can know nothing about stack frames because almost everything about themdepends on the target. It must, however, access frames in order to fetch the valuesof locals and parameters. The nub must implement _Nub_frame, and it must supply_Nub_state_T values with target-independent fp fields that cdb can interpret mean-ingfully.
The nub collaborates with additional function entry and exit code to maintain a‘shadow stack’ embedded in the normal call stack. Shadow frames are created andinitialized at function entry and disappear at function exit. _Nub_frame traverses theshadow stack, and the fp fields in state values are the addresses of shadow frames.Figure 10 shows the call stack when the target stops at line 17 in lookup.c during thethird nested call to lookup. The shaded boxes are the shadow frames, and the stackgrows to the left. The shadow stack is a doubly linked list of frames defined by
struct sframe {struct sframe *up, *down;char *func;struct module *module;struct ssymbol *tail;int ip;
};
The up and down fields form the list, the func field points to the name of the function,the module field points to the module structure for the file in which the functionappears, and tail and ip are filled in just before calls, as described below.lcc creates the shadow frame for each function by simply simulating the declaration
of a local variable with type struct sframe — there is no separate allocation. Itinitializes the down, func, and module fields by emitting the appropriate assignments
1296 D. R. HANSON AND M. RAGHAVACHARI
at function entry, and there’s nothing to do at function exit. For example, it emits thefollowing assignments at the entry to lookup; tos is the generated local.
struct sframe tos;tos.down = _Nub_tos;tos.func = "lookup";tos.module = &__module__V309159f22d5b;_Nub_tos = &tos;(ssymbol structure for p).offset = (char*)&p - (char *)&tos;(ssymbol structure for word).offset = (char*)word - (char *)&tos;
The last two assignments set the offset fields in the ssymbols for p and word to thenumber of bytes between the shadow frame and each variable. cdb does the inversecomputation to compute the addresses for locals and parameters, so the relative loca-tions of the variables and their shadow frame don’t matter. Indeed, it doesn’t matter tocdb whether or not this computation actually yields an address, because cdb uses theresult only to pass to _Nub_fetch. Similar assignments are emitted at the beginningof each nested compound statement, when necessary.
Computing these offsets at function entry illustrates the measures that must be takenin order to be target independent, even when a target-dependent approach would beconsiderably easier. These offsets are constants, and they could be supplied easily bythe back end, which would noticeably simplify the nub and stab.c, but there’s nofacility in lcc’s code-generation interface to supply these data. A similar situationoccurs in ldb: it needs to determine which variables are assigned to registers andthe target-dependent names for those registers. In this case, lcc’s code-generationinterface was extended with two short functions that return the necessary data.
For every call expression e, lcc emits
(tos.ip = n, tos.tail = tail, temp = e, _Nub_tos = &tos, temp)
where n is the index of the stopping point that immediately precedes e, tail is the cor-responding symbol-table entry, as described above, and temp is a compiler-generatedtemporary. The two assignments before e complete the caller’s shadow frame so that_Nub_frame can traverse the stack and compute appropriate _Nub_state_T values asit goes. _Nub_frame also sets the up fields in shadow frames when — and if — it movesdown the stack.
The assignment to _Nub_tos after the call ‘pops’ the callee’s shadow frame off theshadow stack. The more obvious way to pop this frame is to generate
return (temp = e, _Nub_tos = tos.down, temp)
for every return e, but this approach does not handle calls to standard C’s setjmpand longjmp correctly. Suppose function A calls setjmp and then calls B, which makesthe corresponding call to longjmp. If _Nub_tos were reset only in return statements,it would still point to B’s shadow frame after control returns to A, because the returnwas done internally by longjmp instead of by the code shown above for return state-ments. Resetting _Nub_tos after calls handles setjmp and longjmp correctly. Anotherapproach is to supply nub-specific versions of setjmp and longjmp that know aboutthe shadow stack.
A MACHINE-INDEPENDENT DEBUGGER 1297
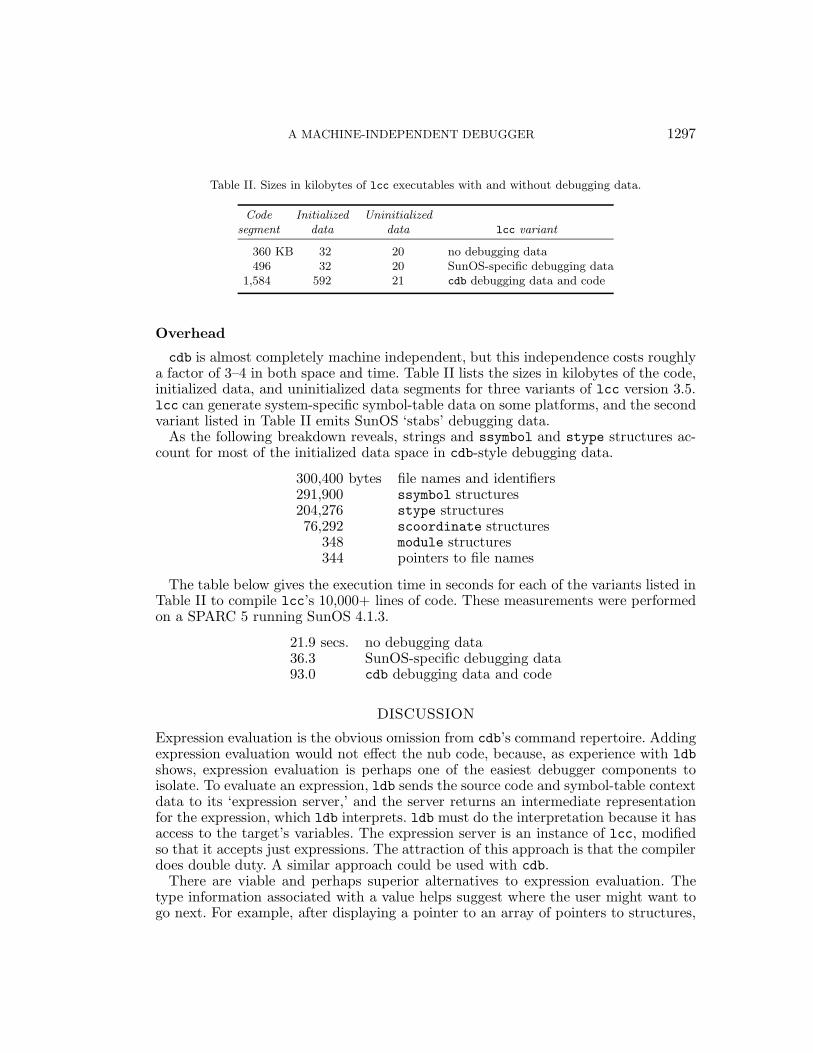
Table II. Sizes in kilobytes of lcc executables with and without debugging data.
Code Initialized Uninitializedsegment data data lcc variant
360 KB 32 20 no debugging data496 32 20 SunOS-specific debugging data
1,584 592 21 cdb debugging data and code
Overhead
cdb is almost completely machine independent, but this independence costs roughlya factor of 3–4 in both space and time. Table II lists the sizes in kilobytes of the code,initialized data, and uninitialized data segments for three variants of lcc version 3.5.lcc can generate system-specific symbol-table data on some platforms, and the secondvariant listed in Table II emits SunOS ‘stabs’ debugging data.
As the following breakdown reveals, strings and ssymbol and stype structures ac-count for most of the initialized data space in cdb-style debugging data.
300,400 bytes file names and identifiers291,900 ssymbol structures204,276 stype structures76,292 scoordinate structures
348 module structures344 pointers to file names
The table below gives the execution time in seconds for each of the variants listed inTable II to compile lcc’s 10,000+ lines of code. These measurements were performedon a SPARC 5 running SunOS 4.1.3.
21.9 secs. no debugging data36.3 SunOS-specific debugging data93.0 cdb debugging data and code
DISCUSSION
Expression evaluation is the obvious omission from cdb’s command repertoire. Addingexpression evaluation would not effect the nub code, because, as experience with ldbshows, expression evaluation is perhaps one of the easiest debugger components toisolate. To evaluate an expression, ldb sends the source code and symbol-table contextdata to its ‘expression server,’ and the server returns an intermediate representationfor the expression, which ldb interprets. ldb must do the interpretation because it hasaccess to the target’s variables. The expression server is an instance of lcc, modifiedso that it accepts just expressions. The attraction of this approach is that the compilerdoes double duty. A similar approach could be used with cdb.
There are viable and perhaps superior alternatives to expression evaluation. Thetype information associated with a value helps suggest where the user might want togo next. For example, after displaying a pointer to an array of pointers to structures,
1298 D. R. HANSON AND M. RAGHAVACHARI
the user will likely follow the pointers in the elements to display some of the struc-tures. The Pi debugger,15 which did not support expression evaluation, used a similarapproach to explore data structures incrementally by pointing and clicking, which ismuch faster than typing expressions. A prototype of this kind of interface for cdb isunder construction.
Duel7 exemplifies the other extreme. It supports expression evaluation, but in a sep-arate, very high-level language designed for debugging. The main activity in debuggingis exploring the state of a program, which is quite different from writing the programin the first place. State exploration queries can be expressed concisely in Duel, oftenas one-liners, and there are similarly concise ways to display only parts of large datastructures. cdb could support this approach, too.
Single stepping is the other important omission from cdb, and including it is moreproblematic. An obvious approach is to set all the breakpoints, keeping tracking ofwhich ones were set explicitly by the programmer, but this approach is too inefficientfor even programs of moderate size, like lcc. The compiler can compute the set of suc-cessors to any stopping point, because it has the program’s flow graph. Single steppingcould be implemented more efficiently by setting breakpoints at just these successors,continuing the target, and removing the breakpoints when the target stops again. Thisapproach is viable, but its overhead may still be too high, and it would require addi-tional information about each stopping point, which takes space. A more attractive,but untested, approach is to extend the nub interface to support single stepping di-rectly, because it could use target-specific mechanisms to do so. The disadvantage ofthis scheme is that it complicates the nub, which costs space, time, and makes it moredifficult to port.
Many system-specific debuggers also support debugging at the machine level, and afew debuggers permit code to be patched on the fly, thus avoiding an edit-compile-linkcycle. These capabilities are, of course, beyond the reach of cdb and similar machine-independent debuggers.
For cdb’s nub, the symbol table and the nub’s data structures, like the array_Nub_modules and the shadow stack, are part of the target’s address space. Thischoice makes cdb and the nub target independent, but exposes these data to corrup-tion, because a buggy C program can write anywhere in memory. Safe languages, likeModula-3, don’t have this problem.
Some of this data, like files, strings, and types, are not vulnerable because theyare placed in read-only segments along with other constants. Symbol-table entries arewritable only because their offset fields are computed during execution, which couldbe avoided as described in the previous section. Coordinates are writable only becausetheir flag bits identify breakpoints; these bits could be located elsewhere, and thecoordinates themselves placed in read-only memory. In practice, corruption is rarely aproblem, but on systems that support user-level page protection primitives,16 the nubcould protect the pages that hold its data and symbol-table data whenever controlreturned to the target. A low-tech variant of this scheme is for the debugger to keepcritical nub data while the target has control, and pass it back to the nub when thedebugger gets control, perhaps using fingerprints to avoid unnecessary copying.
In traditional system-specific debuggers, the symbol table is usually stored in theexecutable file or related file, and it’s usually not loaded with the target program andthus doesn’t consume space. The nub interface doesn’t insist on loading the symboltable with the target, and other, more system-dependent implementations could use
A MACHINE-INDEPENDENT DEBUGGER 1299
the traditional approach. For example, we’re now building an implementation of thenub that reads SPARC-specific symbol tables from executable files and translates themon-the-fly to cdb’s target-independent format. The goal is to replace just nub.c (andperhaps server.c and client.c) and to use cdb.c unchanged.
Whatever approach is used for the symbol table, defining the symbol table as initial-ized data seems much simpler than the tortured descriptions of most system-dependentsymbol-table formats. This technique could be applied more widely if symbol tableswere defined as separate segments that were linked but not loaded.17
cdb illustrates the primary advantage of using a nub: embedding even a small pieceof code in the target greatly simplifies the debugger. This approach undoubtedly hasapplications beyond just debugging; for example, Sosic18 describes a general interfacefor ‘program directing,’ which supports performance monitoring, tracing, and dynamicloading as well as debugging. Its implementation includes nub-like code that is loadedwith the target and that communicates with a client ‘director,’ such as a performancemonitor. cdb’s nub is linked with the target program, but it could be embedded in thetarget by other means; plausible alternatives include editing the target’s executablefile19 and mapping the nub into the target’s address space dynamically. These andsimilar alternatives with late binding times merit further investigation.
REFERENCES
1. Richard M. Stallman and Roland H. Pesch, ‘Using GDB: A guide to the GNU source-level de-bugger, GDB version 4.0’, Technical report, Free Software Foundation, Cambridge, MA, July1991.
2. Norman Ramsey, ‘A retargetable debugger’, Ph.D. Thesis, Princeton University, Princeton, NJ,January 1993.
3. Norman Ramsey and David R. Hanson, ‘A retargetable debugger’, Proceedings of the SIG-PLAN’92 Conference on Programming Language Design and Implementation, SIGPLAN Notices,27(7), 22–31 (1992).
4. David D. Redell, ‘Experience with Topaz TeleDebugging’, Proceedings of the SIGPLAN/SIGOPSWorkshop on Parallel and Distributed Debugging, SIGPLAN Notices, 24(1), 35–44 (1989).
5. Christopher W. Fraser and David R. Hanson, A Retargetable C Compiler: Design and Implemen-tation, Addison-Wesley, Menlo Park, CA, 1995.
6. Mark A. Linton, ‘The evolution of Dbx’, Proceedings of the Summer USENIX Technical Confer-ence, Anaheim, CA, June 1990, pp. 211–220.
7. Michael Golan and David R. Hanson, ‘DUEL — a very high-level debugging language’, Proceed-ings of the Winter USENIX Technical Conference, San Diego, CA, January 1993, pp. 107–117.
8. Christopher W. Fraser and David R. Hanson, ‘A retargetable compiler for ANSI C’, SIGPLANNotices, 26(10), 29–43 (1991).
9. Rok Sosic, ‘Dynascope: A tool for program directing’, Proceedings of the SIGPLAN’92 Conferenceon Programming Language Design and Implementation, SIGPLAN Notices, 27(6), 12–21 (1992).
10. Jurgen Heymann, ‘A 100% portable inline debugger’, SIGPLAN Notices, 28(9), 39–46 (1993).11. Greg Nelson, Systems Programming with Modula-3, Prentice Hall, Englewood Cliffs, NJ, 1991.12. Andrew Tolmach, ‘Debugging standard ML’, Ph.D. Thesis, Princeton University, Princeton, NJ,
October 1992. CS-TR-378-92.13. R. Milner, M. Tofte, and R. Harper, The Definition of Standard ML, MIT Press, 1990.14. Andrew W. Appel, Compiling with Continuations, Cambridge University Press, Cambridge, 1992.15. Thomas A. Cargill, ‘The feel of Pi’, Proceedings of the Winter USENIX Technical Conference,
Denver, CO, January 1986, pp. 62–71.16. Andrew W. Appel and Kai Li, ‘Virtual memory primitives for user programs’, Proceedings of
the Fourth International Conference on Architectural Support for Programming Languages andOperating Systems, Santa Clara, CA, April 1991, pp. 96–107.

1300 D. R. HANSON AND M. RAGHAVACHARI
17. Christopher W. Fraser and David R. Hanson, ‘A machine-independent linker’, Software—Practiceand Experience, 12(4), 351–366 (1982).
18. Rok Sosic, ‘A procedural interface for program directing’, Software—Practice and Experience,25(7), 767–787 (1995).
19. James R. Larus and Thomas Ball, ‘Rewriting executable files to measure program behavior’,Software—Practice and Experience, 24(2), 197–218 (1994).