Embed Size (px)
Citation preview

Kinetic Modelling for Tar Evolution and Formation
in a Downdraft Gasifier
A. M. Salem, U. Kumar, and M. C. Paul*
Abstract— Biomass gasification modeling is a powerful tool
used to optimize the design of a gasifier. A detailed kinetic model
was built by the current authors [1] to predict the behavior of
air blown downdraft gasifier for a wide range of materials
within the range of (38≤C≤52) %, (5.2≤H≤7) %, and
(21.7≤O≤45) %. The model was verified and showed a good
stability for a wide range of working parameters like
equivalence ratio and moisture content. In the current research,
4 main tar species are added to the model to represent tar
formation using detailed kinetic reactions. The yield of tar
species is discussed for different zones of a gasifier based on
temperature of each zone. Mass and energy balance are
calculated. 18 different kinetic reactions are implemented in the
kinetic code to predict the optimum working conditions that
leads to the production of higher value producer gas. Results
conclude that using ER of 0.3 with moisture content levels lower
than 10% will lead to the production of higher yields of syngas
with lower amounts of tar.
Index Terms— Downdraft Gasifier, Kinetic modeling, Tar
formation
I. INTRODUCTION
Biomass is one of the promising alternatives to fossil fuels.
It is also considered to be a clean and renewable source of
energy, and environmentally friendly. Biomass gasification is
one of the forms to convert biomass materials to useful gases
(e.g. CO, H2, and CH4), but the process is affected by the
production of undesired gases (N2, and CO2), and also with a
considerable amount of tar [2], [3], [4]. Tar particularly
causes serious problems in any direct downstream application
of producer gases from gasification. For example, it can cause
fouling and erosion for equipment, and the tar formation
wastes about 5-15% of the effective energy from biomass
gasification [5].
Kinetic and equilibrium models were built to simulate
gasifier behavior at different working conditions. Several
researchers [6], [7], and [8] used equilibrium models based
on one global reaction mechanism and succeed to predict
product gas composition and gasification temperature at
some extend. While other researchers who used multi-step
equilibrium models [9], where the output of each zone is fed
to the next zone of a downdraft gasifier. However, the
equilibrium models are less effective and give an over
prediction for the higher heating value and H2 output with
lower amounts of CO [10]. Thermodynamic equilibrium
models also fail to take into account the physical and
multistep chemical phenomena inside a gasifier, thus
originate error in some species estimation [11].
Kinetic models, on the other hand, were built to overcome
those problems and proved to be able to simulate a wider
range of working parameters of a gasifier e.g. (producer gas
composition, temperature profile, heating value and gasifier
dimensions) ( [1], and [12]). Some other models were used to
predict the tar formation during biomass gasification (e.g. see
Ref. [13-20]), and tar can be defined as all hydrocarbons that
have a molecular weight higher than benzene C6H6 [13].
However, tars could form in hundreds of different chemical
compounds, but in most cases, about 20 species are
considered having significant amounts [14].
While some previous works focused on tar evolution only,
other kinetic models presented gas composition and the effect
of working parameters on the change of gasifier behavior and
gasification efficiency.
The current work is an extension of an existing model
developed recently by the authors [1] – a four-zone integrated
kinetic model allowing prediction of the optimum working
parameters of a downdraft gasifier. The model was tested and
verified over a wide range of biomass materials. Tar was
assumed to be having one compound represented by formula
(C6H6.62O0.2). This paper presents an extension of the model
through implementation of the four main tar species instead
of one general formula. Tar species evolution will be tracked
through from pyrolysis to oxidation and reduction zones. A
well understanding of the evolution of different gas species
and tar, and their relationship to temperature at each zone and
other working parameters will be of a high importance when
designing a gasifier and also to reduce tar content in producer
gas. The results will discuss the optimum working parameters
that lead to the production of higher value syngas. To the best
of our knowledge, there is no other kinetic model that
includes tar formation tracked from each zone, and how they
influence on the production of different gas species along the
gasifier height at different zones.
II. MODELING PROCEDURE
The kinetic model was described in details at [1]. The
current work will discuss how the tar formation model is
implemented in it. Primary tars formed during pyrolysis are
composed of more than one hundred species, and their
formation yields are not well known. The kinetics thus will
try to simplify the tar species to be formed during pyrolysis
using four main tar species representing major species.
All authors are member of Systems, Power & Energy Research Division,
School of Engineering, University of Glasgow, Glasgow, G12 8QQ, UK.
The first author, Ahmed M. Salem is a PhD student at the University of
Glasgow and assistant lecturer at School of Engineering, Tanta University,
Egypt. [email protected].
The second author, Umesh Kumar, is a research assistant at University
of Glasgow. [email protected].
The third author, Dr Manosh C. Paul, BSc (H) MSc PhD FHEA CEng MIMechE, is a Reader in Thermofluids, and Deputy Head of Mechanical Engineering. He is also the corresponding author of this paper. (E-mail address: [email protected] ; Tel.: +44 (0) 141 3308466)
Proceedings of the World Congress on Engineering 2018 Vol II WCE 2018, July 4-6, 2018, London, U.K.
ISBN: 978-988-14048-9-3 ISSN: 2078-0958 (Print); ISSN: 2078-0966 (Online)
WCE 2018
During thermal conversion of biomass, tar is released and
can be classified as primary, secondary, and tertiary tars [15].
Primary tars are generally oxygenated, primary organic and
condensable molecules. They come mostly from the
breakdown of cellulose, hemicellulose, and lignin under
500⁰C, such as Phenol, acetol (having biggest portion [16]),
acetic acid, Guaiacol, and Furfural. As the temperatures rise
above 500 ⁰C, primary tars rearrange to form gases and
secondary tars (phenol, cresol, indene, and olefins). While
tertiary tars like aromatics, toluene and indene are formed at
higher temperatures. Condensed tertiary tars make up the
PAHs (Benzene, naphthalene (most important [19]),
acenaphthylene and pyrene). All primary tars are converted
to secondary and tertiary tars as the temperature of gasifiers
rises.
Toluene was reported as the best representative for
secondary tars while naphthalene as a PAH representing
tertiary class tars and benzene as a model for primary tars
although it is no longer considered as a tar [17]. The four
compounds, (benzene, naphthalene, toluene, and phenol)
were used for the model of [18] who simplified 10 tar species
to those four lumped tar species.
The current model aims to address the formation and tar
destruction for tar species along a downdraft gasifier having
different zones based on the equations and kinetic relations
stated in Table 1 and 2). The reactions start based on the given
initial conditions of every species and the temperature of the
gasifier zones. Initially the model assumes tar release with
volatiles at the pyrolysis zone based on the pyrolysis
temperature.
III. PYROLYSIS TAR FORMATION
Biomass first decomposes to volatiles, char and tar.
Volatiles decomposition was shown in details in [1]. Tar
decomposition based on pyrolysis temperature will be
addressed and discussed in the present work. Ref. [18]
reported parameters for the empirical correlations of
pyrolysis products as shown in Table 1 based on experimental
data taken from [19] which gives the mass yield of tar
evolution during pyrolysis process in (g tar/ kg biomass).
TABLE 1 CORRELATIONS FOR PYROLYSIS PRODUCTS [18]
a b c
C7H8 -6E-5 0.10701 -48
C10H8 -0.0001 0.218 -115.32
C6H6 -0.0003 0.7017 -387.6
C6H6O 2E-5 -0.068 46.42
The mass yield of different tar species Y, in (g/kg biomass),
can be derived by using equation (1)
𝑌 = 𝑎𝑇2 + 𝑏 𝑇 + 𝑐 (1)
After calculating the mass yield of the four main tar species
at the pyrolysis zone, they are added to the pyrolysis products
and an energy balance is made to calculate the pyrolysis
temperature through equation (2).
∑ 𝑋𝑖 . (ℎ𝑓 + 𝐶𝑝. ∆𝑇)𝑝𝑦𝑟𝑜𝑙𝑦𝑠𝑖𝑠 𝑝𝑟𝑜𝑑𝑢𝑐𝑡𝑠
=
∑ 𝑋𝑖 . (ℎ𝑓 + 𝐶𝑝. ∆𝑇)𝑐𝑜𝑚𝑏𝑢𝑠𝑡𝑖𝑜𝑛 𝑝𝑟𝑜𝑑𝑢𝑐𝑡𝑠
+ 𝑄𝑙𝑜𝑠𝑠
(2)
The heat loss is mentioned in the oxidation zone only as it
is higher in temperature than other zones, and the overall heat
loss is assumed to be 10% of the product of the equivalence
ratio (ER) and HHV [20]. The same energy balance principle
is made for every zone to get the corresponding temperature.
After calculating the temperature, a backward calculation
is made to predict the gas composition for the pyrolysis
products including the tar species.
IV. TAR SPECIES IN COMBUSTION AND REDUCTION ZONES
The products of pyrolysis are used as feed to the oxidation
zone. The reactions stated in Table 2 are implemented in the
kinetic model for both the combustion and reduction zones.
Those reactions are taken from the references mentioned in
the table. Other reactions for the gasification and combustion
were already discussed in [1] and will not be repeated here.
Again, after calculating the gas composition, energy balance
is made to get the oxidation and gasification temperature and
backward calculations are made to get the correct gas
composition coming out of combustion. The model uses 18
different kinetic reactions in the combustion and reduction
zone for the calculation of different gas and tar species.
V. MODEL VALIDATION
The initial kinetic code was validated in [1] over a wide
range of biomass materials for the gas composition,
temperature profile and gasifier dimensions. The validation
in this paper will only focus on the tar species formation
before discussing other results.
TABLE 2
REACTIONS OF TAR SPECIES IMPLEMENTED IN THE MODEL.
Reaction and rate expression A, s-1 E,
kJ/mol
Ref
1 𝐶7𝐻8 → 0.17𝐶10𝐻8 + 0.89𝐶6𝐻6
+ 0.67𝐻2
𝑟 = 𝑘1 [𝐶7𝐻8]
2.23E13 315 [21]
2 𝐶10𝐻8 → 10 𝐶 + 4𝐻2
𝑟 = 𝑘2 [𝐶10𝐻8]2 [𝐻2]−0.7
5.56E15 360 [22]
3 𝐶10𝐻8 + 4𝐻2𝑂 → 𝐶6𝐻6 + 4𝐶𝑂+ 5𝐻2
𝑟 = 𝑘3 [𝐶10𝐻8] [𝐻2]0.4
1.58E12 324 [22]
4 𝐶7𝐻8 + 𝐻2 → 𝐶6𝐻6 + 𝐶𝐻4
𝑟 = 𝑘4 [𝐶7𝐻8] [𝐻2]0.5
1.04E12 247 [22]
5 𝐶6𝐻6 + 5𝐻2𝑂 → 5𝐶𝑂 + 𝐶𝐻4
+ 6𝐻2
𝑟 = 𝑘5 [𝐶6𝐻6]
4.4E8 220 [22]
6 𝐶6𝐻6 + 7.5 𝑂2 → 6𝐶𝑂2 + 4𝐻2𝑂
𝑟 = 𝑘6 [𝐶6𝐻6]−0.1 [𝑂2]1.25
17.83 125.5 [22]
7 𝐶6𝐻6 + 3𝑂2 → 6𝐶𝑂 + 3𝐻2
𝑟 = 𝑘7 [𝐶6𝐻6] [𝑂2] 1.58E15 202.6 [22]
8 𝐶7𝐻8 + 9 𝑂2 → 7𝐶𝑂2 + 4𝐻2𝑂
𝑟 = 𝑘8 [𝐶7𝐻8]−0.1 [𝑂2]1.25
14.26 125.5 [22]
9 𝐶6𝐻6𝑂 → 𝐶𝑂 + 0.4𝐶10𝐻8
+ 0.15 𝐶6𝐻6
+ 0.1𝐶𝐻4
+ 0.75𝐻2
𝑟 = 𝑘9 [𝐶6𝐻6𝑂]
1.0E7 100 [18],
[16]
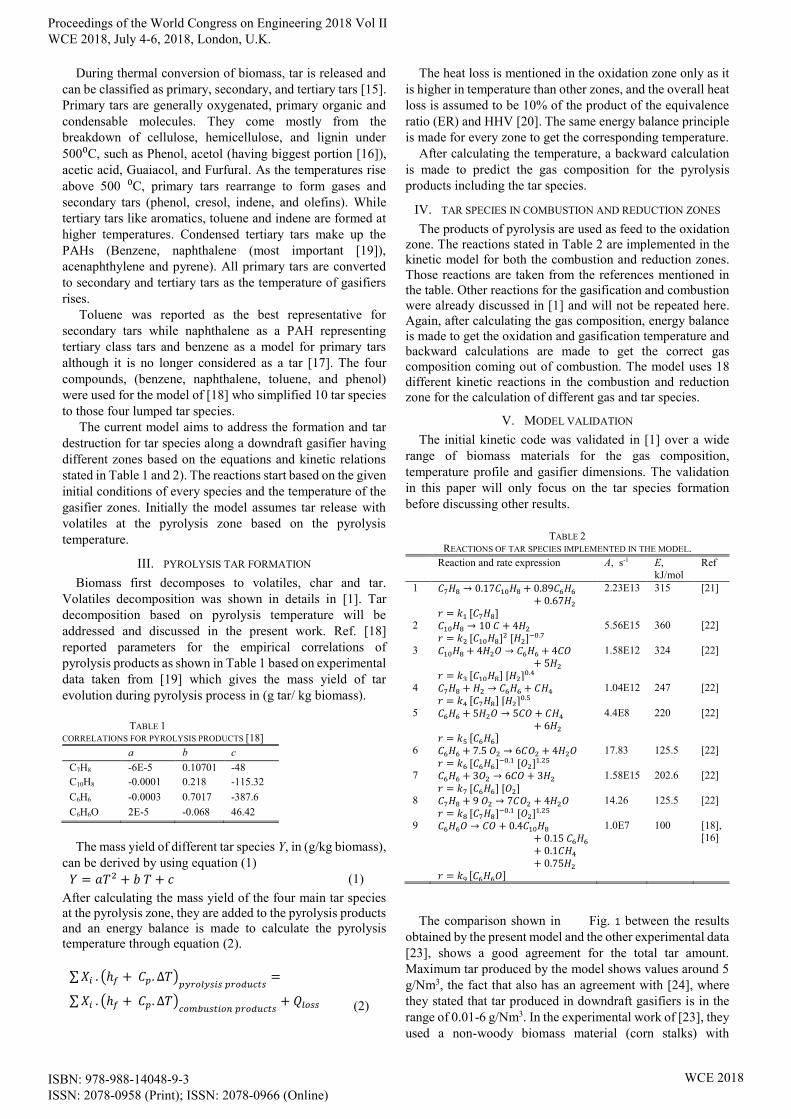
The comparison shown in Fig. 1 between the results
obtained by the present model and the other experimental data
[23], shows a good agreement for the total tar amount.
Maximum tar produced by the model shows values around 5
g/Nm3, the fact that also has an agreement with [24], where
they stated that tar produced in downdraft gasifiers is in the
range of 0.01-6 g/Nm3. In the experimental work of [23], they
used a non-woody biomass material (corn stalks) with
Proceedings of the World Congress on Engineering 2018 Vol II WCE 2018, July 4-6, 2018, London, U.K.
ISBN: 978-988-14048-9-3 ISSN: 2078-0958 (Print); ISSN: 2078-0966 (Online)
WCE 2018
moisture content level of 6.17%, and the comparison is made
for the different values of the air equivalence ratio to measure
the stability of the current model for a normal range of
working conditions.
Fig. 1. Total tar formation comparison between the present model and
experimental results.
VI. TAR SPECIES EVOLUTION AND FORMATION ALONG THE
GASIFIER
Tar evolution during pyrolysis and its relation with
temperature is illustrated and first implemented in the current
kinetic code. Tar destruction, formation and converting to
other species based on the reactions stated in Table 2 is shown
and was first implemented in the kinetic code. Tar formation
results are illustrated in (Fig. 2, and Fig. 4). Different tar
species used in the model are traced from its formation in
pyrolysis then the combustion and reduction zones along the
gasifier height, and they depend on the temperature of each
zone. The effect of the varying moisture content and
equivalence ratio will be discussed and presented. Initial
investigations are carried out at a fixed ER of 0.326, and with
varying moisture content to study its effect on the tar
formation and subsequently, predict the optimum conditions
that lead to less amount of tar in the producer gases. Other
simulations are carried out at a fixed moisture content of 10%
but with a varying equivalence ratio.
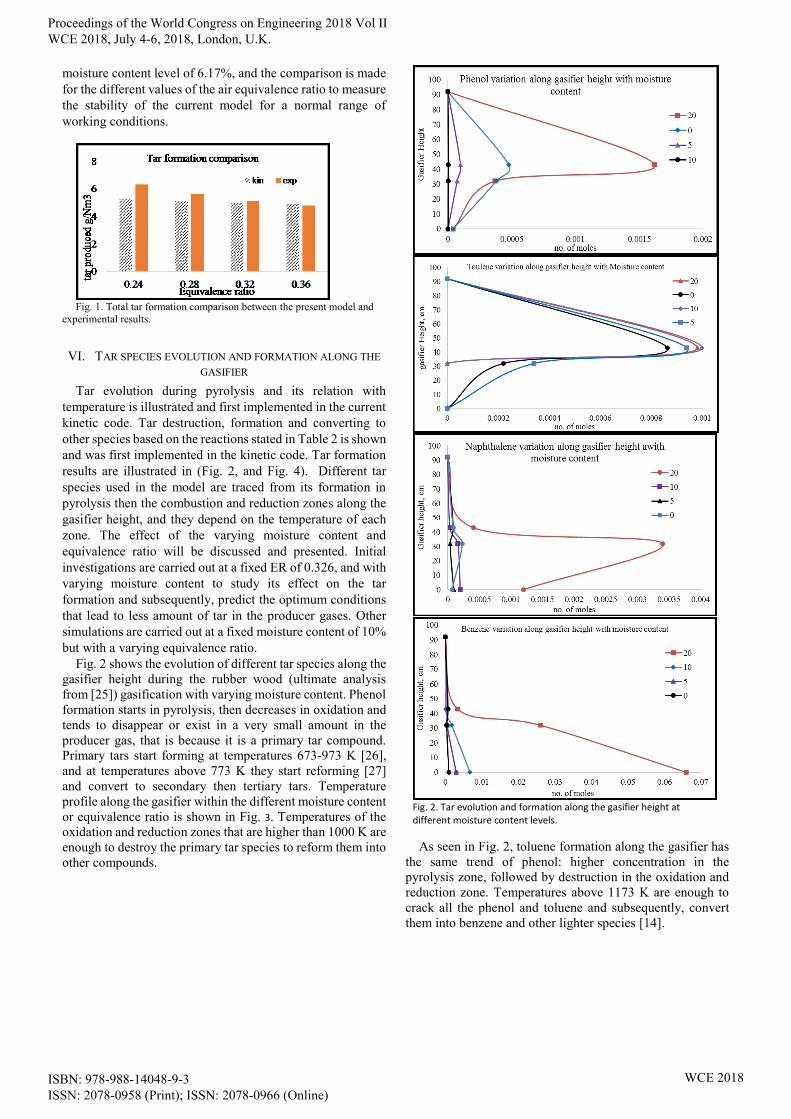
Fig. 2 shows the evolution of different tar species along the
gasifier height during the rubber wood (ultimate analysis
from [25]) gasification with varying moisture content. Phenol
formation starts in pyrolysis, then decreases in oxidation and
tends to disappear or exist in a very small amount in the
producer gas, that is because it is a primary tar compound.
Primary tars start forming at temperatures 673-973 K [26],
and at temperatures above 773 K they start reforming [27]
and convert to secondary then tertiary tars. Temperature
profile along the gasifier within the different moisture content
or equivalence ratio is shown in Fig. 3. Temperatures of the
oxidation and reduction zones that are higher than 1000 K are
enough to destroy the primary tar species to reform them into
other compounds.
Fig. 2. Tar evolution and formation along the gasifier height at different moisture content levels.
As seen in Fig. 2, toluene formation along the gasifier has
the same trend of phenol: higher concentration in the
pyrolysis zone, followed by destruction in the oxidation and
reduction zone. Temperatures above 1173 K are enough to
crack all the phenol and toluene and subsequently, convert
them into benzene and other lighter species [14].
Proceedings of the World Congress on Engineering 2018 Vol II WCE 2018, July 4-6, 2018, London, U.K.
ISBN: 978-988-14048-9-3 ISSN: 2078-0958 (Print); ISSN: 2078-0966 (Online)
WCE 2018

Fig. 3. Temperature variations along gasifier height.
Naphthalene formation, however, takes a different trend
than other species. It is formed and present in considerable
amounts in producer gas. Small amounts are produced during
pyrolysis, because it is a tertiary tar which requires higher
temperatures to present and formed. Fig. 3 shows that higher
temperatures in the oxidation zone >1300K are favorable for
the naphthalene formation which starts conversion for
temperatures greater than 1300K and achieves a total
conversion at 1600 K [28]. Based on reactions 2 and 3 in
Table 2, naphthalene is converted to char, H2, CO and
benzene. Those reactions are tend to take place in the
combustion and reduction zone, however it is more likely to
happen in the reduction zone because of the presence of water
vapor. Higher concentration of naphthalene in the oxidation
zone is mainly due to the conversion of lighter species
(phenol and toluene) and also because of the oxidation
temperature which is in the ideal range of naphthalene
formation and never exceeds this to the destruction
temperatures (>1600 K).
Overall, benzene has the highest portion of tar species,
which is usually greater than 37% by weight of total tars
produced [29]. Also the data collected from [19], [17], and
[15] shows that the highest portion of tar compounds is for
benzene which meets a good agreement with the model.
VII. EFFECTS OF EQUIVALENCE RATIO ON THE TAR SPECIES
The results shown in Fig. 4 illustrate the effects of the
equivalence ratio on the tar evolution at the different zones of
the downdraft gasifier. Rubber wood was used as feedstock
with moisture content of 10%. The same trend shown with
varying moisture content is also noticed with the equivalence
ratio. All the tar species evolution starts from pyrolysis to
oxidation and reduction. More attention will be focused on
the benzene formation with varying equivalence ratio as it is
the major of tar species formed during gasification and also
because of the similar trend of all species with varying
equivalence ratio.
Fig. 4. Benzene evolution and formation along gasifier height at different
equivalence ratios.
Furthermore, as illustrated and discussed before, benzene
has the biggest portion of tar produced during biomass
gasification. The results of changing moisture content or
equivalence ratio show the same trend and find good
agreement with the other previous works like [28], [17], [18]
and [21].
Generally, a higher equivalence ratio tends to increase the
oxidation and reduction temperatures, Fig. 3. This is because
it increases the air amount and circulation inside the gasifier
and hence, increasing the oxidation process reactions.
Oxidation reactions are normally exothermic which release
heat and thus increase temperature inside the gasifier.
VIII. OPTIMUM WORKING PARAMETERS
After validating the current model, it is used to address the
optimum working parameters that lead to higher quality
syngas (high heating value with lower moisture content).
Lower amount of water content in biomass leads to a
significant increase in the heating value which has a good
agreement with ( [30], [31], and [32]). On the other hand
higher levels of moisture content requires more heat for
removal, this heat is not recovered again and reduces
producer gas heating value. In contrast, lower moisture
content is favorable for lower tar amount levels in the
producer gas. The results reveal a decrease in tar amount
produced from the gasifier by more than 40% when
decreasing moisture content from 10 to 0%. On the other
hand, increasing equivalence ratio from 0.2-0.35 leads to a
decrease of tar produced by 6%.
Highest heating value of 5.96 MJ/Nm3 is found for the
rubber wood gasification under ER=0.2, and MC of 10%.
Higher tar levels (5.3 g/mol of biomass = 22.5% by weight)
are also found for using rubber wood at 20% moisture
content. While lower tar amounts is found at using 0% MC at
ER= 0.326, which gives 0.1 g tar/mol biomass. In conclusion,
biomass materials with moisture content levels lower than 10
%, and using equivalence ratio of 0.3 will increase the yield
of syngas, leading to an increase of heating value with a
reasonable amount of tar content in producer gas.
IX. CONCLUSION
The current model is a four-zone kinetic model for air-
blown downdraft gasifiers. The model is verified and found
good agreement with other experimental data. The model can
predict producer gas composition, four main tar species
Proceedings of the World Congress on Engineering 2018 Vol II WCE 2018, July 4-6, 2018, London, U.K.
ISBN: 978-988-14048-9-3 ISSN: 2078-0958 (Print); ISSN: 2078-0966 (Online)
WCE 2018

formation, and gasifier dimensions design. The model is used
to address the evolution of different gas species, char and tar
species along gasifier, starting from devolatilization process
to combustion and reduction. The results show the evolution
and variation of different tar species with different working
conditions of moisture content and equivalence ratio. Finally,
the model is used to find the optimum working parameters for
a downdraft gasifier that leads to the production of higher
yield of syngas with lower tar amounts. Using equivalence
ratio of 0.3, with lower values of moisture content < 10% will
increase the yield of syngas, leading to an increase of heating
value with a reasonable amounts of tar content in producer
gas.
Future work on this model will try to address new ideas
regarding tar destruction and converting it to useful
compounds.
ACKNOWLEDGMENT
The first author would like to thank the British Embassy in
Egypt and The Egyptian Cultural Affairs and Missions Sector
for funding his PhD research study at the University of
Glasgow.
REFERENCES
[1] A.M. Salem, and M.C. Paul, "An integrated kinetic model for
downdraft gasifier based on a novel approach that optimises the reduction zone of gasifier," Biomass and Bioenergy, vol. 109, pp. 172-
181, 2018.
[2] Basu P., Biomass Gasification, Pyrolysis, and Torrefaction. Practical Design and Theory. Second Edition, Amsterdam: Academic Press,
2013.
[3] A.M. Sepe, J. Li, and M.C. Paul, "Assessing biomass steam gasification technologies using a multi-purpose model," Energy
Convers. Manag., vol. 129, pp. 216-226, 2016.
[4] L. Yan, Y. Cao, and B. He, "On the kinetic modeling of biomass/coal char co-gasification with steam," Chem. Eng. J., vol. 331, pp. 435-
442, 2018.
[5] Qin Y, Campen A, Wiltowski T, Feng J, Li W., "The influence of different chemical compositions in biomass on gasification tar
formation," Biomass and Bioenergy, vol. 83, pp. 77-84, 2015.
[6] A. Melgar, J.F. Pe´rez, H. Laget, and A. Horillo, "Thermochemical equilibrium modelling of a gasifying process," Energy Conversion
and Management, vol. 48, pp. 59-67, 2007.
[7] P.P. Dutta,V. Pandey,A.R. Das,S. Sen, and D.C. Baruah., "Down Draft Gasification Modelling and Experimentation of Some
Indigenous Biomass for Thermal Applications," Energy Procedia,
vol. 54, p. 21 – 34, 2014.
[8] K.T. Wu, and R.Y. Chein, "Modeling of Biomass Gasification with
Preheated Air at High Temperatures," in The 7th International
Conference on Applied Energy, 2015.
[9] S.A. Channiwala, J.K. Ratnadhariya., "Three zone equilibrium and
kinetic free modeling of biomass gasifier – a novel approach,"
Renewable Energy, vol. 34, no. 4, p. 1050–1058, 2009.
[10] Li XT, J.R. Grace,C.J. Lim, A.P. Watkinson, H.P. Chen, and J.R. Kim,
"Biomass gasification in a circulating fluidized bed.," Biomass and
Bioenergy, p. 171–193, 2004.
[11] A. Dufour, S. Valin, P. Castelli, S. Thiery, G. Boissonnet, A.
Zoulalian, and P. Glaude, "Mechanisms and Kinetics of Methane Thermal Conversion in a Syngas," Ind. Eng. Chem. Res., vol. 48, no.
14, pp. 6565-6572, 2009.
[12] A. M. Salem, U. Kumar, A. N. Izaharuddin, H. Dhami, T. Sutari, and
M. C. Paul, "Advanced numerical methods for the assessment of
integrated gasification and CHP generation technologies," in Coal and Biomass Gasification, Energy, Environment, and Sustainability,
Springer, 2018, pp. 307-330.
[13] K. Maniatis, "Introduction: tar protocols. IEA gasification," Biomass Bioenergy, vol. 18, pp. 1-4, 2000.
[14] CM. Kinoshita , Y. Wang, J. Zhou, "Tar formation under different
biomass gasification conditions," Journal of Analytical and Applied Pyrolysis, vol. 29, pp. 169-181, 1994.
[15] A.M. Ahmed, A. Salmiaton, T. S. Choong, and W.A Azlina, "Review
of kinetic and equilibrium concepts for biomass tar modeling by using Aspen Plus," Renewable and Sustainable Energy Reviews, vol. 52, p.
1623–1644, 2015.
[16] P. Morf, P. Hasler, and T. Nussbaumer, "Mechanisms and kinetics of homogeneous secondary reactions of tar from continuous pyrolysis of
wood chips," Fuel, vol. 81, pp. 843-853, 2002.
[17] A. Fourcault, F. Marias, and U. Michon, "Modelling of thermal removal of tars in a high temperature stage fed by a plasma torch,"
biomass and bioenergy, vol. 34, pp. 1363-1374, 2010.
[18] A. Dufour, L. Abdelouahed, O. Authier, G. Mauviel, J. P. Corriou, and G. Verdier, "Detailed Modeling of Biomass Gasification in Dual
Fluidized Bed Reactors under Aspen Plus," Energy and Fuels, vol. 26,
pp. 3840-3855, 2012.
[19] A. Dufour, E. Masson, P. Girods, Y. Rogaume, and A. Zoulalian,
"Evolution of Aromatic Tar Composition in Relation to Methane and
Ethylene from Biomass Pyrolysis-Gasification," Energy Fuels , vol. 25, p. 4182–4189, 2011.
[20] R. Bridgewater, and A. Shand, "Fuel gas from biomass: Status and
new modeling approaches," Thermochemical Processing of Biomass, pp. 229-254, 1984.
[21] D. Fuentes-Cano, A. Gomez-Barea, S. Nilsson, and P. Ollero, "Kinetic
Modeling of Tar and Light Hydrocarbons during the Thermal Conversion of Biomass," Energy Fuels, vol. 30, pp. 377-385, 2016.
[22] F.Marias, A. Fourcault, and U.Michon, "Modelling
ofthermalremovaloftarsinahightemperature stage fedbyaplasmatorch," Biomass and Bioenergy, vol. 34, pp. 1363-1374,
2010.
[23] C. Gai, and Y. Dong, "Experimental study on non-woody biomass gasification in a downdraft gasifier," international journal of
hydrogen energy , vol. 37, pp. 4935-4944, 2012.
[24] P. N. T. Hasler, "Gas cleaning for IC engine applications from fixed
bed biomass gasification," Biomass Bioenergy , vol. 16, pp. 385-395,
1999.
[25] L. A. R. J. F. a. D. F. S. T. H. Jayah, "Computer simulation of a downdraft wood gasifier for tea drying," Biomass Bioenergy, vol. 25,
pp. 459-469, 2003.
[26] F. PalmaC., "Modelling of tar formation and evolution for biomass gasification: A review," Applied Energy, vol. 111, p. 129–141, 2013.
[27] P. Basu, Biomass gasification and pyrolysis: practical design and
theory., Burlington: Academic press, 2010.
[28] A. Jess, "Mechanisms and kinetics of thermal reactions of aromatic
hydrocarbons from pyrolysis of solid fuels," Fuel, vol. 75, no. 12, pp. 1441-1448, 1996.
[29] P. Basu, Biomass Gasification, Pyrolysis, and Torrefaction. Practical
Design and Theory. Second Edition, Amsterdam : Academic Press, 2013.
[30] Budhathoki R., Three zone modeling of Downdraft biomass
Gasification: Equilibrium and finite Kinetic Approach” MSC Thesis,, University of Jyväskylä, 2003.
[31] A. Dutta, and S. Jarungthammachote., "Thermodynamic equilibrium
model and second law analysis of a downdraft waste gasifier," Energy, vol. 32, pp. 1660-1669, 2007.
[32] Z.A. Zainal, R. Ali,C.H. Lean,K.N. Seetharamu., "Prediction of
performance of a downdraft gasifier using equilibrium modeling for different biomass materials," Energy Conversion and Management,
vol. 42, no. 12, p. 1499–1515, 2001.
Proceedings of the World Congress on Engineering 2018 Vol II WCE 2018, July 4-6, 2018, London, U.K.
ISBN: 978-988-14048-9-3 ISSN: 2078-0958 (Print); ISSN: 2078-0966 (Online)
WCE 2018