Embed Size (px)
Citation preview
A LOW COST THREE-DIRECTIONAL FORCE SENSOR
S. Boukhenous
Laboratory of Instrumentation
Faculty of Electronics and Computers
USTHB, Bab_Ezzouar, Algeria, www.lins.usthb.dz
Email: [email protected]
Submitted: October 20, 2010 Accepted: February 15, 2011 Published: March 1, 2011
Abstract- In this work a low cost sensor has been developed to measure three-directional forces. The
theory, design and sensor construction details are presented. It was constructed by using commercial
strain gauges. Finite element method was adopted to optimize the structure dimensions, and improve
the sensitivity of force sensor by distributing the sensing stress on the maximum strain positions. A
hardware conditioning circuits was developed for the 3D force sensor. The calibration experiments
were performed to calculate calibration coefficients by using the regression analysis method and test
linear property of the sensor.
Index terms: Strain gauge, three-directional forces, 3D force platform, gait and posture.
INTERNATIONAL JOURNAL ON SMART SENSING AND INTELLIGENT SYSTEMS VOL. 4, NO. 1, MARCH 2011
21
I. INTRODUCTION
The measurement of foot-ground reaction forces produced by human body in biomechanical
analysis is very important. Ground reaction measurement with force plates has been devoted to
perform dynamics analysis in many environments [1], [2]. A variety of sensor systems have been
developed, including resistive strain gauges, piezoelectric film [3], capacitive sensors, Hall effect
[4], [5], but in these systems the effects of shearing forces were neglected. Some sensors recently
are developed to measure compressive and shear forces at the skin-object interface [6], but the
force levels are limited in the measurements of small forces about 50N. Pressure platforms
reliably deliver pressure distribution under the foot, foot location, vertical reaction, and
displacement of the center of pressure, but they do not give any information about shear forces
[7]. Gait and posture analysts sometimes neglect the local components of shear forces because of
the great amount of information already delivered by the vertical reaction components [8], [9].
Two multi-dimensional sensors for human dynamics analysis have been introduced in [10], but
these structural sensors with load-coupling were difficult to be calibrated. In this paper, we are
developing a strain gauge sensor used an easy innovative made instrument for measuring 3D
forces during human walking. A finite element method was adopted to optimize the structure
dimensions, and improve the sensitivity of force sensor by distributing the sensing stress on the
maximum strain positions. After optimization and realization model, hardware conditioning
circuits was developed for the 3D force sensor. The calibration experiments were performed to
calculate calibration coefficients by using the regression analysis method and test linear property
of the sensor.
II. DESIGN OF THE 3D TEST BODY
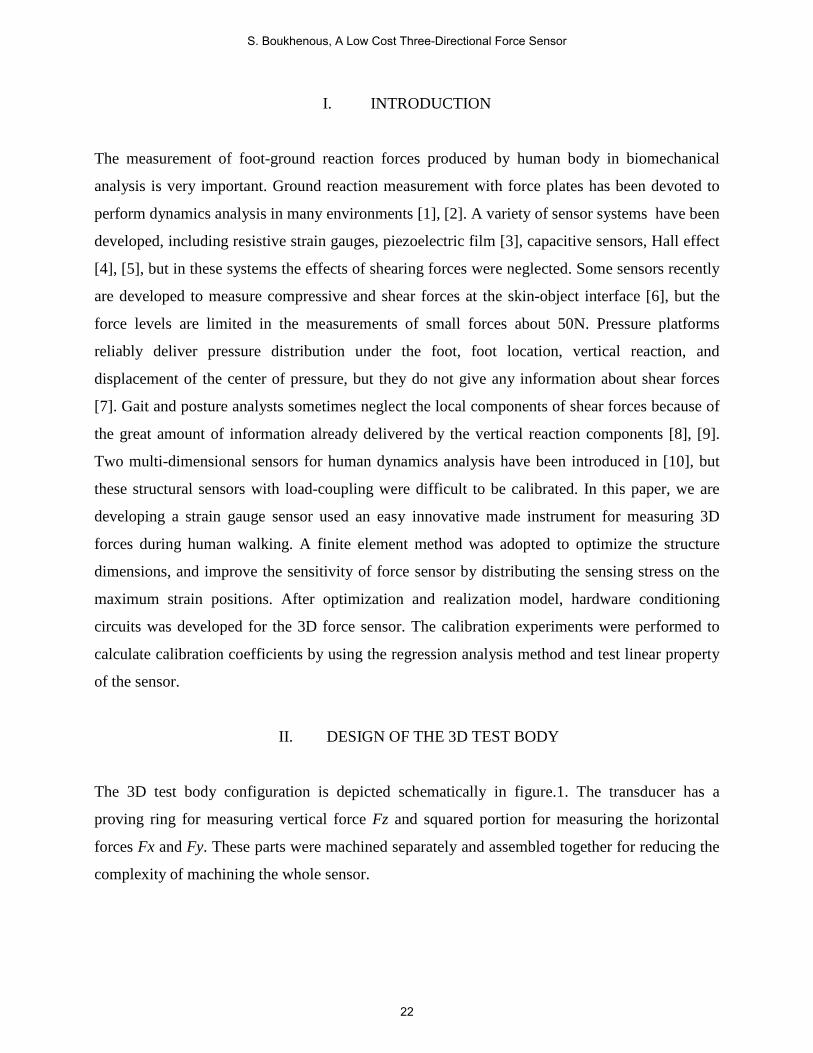
The 3D test body configuration is depicted schematically in figure.1. The transducer has a
proving ring for measuring vertical force Fz and squared portion for measuring the horizontal
forces Fx and Fy. These parts were machined separately and assembled together for reducing the
complexity of machining the whole sensor.
22
S. Boukhenous, A Low Cost Three-Directional Force Sensor
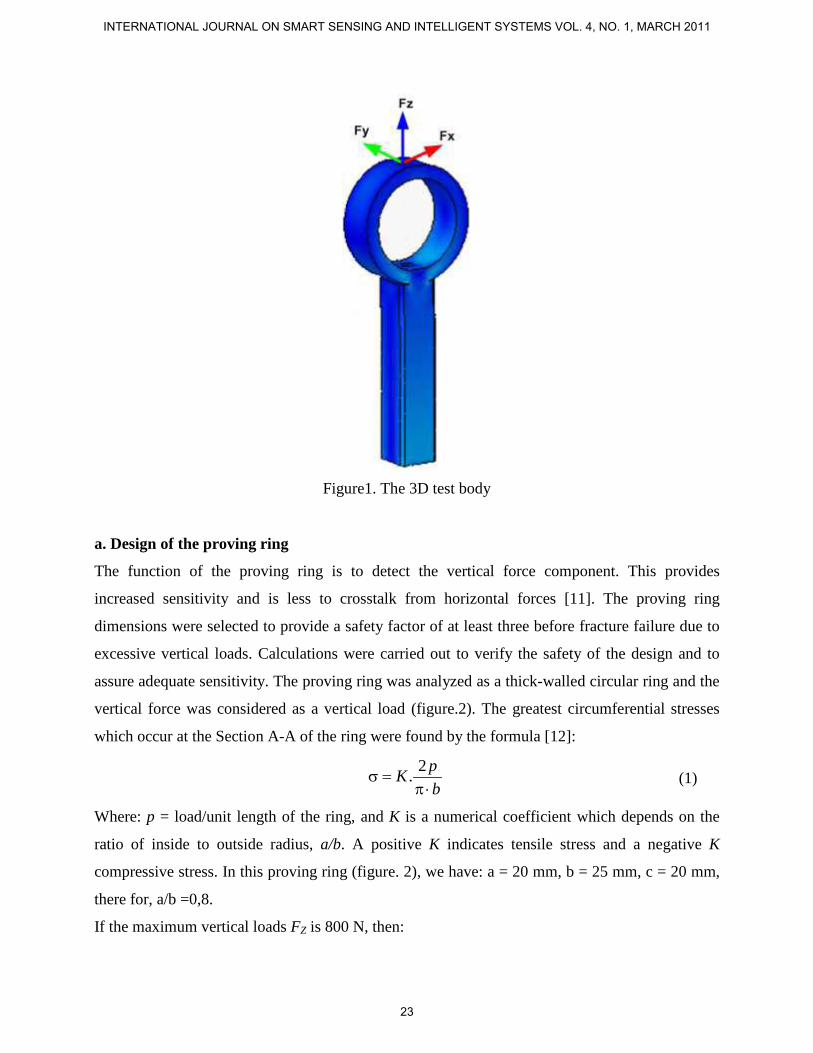
Figure1. The 3D test body
a. Design of the proving ring
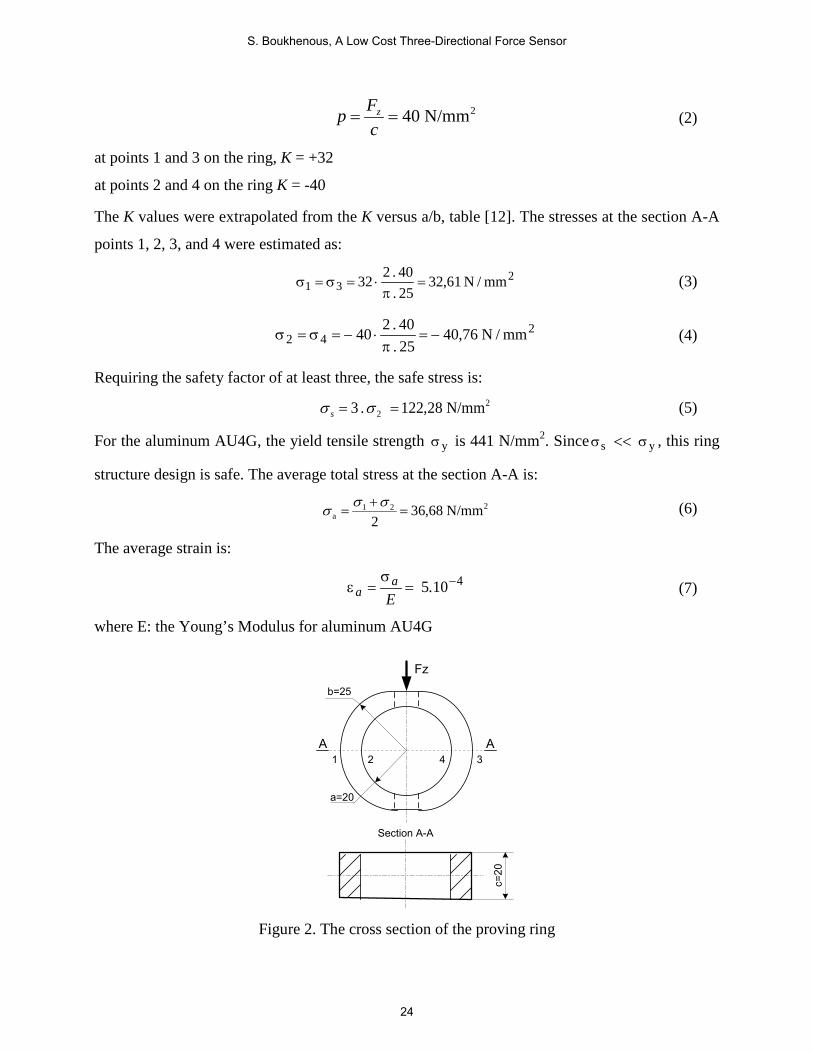
The function of the proving ring is to detect the vertical force component. This provides
increased sensitivity and is less to crosstalk from horizontal forces [11]. The proving ring
dimensions were selected to provide a safety factor of at least three before fracture failure due to
excessive vertical loads. Calculations were carried out to verify the safety of the design and to
assure adequate sensitivity. The proving ring was analyzed as a thick-walled circular ring and the
vertical force was considered as a vertical load (figure.2). The greatest circumferential stresses
which occur at the Section A-A of the ring were found by the formula [12]:
bp.K⋅π
=σ2
(1)
Where: p = load/unit length of the ring, and K is a numerical coefficient which depends on the
ratio of inside to outside radius, a/b. A positive K indicates tensile stress and a negative K
compressive stress. In this proving ring (figure. 2), we have: a = 20 mm, b = 25 mm, c = 20 mm,
there for, a/b =0,8.
If the maximum vertical loads FZ is 800 N, then:
INTERNATIONAL JOURNAL ON SMART SENSING AND INTELLIGENT SYSTEMS VOL. 4, NO. 1, MARCH 2011
23
2N/mm40==cFp z (2)
at points 1 and 3 on the ring, K = +32
at points 2 and 4 on the ring K = -40
The K values were extrapolated from the K versus a/b, table [12]. The stresses at the section A-A
points 1, 2, 3, and 4 were estimated as:
231 mm/N61,32
25.40.232 =
π⋅=σ=σ (3)
242 mm/N76,40
25.40.240 −=
π⋅−=σ=σ (4)
Requiring the safety factor of at least three, the safe stress is:
22 N/mm28,122.3 == σσ s (5)
For the aluminum AU4G, the yield tensile strength yσ is 441 N/mm2. Since sσ << yσ , this ring
structure design is safe. The average total stress at the section A-A is:
221a N/mm68,36
2=
+=
σσσ (6)
The average strain is:
4105 −=σ
=ε .Ea
a (7)
where E: the Young’s Modulus for aluminum AU4G
b=25
a=20
1 2 4 3A A
Section A-A
c=20
Fz
Figure 2. The cross section of the proving ring
24
S. Boukhenous, A Low Cost Three-Directional Force Sensor
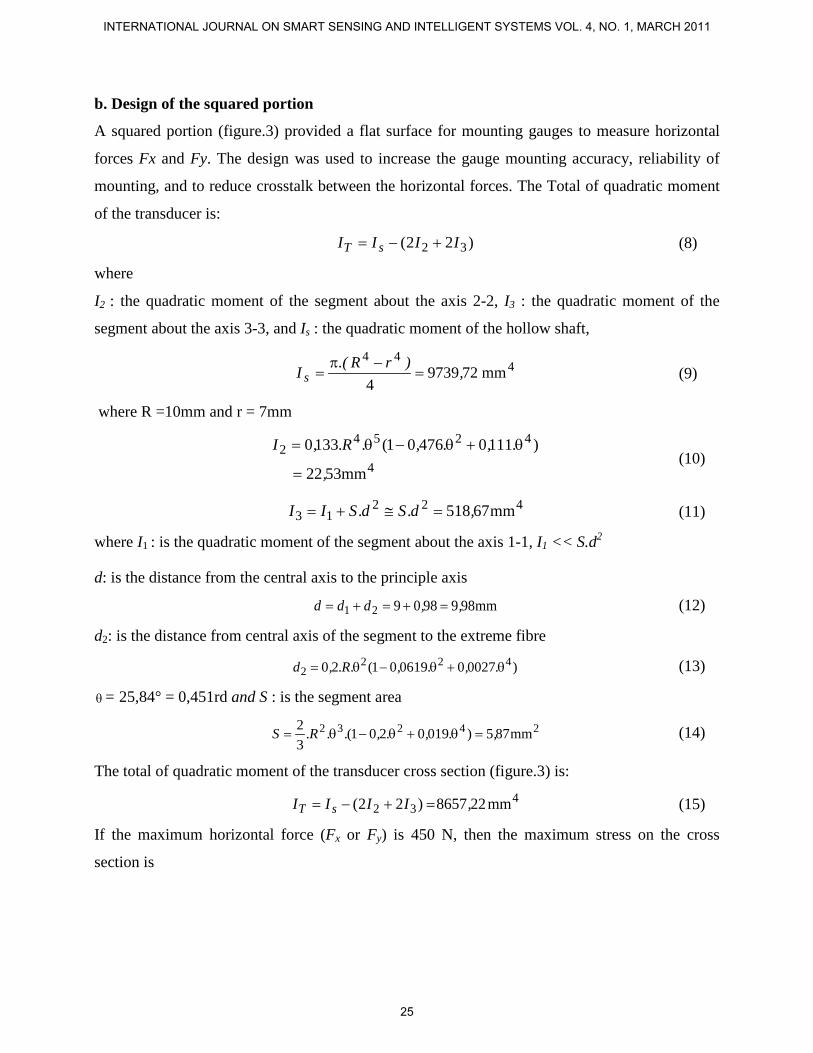
b. Design of the squared portion
A squared portion (figure.3) provided a flat surface for mounting gauges to measure horizontal
forces Fx and Fy. The design was used to increase the gauge mounting accuracy, reliability of
mounting, and to reduce crosstalk between the horizontal forces. The Total of quadratic moment
of the transducer is:
)22( 32 IIII sT +−= (8)
where
I2 : the quadratic moment of the segment about the axis 2-2, I3 : the quadratic moment of the
segment about the axis 3-3, and Is : the quadratic moment of the hollow shaft,
444
mm7297394
,)rR.(I s =−π
= (9)
where R =10mm and r = 7mm
4
42542
mm5322
)111047601(1330
,
.,.,.R.,I
=
θ+θ−θ= (10)
42213 mm67518,d.Sd.SII =≅+= (11)
where I1 : is the quadratic moment of the segment about the axis 1-1, I1 << S.d2
d: is the distance from the central axis to the principle axis
mm989980921 ,,ddd =+=+= (12)
d2: is the distance from central axis of the segment to the extreme fibre
)00270061901(20 4222 θ+θ−θ= .,.,.R.,d (13)
θ= 25,84° = 0,451rd and S : is the segment area
24232 mm875)0190201(32 ,.,.,..R.S =θ+θ−θ= (14)
The total of quadratic moment of the transducer cross section (figure.3) is:
432 mm228657)22( ,IIII sT =+−= (15)
If the maximum horizontal force (Fx or Fy) is 450 N, then the maximum stress on the cross
section is
INTERNATIONAL JOURNAL ON SMART SENSING AND INTELLIGENT SYSTEMS VOL. 4, NO. 1, MARCH 2011
25
2
11
N/mm1042,
Id.L.F
Id.L.F
T
y
T
x
=
==σ (16)
where L = 90 mm is the distance from the center of the strain gauge to the pin joint where the
applied vectorial force.
d1: is one half of the distance between the two flat surfaces of the section (d1 = D/2=9mm).
If the safety factor is at least 3, then the safe stress should be:
2N/mm31263 ,.s =σ=σ (17)
however the since yield stress yσ = 441 N/mm2, then sσ < yσ .
B B
l = 8
0
D=18
1 1
3 3
2
2
R
d1d2
Sr = 7
Section B-B
Figure 3. The squared portion and cross section
III. SIMULATION RESULTS OF THE TEST BODY
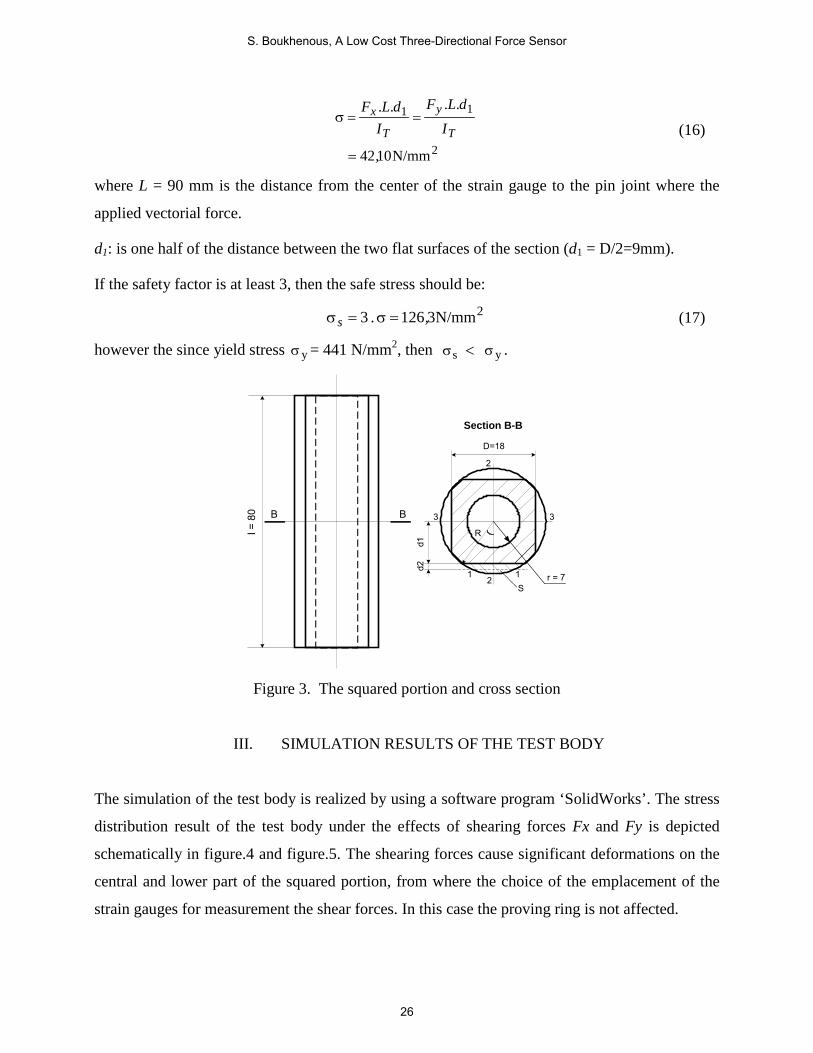
The simulation of the test body is realized by using a software program ‘SolidWorks’. The stress
distribution result of the test body under the effects of shearing forces Fx and Fy is depicted
schematically in figure.4 and figure.5. The shearing forces cause significant deformations on the
central and lower part of the squared portion, from where the choice of the emplacement of the
strain gauges for measurement the shear forces. In this case the proving ring is not affected.
26
S. Boukhenous, A Low Cost Three-Directional Force Sensor
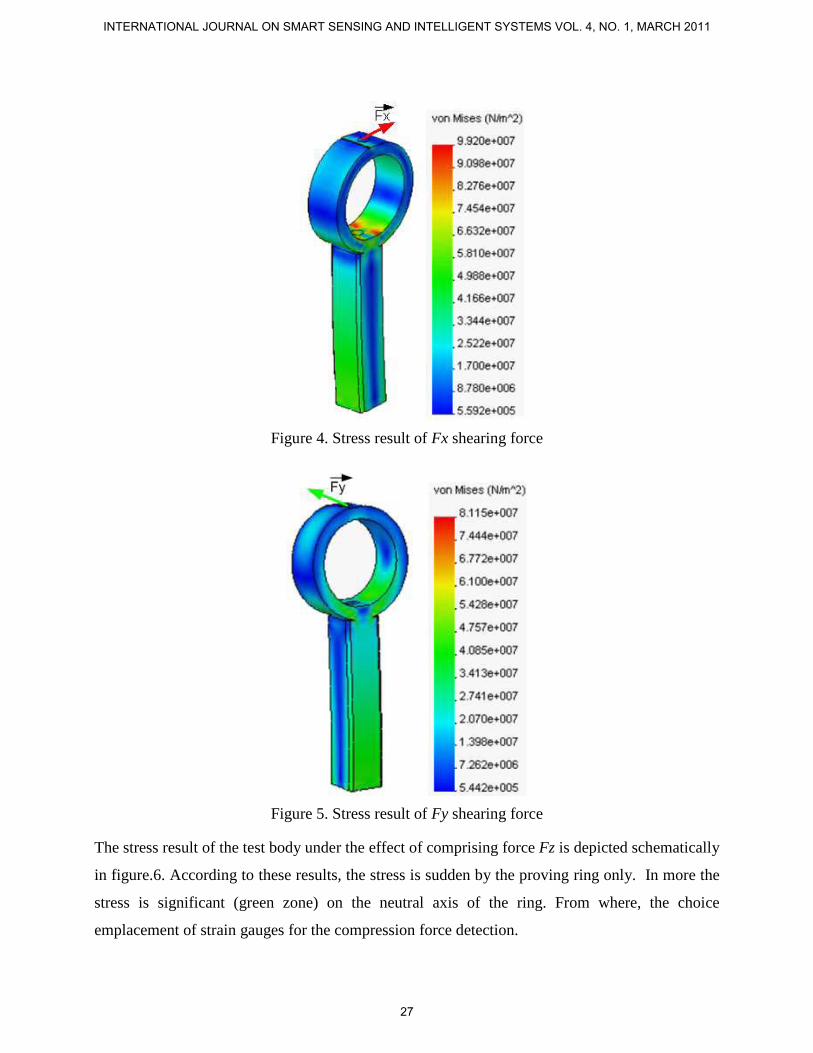
Figure 4. Stress result of Fx shearing force
Figure 5. Stress result of Fy shearing force
The stress result of the test body under the effect of comprising force Fz is depicted schematically
in figure.6. According to these results, the stress is sudden by the proving ring only. In more the
stress is significant (green zone) on the neutral axis of the ring. From where, the choice
emplacement of strain gauges for the compression force detection.
INTERNATIONAL JOURNAL ON SMART SENSING AND INTELLIGENT SYSTEMS VOL. 4, NO. 1, MARCH 2011
27
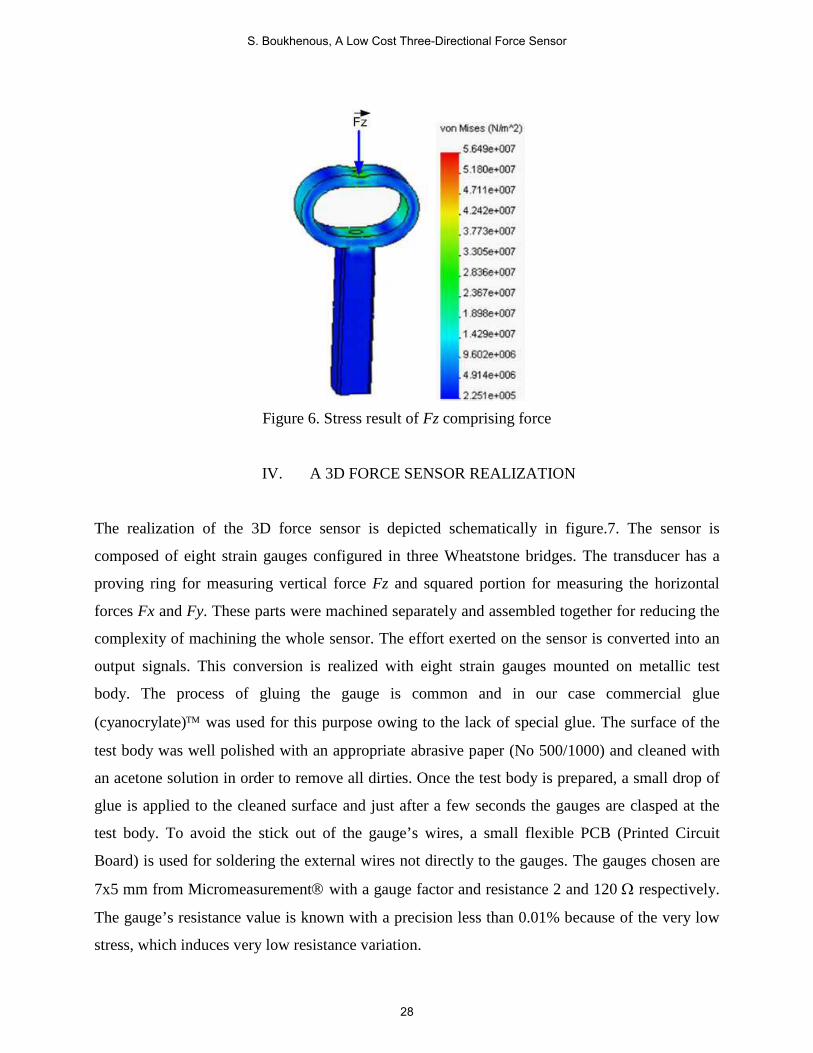
Figure 6. Stress result of Fz comprising force
IV. A 3D FORCE SENSOR REALIZATION
The realization of the 3D force sensor is depicted schematically in figure.7. The sensor is
composed of eight strain gauges configured in three Wheatstone bridges. The transducer has a
proving ring for measuring vertical force Fz and squared portion for measuring the horizontal
forces Fx and Fy. These parts were machined separately and assembled together for reducing the
complexity of machining the whole sensor. The effort exerted on the sensor is converted into an
output signals. This conversion is realized with eight strain gauges mounted on metallic test
body. The process of gluing the gauge is common and in our case commercial glue
(cyanocrylate) was used for this purpose owing to the lack of special glue. The surface of the
test body was well polished with an appropriate abrasive paper (No 500/1000) and cleaned with
an acetone solution in order to remove all dirties. Once the test body is prepared, a small drop of
glue is applied to the cleaned surface and just after a few seconds the gauges are clasped at the
test body. To avoid the stick out of the gauge’s wires, a small flexible PCB (Printed Circuit
Board) is used for soldering the external wires not directly to the gauges. The gauges chosen are
7x5 mm from Micromeasurement with a gauge factor and resistance 2 and 120 Ω respectively.
The gauge’s resistance value is known with a precision less than 0.01% because of the very low
stress, which induces very low resistance variation.
28
S. Boukhenous, A Low Cost Three-Directional Force Sensor
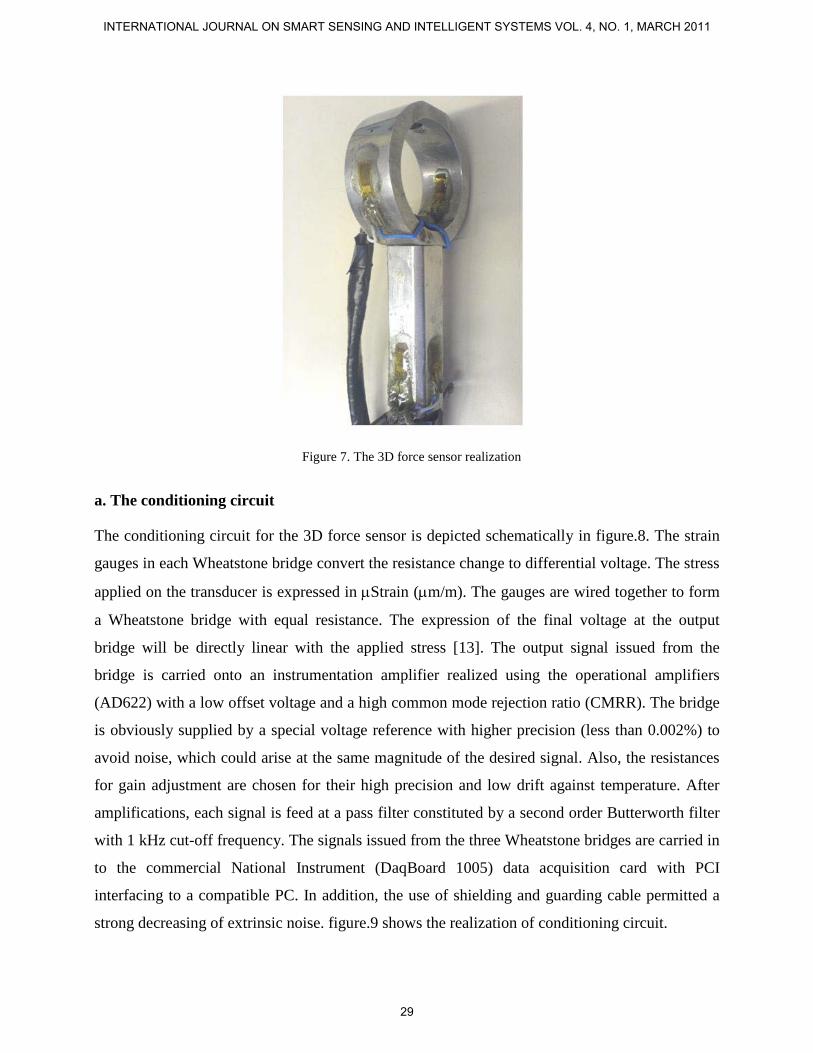
Figure 7. The 3D force sensor realization
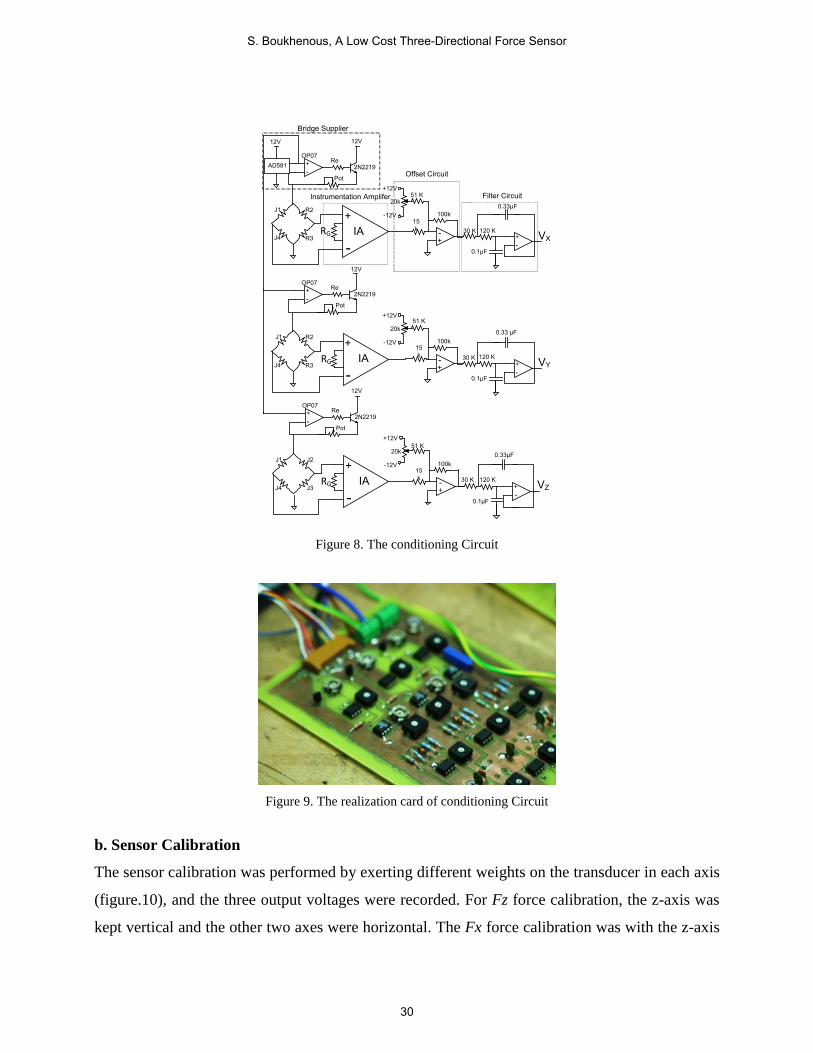
a. The conditioning circuit
The conditioning circuit for the 3D force sensor is depicted schematically in figure.8. The strain
gauges in each Wheatstone bridge convert the resistance change to differential voltage. The stress
applied on the transducer is expressed in µStrain (µm/m). The gauges are wired together to form
a Wheatstone bridge with equal resistance. The expression of the final voltage at the output
bridge will be directly linear with the applied stress [13]. The output signal issued from the
bridge is carried onto an instrumentation amplifier realized using the operational amplifiers
(AD622) with a low offset voltage and a high common mode rejection ratio (CMRR). The bridge
is obviously supplied by a special voltage reference with higher precision (less than 0.002%) to
avoid noise, which could arise at the same magnitude of the desired signal. Also, the resistances
for gain adjustment are chosen for their high precision and low drift against temperature. After
amplifications, each signal is feed at a pass filter constituted by a second order Butterworth filter
with 1 kHz cut-off frequency. The signals issued from the three Wheatstone bridges are carried in
to the commercial National Instrument (DaqBoard 1005) data acquisition card with PCI
interfacing to a compatible PC. In addition, the use of shielding and guarding cable permitted a
strong decreasing of extrinsic noise. figure.9 shows the realization of conditioning circuit.
INTERNATIONAL JOURNAL ON SMART SENSING AND INTELLIGENT SYSTEMS VOL. 4, NO. 1, MARCH 2011
29
+
+-
-IARG
+12V
-12V
20k
100k
+-
+-
2N2219
Pot
ReAD581
12V
OP07
12V
J1 R2
R3J4
+
+-
-IARG
+12V
-12V
20k
100k
+-
+-
2N2219
Pot
ReOP07
12V
R2
R3
+
+-
-IARG
+12V
-12V
20k
100k
+-
+- 2N2219
Pot
ReOP07
12V
J2
J3
J1
J4
J1
J4 VZ
VY
VX
0.33µF
0.1µF
120 K30 K15 k
51 K
0.33 µF
120 K30 K
0.1µF
15 k
51 K
51 K
0.1µF
30 K 120 K15 k
0.33µF
Instrumentation Amplifer
Bridge Supplier
Offset Circuit
Filter Circuit
Figure 8. The conditioning Circuit
Figure 9. The realization card of conditioning Circuit
b. Sensor Calibration
The sensor calibration was performed by exerting different weights on the transducer in each axis
(figure.10), and the three output voltages were recorded. For Fz force calibration, the z-axis was
kept vertical and the other two axes were horizontal. The Fx force calibration was with the z-axis
30
S. Boukhenous, A Low Cost Three-Directional Force Sensor
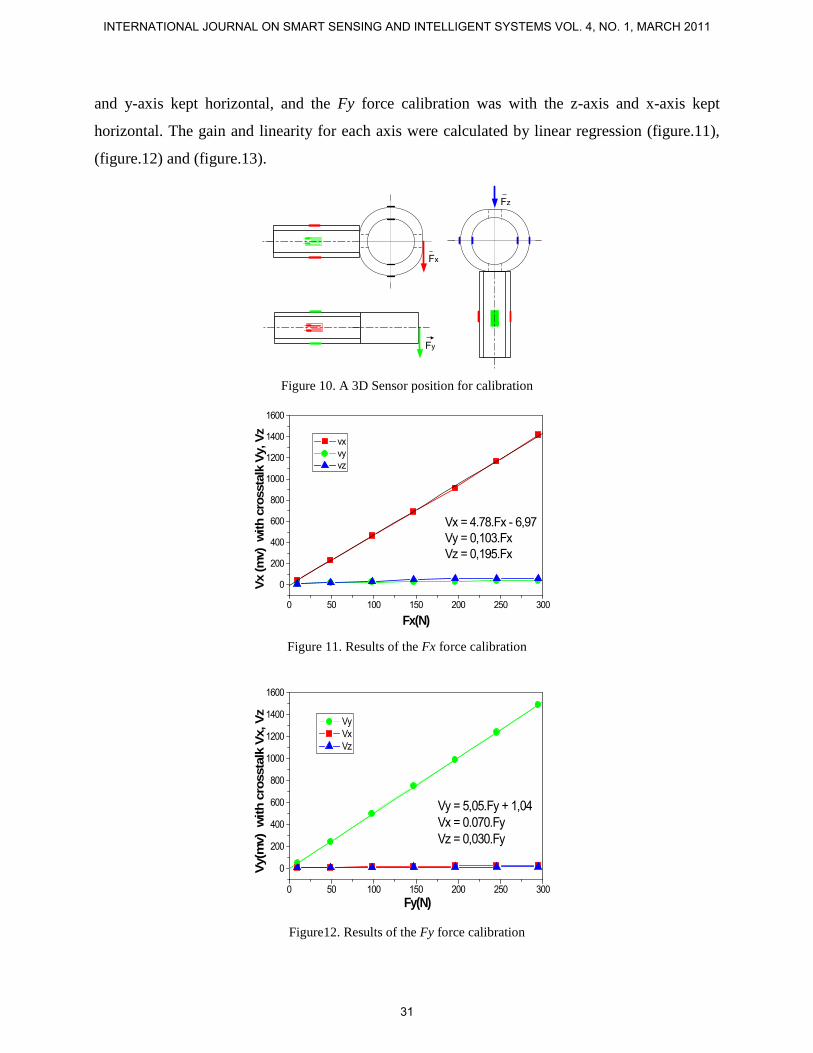
and y-axis kept horizontal, and the Fy force calibration was with the z-axis and x-axis kept
horizontal. The gain and linearity for each axis were calculated by linear regression (figure.11),
(figure.12) and (figure.13).
Fz
Fx
Fy
Figure 10. A 3D Sensor position for calibration
Figure 11. Results of the Fx force calibration
Figure12. Results of the Fy force calibration
0 50 100 150 200 250 300
0
200
400
600
800
1000
1200
1400
1600
Vy = 5,05.Fy + 1,04Vx = 0.070.FyVz = 0,030.Fy
Vy Vx Vz
Vy(m
v) w
ith c
ross
talk
Vx,
Vz
Fy(N)
0 50 100 150 200 250 300
0
200
400
600
800
1000
1200
1400
1600
Vx = 4.78.Fx - 6,97Vy = 0,103.FxVz = 0,195.Fx
vx vy vz
Vx (m
v) w
ith c
ross
talk
Vy,
Vz
Fx(N)
INTERNATIONAL JOURNAL ON SMART SENSING AND INTELLIGENT SYSTEMS VOL. 4, NO. 1, MARCH 2011
31
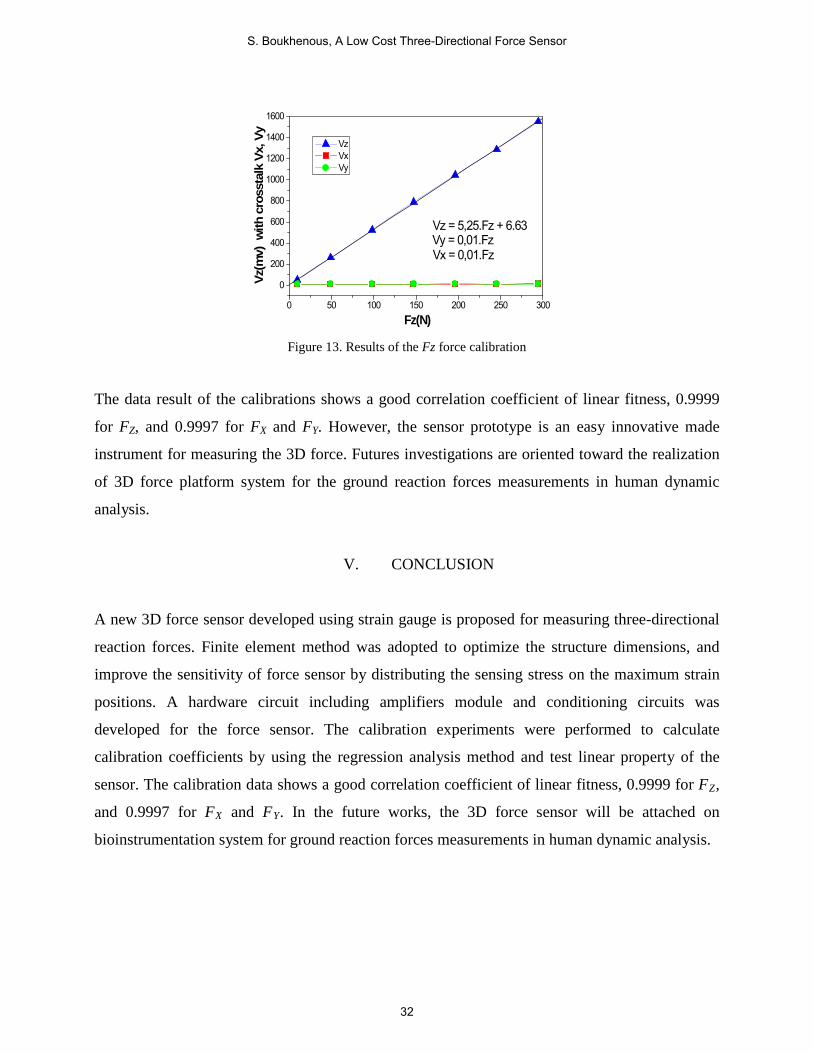
Figure 13. Results of the Fz force calibration
The data result of the calibrations shows a good correlation coefficient of linear fitness, 0.9999
for FZ, and 0.9997 for FX and FY. However, the sensor prototype is an easy innovative made
instrument for measuring the 3D force. Futures investigations are oriented toward the realization
of 3D force platform system for the ground reaction forces measurements in human dynamic
analysis.
V. CONCLUSION
A new 3D force sensor developed using strain gauge is proposed for measuring three-directional
reaction forces. Finite element method was adopted to optimize the structure dimensions, and
improve the sensitivity of force sensor by distributing the sensing stress on the maximum strain
positions. A hardware circuit including amplifiers module and conditioning circuits was
developed for the force sensor. The calibration experiments were performed to calculate
calibration coefficients by using the regression analysis method and test linear property of the
sensor. The calibration data shows a good correlation coefficient of linear fitness, 0.9999 for FZ,
and 0.9997 for FX and FY
. In the future works, the 3D force sensor will be attached on
bioinstrumentation system for ground reaction forces measurements in human dynamic analysis.
0 50 100 150 200 250 300
0
200
400
600
800
1000
1200
1400
1600
Vx = 0,01.FzVy = 0,01.FzVz = 5,25.Fz + 6.63
Vz Vx Vy
Vz(m
v) w
ith c
ross
talk
Vx,
Vy
Fz(N)
32
S. Boukhenous, A Low Cost Three-Directional Force Sensor
REFERENCES
[1] C.M. kim and J.J. Eng, “Magnitude and pattern of 3D kinematic and kinetic gait profiles in
persons with stroke: relationship to walking speed,” Gait and Posture, vol. 20, pp. 140-146, 2004.
[2] M. Casadio, P.G. Morasso and V. Sanguineti, “Direct measurement of ankle stiffness during
quiet standing: implications for control modelling and clinical application,” Gait and Posture, vol.
21, pp. 410-424, 2005.
[3] Eiji Matsumoto and Yuji Komagome, “Intelligent structural elements covered by
piezoelectric high-polymer film,” International Journal on Smart Sensing and Intelligent Systems,
s2is, www.s2is.org, vol. 1, no. 2, June 2008.
[4] S. Boukhenous and M. Attari, “A plantar pressure instrument for ankle rehabilitation,” in
Proc. 4th International Conference on Sensing Technology, ICST’2010, Lecce, Italy, pp. 492-
494, June 3-5, 2010.
[5] S. Boukhenous and M. Attari, “A low cost instrumentation based sensor array for ankle
rehabilitation,” Chapter Book: Biomedical Engineering, trends in Electronics, Communications
and Software,ISBN 978-953-307-475-7,InTech Publicher,www.InTech.Org, pp. 69-78, Jan 2011.
[6] L. Beccai, S. Roccella, A. Arena, F. Valvo, P. Valdastri, A. Menciassi, M.C. Carroza and P.
Dario “Design and fabrication of hybrid silicon three-axial force sensor for biomechanical
applications,” Sensors and Actuators A: Physical, vol. 120, pp. 370-382, 2005.
[8] S. Boukhenous, M. Attari and N. Ababou, “A dynamic study of a foot-to-floor interaction
during a vertical jumping,” AMSE journals, vol. 75, no. 1, pp. 41- 49, 2006.
[7] R.K. Begg, S.M. Rahman, “A Method for the reconstruction of ground reaction force-time
characteristics during gait from force platform recordings of simultaneous foot falls,” IEEE
Trans. Biomed. Eng., vol. 47, no.4, pp 547-551, 2000.
[9] S. Boukhenous, M. Attari and N. Ababou, “A strain gauges platform for vertical jumping
study,” Seventh International Symposium on Signal Processing and its Applications, IEEE-
ISSP’2003, Paris, France, ISBN 0-7803-7946-2, vol.2, pp. 13-16, July 2003.
[10] E. Vazsonyi, M. Adam, Cs. Dusco, Z. Vizvary, A. L. Toth and I. Barsony, “Three-
dimensional force sensor by novel alkaline etching technique,” Sensors and Actuators: A.
Physical, vol. 123-124, pp. 620-626, 2005.
INTERNATIONAL JOURNAL ON SMART SENSING AND INTELLIGENT SYSTEMS VOL. 4, NO. 1, MARCH 2011
33
[11] Z. Jin and R. Kobetic, “Rail Supporting Transducer Posts for Three-Dimensional Force
Measurement,”IEEE Trans. On Rehab. Eng, vol. 5, no. 4, pp. 380-387, Dec. 1997.
[12] W.C. Young, Roark’s Formulas for Stress and Strain, 6th Edition, New York, McGraw-Hill,
1989.
[13] J. G. Webster, Handbook of Measurement Instrumentation Sensors, CRC Press LLC, 1999.
34
S. Boukhenous, A Low Cost Three-Directional Force Sensor