Embed Size (px)
Citation preview
1
Felix Englund Örn
Degree project for Master of Science in Biology
Animal Ecology, 60 hec, vt 2017
Department of Biological and Environmental Sciences
University of Gothenburg
Supervisor: Charlotta Kvarnemo
Examiner: Staffan Andersson
A look into salinity tolerance of the round Goby:
A tale of two salinities
2
Table of contents Abstract ................................................................................................................................................. 3
Introduction ................................................................................................................................................... 3
Aims & Predictions ........................................................................................................................................ 6
Method .......................................................................................................................................................... 7
Fish sampling, upkeep and acclimatization ........................................................................................... 7
Figure 1. ................................................................................................................................................. 8
Table 1. .................................................................................................................................................. 9
Table 2 ................................................................................................................................................. 10
Figure 2 ................................................................................................................................................ 11
Behavioral Experiment 1: Activity ....................................................................................................... 11
Behavioral Experiment 2: Salinity Choice ............................................................................................ 11
Figure 3. ............................................................................................................................................... 12
Statistics & null hypothesis .................................................................................................................. 12
Figure 4. ............................................................................................................................................... 13
DNA Extractions ................................................................................................................................... 14
DNA Concentrations ............................................................................................................................ 14
Results ..................................................................................................................................................... 15
Behavioral Experiment 1: Activity ....................................................................................................... 15
Figure 5 ................................................................................................................................................ 15
Behavioral Experiment 2: Salinity Choice ............................................................................................ 15
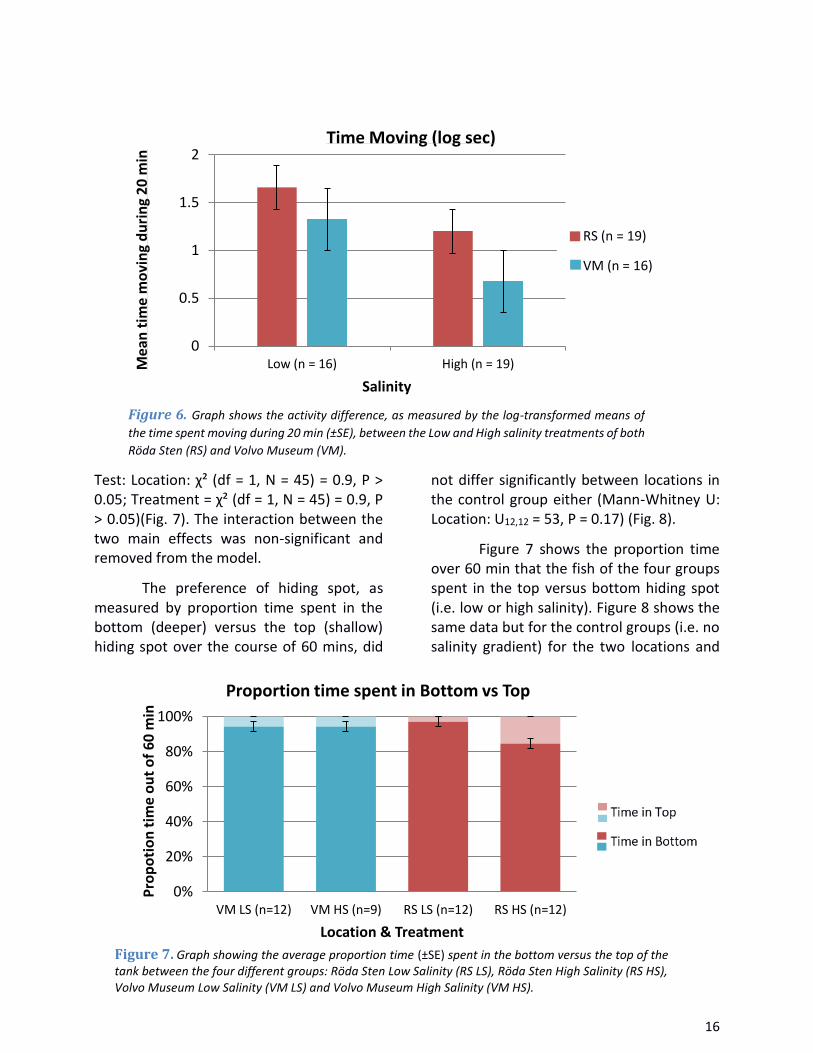
Figure 6. ............................................................................................................................................... 16
Discussion ................................................................................................................................................ 17
Figure 7. ............................................................................................................................................... 16
Figure 8. ............................................................................................................................................... 17
Acknowledgements ............................................................................................................................. 20
References ................................................................................................................................................... 21
3
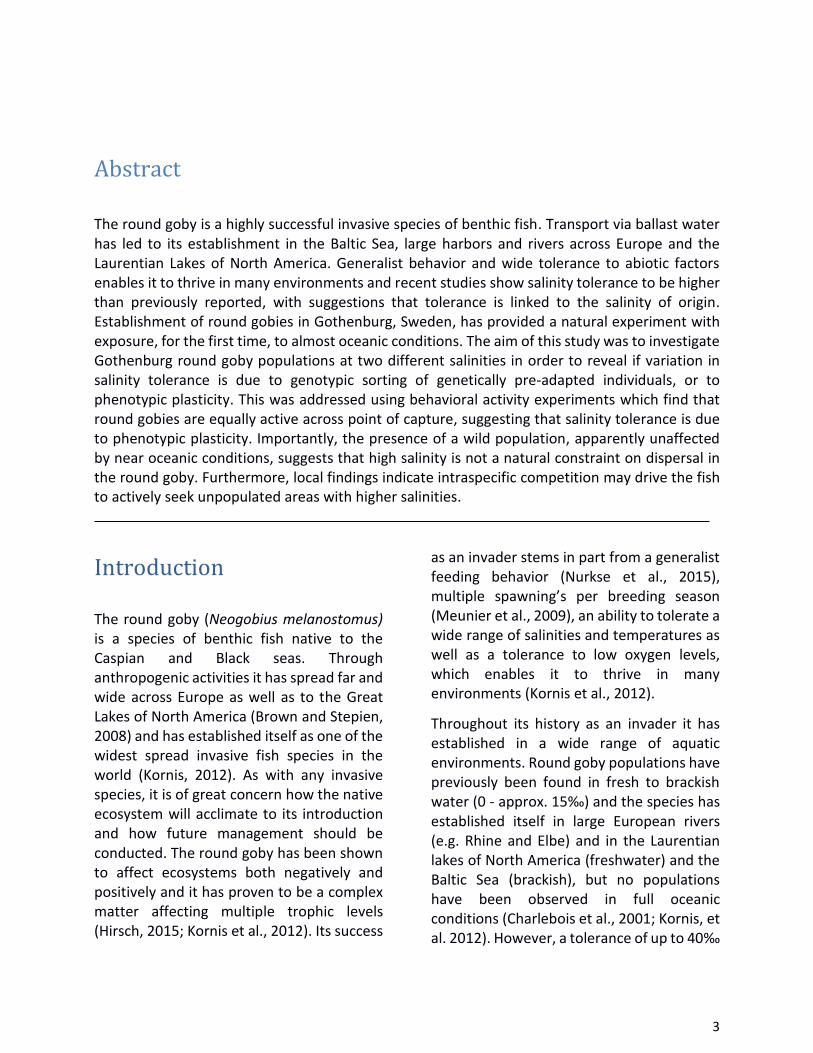
Abstract
The round goby is a highly successful invasive species of benthic fish. Transport via ballast water has led to its establishment in the Baltic Sea, large harbors and rivers across Europe and the Laurentian Lakes of North America. Generalist behavior and wide tolerance to abiotic factors enables it to thrive in many environments and recent studies show salinity tolerance to be higher than previously reported, with suggestions that tolerance is linked to the salinity of origin. Establishment of round gobies in Gothenburg, Sweden, has provided a natural experiment with exposure, for the first time, to almost oceanic conditions. The aim of this study was to investigate Gothenburg round goby populations at two different salinities in order to reveal if variation in salinity tolerance is due to genotypic sorting of genetically pre-adapted individuals, or to phenotypic plasticity. This was addressed using behavioral activity experiments which find that round gobies are equally active across point of capture, suggesting that salinity tolerance is due to phenotypic plasticity. Importantly, the presence of a wild population, apparently unaffected by near oceanic conditions, suggests that high salinity is not a natural constraint on dispersal in the round goby. Furthermore, local findings indicate intraspecific competition may drive the fish to actively seek unpopulated areas with higher salinities.
Introduction
The round goby (Neogobius melanostomus) is a species of benthic fish native to the Caspian and Black seas. Through anthropogenic activities it has spread far and wide across Europe as well as to the Great Lakes of North America (Brown and Stepien, 2008) and has established itself as one of the widest spread invasive fish species in the world (Kornis, 2012). As with any invasive species, it is of great concern how the native ecosystem will acclimate to its introduction and how future management should be conducted. The round goby has been shown to affect ecosystems both negatively and positively and it has proven to be a complex matter affecting multiple trophic levels (Hirsch, 2015; Kornis et al., 2012). Its success
as an invader stems in part from a generalist feeding behavior (Nurkse et al., 2015), multiple spawning’s per breeding season (Meunier et al., 2009), an ability to tolerate a wide range of salinities and temperatures as well as a tolerance to low oxygen levels, which enables it to thrive in many environments (Kornis et al., 2012).
Throughout its history as an invader it has established in a wide range of aquatic environments. Round goby populations have previously been found in fresh to brackish water (0 - approx. 15‰) and the species has established itself in large European rivers (e.g. Rhine and Elbe) and in the Laurentian lakes of North America (freshwater) and the Baltic Sea (brackish), but no populations have been observed in full oceanic conditions (Charlebois et al., 2001; Kornis, et al. 2012). However, a tolerance of up to 40‰
4
has been reported (Kullander et al. 2012), although Kornis et al. (2012) noted that these results derive from the Caspian Sea and Aral Sea. In these oceans CaSO4 is the dominant salt molecule, not NaCl like in most oceans where oceanic conditions of approx. 30-40 PSU is presumably above their tolerance. As the species continues to expand, areas hosting such conditions will are likely to be met. One such area is the ongoing establishment in Swedish waters. First recorded in the country in 2008 (Karlskrona, 56°9′39″N 15°35′10″E), the round goby has subsequently established itself in various parts of Sweden, including the archipelago of Karlshamn (56°10′12″N 14°51′47″E) and Stockholm (59°19′46″N 18°4′7″E), the islands Gotland (57°30′N 18°33′E) and Öland (56°44′N 16°40′E) as well as the harbor of Gothenburg (57°42′25″N 11°57′59″E) (Brockmark, 2016). The Gothenburg estuary features a halocline where freshwater flows from the river Göta älv and saltwater pushes in from Kattegatt creating a complex and shifting body of brackish water. Kattegat itself is connected to the North Sea, which is an area of higher oceanic salinities that is not yet hosting any known round goby populations. If individuals in the Gothenburg estuary and populations in similar areas were to disperse, then salinity could be a factor limiting dispersal, both to areas of higher and lower salinities. This region therefore hosts a natural experiment where the potential for round goby to spread to higher oceanic conditions, e.g. the North Sea (approx. 35‰), is likely to unfold, marking it as an important region to track the round goby establishment and spread.
An establishment in a new environment, with new selective pressures, such as high salinity, sets the stage for local adaptation. Local adaptation, where locally evolved genotypes have higher relative fitness in the local environment compared the other environment (Kawecki and Ebert, 2004; Savolainen, Lascoux and Merilä, 2013), is one likely reason for the success of an invading species. Local adaptations for dispersal abilities have been shown to be especially frequent at the front of expanding ranges, where individuals experience less intraspecific competition due to low population densities. This has been shown in a classic example of an invasive species the cane toad (Rhinella marina). Studies have shown changes in skeletal morphology, behavior and even a reduced immune system response, facilitating further dispersal (Hudson et al., 2016; Brown, Phillips and Shine, 2014; Brown and Shine, 2014). Front range specific changes also occur in the round goby as shown by Azour et al. (2015), with individuals at the forefront of a distribution range exhibiting faster growth and higher welfare due to less intraspecific competition for food. Similarly, Thorlacius et al. (2015) found personality dependent dispersal, with round goby individuals caught at the invasion front being more prone to disperse sooner and exhibit higher activity, whereas there was no correlation between activity and dispersal among individuals from old populations suggesting this behavior is lost as the population gets older.
The individuals at the front of the invasion will be the first to face new salinities and thus we might expect them to develop
5
local adaptations to different salinities. But what occurs when they enter into new salinities? Change in salinity will be a physiological challenge due to the energetic demands of a higher degree of osmoregulation conducted by the fish. This higher demand is because of the discrepancy between internal osmotic and external environmental salt levels which the fish must handle to keep in balance (Hempel and Thiel, 2015). Studies conducted by Ellis and MacIsaac (2009) and Karsiotis et al. (2012) indicated that the round goby salinity tolerance limit was at around 20‰, whereas all specimens in the experiment died within a month of exposure to salinities between 25‰ and 30‰. However, recent studies by Hemple and Thiel (2015) and Behrens, van Deurs and Christensen (2017) found different results with indications that the tolerance is as high as 30‰. An explanation, offered for their non-congruent results by Hempel and Thiel (2015), is that the fish in the three experiments were of different origins. The individuals unable to cope with higher salinities in both Ellis and MacIsaac (2009) and Karsiotis et al. (2012) experiments were of freshwater origin whilst the individuals in Hemple and Thiel’s (2015) experiment were from brackish waters. Behrens, van Deurs and Christensen (2017) offer the same explanation and also highlight that their salinity acclimatization occurred at a slower pace than the experiments conducted by Ellis and MacIsaac (2009) and Kariotis et al. (2012). This therefore suggests that the origin of invading individuals is likely to influence the round gobies’ ability to invade new regions.
The Gothenburg population has yet to be investigated and could provide new insights into the matter of salinity tolerance. Gothenburg features the largest harbor among the Scandinavian countries with a total of 11 000 ships making land at the harbor each year (Göteborgs Hamn, 2013). Proximity to large cargo ports has been linked to the round goby distribution pattern in the Baltic Sea (Kotta et al., 2016) and studies have shown that certain populations in the region are genetically similar to those from Kerson, Ukraine, which is a major port in the Black Sea (Ojaveer et al., 2015), suggesting ballast water is a key vector of invasion. It is thus presumed that the round goby introduction, or even multiple introductions, to Gothenburg also have occurred through ballast water. Through its invasion and establishment across Europe, different round goby populations might have become adapted to different salinities in different ports over time since their first introduction. Individuals in the harbor of Gothenburg might then already be adapted to a specific salinity range upon arrival. When discharged, larvae from divergent genetic backgrounds could experience a higher fitness if they manage to seek out water in the river mouth more akin to their native range of salinity. If so, a genetic sorting across the salinity gradient in the harbor would be expected to occur, meaning individuals establishing themselves in higher or lower salinities might differ genetically due to differing origins. This is one of the explanations that has been proposed to occur when divergent genotypes are introduced into a new range and is reported to be a likely explanation for the expansion of the green shore crab (Carcinus maenas)
6
along the North-East Pacific shoreline (Rius et al., 2014). Alternative explanations why the round goby might manage establishment in different salinities are an unusually wide individual tolerance to salinity or because of phenotypic plasticity; “the direct influence of the environment on individual phenotypes through developmental mechanisms” (Chevin, Lande and Mace, 2010). Phenotypic plasticity has been argued to alleviate ecological pressures, permitting survival and establishment in novel environments (Price, Qvarnström and Irwin, 2003, Moran and Alexander, 2014).
Aims & Predictions
The aim of this study was to investigate the Gothenburg round goby population in hopes to reveal more about the species relation to salinity, an abiotic factor that might limit their dispersal. This matters specifically if the salinity tolerance within the species is driven by genetic adaptations or phenotypic plasticity. The study also offers a first view into the geographic range the round goby inhabits in the Gothenburg estuary, as the species has not been investigated before in this area. The methods with which I aimed to achieve this were through a genetic analysis and behavioral experiments.
By producing Genotyping-By-Sequencing (GBS) data (as described by Elshire et al. 2011) from two localities in Gothenburg and four other populations in Europe, representing habitats of various salinities, a bioinformatic analysis of the genetic data could establish if there are certain genotypes associated with either low or high salinity. If these exist it would suggest
the round goby has undergone adaptation to higher and lower salinities. If this is true between fish caught at different salinities in the estuary of Gothenburg, it would suggest that genetic sorting has occurred. However, if populations do not reveal genetic differentiation or if it is not correlated with salinity, it suggests origin of invading fish matters less regarding success of establishment. Unfortunately, due to the time frame of this project, the genetic analysis could not be done in time for proper annotation of the genotypes. These results are as such not presented here but will be included in future studies. Nevertheless, since a large part of my Master project was devoted to sampling and preparation for DNA sequencing, I have been advised by my supervisor to report the methods of this work in the method section below.
Two different behavioral experiments were conducted to investigate the preference of salinity and a measure of the general activity of the round goby. The round goby used in these experiments were from two different locations in Gothenburg harbor that differ in salinity. These fish had been acclimatized to a high (30 PSU) or a low (0.1 PSU) salinity, resulting in four groups of fish. Comparison between groups allowed for analysis of the general activity, as measured by time spent moving over time, depending on which salinity they had been acclimatized to, between and within location of capture. My assumption was that fish caught in a relatively low salinity would show a higher level of activity when acclimatized to a low salinity rather a high salinity due to the extra cost of osmoregulation and vice versa. The same logic was applied to a
7
salinity choice test where a choice between high and low salinity represented the salinity where they had been caught and the salinity at which they have been acclimatized to. The activity and choice of salinity could indicate if the coping mechanism to salinity is a genetic or phenotypic one. If both activity and choice are correlated to location rather than to which salinity they have been acclimatized to it would suggest the round goby seeks out a certain salinity. However, if no correlation is found, it would suggest that it is more likely that the round goby is able to cope in both a high and low salinity due plasticity. The information from these results will also be valuable upon interpretation of the results from the genetic study in the near future.
The two main hypotheses of the study are the following:
1. Fish from a high saline point of capture should a) choose a high salinity over a low salinity when presented with the choice and b) show a higher level of activity when acclimatized to a high salinity than to a low salinity (vice versa for fish from a low saline point of capture). This could indicate that fish from the two locations are adapted to a lower and higher salinity, suggesting individuals in the Gothenburg harbor might differ genetically due to a genetic sorting event.
2. If the round goby does not show more activity or a salinity-based
preference correlated with point of capture it suggests a lack of genotypic sorting. It also suggests that the round goby has a tolerance to high and low salinity through a phenotypically plastic response.
Method
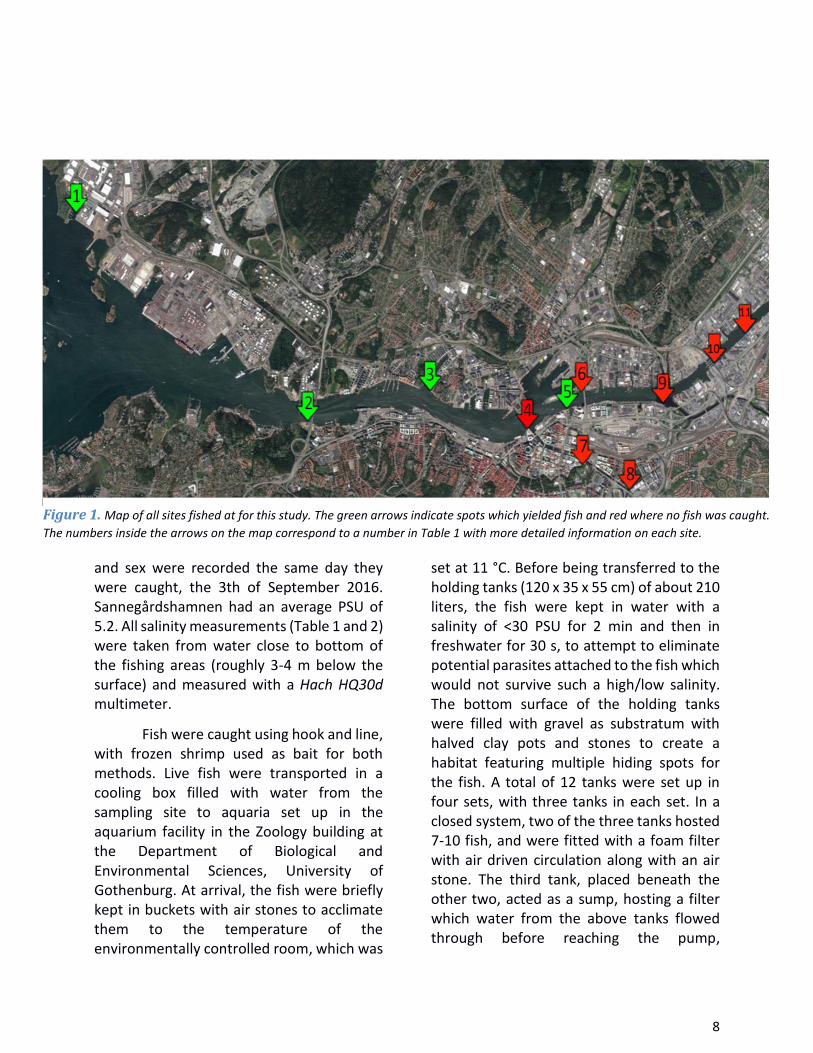
Fish sampling, care and acclimatization Specimens of round goby were caught in the river and river mouth of Göta älv in the city of Gothenburg (57°42′25″N 11°57′59″E) on the west coast of Sweden. Since no study on round goby has previously been conducted in the Gothenburg area, the extent of its spread was not fully known. As such, eleven locations around Gothenburg of various salinities were fished at, four of which yielded fish (Fig. 1).
Fish from two of the locations were used in the behavioral studies and a third one was sampled for data collection in the form of fins clips (DNA sampling), weight, length and sex recordings.
The first location was Röda Sten (57°41'22.5"N 11°54'05.2"E) with an average salinity of 8.6 PSU. Specimens at this site were caught on the 26th and 27th of September 2016. The second location, Volvo Museum (57°41'41.1"N 11°48'57.5"E), had an average salinity of 24.3 PSU with measurements reaching as high as 29.5 PSU. Specimens at this site were caught on the 6th, 10th, 14th and
20th of October 2016. No fish from the third location, Sannegårdshamnen (57°42'10.4"N
11°55'39.5"E), were kept alive, but caudal fins were sampled and the length, weight
8
and sex were recorded the same day they were caught, the 3th of September 2016. Sannegårdshamnen had an average PSU of 5.2. All salinity measurements (Table 1 and 2) were taken from water close to bottom of the fishing areas (roughly 3-4 m below the surface) and measured with a Hach HQ30d multimeter.
Fish were caught using hook and line, with frozen shrimp used as bait for both methods. Live fish were transported in a cooling box filled with water from the sampling site to aquaria set up in the aquarium facility in the Zoology building at the Department of Biological and Environmental Sciences, University of Gothenburg. At arrival, the fish were briefly kept in buckets with air stones to acclimate them to the temperature of the environmentally controlled room, which was
set at 11 °C. Before being transferred to the holding tanks (120 x 35 x 55 cm) of about 210 liters, the fish were kept in water with a salinity of <30 PSU for 2 min and then in freshwater for 30 s, to attempt to eliminate potential parasites attached to the fish which would not survive such a high/low salinity. The bottom surface of the holding tanks were filled with gravel as substratum with halved clay pots and stones to create a habitat featuring multiple hiding spots for the fish. A total of 12 tanks were set up in four sets, with three tanks in each set. In a closed system, two of the three tanks hosted 7-10 fish, and were fitted with a foam filter with air driven circulation along with an air stone. The third tank, placed beneath the other two, acted as a sump, hosting a filter which water from the above tanks flowed through before reaching the pump,
Figure 1. Map of all sites fished at for this study. The green arrows indicate spots which yielded fish and red where no fish was caught.
The numbers inside the arrows on the map correspond to a number in Table 1 with more detailed information on each site.
9
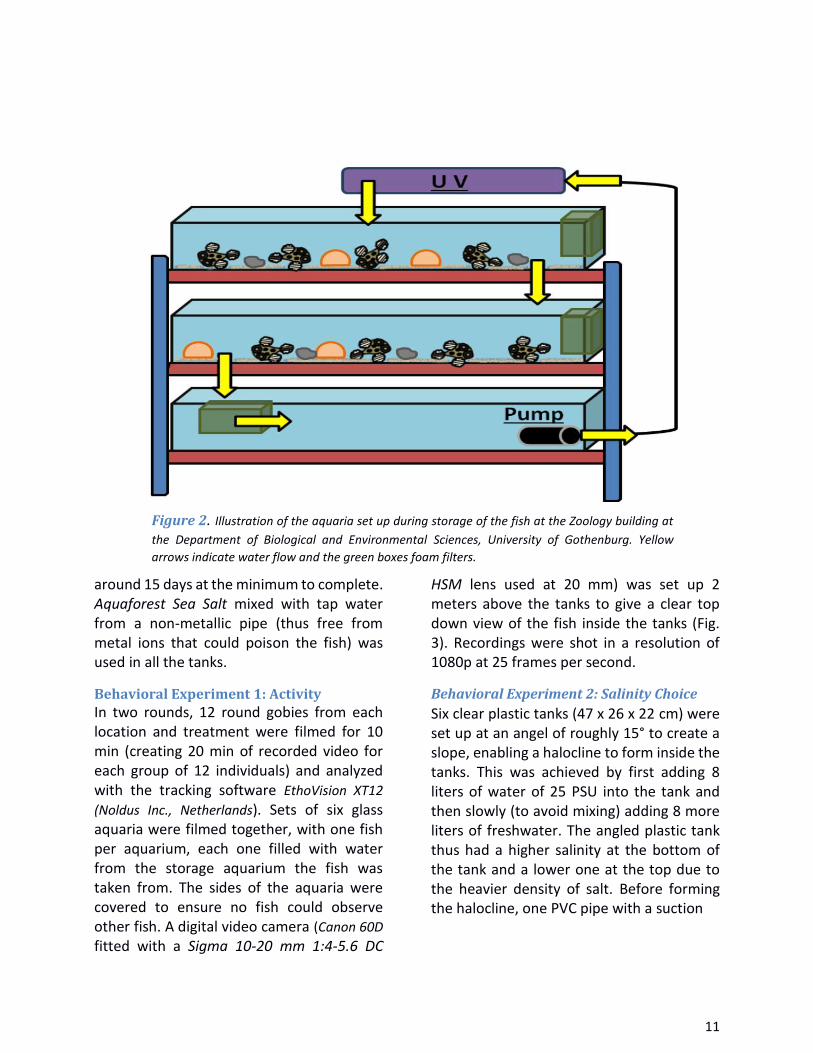
circulating it to the top tank where it reached a Vecton V2 600 Ultraviolet Water Steriliser fitted with a 25W G25T8 UV Lamp to further clean the water Fig. 2). Water in the bottom tank was replaced every week and filters were cleaned in order to keep nutrients from accumulating to hazardous levels. Water temperature was determined by the air temperature of the room, which as mentioned was set to 11 °C. The light cycle was set to a 12-hour-light: 12-hour-dark photoperiod with 4 fluorescent lights
installed on the ceiling 2.4 m up in the middle of the room. Fish were feed once a day, 7 days a week. During weekdays, they were fed 5 g of 2 mm fish pellets and one 3-g cube of Ocean Nutrition Krill Pacifica and during weekends they were fed 3 g of pellets. Tanks were cleaned for leftover food every weekday. The water in the aquaria was gradually changed (lowered or raised) to different salinities, creating four different treatments groups in total. One group of fish from the low salinity environment of Röda
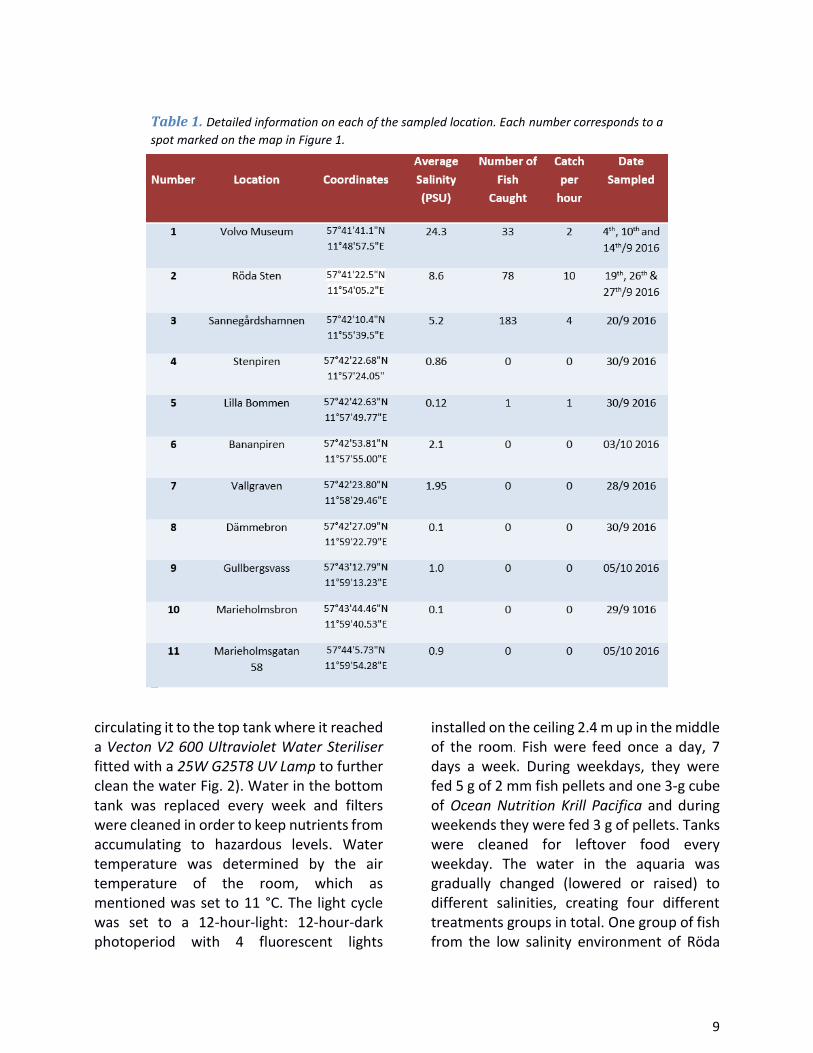
Table 1. Detailed information on each of the sampled location. Each number corresponds to a
spot marked on the map in Figure 1.
10
Sten was ramped to 30 PSU (High Salinity, HS) and another group to 0.1 PSU (i.e. the salinity of the tap water at the facility) (Low Salinity, LS). The same was done for the fish from the higher salinity locality Volvo museum creating the following groups: Röda Sten HS (N = 18), Volvo Museum HS (N = 15), Röda Sten LS (N = 18) and Volvo Museum LS (N = 15). Before the salinity of the water was changed to these two different treatments, fish from both localities were first kept at a salinity akin to salinity where they were caught, then the salinity was ramped to 15 PSU for all fish and allowed to acclimatize, before the final four groups were created. All salinity changes occurred with a maximum of 1 PSU a day, meaning a change to 30 or 0.1 PSU took around 15 days at the minimum to complete. Aquaforest Sea Salt mixed with tap water from a non-metallic pipe (thus free from metal ions that could poison the fish) was used in all the tanks. The water in the
aquaria was gradually changed (lowered or raised) to different salinities, creating four different treatments groups in total. One group of fish from the low salinity environment of Röda Sten was ramped to 30 PSU (High Salinity, HS) and another group to 0.1 PSU (i.e. the salinity of the tap water at the facility) (Low Salinity, LS). The same was done for the fish from the higher salinity locality Volvo museum creating the following groups: Röda Sten HS (N = 18), Volvo Museum HS (N = 15), Röda Sten LS (N = 18) and Volvo Museum LS (N = 15). Before the salinity of the water was changed to these two different treatments, fish from both localities were first kept at a salinity akin to salinity where they were caught, then the salinity was ramped to 15 PSU for all fish and allowed to acclimatize, before the final four groups were created. All salinity changes occurred with a maximum of 1 PSU a day, meaning a change to 30 or 0.1 PSU took
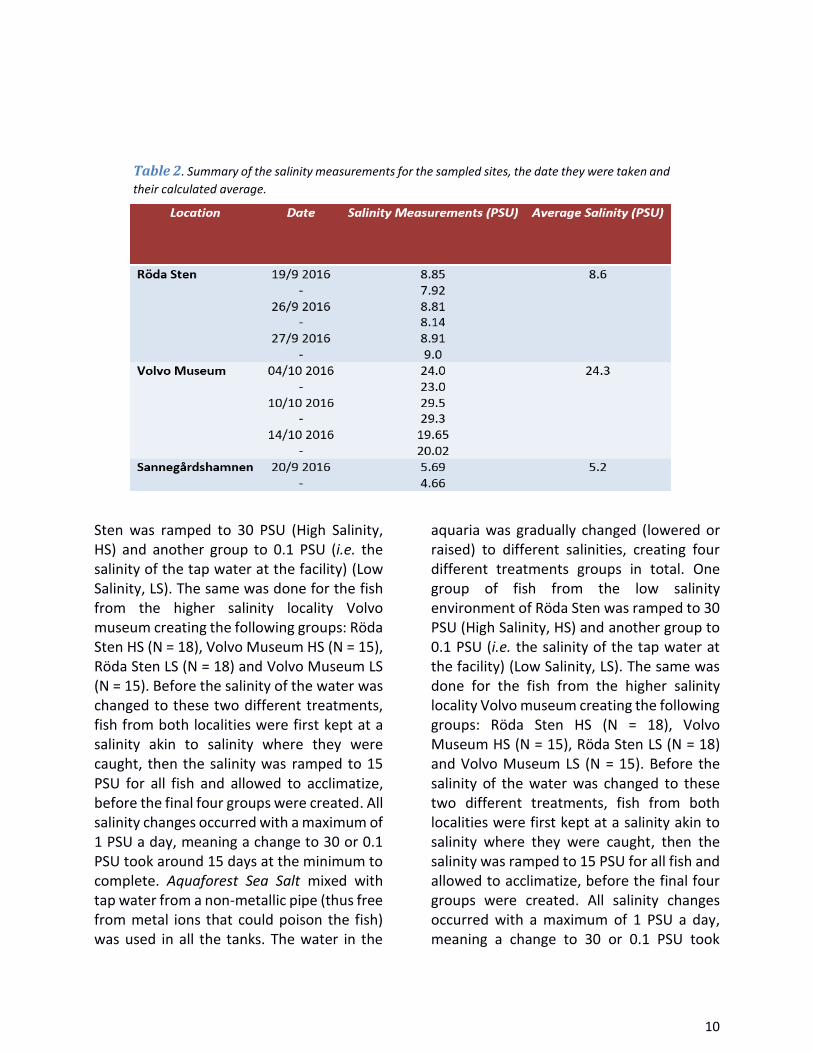
Table 2. Summary of the salinity measurements for the sampled sites, the date they were taken and
their calculated average.
11
around 15 days at the minimum to complete. Aquaforest Sea Salt mixed with tap water from a non-metallic pipe (thus free from metal ions that could poison the fish) was used in all the tanks.
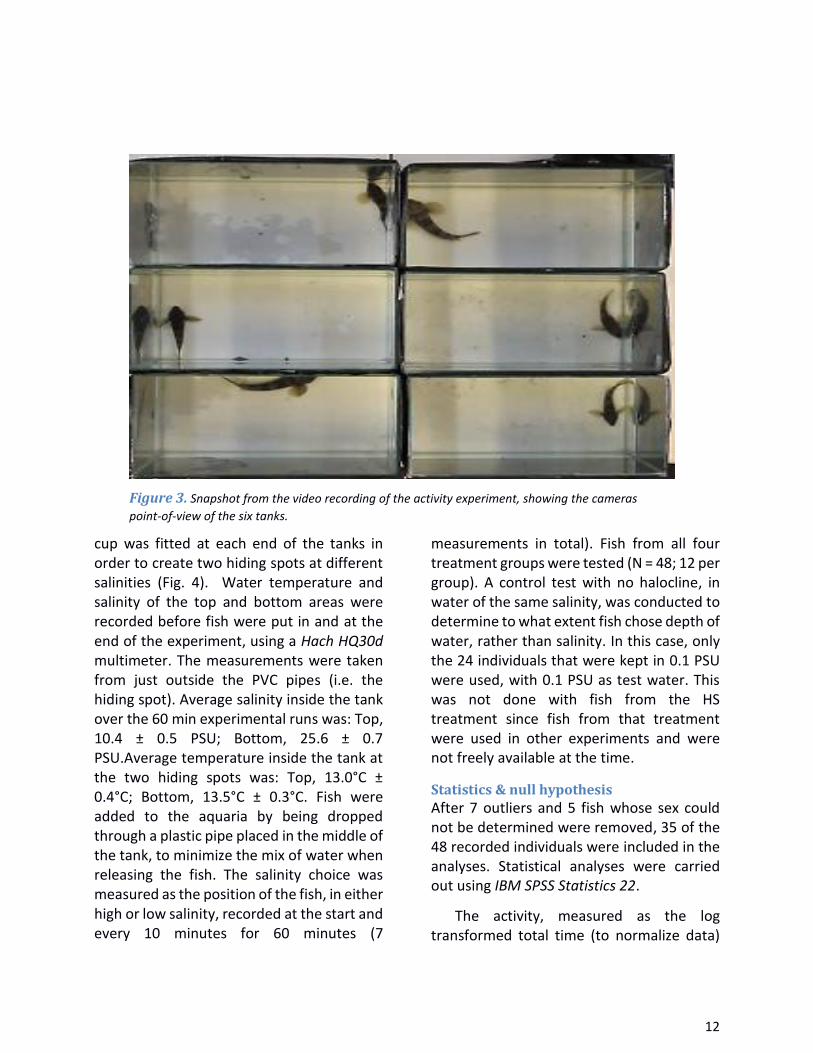
Behavioral Experiment 1: Activity In two rounds, 12 round gobies from each location and treatment were filmed for 10 min (creating 20 min of recorded video for each group of 12 individuals) and analyzed with the tracking software EthoVision XT12
(Noldus Inc., Netherlands). Sets of six glass aquaria were filmed together, with one fish per aquarium, each one filled with water from the storage aquarium the fish was taken from. The sides of the aquaria were covered to ensure no fish could observe other fish. A digital video camera (Canon 60D fitted with a Sigma 10-20 mm 1:4-5.6 DC
HSM lens used at 20 mm) was set up 2 meters above the tanks to give a clear top down view of the fish inside the tanks (Fig. 3). Recordings were shot in a resolution of 1080p at 25 frames per second.
Behavioral Experiment 2: Salinity Choice
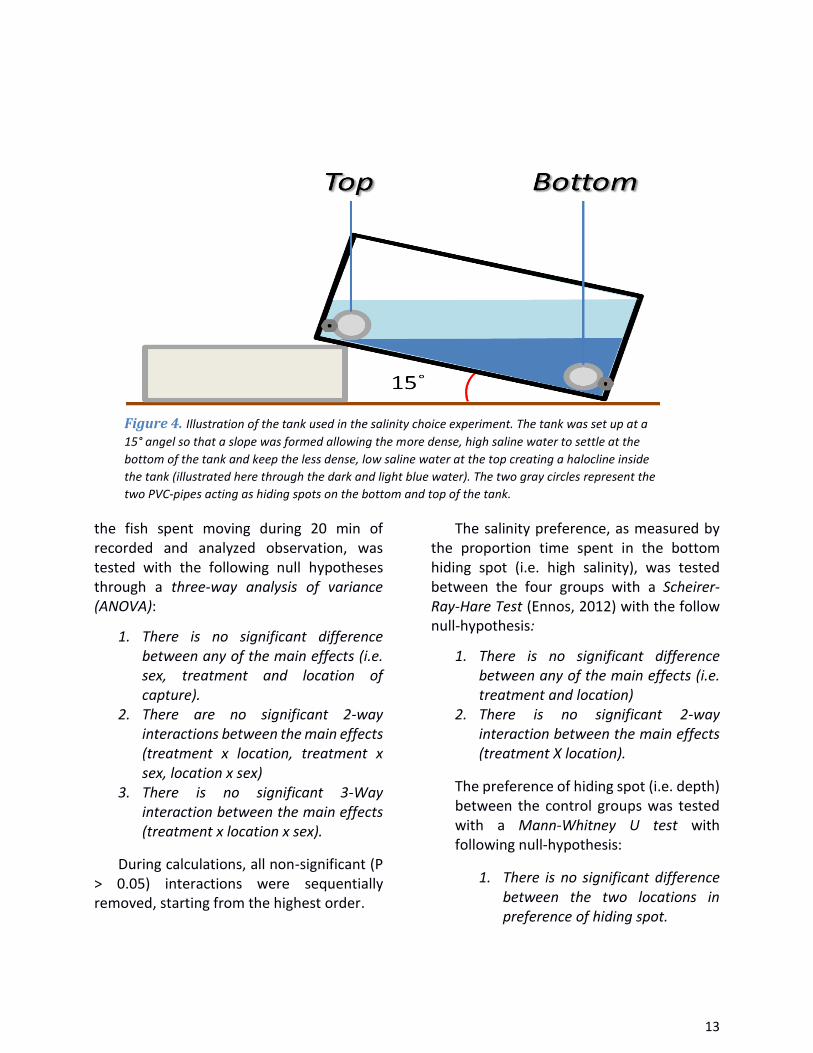
Six clear plastic tanks (47 x 26 x 22 cm) were set up at an angel of roughly 15° to create a slope, enabling a halocline to form inside the tanks. This was achieved by first adding 8 liters of water of 25 PSU into the tank and then slowly (to avoid mixing) adding 8 more liters of freshwater. The angled plastic tank thus had a higher salinity at the bottom of the tank and a lower one at the top due to the heavier density of salt. Before forming the halocline, one PVC pipe with a suction
Figure 2. Illustration of the aquaria set up during storage of the fish at the Zoology building at
the Department of Biological and Environmental Sciences, University of Gothenburg. Yellow
arrows indicate water flow and the green boxes foam filters.
12
cup was fitted at each end of the tanks in order to create two hiding spots at different salinities (Fig. 4). Water temperature and salinity of the top and bottom areas were recorded before fish were put in and at the end of the experiment, using a Hach HQ30d
multimeter. The measurements were taken from just outside the PVC pipes (i.e. the hiding spot). Average salinity inside the tank over the 60 min experimental runs was: Top, 10.4 ± 0.5 PSU; Bottom, 25.6 ± 0.7 PSU.Average temperature inside the tank at the two hiding spots was: Top, 13.0°C ± 0.4°C; Bottom, 13.5°C ± 0.3°C. Fish were added to the aquaria by being dropped through a plastic pipe placed in the middle of the tank, to minimize the mix of water when releasing the fish. The salinity choice was measured as the position of the fish, in either high or low salinity, recorded at the start and every 10 minutes for 60 minutes (7
measurements in total). Fish from all four treatment groups were tested (N = 48; 12 per group). A control test with no halocline, in water of the same salinity, was conducted to determine to what extent fish chose depth of water, rather than salinity. In this case, only the 24 individuals that were kept in 0.1 PSU were used, with 0.1 PSU as test water. This was not done with fish from the HS treatment since fish from that treatment were used in other experiments and were not freely available at the time.
Statistics & null hypothesis After 7 outliers and 5 fish whose sex could not be determined were removed, 35 of the 48 recorded individuals were included in the analyses. Statistical analyses were carried out using IBM SPSS Statistics 22.
The activity, measured as the log transformed total time (to normalize data)
Figure 3. Snapshot from the video recording of the activity experiment, showing the cameras
point-of-view of the six tanks.
13
the fish spent moving during 20 min of recorded and analyzed observation, was tested with the following null hypotheses through a three-way analysis of variance (ANOVA):
1. There is no significant difference between any of the main effects (i.e. sex, treatment and location of capture).
2. There are no significant 2-way interactions between the main effects (treatment x location, treatment x sex, location x sex)
3. There is no significant 3-Way interaction between the main effects (treatment x location x sex).
During calculations, all non-significant (P > 0.05) interactions were sequentially removed, starting from the highest order.
The salinity preference, as measured by the proportion time spent in the bottom hiding spot (i.e. high salinity), was tested between the four groups with a Scheirer-Ray-Hare Test (Ennos, 2012) with the follow null-hypothesis:
1. There is no significant difference between any of the main effects (i.e. treatment and location)
2. There is no significant 2-way interaction between the main effects (treatment X location).
The preference of hiding spot (i.e. depth) between the control groups was tested with a Mann-Whitney U test with following null-hypothesis:
1. There is no significant difference between the two locations in preference of hiding spot.
Figure 4. Illustration of the tank used in the salinity choice experiment. The tank was set up at a
15° angel so that a slope was formed allowing the more dense, high saline water to settle at the
bottom of the tank and keep the less dense, low saline water at the top creating a halocline inside
the tank (illustrated here through the dark and light blue water). The two gray circles represent the
two PVC-pipes acting as hiding spots on the bottom and top of the tank.
14
A Scheirer-Ray-Hare Test and a Mann-Whitney U test are the non-parametric version of a two-way ANOVA and two-sample t-test (Ennos, 2012) and was applied due to data being heavily skewed to the right and thus non-normally distributed.
During calculations, all non-significant interactions were removed (ruled under confidence limit of 0.05).
DNA Extractions
Caudal fins sampled from fish from two localities in Gothenburg, Sannegårdshamnen and Röda Sten, were used for genetic extractions. Caudal fin sampling of Volvo Museum individuals first occurred after the behavioral experiments were conducted due to low number of fish from this site. As there where there was a surplus available from Röda Sten there was enough to sample and use in the experiments. Caudal fins previously collected from the following four locations were also extracted: Travemünde (53°53'44.4"N 10°47'52.7"E, average PSU: 11.9), the rivers Rhine (51°51'39.2"N 6°04'17.6"E, average PSU: 0) and Elbe (53°32'56.9"N 9°59'10.3"E, average PSU 0) all three of which are situated in Germany, and the Danish strait Gullborgsund (54°51'21.1"N 11°44'59.0"E, average PSU: 12.9).
Before DNA was extracted, fin-clips that had been stored in ethanol in Eppendorf tubes were air dried and then weighed to ensure no fin sample exceeded 250 μg (as specified in the manufacturers protocol, Qiagen DNeasy Blood & Tissue Kit) or was below 100 μg. After weighing, fins were cut into small pieces with sterilized scissors and
put into a new Eppendorf tube and stored in 99.7 % ethanol until extractions took place.
Extractions occurred according to the manufacturers’ protocol with small adjustments. Briefly, each sample was air dried and put inside an Eppendorf tube to which 180 μl of Buffer ATL and 20 μl of Proteinase K were pipetted. These were immediately mixed for 15 seconds before being put into an incubator (ThermoStat Plus, Eppendorf, Hamburg, Germany) at 56 °C for 4 hours (15-second mixings using an IKA® MS1 Shaker (IKA, Staufen, Germany) occurred at 1h 15 min and 2h 25 min). After incubation, samples were mixed again and 200 μl of Buffer AL and 99.7% ethanol was added and the sample was mixed again. This mixture was pipetted into a DNeasy Mini Spin Column placed in a collection tube and centrifuged at 8000 rpm for 1 min after which the collection tube was emptied and 500 μl Buffer AW1 added to the top of the DNeasy Mini Spin Column and centrifuged at the same setting again. The collection tube was then discarded and a new one put into place and 500 μl of Buffer AW2 pipetted into spin columns and centrifuged at 14 000 rpm for 3 min. The spin column was placed in a new Eppendorf tube and 200 μl Buffer AE was added and centrifuged at 8000 rpm for 1 min again. This step was repeated in a new Eppendorf tube to create two elutions of DNA.
DNA Concentrations Since the GBS method requires 100 ng of each sample, all extracted DNA sample concentrations needed to be checked to ensure there was a) enough DNA in each extracted sample and b) to what level samples needed to be diluted to. Thus, the
15
concentration of all the samples was measured with a NanoDrop 2000 (Thermo Fisher Scientific, Waltham, USA). However, due to the risk of overestimating the actual concentration, a more sensitive machine was employed (Qubit Flourometer 3.0, Thermo Fisher Scientific, Waltham, USA) in order to double check the concentrations. By sampling six different samples and measuring their concentration with a Qubit dsDNA HS Assay Kit (allowing quantification between 0.2 - 100 ng DNA) and comparing the concentrations between the two machines, a factor by which the NanoDrop 2000 overestimated the concentrations could be calculated. This was then used to calculate the estimates of all the other samples. With the estimated concentrations, the dilution to get 100 ng DNA per sample could be done.
Results
Behavioral Experiment 1: Activity
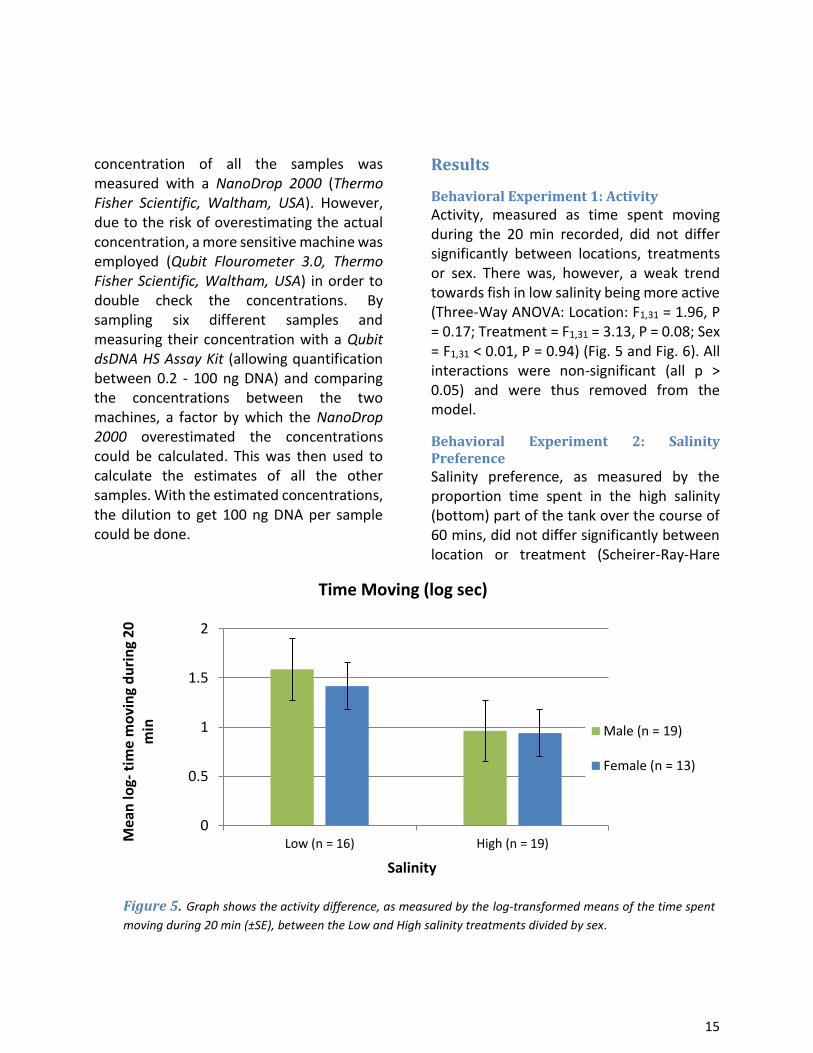
Activity, measured as time spent moving during the 20 min recorded, did not differ significantly between locations, treatments or sex. There was, however, a weak trend towards fish in low salinity being more active (Three-Way ANOVA: Location: F1,31 = 1.96, P = 0.17; Treatment = F1,31 = 3.13, P = 0.08; Sex = F1,31 < 0.01, P = 0.94) (Fig. 5 and Fig. 6). All interactions were non-significant (all p > 0.05) and were thus removed from the model.
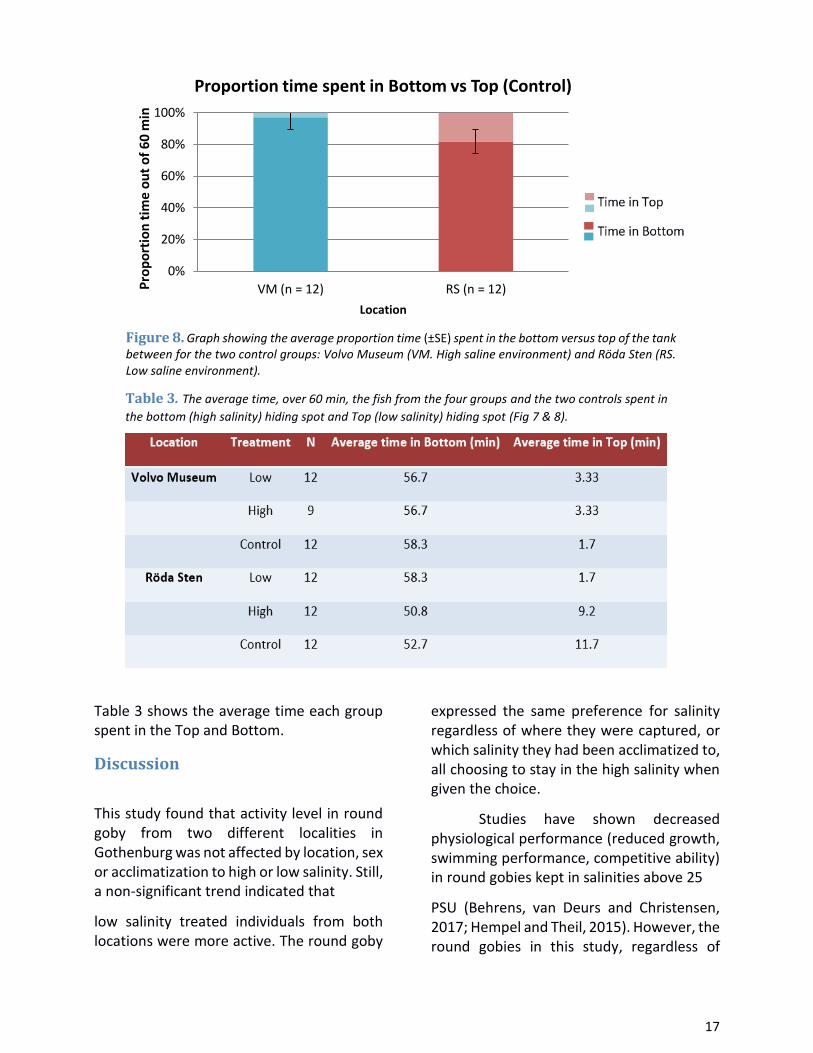
Behavioral Experiment 2: Salinity Preference Salinity preference, as measured by the proportion time spent in the high salinity (bottom) part of the tank over the course of 60 mins, did not differ significantly between location or treatment (Scheirer-Ray-Hare
0
0.5
1
1.5
2
Low (n = 16) High (n = 19)Mea
n lo
g-ti
me
mo
vin
g d
uri
ng
20
m
in
Salinity
Time Moving (log sec)
Male (n = 19)
Female (n = 13)
Figure 5. Graph shows the activity difference, as measured by the log-transformed means of the time spent
moving during 20 min (±SE), between the Low and High salinity treatments divided by sex.
16
Test: Location: χ² (df = 1, N = 45) = 0.9, P > 0.05; Treatment = χ² (df = 1, N = 45) = 0.9, P > 0.05)(Fig. 7). The interaction between the two main effects was non-significant and removed from the model.
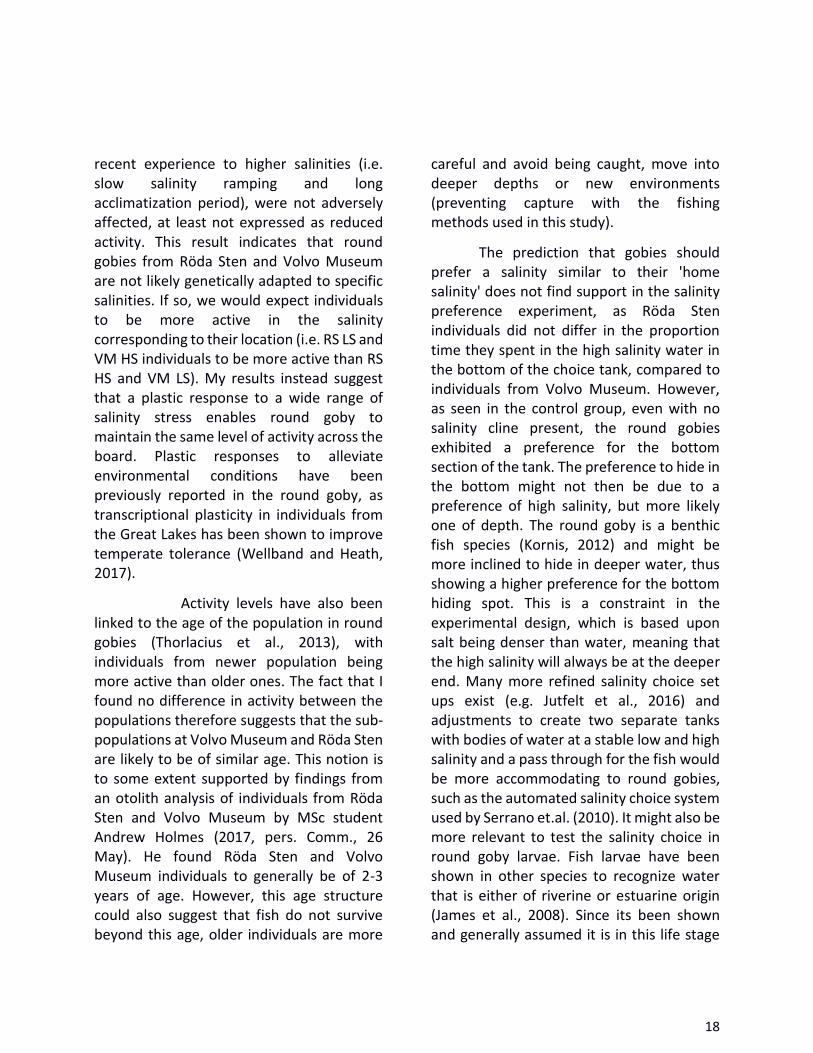
The preference of hiding spot, as measured by proportion time spent in the bottom (deeper) versus the top (shallow) hiding spot over the course of 60 mins, did
not differ significantly between locations in the control group either (Mann-Whitney U: Location: U12,12 = 53, P = 0.17) (Fig. 8).
Figure 7 shows the proportion time over 60 min that the fish of the four groups spent in the top versus bottom hiding spot (i.e. low or high salinity). Figure 8 shows the same data but for the control groups (i.e. no salinity gradient) for the two locations and
0
0.5
1
1.5
2
Low (n = 16) High (n = 19)Mea
n t
ime
mo
vin
g d
uri
ng
20
min
Salinity
Röda Sten (n =19)
Time Moving (log sec)
RS (n = 19)
VM (n = 16)
Figure 6. Graph shows the activity difference, as measured by the log-transformed means of
the time spent moving during 20 min (±SE), between the Low and High salinity treatments of both
Röda Sten (RS) and Volvo Museum (VM).
0%
20%
40%
60%
80%
100%
VM LS (n=12) VM HS (n=9) RS LS (n=12) RS HS (n=12)
Pro
po
tio
n t
ime
ou
t o
f 6
0 m
in
Location & Treatment
Proportion time spent in Bottom vs Top
Time in Top
Time in Bottom
Figure 7. Graph showing the average proportion time (±SE) spent in the bottom versus the top of the tank between the four different groups: Röda Sten Low Salinity (RS LS), Röda Sten High Salinity (RS HS), Volvo Museum Low Salinity (VM LS) and Volvo Museum High Salinity (VM HS).
17
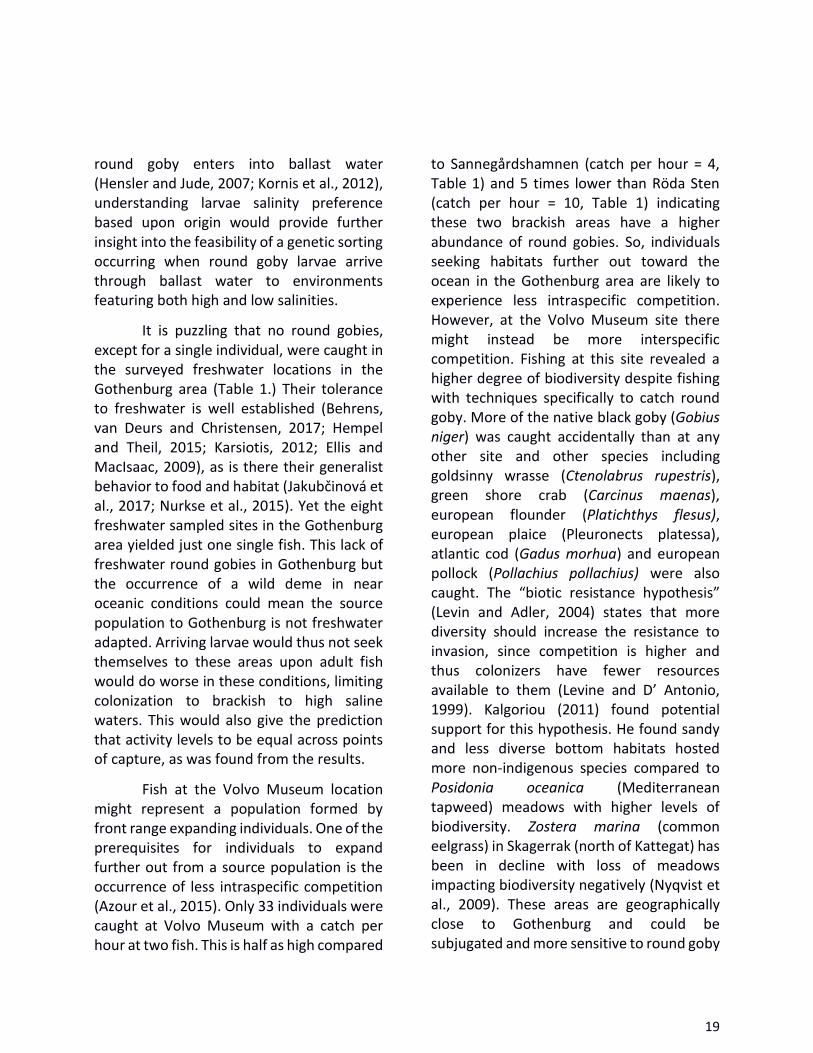
Table 3 shows the average time each group spent in the Top and Bottom.
Discussion
This study found that activity level in round goby from two different localities in Gothenburg was not affected by location, sex or acclimatization to high or low salinity. Still, a non-significant trend indicated that
low salinity treated individuals from both locations were more active. The round goby
expressed the same preference for salinity regardless of where they were captured, or which salinity they had been acclimatized to, all choosing to stay in the high salinity when given the choice.
Studies have shown decreased physiological performance (reduced growth, swimming performance, competitive ability) in round gobies kept in salinities above 25
PSU (Behrens, van Deurs and Christensen, 2017; Hempel and Theil, 2015). However, the round gobies in this study, regardless of
0%
20%
40%
60%
80%
100%
VM (n = 12) RS (n = 12)Pro
po
rtio
n t
ime
ou
t o
f 6
0 m
in
Location
Proportion time spent in Bottom vs Top (Control)
Time in Top
Time in Bottom
Figure 8. Graph showing the average proportion time (±SE) spent in the bottom versus top of the tank between for the two control groups: Volvo Museum (VM. High saline environment) and Röda Sten (RS. Low saline environment).
Table 3. The average time, over 60 min, the fish from the four groups and the two controls spent in
the bottom (high salinity) hiding spot and Top (low salinity) hiding spot (Fig 7 & 8).
18
recent experience to higher salinities (i.e. slow salinity ramping and long acclimatization period), were not adversely affected, at least not expressed as reduced activity. This result indicates that round gobies from Röda Sten and Volvo Museum are not likely genetically adapted to specific salinities. If so, we would expect individuals to be more active in the salinity corresponding to their location (i.e. RS LS and VM HS individuals to be more active than RS HS and VM LS). My results instead suggest that a plastic response to a wide range of salinity stress enables round goby to maintain the same level of activity across the board. Plastic responses to alleviate environmental conditions have been previously reported in the round goby, as transcriptional plasticity in individuals from the Great Lakes has been shown to improve temperate tolerance (Wellband and Heath, 2017).
Activity levels have also been linked to the age of the population in round gobies (Thorlacius et al., 2013), with individuals from newer population being more active than older ones. The fact that I found no difference in activity between the populations therefore suggests that the sub-populations at Volvo Museum and Röda Sten are likely to be of similar age. This notion is to some extent supported by findings from an otolith analysis of individuals from Röda Sten and Volvo Museum by MSc student Andrew Holmes (2017, pers. Comm., 26 May). He found Röda Sten and Volvo Museum individuals to generally be of 2-3 years of age. However, this age structure could also suggest that fish do not survive beyond this age, older individuals are more
careful and avoid being caught, move into deeper depths or new environments (preventing capture with the fishing methods used in this study).
The prediction that gobies should prefer a salinity similar to their 'home salinity' does not find support in the salinity preference experiment, as Röda Sten individuals did not differ in the proportion time they spent in the high salinity water in the bottom of the choice tank, compared to individuals from Volvo Museum. However, as seen in the control group, even with no salinity cline present, the round gobies exhibited a preference for the bottom section of the tank. The preference to hide in the bottom might not then be due to a preference of high salinity, but more likely one of depth. The round goby is a benthic fish species (Kornis, 2012) and might be more inclined to hide in deeper water, thus showing a higher preference for the bottom hiding spot. This is a constraint in the experimental design, which is based upon salt being denser than water, meaning that the high salinity will always be at the deeper end. Many more refined salinity choice set ups exist (e.g. Jutfelt et al., 2016) and adjustments to create two separate tanks with bodies of water at a stable low and high salinity and a pass through for the fish would be more accommodating to round gobies, such as the automated salinity choice system used by Serrano et.al. (2010). It might also be more relevant to test the salinity choice in round goby larvae. Fish larvae have been shown in other species to recognize water that is either of riverine or estuarine origin (James et al., 2008). Since its been shown and generally assumed it is in this life stage
19
round goby enters into ballast water (Hensler and Jude, 2007; Kornis et al., 2012), understanding larvae salinity preference based upon origin would provide further insight into the feasibility of a genetic sorting occurring when round goby larvae arrive through ballast water to environments featuring both high and low salinities.
It is puzzling that no round gobies, except for a single individual, were caught in the surveyed freshwater locations in the Gothenburg area (Table 1.) Their tolerance to freshwater is well established (Behrens, van Deurs and Christensen, 2017; Hempel and Theil, 2015; Karsiotis, 2012; Ellis and MacIsaac, 2009), as is there their generalist behavior to food and habitat (Jakubčinová et al., 2017; Nurkse et al., 2015). Yet the eight freshwater sampled sites in the Gothenburg area yielded just one single fish. This lack of freshwater round gobies in Gothenburg but the occurrence of a wild deme in near oceanic conditions could mean the source population to Gothenburg is not freshwater adapted. Arriving larvae would thus not seek themselves to these areas upon adult fish would do worse in these conditions, limiting colonization to brackish to high saline waters. This would also give the prediction that activity levels to be equal across points of capture, as was found from the results.
Fish at the Volvo Museum location might represent a population formed by front range expanding individuals. One of the prerequisites for individuals to expand further out from a source population is the occurrence of less intraspecific competition (Azour et al., 2015). Only 33 individuals were caught at Volvo Museum with a catch per hour at two fish. This is half as high compared
to Sannegårdshamnen (catch per hour = 4, Table 1) and 5 times lower than Röda Sten (catch per hour = 10, Table 1) indicating these two brackish areas have a higher abundance of round gobies. So, individuals seeking habitats further out toward the ocean in the Gothenburg area are likely to experience less intraspecific competition. However, at the Volvo Museum site there might instead be more interspecific competition. Fishing at this site revealed a higher degree of biodiversity despite fishing with techniques specifically to catch round goby. More of the native black goby (Gobius niger) was caught accidentally than at any other site and other species including goldsinny wrasse (Ctenolabrus rupestris), green shore crab (Carcinus maenas), european flounder (Platichthys flesus), european plaice (Pleuronects platessa), atlantic cod (Gadus morhua) and european pollock (Pollachius pollachius) were also caught. The “biotic resistance hypothesis” (Levin and Adler, 2004) states that more diversity should increase the resistance to invasion, since competition is higher and thus colonizers have fewer resources available to them (Levine and D’ Antonio, 1999). Kalgoriou (2011) found potential support for this hypothesis. He found sandy and less diverse bottom habitats hosted more non-indigenous species compared to Posidonia oceanica (Mediterranean tapweed) meadows with higher levels of biodiversity. Zostera marina (common eelgrass) in Skagerrak (north of Kattegat) has been in decline with loss of meadows impacting biodiversity negatively (Nyqvist et al., 2009). These areas are geographically close to Gothenburg and could be subjugated and more sensitive to round goby
20
invasions if eelgrass meadows continue to decline. In experimental and field studies on invertebrates, increased diversity was also shown to reduce survival and decrease settlement indirectly of invaders, an affect attributed to the reduction in availability of open space (Stachowicz et al., 2002). The higher salinity at Volvo Museum might also affect reproductive success. Experiments on the sand goby (Pomatoschistus minutus) showed males had significantly lower reproductive success (spawning and hatching success), in non-native salinities. This was presumably due to increased developmental failure of fertilized eggs or due to sperm being damaged when exposed to non-native salinities, despite adults doing well physically otherwise (C. Kvarnemo, personal communication)
The round gobies' ability to handle salinity is indicated by this study to be a tolerance stemming from plasticity. The occurrence of a genetic sorting is not therefore supported. However, the lack of gobies found in freshwater systems and a wild population in salinities reaching oceanic conditions suggest the Gothenburg population might originate from a genotype adapted to brackish salinities, and that fish from a freshwater origin is simply not present in the harbor. Future genetic work will help to sort this out. Volvo Museum, a location with salinity recordings of up to 29.5 PSU, represents a wild population showing
the potential that the species will be able to spread to the North Sea, unless hindered by other factors than salinity. Future management should consider that oceanic salinity conditions may not necessarily be an efficient natural boundary for round goby establishment. The local round goby range also suggests that front range dispersers will experience less intraspecific competition, which could be a contributing factor to why the round goby would continue to expand into more oceanic conditions. The resilience of a high biodiversity ecosystem might help limit their establishment, highlighting the importance of ecosystem stability and the importance of maintaining them. Having already shown successful spread and no signs of stopping, the round goby is likely to join the ranks of species such as the pacific oyster (Crassostera gigas) and comb jelly, Mnemiopsis leidyi in the public’s growing awareness of invasive species at the Swedish west coast.
Acknowledgements
Special thanks to Andrew Holmes, Charlotta Kvarnemo and Leon Green. I also want to give thanks to Oliver Englund Örn, Alexander Hansson, Angela Pauliny, Mårten Klinth, Svante Martinsson, Linda Hasselberg Frank, Magnus Lovén Wallerius, Linda Werme, Sportfiskarna, Erica Leader & Jarl Andreas Amarkund at UiO.
21
References
Azour, F., van Deurs, M., Behrens, J., Carl, H., Hüssy, K., Greisen, K., Ebert, R. and Møller, P. (2015). Invasion rate and population characteristics of the round goby Neogobius melanostomus: effects of density and invasion history. Aquatic Biology, 24: 41-52.
Behrens, J., van Deurs, M. and Christensen, E. (2017). Evaluating dispersal potential of an invasive fish by the use of aerobic scope and osmoregulation capacity. PLOS ONE, 12: e0176038.
Brockmark, S. (2016). Svartmunnad smörbult - Arter - Havs- och vattenmyndigheten. [online] Havochvatten.se. Available at: https://www.havochvatten.se/hav/fiske--fritid/arter/lista-over-vanliga-arter-i-svenska-vatten/arter/svartmunnad-smorbult.html [Accessed 8th Sep. 2016].
Brown, G., Phillips, B. and Shine, R. (2014). The straight and narrow path: the evolution of straight-line dispersal at a cane toad invasion front. Proceedings of the Royal Society B: Biological Sciences, 281: 20141385-20141385.
Brown, J. and Stepien, C. (2008). Ancient divisions, recent expansions: phylogeography and population genetics of the round goby Apollonia melanostoma. Molecular Ecology, 17: 2598-2615.
Brown, G. and Shine, R. (2014). Immune response varies with rate of dispersal in invasive cane toads (Rhinella marina). PLoS ONE, 9: e99734.
Charlebois, P., Corkum, L., Jude, D. and Knight, C. (2001). The round goby (Neogobius melanostomus) invasion: current research and future needs. Journal of Great Lakes Research, 27: 263-266.
Chevin, L., Lande, R. and Mace, G. (2010). Adaptation, plasticity, and extinction in a changing environment: towards a predictive theory. PLoS Biology, 8: e1000357.
Elshire, R., Glaubitz, J., Sun, Q., Poland, J., Kawamoto, K., Buckler, E. and Mitchell, S. (2011). A robust, simple Genotyping-by-Sequencing (GBS) approach for high diversity species. PLoS ONE, 6: e19379.
Ennos, R. (2012). Statistical and data handling skills in biology. Harlow: Pearson Education.
Göteborgs Hamn (2013) The No. 1 port in Scandinavia [Broschyr]. Göteborg: Göteborgs Hamn
http://www.goteborgshamn.se/om-hamnen/omgoteborgshamn/ [2016-11-15]
Hempel, M. and Thiel, R. (2015). Effects of salinity on survival, daily food intake and growth of juvenile round goby Neogobius melanostomus (Pallas, 1814) from a brackish water system. J. Appl. Ichthyol., 31: 370-374.
22
Hensler, S. and Jude, D. (2007). Diel vertical migration of round goby larvae in the Great Lakes. Journal of Great Lakes Research, 33: 295-302.
Hirsch, P., N’Guyen, A., Adrian-Kalchhauser, I. and Burkhardt-Holm, P. (2015). What do we really know about the impacts of one of the 100 worst invaders in Europe? A reality check. Ambio, 45: 267-279.
Hudson, C., McCurry, M., Lundgren, P., McHenry, C. and Shine, R. (2016). Constructing an Invasion Machine: The rapid evolution of a dispersal-enhancing phenotype during the Cane Toad invasion of australia. PLOS ONE, 11: e0156950.
Levine, J., Adler, P. and Yelenik, S. (2004). A meta-analysis of biotic resistance to exotic plant invasions. Ecology Letters, 7:975-989.
Levine, J. and D'Antonio, C. (1999). Elton Revisited: A Review of Evidence Linking Diversity and Invasibility. Oikos, 87:15.
Jakubčinová, K., Simonović, P., Števove, B., Čanak Atlagić, J. and Kováč, V. (2017). What can morphology tell us about ecology of four invasive goby species?. Journal of Fish Biology, 90: 1999-2019.
Jutfelt, F., Sundin, J., Raby, G., Krång, A. and Clark, T. (2016). Two-current choice flumes for testing avoidance and preference in aquatic animals. Methods in Ecology and Evolution, 8: 379-390.
Kalogirou, S. (2011). Alien Fish Species in the Eastern Mediterranean Sea: Invasion Biology in Coastal Ecosystems. Ph.D. University of Gothneburg Faculty of Science Department of Marine Ecology.
Karsiotis, S., Pierce, L., Brown, J. and Stepien, C. (2012). Salinity tolerance of the invasive round goby: Experimental implications for seawater ballast exchange and spread to North American estuaries. Journal of Great Lakes Research, 38: 121-128.
Kornis, M., Mercado-Silva, N. and Vander Zanden, M. (2012). Twenty years of invasion: a review of round goby Neogobius melanostomus biology, spread and ecological implications. Journal of Fish Biology, 80: 235-285.
Kotta, J., Nurkse, K., Puntila, R. and Ojaveer, H. (2016). Shipping and natural environmental conditions determine the distribution of the invasive non-indigenous round goby Neogobius melanostomus in a regional sea. Estuarine, Coastal and Shelf Science, 169: 15-24.
Kullander, S.O, et al. 2012. Neogobious melanostomus svartmunnad smörbult, p. 407-308. Nationalcykeln till Sveriges flora och fauna. Strålfeniga fiskar. Actinopetyrgii. ArtDatabanken, SLU, Uppsala.
23
Meunier, B., Yavno, S., Ahmed, S. and Corkum, L. (2009). First documentation of spawning and nest guarding in the laboratory by the invasive fish, the round goby (Neogobius melanostomus). Journal of Great Lakes Research, 35: 608-612.
Moran, E. and Alexander, J. (2014). Evolutionary responses to global change: lessons from invasive species. Ecology Letters, 17: 637-649.
Nyqvist, A., André, C., Gullström, M., Baden, S. and Åberg, P. (2009). Dynamics of seagrass meadows on the Swedish Skagerrak coast. AMBIO: A Journal of the Human Environment, 38: 85-88.
Nurkse, K., Kotta, J., Orav-Kotta, H. and Ojaveer, H. (2016). A successful non-native predator, round goby, in the Baltic Sea: generalist feeding strategy, diverse diet and high prey consumption. Hydrobiologia, 777: 271-281.
Ojaveer, H., Galil, B., Lehtiniemi, M., Christoffersen, M., Clink, S., Florin, A., Gruszka, P., Puntila, R. and Behrens, J. (2015). Twenty five years of invasion: management of the round goby Neogobius melanostomus in the Baltic Sea. Management of Biological Invasions, 6: 329-339.
Price, T., Qvarnström, A. and Irwin, D. (2003). The role of phenotypic plasticity in driving genetic evolution. Proceedings of the Royal Society B: Biological Sciences, 270: 1433-1440.
Rius, M., Turon, X., Bernardi, G., Volckaert, F. and Viard, F. (2014). Marine invasion genetics: from spatio-temporal patterns to evolutionary outcomes. Biological Invasions, 17: 869-885.
Savolainen, O., Lascoux, M. and Merilä, J. (2013). Ecological genomics of local adaptation. Nature Reviews Genetics, 14: 807-820.
Serrano, X., Grosell, M. and Serafy, J. (2010). Salinity selection and preference of the grey snapper Lutjanus griseus: field and laboratory observations. Journal of Fish Biology, 76: 1592-1608.
Stachowicz, J., Fried, H., Osman, R. and Whitlatch, R. (2002). Biodiversity, invasion resistance, and marine ecosystem function: reconciling pattern and process. Ecology, 83: 2575.
Thorlacius, M., Hellström, G. and Brodin, T. (2015). Behavioral dependent dispersal in the invasive round goby Neogobius melanostomus depends on population age. Current Zoology, 61: 529-542.
Wellband, K. and Heath, D. (2017). Plasticity in gene transcription explains the differential performance of two invasive fish species. Evolutionary Applications. [online] Available at: http://onlinelibrary.wiley.com/journal/10.1111/(ISSN)1752-4571/earlyview [Accessed 8 Jun. 2017].