Embed Size (px)
Citation preview

Integration of inputs by cortical neurons provides the basis for thecomplex information processing performed in the cerebral cortex.Here, we have examined how primary visual cortical neuronsintegrate classical and nonclassical receptive field inputs. The effectof nonclassical receptive field stimuli and, correspondingly, oflong-range intracortical inputs is known to be context-dependent:the same long-range stimulus can either facilitate or suppressresponses, depending on the level of local activation. Byconstructing a large-scale model of primary visual cortex, wedemonstrate that this effect can be understood in terms of the localcortical circuitry. Each receptive field position contributes bothexcitatory and inhibitory inputs; however, the inhibitory inputs havegreater influence when overall receptive field drive is greater. Thismechanism also explains contrast-dependent modulations withinthe classical receptive field, which similarly switch betweenexcitatory and inhibitory. In order to simplify analysis and to explainthe fundamental mechanisms of the model, self-contained modulesthat capture nonlinear local circuit interactions are constructed. Thiswork supports the notion that receptive field integration is the resultof local processing within small groups of neurons rather than insingle neurons.
IntroductionCentral to an understanding of cortical function is the question
of how cortical neurons integrate inputs to produce outputs. In
primary visual cortex (V1), the spatial extent of integration by a
neuron includes not only its ‘classical’ receptive field (RF),
where visual stimuli elicit spike responses (presumably through
thalamocortical axons), but also the ‘nonclassical’ receptive
field, where stimuli largely modulate responses evoked by other
stimuli (presumably via long-range intracortical or inter-areal
axons) (Maffei and Fiorentini, 1976; Rockland and Lund, 1982;
Gilbert and Wiesel, 1983; T’so et al., 1986; Gilbert, 1992).
The enigmatic nature of this long-range modulation has only
recently begun to be understood. Long-range (>1.5 mm)
intracortical connections arise almost exclusively from
excitatory neurons (Rockland and Lund, 1982; Gilbert and
Wiesel, 1983) and make ∼80% of their synapses onto excitatory
neurons (Kisvarday et al., 1986; McGuire et al., 1991). Not
surprisingly, moderate electrical stimulation of long-range inputs
generates excitatory postsynaptic potentials (PSPs). Visual
stimulation of the far surround, without a central stimulus, can
also elicit excitatory responses (Maffei and Fiorentini, 1976;
Knierim and Van Essen, 1992). In contrast, experiments in
which surround or contextual stimuli (which engage long-range
inputs) are added to strong central stimuli indicate a suppressive
role for long-range inputs (Blakemore and Tobin, 1972; Nelson
and Frost, 1978; Gulyas et al., 1987; Born and Tootell, 1991;
Knierim and Van Essen, 1992; Grinvald et al., 1994). Similarly,
strong inhibitory PSPs can be induced by electrical stimulation
of long-range inputs, provided that the local circuitry is strongly
activated (Hirsch and Gilbert, 1991; Weliky et al., 1995). We
(Toth et al., 1996) and others (Roig et al., 1996; Levitt and Lund,
1997; Polat et al., 1998; Sengpiel et al., 1998) have shown that
the contrast of the center stimulus regulates whether long-range
interactions are facilitative or suppressive: the same surround
stimulus facilitates responses when center contrast is low
but suppresses responses when center contrast is high (see
Fig. 1Aa,b). Surround modulation of responses to preferred
orientation stimuli in the classical RF tend to exhibit the
strongest suppression (for high-contrast centers) and strongest
facilitation (for low-contrast centers) when the surround
stimulus is parallel or iso-orientated with the center (Nelson and
Frost, 1978, 1985; Knierim and Van Essen, 1992; Sillito et al.,
1995; Weliky et al., 1995; Toth et al., 1996; Polat et al., 1998).
Interestingly, similar contrast-related response modulation
has also been observed within the classical receptive field.
Increasing the contrast of a stimulus in the receptive field can, at
high contrast, actually cause responses of many V1 cells to
decline or ‘supersaturate’ (Li and Creutzfeldt, 1984; see Fig. 1B).
This effect has been observed at contrast levels for which lateral
geniculate nucleus (LGN) responses have not saturated or
supersaturated (Albrecht and Hamilton, 1982; Bonds 1991). A
related phenomenon concerns the receptive field length of
end-stopped cells. These cells typically respond maximally to
high-contrast stimulus bars of a certain length (and orientation),
and responses decline for longer bars (e.g. Hubel and Wiesel,
1965), presumably due to encroachment of the stimulus on
inhibitory zones located at the ends of excitatory regions.
End-zones have maximal inhibitory effect when activated by
stimuli of the preferred orientation (Orban et al., 1979;
DeAngelis et al., 1994). However, these inhibitory zones can
become excitatory as stimulus contrast is decreased (Jagadeesh
and Ferster, 1990; Jagadeesh, 1993), so that low-contrast
(preferred orientation) bars have longer optimal lengths than do
high-contrast bars (see Fig. 1C).
Common to the phenomena above is the finding that
receptive field inf luences that are net excitatory when the
classical receptive field is activated by a low-contrast stimulus
become inhibitory when the classical receptive field is activated
by a high-contrast stimulus. Paradoxically, both the excitatory
and inhibitory effects tend to be strongest for modulatory stimuli
aligned at the preferred orientation for the classical RF. These
changes in RF sign contradict traditional ideas that assume that
the single neuron is the ‘unit’ of receptive field integration (e.g.
Hartline, 1940; Kuff ler, 1953; Movshon et al., 1978; Jones and
Palmer, 1987; DeAngelis et al., 1995), although these data
might be reconciled by invoking dramatic state changes in local
neurons or in long-distance synapses. Here we show that
local cortical circuitry is sufficient to explain these receptive
field ‘switching’ effects, provided that some contrast-related
asymmetry between local cortical excitatory and inhibitory
neurons exists. Two different asymmetries are demonstrated:
Cerebral Cortex Apr/May 1998;8:204–217; 1047–3211/98/$4.00
A Local Circuit Approach to UnderstandingIntegration of Long-range Inputs in PrimaryVisual Cortex
David C. Somers, Emanuel V. Todorov, Athanassios G. Siapas,
Louis J. Toth, Dae-Shik Kim and Mriganka Sur
Department of Brain and Cognitive Sciences, Massachusetts
Institute of Technology, Cambridge, MA 02139, USA

higher average gain and threshold for the inhibitory population
(McCormick et al., 1985); and differential synaptic depression/
facilitation in local circuit connections (Thomson and Deuchars,
1994).
We and others (Ben-Yishai et al., 1995; Douglas et al., 1995;
Somers et al., 1995a; Suarez et al., 1995) have demonstrated that
consideration of short-range recurrent cortical excitatory (and
inhibitory) connections yields a concise account of a broad
range of experimental data on orientation and direction
selectivity. Here, we extend our large-scale visual cortical
model to incorporate long-range intracortical excitation and
demonstrate that this model captures both the local and long-
range phenomena. In order to make clear the mechanistic
requirements of this model and to further explore input-
dependent effects, we present a novel analysis method. This
analysis constructs self-contained local cortical modules which
exhibit the essential local and long-range behavior of the full
model. Preliminary accounts of some of this work have appeared
(Somers et al., 1994, 1995b).
Materials and Methods
Model Overview
The model extends our prior local circuit model of orientation selectiv-
ity (Somers et al., 1995a) by incorporating long-range intracortical
excitatory connections. The present model also differs from our prior
short-range model in that: excitatory cortical neurons have been
extended to exhibit spike adaptation; the equations describing lateral
geniculate responses have been simplified to decrease simulation time;
and 10 times as many neurons have been represented. In scaling up such
a nonlinear system, parameter modifications were unavoidable; however,
the essential behaviors of the earlier model (i.e. orientation sharpening,
amplification) persist in the present model.
Cortical Cell Models
Excitatory and inhibitory cortical neurons were modeled separately using
experimentally reported input resistances, membrane time constants and
firing characteristics of regular-spiking (RS) and fast-spiking (FS) neurons
(Connors et al., 1982; McCormick et al., 1985). The cellular parameters
used here are the same as in our prior model, with the exception that a
spike-adaptation current has been added to RS neurons. This current is
not important for our results; rather, we add it because it is a known and
prominent feature of RS neuron physiology. Each cortical neuron was
modeled as a single voltage compartment in which the membrane
potential, V, was given by
where the synaptic conductances generated at each postsynaptic cell i by
the spiking of each presynaptic cell j (excitatory if j ≤ k; inhibitory if k <
j ≤ l) are given by:
where tji and gji describe the delay and maximal conductance change
CV
tg t t V t E g t t V t E
g V t E g t t V t E
g t t V t E
iji ji i ji ji i
j k
k l
j
k
i i
i
m Excit Inhib
Leak Leak AHP spike AHP
Adapt spike Adapt
d
d= − − − − − −
− − − − −
− − −
= +
+
=∑∑ e j b g e j b g
b g e j b g
e j b g
11
g t g t t e t tji jip
S j
b g e je j e j= − − −∑ p peak p peak/ exp /τ τ
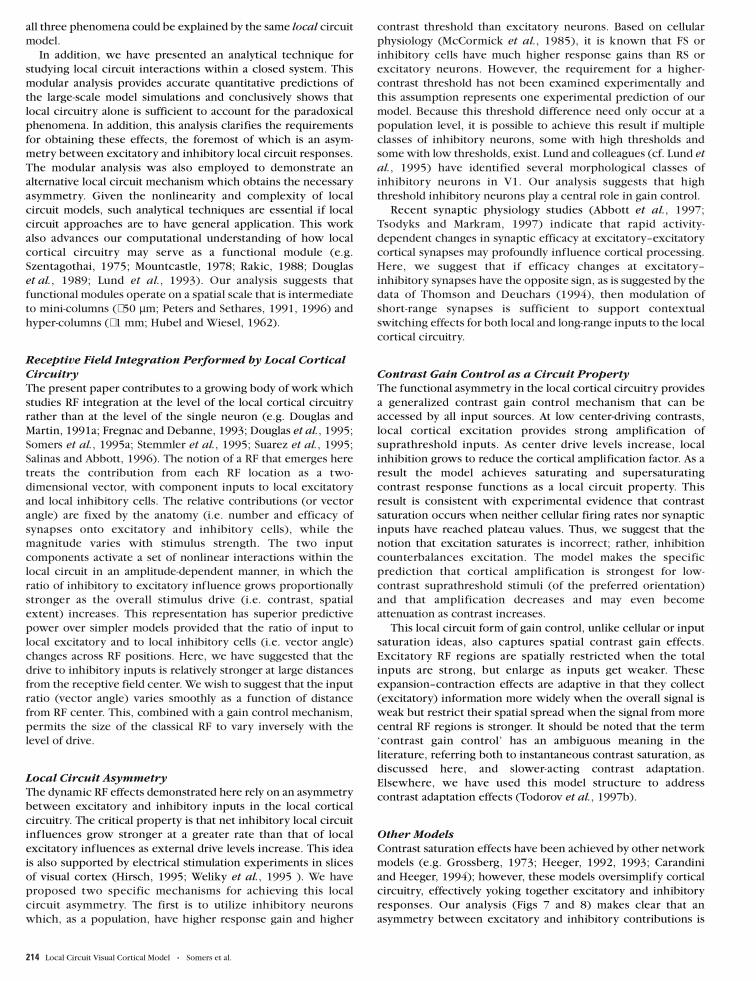
Figure 1. Receptive field influences shifting from excitatory to inhibitory as centralstimulus contrast increases. (A) A high-contrast surround stimulus facilitates theresponse of a low-contrast center stimulus, but the same surround stimulussuppresses responses when the center stimulus is of high contrast. Both facilitationand suppression effects tend to be strongest for iso-orientation surrounds. (a) Typicaldata from a cell in cat V1 obtained by Toth et al. (1996) but presented here for the firsttime. Increasing the contrast of an optimally oriented grating stimulus (presented to theclassical receptive field in conjunction with a neutral surround) produced typicalsaturating contrast response functions. All gratings were shown at preferredorientation, direction and velocity, and all responses are averages of 12 stimulusrepetitions, randomly interleaved. Central grating stimuli were presented again inconjunction with a high-contrast iso-orientation surround grating. Only the contrast ofthe central grating was changed. Resulting contrast response functions (CRFs) for thecomposite stimulus were higher at low center contrasts and lower at high centercontrasts than center-only CRFs. Black line represents response to center onlystimulation, gray line represents response to full-field stimulation. (b) Schematicrepresentation of surround facilitation and suppression (after Toth et al., 1996; see textfor other references). On average (n = 30 cells), responses to the surround stimulusalone (minus background response) were 6.8% of the responses to the optimal centerstimulus. But this surround combined with the optimal center grating, on average,suppressed responses (to the optimal center gratings) by 15.7%. Suppression andfacilitation effects were largely unaffected by phase relation between center andsurround stimuli. (B) Schematic representation of how increasing the contrast of acenter stimulus alone can decrease responses at very high contrast levels (‘contrastsupersaturation’). This suggests that the excitatory portion of the classical RF canbecome inhibitory. (C) Schematic representation of contrast-dependent length-tuning.Many V1 cells respond optimally to oriented high-contrast stimuli of a given length.These cells exhibit ‘end-stopping’ or length-tuning in that responses decline for longerhigh-contrast stimuli. The presumed ‘inhibitory end-zones’ can become excitatory whenstimulus contrast is reduced. At low contrasts, length summation can extend severaldegrees into the ‘inhibitory end-zones’. Thus, the border between excitatory andinhibitory regions appears to shift with stimulus contrast. For all three receptive fieldeffects, modulatory stimuli tend to have both the strongest facilitatory and strongestsuppressive effects when oriented at the preferred orientation of the classical RF.
Table 1Model parameters
Variablename
Excitatorycell value
Inhibitorycell value
Variablename
Excitatorycell value
Inhibitorycell value
Cm 0.5 nF 0.2 nF gLGN 3 nS 1.5 nSgLeak 25 nS 20 nS gExcit 7 nS 1.5 nSgAHP 40 nS 20 nS gInhib 15 nS 3 nSgAdapt 3 nS — gLong 1.2 nS 1.2 nSEExcit 0 mV 0 mV ρpeak Ex 0.1 0.1EInhib –70 mV –70 mV ρedge Ex 0 0EAHP –90 mV –90 mV degde Ex 150 mm 150 mmEAdapt –90 mV — ρpeak In 0.06 0.06ELeak –65 mV –65 mV ρedge In 0.03 0.03τpeak Ex 1 ms 1 ms degde In 500 mm 500 mmτpeak In 2 ms 2 ms ρpeak Long 0.005 0.005τpeak AHP 1 ms 1 ms ρedge Long 0.001 0.001τpeak Adapt 30 ms — φedge Long 90° 90°
Cerebral Cortex Apr/May 1998, V 8 N 3 205
produced for the synapse between cell j and cell i. The numbers of
excitatory and inhibitory synapses received by cell i were k and l
respectively. AMPA receptor-mediated excitatory synaptic effects and
GABAA receptor-mediated synaptic inhibitory effects were implemented
as linear conductance changes. After-hyperpolarization effects were
spike-triggered (with delay tspike = 1 ms).
The membrane parameters (see Table 1) yield membrane time
constants, τm , of 20 ms for excitatory neurons and 10 ms for inhibitory
neurons. Na+-mediated spike dynamics were replaced by a time-varying
firing threshold. When the membrane potential exceeded threshold, a
spike was recorded, the spike threshold was elevated, an after-
hyperpolarizing conductance was activated, and for excitatory neurons
an adaptation conductance was activated. Baseline spike threshold value
was –55 mV. Absolute refractory periods were 3 and 1 ms for RS and FS
neurons. Relative refractory periods were generated by time-varying
thresholds that pulsed up 10 mV on a spike and exponentially decayed to
baseline with a 10 ms time constant (5 ms for FS neurons). This roughly
approximates the refractory effects of Na+ channel inactivation. These
parameters yielded approximate fits to experimental frequency vs.
current plots for cortical neurons (McCormick et al., 1985).
In our prior model the distinction between RS and FS neurons was
imposed simply to be consistent with known cellular physiology. Here we
utilize two differences between the two cell classes as one way to create
an asymmetry in the local circuitry that provides a local gain control
mechanism. Fast-spiking or inhibitory neurons have higher input
resistances and thus have higher current gains (greater slope of the
frequency vs. current plot) than those of RS or excitatory neurons
(McCormick et al., 1985). Current thresholds for FS and RS neurons are
similar, but inhibitory neurons receive substantially fewer synapses and
presumably less synaptic current than excitatory neurons (see Table 1).
Thus, we hypothesize that FS neurons have higher functional thresholds
(e.g. contrast thresholds) than RS neurons. The combination of higher
gain and threshold for a population of inhibitory neurons is one
mechanism used in this paper to achieve a generalized gain control
mechanism in the local circuitry. The essential nonlinearity here is that
the ratio of local excitatory currents to local inhibitory currents evoked
by a stimulus configuration should be high for low stimulus intensities
and should decrease at higher stimulus intensities (see Discussion).
Model Connectivity
In constructing a model network our goals were to represent dense local
intracortical circuitry and connections that traveled long cortical
distances. Given the twin requirements of density and size, a network
with a very large number of neurons had to be constructed. Cortical
circuitry under a 3.5 × 7 mm patch of primary visual cortex was
represented by a model with 20 250 spiking cortical neurons and >1.3
million cortical synapses. Whenever possible, known anatomical values,
ratios and constraints were imposed on the model. Neurons were
organized into a 45 × 90 grid of ‘mini-columns’ (e.g. Peters and Yilmaz,
1993), based on an orientation map obtained by optical recording of
intrinsic signals of cat visual cortex (Toth et al., 1996). Each mini-column
contained four excitatory neurons and one inhibitory neuron (ratio from
Gabbott and Somogyi, 1986). Both excitatory and inhibitory neurons
made short-range intracortical connections, while only excitatory
neurons made long-range connections. Each type of connection targeted
both excitatory and inhibitory post-synaptic neurons (e.g. Beaulieu and
Somogyi, 1990; McGuire et al., 1991; Anderson et al., 1994). Short-range
connection probabilities fell linearly from ρpeak to ρedge at distance dedge,
with ρ = 0 beyond that (see Table 1 for parameters).
As can be seen in Figure 2, excitatory connections dominate at very
short distances and inhibitory connections dominate in a local ring
around them. This center-surround organization is a key property of our
prior model of orientation selectivity (Somers et al., 1995a). Long-range
excitatory neurons preferentially targeted neurons with orientation
preferences similar to their own (Gilbert and Wiesel, 1989; McGuire et
al., 1991; Malach et al., 1993). Connection probabilities varied linearly
with the orientation difference between pre- and postsynaptic cells, from
ρpeak = 0.005 at φ = 0° to ρedge = 0.001 at φ = 90°. Results were averaged over
20 networks, each randomly constructed using the above connectivity
probabilities. Responses were analyzed over the central 3 × 3
mini-columns of the model (36 excitatory neurons). This restricted
population lies within an iso-orientation domain and was selected to
guarantee that the orientation and position of the stimuli were optimal for
classical receptive fields of the cells investigated.
Stimuli and Inputs to Cortex
Stimuli consisted of circular (‘center’) and annular (‘surround’) gratings of
differing contrasts, orientations and radii. Central RF studies used a only
central grating with a diameter approximately equal to the RF (1°).
End-stopping studies varied this diameter. Surround studies combined a
1° diameter center stimulus with a surround annulus (1° inner diameter;
4° outer diameter). Thalamic neuron responses to these stimuli increased
linearly with log contrast. LGN responses were independent of stimulus
orientation, phase and spatial frequency. LGN responses were also
constant over the 300 ms simulation trials. LGN cells with receptive fields
located at the border between center and surround stimuli were driven in
proportion to the degree each stimulus covered the cell’s receceptive
field. Converging thalamocortical inputs to a column were biased for a
particular stimulus orientation and location (Hubel and Wiesel, 1962),
and orientation selectivity was enhanced by intracortical connections
(e.g. Somers et al., 1995a). The pattern of preferred orientations and
locations of converging thalamocortical inputs was determined from the
optical map data (see Fig. 2). The average firing rate of the converging
thalamocortical input to single cortical neurons was a function of
stimulus orientation (θcent, θsurr), contrast (%Contcent, %Contsurr), size and
position:
%Cent and %Surr are the percentages of converging thalamocortical
afferents that are activated by the center and surround stimuli
respectively. θpref and θhw are the preferred orientation of the mini-
column and the half-width at half-amplitude of the orientation tuning of
the convergent pattern of thalamocortical inputs. Note that stimulus
phase and spatial frequency are not factors, and thus a grating stimulus is
equivalent to a patch of oriented bars of the same size, contrast and
orientation. Thalamocortical response rates were converted into spikes
using 10 independent Poisson processes. Cortical magnification was
1 mm/deg and each thalamic neuron projected to cortical neurons over
an area of 0.8 mm2 (Humphrey et al., 1985).
Local Circuit Module Simulations
Local circuit modules were composed of 200 excitatory and 50 inhibitory
neurons each with cellular equations and parameters identical to those in
the full model (see cortical cell model method above). Short-range
connections were made between cells in a module. In addition, cells of
the module received excitatory external inputs that represented the sum
of the thalamocortical and long-range intracortical inputs. For a given
stimulus condition, all excitatory cells received one input value and all
inhibitory cells received another. Module responses were obtained by
computer simulation of this local circuit with different levels of input to
the excitatory and inhibitory cells. Responses were measured for 961
input combinations (grid points). Each response averages over 40 trials
with stimulus durations of 250 ms. The connection probabilities within
this module were ρexcit–excit = 0.0044, ρexcit–inhib = 0.0044, ρinhib–excit =
0.0125, ρinhib–inhib = 0.025. The synaptic strengths were as in the full model
above. In order to compare predictions of the module to the responses of
the full model, external inputs to the module were extracted from
simulations of the full model. These inputs represent the total
thalamocortical and long-range intracortical input to excitatory and
inhibitory cells in a 3 × 3 patch of mini-columns in the center of the
model.
Two different module forms were constructed, one based on
the circuitry of the full model called the gain-threshold asymmetry
module and one that eliminated the threshold asymmetry but obtained
qualitatively similar behavior by utilizing synaptic depression at local
excitatory–excitatory synapses and synaptic facilitation at local
excitatory–inhibitory synapses (Thomson and West, 1993; Thomson et
F x y
x y
thal = ° −
+ ° −
%Cent
%Surr
cent pref hw cent
surr pref hw surr
, cos / log %Contrast
, cos / log %Contrast
b g e j b g
b g e j b g
60
60
θ θ θ
θ θ θ
206 Local Circuit Visual Cortical Model • Somers et al.
al., 1993a; Thomson and Deuchars, 1994; Abbott et al., 1997; Tsodyks
and Markram, 1997). This second module is called the synapse
asymmetry module. Each local excitatory synapse had a synaptic efficacy,
W, and an adaptation level, A, or facilitation level, B, associated with it:
If the presynaptic cell generated an action potential at time t, the peak
of the conductance change was W. Each spike caused an increase in the
adaptation and facilitation levels:
These values decayed to zero, each with time constants τΑ = τΒ = 300 ms:
In the simulation results presented, A and B typically ranged between 0.1
and 0.6. Connectivity probabilities in this module were simplified to
ρexcit–excit = 0.1, ρexcit–inhib = 0.1, ρinhib–excit = 0.1, and ρinhib–inhib = 0.1.
Synaptic strengths onto excitatory neurons were gExcit = 2.5 nS, gInhib = 10
nS and onto inhibitory neurons were gExcit = 2 nS, gInhib = 2 nS. In order to
obtain identical contrast thresholds for excitatory and inhibitory neurons
(for the center only stimulus), the ratio of gLGN onto excitatory vs. gLGN
onto inhibitory neurons was 3:2. This ratio compensates for the different
cellular parameters of the two classes of cells. The ratio of the long-range
inputs to excitatory and inhibitory neurons was 1:1 and the magnitudes
for the two surround conditions were chosen to give a clear example of
the facilitation/suppression property.
Results
Model of Local and Long-range Connections In V1
We shall first show that the large-scale model of V1 (Fig. 2)
explains contrast-dependent modulation of responses locally,
within the classical receptive field, and then explain the
long-range modulation of responses from the extraclassical
receptive field.
The model captures physiological responses to oriented
grating stimuli of differing contrasts presented within the
classical receptive field. Model behavior is analyzed for a
population of neurons lying in the central orientation domain of
the model (yellow peak of Fig. 2). Figure 3A shows mean
responses of 36 excitatory cortical neurons to oriented grating
stimuli of different contrasts presented within the classical
receptive field. Analysis was restricted to this population in
order to ensure that analyzed cells were driven by optimally
positioned and oriented center stimuli. These responses were
averaged for the same set of neurons in 20 networks, each
constructed with the same connectivity probability rules.
To isolate cortical effects, thalamic responses were designed
to increase linearly with log contrast. The dotted lines in Figure
3A show contrast response curves for the cortical neurons at two
different stimulus orientations when intracortical synapses are
shut off and only thalamocortical inputs are active; note the
linear responses above threshold. In the full model, with
intracortical synapses active, cortical responses (data points and
solid lines in Fig. 3A) exhibit a saturation nonlinearity at higher
contrasts. This occurs at contrast levels for which thalamic
responses have not yet saturated. Contrast saturation in the
model is achieved as a network property rather than as a cellular
W g A t A A
W g B t B B
ex ex ex ex
ex in ex in
− −
− −
= − ≤ ≤ =
= ≤ ≤ =
1 0 1 0 0
0 1 0 0
b g b g
b g b g
A t A t A t
B t B t B t
+ = + −
+ = + −
1 01 1
1 01 1
.
.
d i
d i
A t A t
B t B t
A
B
+ = −
+ = −
1 1
1 1
exp /
exp /
τ
τ
b g
b g
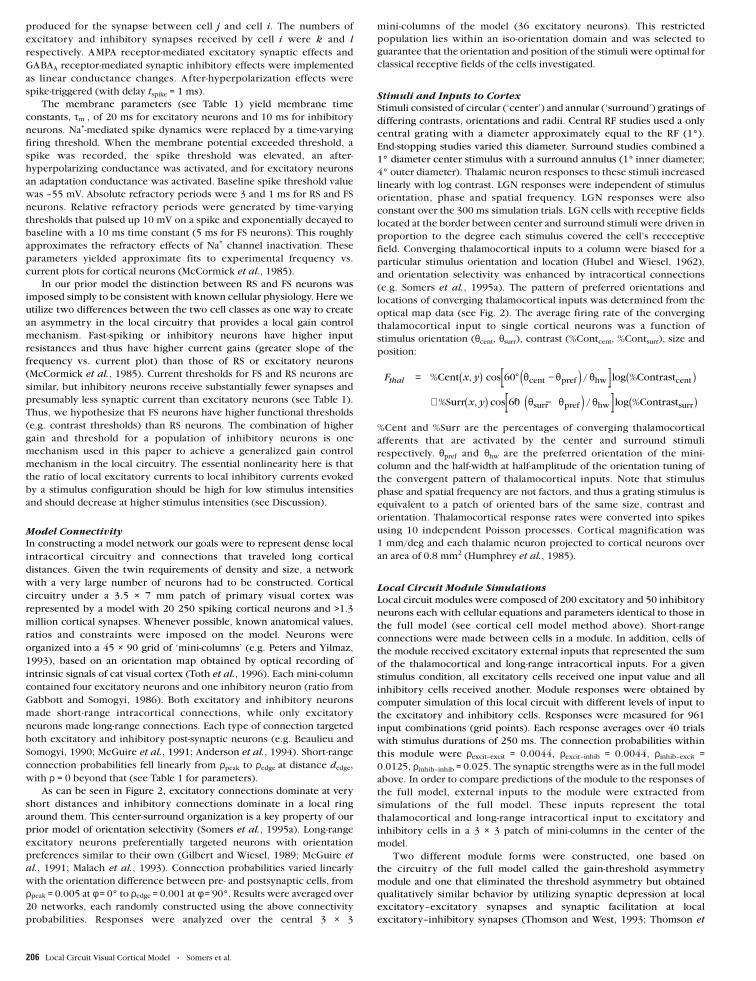
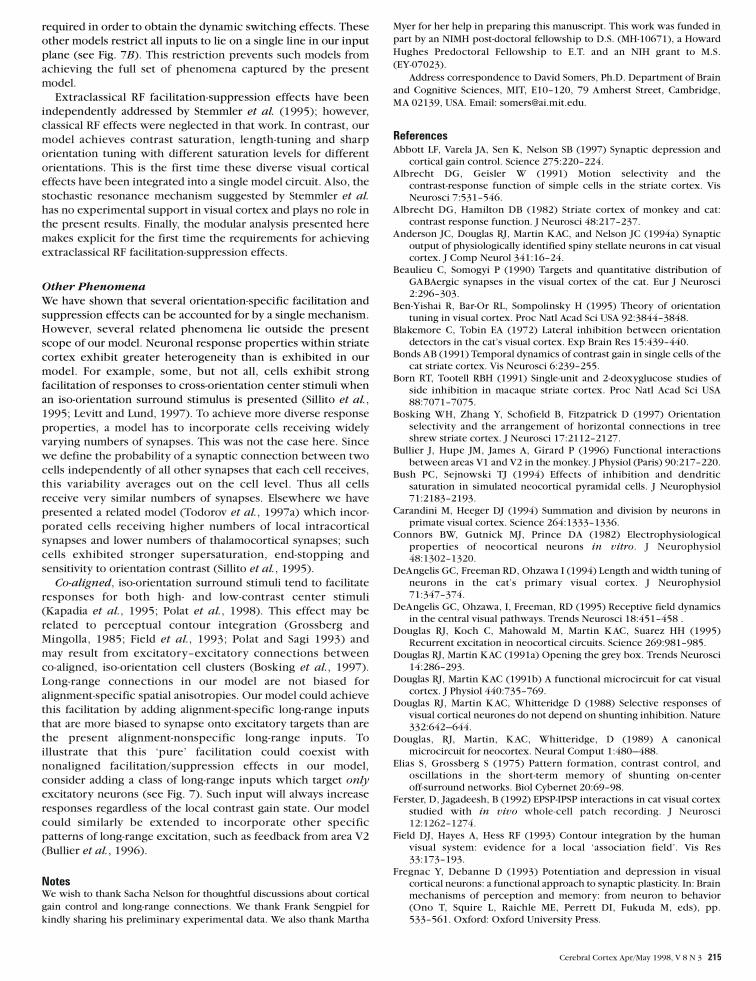
Figure 2. Connectivity of cortical circuitry in the model. The color map represents the orientation preference of each cortical mini column. The pattern of intracortical connectionsto cells in the central (yellow) mini-column is represented by the surface amplitude, which codes the net (Σ Excit – Σ Inhib ) strength of intracortical connections from each columnto the cells of the central column. Three classes of intracortical connections are included in the model: short-range excitatory, short-range inhibitory and long-range excitatory.Short-range connections are densest in the vicinity of the presynaptic cells and fall off with distance. Short-range excitatory connections are more numerous, but more spatiallyrestricted than short-range inhibitory connections. This results in the ‘Center-Surround’ shape near the central orientation column. Long-range excitatory connections can span theentire circuit and preferentially target cells with similar orientation biases. Note that long-range peaks lie in yellow-colored columns. All connections target both excitatory andinhibitory neurons. Amplitude of long-range inputs has been scaled by a factor of 15 to aid visibility in the figure.
Cerebral Cortex Apr/May 1998, V 8 N 3 207
property. Responses at saturation are a mere fraction of the
maximal responses of these neurons to an injected current (e.g.
40 vs. 300 imp/s). Moreover, saturation response levels vary with
stimulus orientation. These simulation results were well fit (solid
curves) by hyperbolic contrast response functions, R = RmaxCγ/
(C50γ + Cγ), which have been shown to provide superior fits to
experimental contrast response data (Albrecht and Hamilton,
1982). Results for both orientations were fit with the same
exponent (γ) of 2.8. Rmax values were 43 and 28. Mid-level
contrasts (C50) were 5 and 7% for preferred and 20° respectively.
Consistent with our prior model (Somers et al., 1995a), cortical
inputs sharpen orientation tuning (compare differences
between 0° and 20° responses. Note that intracortical connec-
tions amplify responses to low-contrast stimuli at the preferred
orientation, but attenuate responses to high-contrast stimuli.
Contrast saturation in our model ref lects a gain change in local
cortical circuitry that results from an asymmetry between the
properties of excitatory and inhibitory neurons. Inputs from
inhibitory neurons grow proportionally stronger at high levels of
input drive; population responses for inhibitory neurons
saturate only when LGN responses saturate.
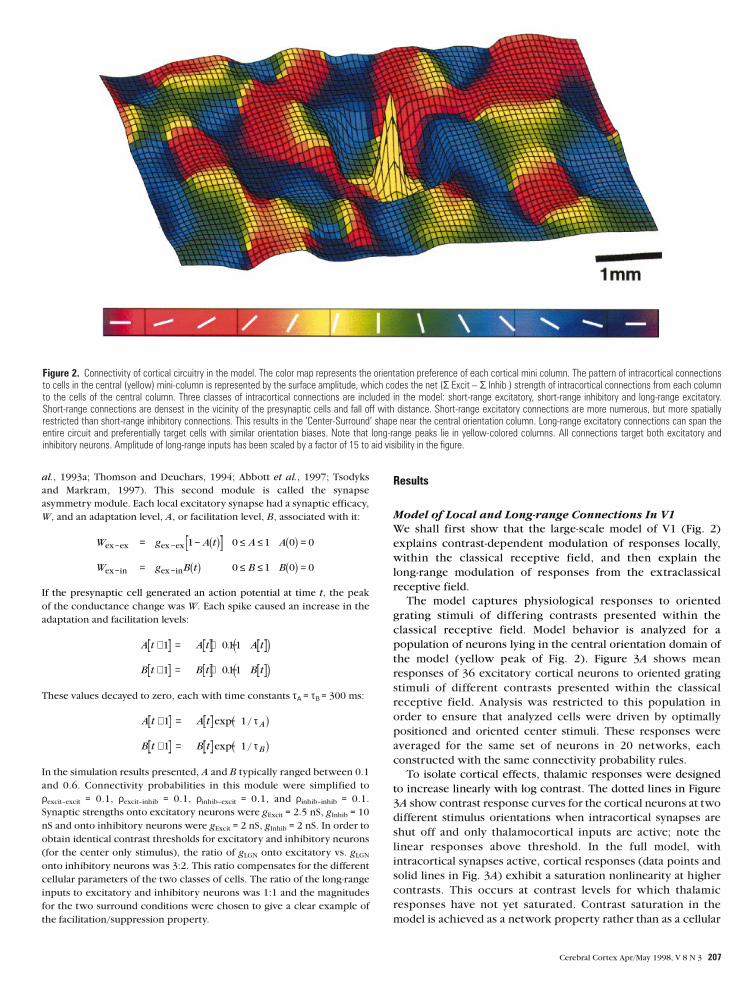
Figure 3. Contrast response functions of model. (A) Mean firing rates of 36 excitatoryneurons in the central 3 × 3 columns of the model to different levels of stimuluscontrast (20 trials; error bars show standard deviation). Grating stimuli were shown atthe preferred orientation (black curves) and 20° off of preferred (gray curves). Datapoints and solid curves display responses of the full model circuit. Dashed curvesdisplay responses of the same cells when intracortical connections were silenced andonly thalamocortical inputs were active. Cortical inputs strongly amplify responses tolow suprathreshold contrasts, but attenuate responses to high contrasts (compare solidto dashed). Cortical circuitry provides saturating responses with different plateaus fordifferent orientations. Solid curves fit the simulation data using a hyperbolic function R= RmaxCγ/(C50
γ + Cγ) (Albrecht and Hamilton, 1982). γ = 2.8 for both curves and C50= 5 and 7% for preferred and 20° respectively. Cortical inputs also sharpen orientationselectivity. (B) For a subpopulation (18/36) of these neurons, responses decline at highcontrasts (dashed line). This is called ‘supersaturation’. Solid and dotted lines replotresults from A (with standard error bars).
Figure 4. Preferred stimulus length increases with decreasing stimulus contrast. (A)Response vs. stimulus diameter for the same cells as Fig. 3A at five different contrastlevels (60, 10, 5, 3, 2%) of the preferred orientation (10 trials, SD shown). For thehighest contrast stimuli (top curve) responses are maximal for small stimuli (<1.5°) anddecrease for larger stimuli. Thus the model exhibits a form of length-tuning orend-stopping. As stimulus contrast decreases (lower curves), excitatory lengthsummation occurs for progressively larger stimuli. Note that responses to the lowestcontrast are still increasing at 4°. Compare this contrast-dependence to hypotheticalcontrast-independent length summation curves shown in B. (B) High-contrast lengthresponse curve scaled by factors 1.0, 0.8, 0.6, 0.4 and 0.2.
Figure 5. Facilitation and suppression by high-contrast surround stimuli. Responses ofthe same model neurons as in Figures 3A and 4A to varying contrast levels of a centerstimulus under three fixed surround conditions: no surround (solid), high contrastcross-orientation surround (dotted), high contrast iso-orientation surround (dashed).Both surround stimuli increase responses to low contrast centers but decreaseresponses to high contrast center stimuli. Both facilitation and suppression effects arestronger for the iso-orientation surround.
208 Local Circuit Visual Cortical Model • Somers et al.

In this work, two mechanisms are demonstrated to produce
the local circuit asymmetry: (i) a population-level bias among
inhibitory neurons to have higher gain and higher contrast
thresholds than excitatory cells; and (ii) differential adaptation
and enhancement at local intracortical excitatory synapses onto
excitatory and inhibitory neurons respectively (Thomson and
West, 1993; Thomson et al., 1993a,b, 1995; Thomson and
Deuchars, 1994). The results presented in Figures 3–8 were
obtained with the first mechanism. Inhibitory neurons in the
model have a higher gain because FS cells have a much higher
input resistance and proportionally greater response to injected
current levels than do RS cells (Connors et al., 1982; McCormick
et al., 1985). The higher contrast threshold results because
thalamic inputs provide proportionally fewer excitatory
synapses onto inhibitory neurons than onto excitatory neurons.
Later in this paper we demonstrate that the second mechanism
obtains the same essential local circuit behavior (see Fig. 9).
For a subpopulation of modeled neurons (18/36 cells), a
decline in response at high contrast was observed (see Fig. 3B).
Li and Creutzfeldt (1984) described this behavior in detail,
calling the decline ‘supersaturation’, because it occurs at
contrast levels beyond which normal contrast saturation can be
observed. Those authors suggested that supersaturation might
result from reduced drive from thalamic sources at high
contrasts; here, we show that a purely cortical mechanism is
sufficient. The supersaturation effect, although infrequently
discussed, can also be seen in other experimental reports (e.g.
Bonds, 1991; Albrecht and Hamilton, 1982). Thus, for some
cells, even the classical excitatory RF can have inhibitory effects
when stimulation is strong.
The effects of varying stimulus length and contrast were also
systematically explored within the simulations. Responses to a
high-contrast visual stimulus were observed to decline beyond a
characteristic preferred size (see top curve of Fig. 4A). Thus the
model exhibited a form of length-tuning or end-stopping (Hubel
and Wiesel, 1965). Consistent with experiments (e.g. Orban et
Figure 6. Local circuit module construction. Behavior of a local population M in the full model is estimated by constructing a local circuit module composed of excitatory andinhibitory populations. (A) The module simplifies analysis of RF integration by capturing nonlinear local cortical interactions over a radius R. The module is constructed by replacinglocal inputs (from the gray shaded area between M and R with local inputs from within M. (B) Activity in the module depends only on thalamocortical and long-range intracorticalexcitatory inputs to the module. All sources of long-distance input (possibly including feedback from higher cortical areas) are summed together linearly, but inputs to excitatory andinhibitory cells remain segregated. Simulations of the local circuit module are much faster than those of the full model and thus permit exploration of local circuit responses to allpossible input values.
Cerebral Cortex Apr/May 1998, V 8 N 3 209

al., 1979; DeAngelis et al., 1994), high contrast iso-orientation
stimuli that extend into end-zone (or side-band) regions have
potent inhibitory effects on responses to the central stimulus. In
agreement with experimental findings of Jagadeesh and Ferster
(1990; also Jagadeesh, 1993), the length of the excitatory
receptive field increased with decreasing contrast, and at low
stimulus contrasts, responses to optimal orientation gratings
continued to increase monotonically. Both the experiment and
simulations indicate that the borders between excitatory and
inhibitory regions shift depending on the level of stimulus
contrast. For comparison’s sake, Figure 4B displays what the
length tuning curves would look like if contrast-invariant length
summation occurred.
While preserving classical RF properties, the model also
captures paradoxical extraclassical RF modulations (Knierim
and Van Essen, 1992; Sillito et al., 1995; Toth et al., 1996;
Levitt and Lund, 1997; Polat et al., 1998; Sengpiel et al., 1998)
The contrast of a central grating was varied under three
different surround stimulus conditions: no surround; a high-
contrast cross-orientation surround stimulus; and a high-contrast
iso-orientation surround stimulus. The modulatory inf luence of
‘surround’ gratings on responses to optimal orientation ‘center’
stimuli shifts from facilitatory to suppressive as center stimulus
contrast increases (Fig. 5, cf. Fig. 1A). Model simulations also
obtain the result that both facilitation and suppression effects are
strongest for iso-orientation surround stimuli (Knierim and Van
Essen, 1992; Sillito et al., 1995; Weliky et al., 1995; Toth et al.,
1996; Levitt and Lund, 1997). These effects emerge from the
local intracortical interactions (as will be shown below) and do
not require synaptic plasticity (cf. Hirsch and Gilbert, 1991;
Gilbert et al., 1996) or complex cellular properties (cf. Bush and
Sejnowski, 1994). This model also provides the first unified
account of these classical and extraclassical RF modulations.
A Technique for Analyzing Local Circuit Behavior
The focus of this paper is to investigate how local circuitry
responds to combinations of long-range input. Large-scale model
simulation, while useful for addressing computational effects of
neurobiological details, can be analytically cumbersome. In this
section we develop a technique for analyzing large-scale
recurrent models of cortical circuitry that allows us to go beyond
simulation and to understand what features of the model are
crucial for obtaining the phenomena of interest. The main idea is
to focus on the behavior of local, densely interconnected
populations of cortical neurons, and to treat them as functional
units or ‘modules’ with a well defined input–output relationship.
This analysis was inspired by anatomical studies indicating that
in many cortical areas relatively punctate local circuit structures
are replicated many times across the region (e.g. Mountcastle,
1978; Lund et al., 1993; Peters and Yilmaz, 1993), as well as by
extensive physiological evidence that local clusters of cells share
many stimulus response preferences.
To understand what features of the simulation cause a cortical
neuron to respond in the way it does, we have to describe three
types of inputs: thalamocortical, long-range horizontal and dense
local cortical projections. We suggest that much of the
complexity in RF effects results from the local cortical inputs.
Thalamocortical and long-range horizontal inputs, which
together we will call ‘distal inputs’ (always excitatory), can be
easily computed for the stimuli we study here (see below).
However, local inputs arise from cells which are densely
interconnected with each other and with the neuron of interest.
These recurrent interactions make estimation of the local inputs
a complex task. RF analysis could be greatly simplified, provided
that one were able to identify a small group of cells whose
behavior is only a function of their distal inputs and the
interactions among them (i.e. local interactions with cells
outside that group do not have to be taken into account). It is not
straightforward to do this, because anatomically the cortex is not
strictly modular but instead is connected in a continuous
fashion. Although an individual neuron receives the majority of
its inputs from presynaptic neurons within a small radius
(White, 1989; also Fig. 2), one cannot simply draw a boundary at
that radius and treat the enclosed cells as a module, because cells
at the periphery will receive many local projections from outside
the boundary. Regardless of where one draws the anatomical
boundary of a module, there will be significant interactions with
cells right outside the boundary, which will force us to extend
the boundary even further until it eventually encloses the entire
large-scale model.
What we propose instead is an abstract functional module: a
small isolated group of neurons that are interconnected in such a
way as to reproduce the responses of a local neuronal population
embedded in the continuously connected cortical sheet. Figure
6A illustrates how such a functional module can be constructed.
The top diagram shows an array of orientation-tuned cells (in
one dimension for clarity) in the original model, and their
projections into a small area M. The larger circle R defines what
is considered a local vs. a distal projection to M. Suppose we
applied the following transformation at one location in the
model: remove every projection from the shaded area into M(dashed arrows), and replace it with a projection from within Mthat has a randomly chosen presynaptic cell and the same
postsynaptic cell (bottom diagram). What would happen if we
were to run a simulation with the modified cortical model? The
only cells that receive different synaptic inputs are the ones in M.
Each cell in M receives exactly the same number of synapses as
before; the difference is that some presynaptic cells are now in
M instead of the being in the shaded area between M and R.
However, if R is small enough so that the firing rates within R are
very similar, the cells in M will receive the same input and thus
our manipulation will not change the activity in the model. The
same idea also can be applied with the assumption of
nonuniform firing profiles inside R. Note that the activity in Mafter the transformation will depend only on distal inputs. That
is, we have eliminated the problematic local projections from
outside the module boundary while compensating for their
effects.
The resulting functional module is illustrated in Figure 6B. It
consists of one excitatory and one inhibitory population of
neurons, homogeneously interconnected (i.e. connection
probability and strength depend only on the pre- and
postsynaptic cell types). Both populations are directly driven by
distal excitatory input, which is the net input arriving from all
areas projecting to M. Although we do not address the effects of
inputs from higher cortical areas in this paper, the same
conceptual framework can be used to analyze them. The
response of the excitatory population is defined as the output
of the module. The module is described completely by its
input–output relationship, which is a scalar function of two-
dimensional vector input — e.g. a response surface (see Fig. 7B).
To actually construct the module and simulate its response
surface, we have to fix M and R. Clearly, the approximation is
sensitive to the choice of R. If R is too large, our assumption
about homogeneous firing rates within R will fail. If R is too
small, what we defined as ‘distal’ input will actually include a
210 Local Circuit Visual Cortical Model • Somers et al.

substantial amount of local input, and the module will no longer
be useful since the computation of ‘distal’ input as a function of
visual stimulus will not be possible. Furthermore, we are
assuming that distal inputs are only excitatory, i.e. for a small Rmany local inhibitory projections will have to be ignored,
resulting in increased approximation error. The optimal radius
for R achieves a balance between these constraints; we have
found through simulations that radius to be 300n350 µm (see
Fig. 7D insert). The area M can be made very small (e.g. 1
mini-column). To avoid undesirable synchronization effects due
to the increased number of connections in M, we increased the
number of cells in M while preserving the average number of
connections per cell. (See Local Circuit Module Simulation
Methods for parameter details.)
Modular Analysis of Contrast Saturation and Surround
Facilitation/Suppression
We now apply the analytical technique developed above to the
phenomena observed in our large-scale simulation. To predict
and to analyze the response of the full model to a given stimulus,
we have to: (i) construct a functional module for the desired
location in the model (the center in Fig. 2) and obtain its
response surface (Fig. 7B); (ii) estimate the distal input (sum of
thalamocortical and long-range horizontal input) to that location;
and (iii) measure the height of the response surface above the
two-dimensional point corresponding to the distal input to
excitatory and inhibitory cells in the module.
Estimating the net distal input to the center of the model is
straightforward. Assume the surround stimulus is fixed, while
we gradually increase the contrast of the center stimulus. The
responses in the model outside the central area will remain
almost constant, and therefore the long-range horizontal inputs
to the center will also remain constant. The thalamocortical drive
to both excitatory and inhibitory cells in the center will increase
with stimulus contrast. However, since the synapses from LGN to
V1 remain fixed, the net increase in the two components of the
input will be proportional, i.e. the two-dimensional input will
translate along a straight line (Fig. 6A). The same will occur if we
fix the contrast of the central stimulus, and vary the contrast or
orientation of the surround — then the thalamocortical input will
remain fixed, while the long-range horizontal input will vary
along a straight line. In general, whenever we vary the activity of
a single input source (Fig. 6B), the distal input will move along a
straight line in the two-dimensional input space; the slope of the
line is simply the ratio of synaptic strength from that input
source to the excitatory and inhibitory cells in the central area.
The prior surround modulation simulations in the full model
explored the effects of increasing the contrast of a central
stimulus under three fixed surround conditions. The three lines
in Figure 7A correspond to the actual distal input to excitatory
and inhibitory cells in the center of the model for the three
surround conditions as center contrast is increased. Note that the
linearity of the extracted distal input indicates that the module is
large enough to encapsulate all local interactions (i.e. if we were
to define a module with R = 1 cell, these lines would be rather
curved, and impossible to compute without running the full
simulation).
We can now predict contrast response functions simply by
projecting the lines from the input plane onto the response
surface and aligning their origins. The back plane of Figure 7C
displays the predicted contrast response curves for the three
surround conditions. Figure 7D compares the responses
predicted by the module (dashed lines) to the responses of the
full model (solid lines). The module clearly captures the
paradoxical extraclassical receptive field effects. Thus, local
circuit interactions alone (without complex cellular or synaptic
changes) are sufficient to explain how a receptive field
component — even an extraclassical RF region mediated by
long-range connections — can shift contextually between
facilitating and suppressing responses.
The effect of module size on prediction error was
investigated. Contrast response functions predicted by a module
of a given radius were computed for both excitatory and
inhibitory populations. The average absolute error between the
predicted functions and the full simulations are shown (Fig. 7D
insert) for each radius. Error measurements weight each cell
equally, thus excitatory response error contributes four times
more heavily than inhibitory response error. Error is computed
for both center only (solid) and center-surround (dashed)
stimuli. Error is minimized for a module radius of ∼350 µm. The
U-shape of the function ref lects a trade-off between two sources
of error: neglecting some inhibitory inf luences at small radii and
assuming too much homogeneity across mini-columns at large
module radii.
Figure 7. Center and surround effects predicted by module. (A) External inputs to excitatory and inhibitory populations of the full model for varying center contrast under the threesurround conditions (red, center only; cyan, cross-orientation surround; dark blue, iso-orientation surround). Increasing stimulus contrast proportionally scales the input to the twopopulations and thus forms a line. Surround stimulus inputs translate the contrast input line. Long-range inputs are less biased toward excitatory cells than are thalamocortical inputs.Note that these inputs are very nearly linear. (B) Mean response of module excitatory population to all levels of input to the two populations. Note that inputs are in synapticconductance units and outputs are in spikes/s. Responses in upper right region are clipped in order to increase plot resolution in the area of interest. (C) Contrast response functionspredicted by module are obtained by projecting input lines of A onto surface of B and then aligning the origins at zero contrast (see back plane). (D) Module predictions (dashed lines)closely approximate the full model responses (solid lines) for all conditions. Thus both suppressive and facilitatory extraclassical RF modulations are captured within the local corticalcircuitry. The effect of module radius choice on prediction accuracy is shown in the insert. Error is minimized for a module radius of ∼350 µm.
Figure 8. Piecewise linear approximation of excitatory module surface. Facilitation-suppression effects can be captured even by a simple module composed of one excitatory andone inhibitory neuron, each with threshold-linear cellular response properties and with linear interactions between the neurons. Such a module generically produces a surface thatconsists of: region A, where excitatory response is weak and inhibitory neurons are active; region B, where excitatory neurons are active and inhibitory responses are weak; andregion C, where both populations are active. The surface in Figure 7B,C can be seen as a smoothed version of this surface. Any contrast input line which projects onto regions B andC will generate a response function with high gain at low contrast and low gain at high contrasts. Depending on the balance between local excitatory and inhibitory synaptic strengthsand the ratio of the thalamocortical inputs to the two populations, saturating or supersaturating contrast response functions can be obtained. Long-range inputs which translate theinput line up, with more relative inhibition than the thalamocortical inputs, can produce response facilitation for low-contrast centers and suppression for high-contrast center stimuli.
Figure 9. Alternative local circuit module (the ‘synapse asymmetry module’). This module employs a different form of asymmetry between local excitation and inhibition yet obtainsthe same qualitative behavior as the module extracted directly from the full model (see Fig. 7). Here, the asymmetry between excitatory and inhibitory neuron contrast thresholds iseliminated; instead, a known asymmetry in synaptic transmission ratios is exploited. Transmission failure rates at local excitatory–excitatory synapses increase as presynaptic firingrates increase, while failure rates at local excitatory–inhibitory synapses decrease as presynaptic firing rates increase. This local circuit mechanism also achieves the long-rangefacilitation-suppression effects with similar inputs to those used in the module of Figure 7.
Cerebral Cortex Apr/May 1998, V 8 N 3 211

212 Local Circuit Visual Cortical Model • Somers et al.

Analysis of Module Surface Shape
The shape of the module response surface is obviously crucial
for obtaining our results. In this section we present a
mathematical analysis of the features of the response surface.
Here we construct a greatly simplified module consisting of a
population of one excitatory and one inhibitory neuron with
threshold-linear responses and linear interactions. Excitatory
and inhibitory neurons have thresholds θex, θin. Above threshold,
responses increase with gains (or slopes) Kex, Kin. Total afferent
inputs to the two cells are the sum of the thalamic and
long-range inputs:
where Mt, Mh are thalamic and long-range horizontal firing rates,
and Tex, Tin, Hex, Hin are the corresponding synaptic efficacies. In
addition, the module cells are interconnected. The synaptic
weights among excitatory (e) and inhibitory (i) cells in the
module are Wee, Wei, Wie, Wii. The mean firing rates in the
module can then be expressed by the following piecewise-linear
system of equations:
The response surface in Figure 8, Mex( Iex, Iin ), is obtained
from the above system and has the same shape for a very broad
range of parameter values. The surface can be divided into three
regions: region A, where inhibitory responses are strong and
excitatory responses are weak; region B, where excitatory
responses are strong and inhibitory are weak; and region C,
where both are strong and competing. Any straight line in the
input plane which projects onto the surfaces of regions B and C
will activate a form of gain control; response gains within region
C arise more slowly than in region B.
Response saturation occurs when the input line crosses
region B and is parallel to the contours in region C, i.e. θin/θex >
Tin/Tex = (Wii + 1/Kin)/Wie (shown with red curve). In other
words, saturation occurs when inhibition balances excitation.
Supersaturation results from increasing the slope of the contrast
input line, so that Tin/Tex > (Wii + 1/Kin)/Wie. That is, super-
saturation occurs when inhibition overcompensates for
excitation. These effects depend on the relative balance of local
excitatory and inhibitory synaptic strengths as well as on the
relative proportions of the thalamic drive. The surround
facilitation/suppression effect (compare blue curve to red
curve) is obtained when the translation vector resulting from
surround stimulation has a greater slope than the contrast input
line, i.e. Hin/Hex > Tin/Tex. Thus, the biphasic surround effect
requires long-range excitatory connections to be less biased
toward excitatory local cells than are the thalamocortical inputs.
Although this simplified module neglects driving force
nonlinearities and response smoothing around threshold (see
Fig. 3A, thalamocortical inputs alone), it is sufficient to capture
the paradoxical extraclassical RF effects; moreover, it has
revealed the requirements for achieving this effect.
The response surface for the actual module (Fig. 7C,D) is
essentially a smoothed version of this piecewise-linear surface
(Fig. 8), which is to be expected since integrate-and-fire neurons
have approximately threshold-linear feedforward responses (see
Fig. 3A, dashed lines). As for the piecewise-linear module, the
key for obtaining both phenomena is the existence of region B,
in which excitatory neurons respond relatively strongly while
local inhibitory inputs are weak. Region B exists here because
thalamocortical inputs, on average, will drive excitatory neurons
at a lower input level than that required to drive inhibitory
neurons above threshold. This corresponds to the prediction
that inhibitory neurons, on average, have a higher contrast
threshold than do excitatory neurons. Note that while the
injected current threshold is lower for inhibitory neurons than
for excitatory neurons in our model, the contrast threshold
for inhibitory neurons is higher because thalamocortical
connections are strongly biased toward excitatory neurons. In
simulations of our full model, mean contrast thresholds for
excitatory and inhibitory cortical neurons were 2 and 4%
respectively.
An Alternative Mechanism for Obtaining the Same
Module Response Surface
Having demonstrated that the paradoxical extraclassical RF
effects can be explained in terms of the local cortical circuitry,
we can now explore other possible neural mechanisms using
local circuit modules. The simulation results presented to this
point depend upon having a population of inhibitory neurons
that, on average, have higher contrast thresholds than the
excitatory population. This mechanism is conceptually simple,
but it is not the only form of local circuit mechanism which can
support these behaviors. The essential behaviors were obtained
in a different local circuit in which thalamocortical inputs drive
excitatory and inhibitory neurons above threshold (both 1 and 5
Hz above baseline criteria) at the same contrast levels. The
necessary asymmetry in the module was obtained by modulating
the efficacies of the short-range excitatory synapses onto
excitatory and inhibitory neurons. Thomson and colleagues
(Thomson and West, 1993; Thomson et al., 1993a; Thomson and
Deuchars, 1994) and others (Abbott et al., 1997; Tsodyks and
Markram, 1997) have reported, based on dual intracellular
recordings, that synaptic transmission rates between excitatory
neurons decline as the presynaptic neuron firing rate increases.
Conversely, synaptic transmission from excitatory to inhibitory
cortical neurons increases as presynaptic neuron firing rates
increase (Thomson et al., 1993b, 1995). These changes in
synaptic efficacy were modeled as time varying synaptic
strengths (see Materials and Methods).
Figure 9 demonstrates that this mechanism generates a local
circuit module with equivalent properties to the gain-threshold
asymmetry module (cf. Fig. 7C). Thus, these simulations
demonstrate two local circuit mechanisms for which local
inhibitory inputs grow at a higher rate than local excitatory
inputs given proportionally increasing levels of external drive to
the two populations.
DiscussionIn this paper, we have demonstrated that RF inf luences may
contextually switch between excitatory and inhibitory in a
circuit with fixed cellular and synaptic properties. These effects
appear paradoxical when RF integration is studied at the single
cell level, yet are straightforward when RF integration is studied
at the local circuit level. This work, for the first time, draws a
connection between several paradoxical phenomena: two
contrast-dependent effects within the classical RF (contrast
supersaturation and contrast-dependent length tuning) and a
contrast-dependent effect involving extraclassical RF inf luences.
Using detailed computer simulations we have demonstrated that
I M T M H
I M T M H
ex t ex h ex
in t in h in
= +
= +
M K I W M W M
M K I W M W M
ex ex ex ee ex ie in ex
in in in ei ex ii in in
= + − −
= + − −
θ
θ
b g
b g
Cerebral Cortex Apr/May 1998, V 8 N 3 213
all three phenomena could be explained by the same local circuit
model.
In addition, we have presented an analytical technique for
studying local circuit interactions within a closed system. This
modular analysis provides accurate quantitative predictions of
the large-scale model simulations and conclusively shows that
local circuitry alone is sufficient to account for the paradoxical
phenomena. In addition, this analysis clarifies the requirements
for obtaining these effects, the foremost of which is an asym-
metry between excitatory and inhibitory local circuit responses.
The modular analysis was also employed to demonstrate an
alternative local circuit mechanism which obtains the necessary
asymmetry. Given the nonlinearity and complexity of local
circuit models, such analytical techniques are essential if local
circuit approaches are to have general application. This work
also advances our computational understanding of how local
cortical circuitry may serve as a functional module (e.g.
Szentagothai, 1975; Mountcastle, 1978; Rakic, 1988; Douglas
et al., 1989; Lund et al., 1993). Our analysis suggests that
functional modules operate on a spatial scale that is intermediate
to mini-columns (∼50 µm; Peters and Sethares, 1991, 1996) and
hyper-columns (∼1 mm; Hubel and Wiesel, 1962).
Receptive Field Integration Performed by Local Cortical
Circuitry
The present paper contributes to a growing body of work which
studies RF integration at the level of the local cortical circuitry
rather than at the level of the single neuron (e.g. Douglas and
Martin, 1991a; Fregnac and Debanne, 1993; Douglas et al., 1995;
Somers et al., 1995a; Stemmler et al., 1995; Suarez et al., 1995;
Salinas and Abbott, 1996). The notion of a RF that emerges here
treats the contribution from each RF location as a two-
dimensional vector, with component inputs to local excitatory
and local inhibitory cells. The relative contributions (or vector
angle) are fixed by the anatomy (i.e. number and efficacy of
synapses onto excitatory and inhibitory cells), while the
magnitude varies with stimulus strength. The two input
components activate a set of nonlinear interactions within the
local circuit in an amplitude-dependent manner, in which the
ratio of inhibitory to excitatory inf luence grows proportionally
stronger as the overall stimulus drive (i.e. contrast, spatial
extent) increases. This representation has superior predictive
power over simpler models provided that the ratio of input to
local excitatory and to local inhibitory cells (i.e. vector angle)
changes across RF positions. Here, we have suggested that the
drive to inhibitory inputs is relatively stronger at large distances
from the receptive field center. We wish to suggest that the input
ratio (vector angle) varies smoothly as a function of distance
from RF center. This, combined with a gain control mechanism,
permits the size of the classical RF to vary inversely with the
level of drive.
Local Circuit Asymmetry
The dynamic RF effects demonstrated here rely on an asymmetry
between excitatory and inhibitory inputs in the local cortical
circuitry. The critical property is that net inhibitory local circuit
inf luences grow stronger at a greater rate than that of local
excitatory inf luences as external drive levels increase. This idea
is also supported by electrical stimulation experiments in slices
of visual cortex (Hirsch, 1995; Weliky et al., 1995 ). We have
proposed two specific mechanisms for achieving this local
circuit asymmetry. The first is to utilize inhibitory neurons
which, as a population, have higher response gain and higher
contrast threshold than excitatory neurons. Based on cellular
physiology (McCormick et al., 1985), it is known that FS or
inhibitory cells have much higher response gains than RS or
excitatory neurons. However, the requirement for a higher-
contrast threshold has not been examined experimentally and
this assumption represents one experimental prediction of our
model. Because this threshold difference need only occur at a
population level, it is possible to achieve this result if multiple
classes of inhibitory neurons, some with high thresholds and
some with low thresholds, exist. Lund and colleagues (cf. Lund et
al., 1995) have identified several morphological classes of
inhibitory neurons in V1. Our analysis suggests that high
threshold inhibitory neurons play a central role in gain control.
Recent synaptic physiology studies (Abbott et al., 1997;
Tsodyks and Markram, 1997) indicate that rapid activity-
dependent changes in synaptic efficacy at excitatory–excitatory
cortical synapses may profoundly inf luence cortical processing.
Here, we suggest that if efficacy changes at excitatory–
inhibitory synapses have the opposite sign, as is suggested by the
data of Thomson and Deuchars (1994), then modulation of
short-range synapses is sufficient to support contextual
switching effects for both local and long-range inputs to the local
cortical circuitry.
Contrast Gain Control as a Circuit Property
The functional asymmetry in the local cortical circuitry provides
a generalized contrast gain control mechanism that can be
accessed by all input sources. At low center-driving contrasts,
local cortical excitation provides strong amplification of
suprathreshold inputs. As center drive levels increase, local
inhibition grows to reduce the cortical amplification factor. As a
result the model achieves saturating and supersaturating
contrast response functions as a local circuit property. This
result is consistent with experimental evidence that contrast
saturation occurs when neither cellular firing rates nor synaptic
inputs have reached plateau values. Thus, we suggest that the
notion that excitation saturates is incorrect; rather, inhibition
counterbalances excitation. The model makes the specific
prediction that cortical amplification is strongest for low-
contrast suprathreshold stimuli (of the preferred orientation)
and that amplification decreases and may even become
attenuation as contrast increases.
This local circuit form of gain control, unlike cellular or input
saturation ideas, also captures spatial contrast gain effects.
Excitatory RF regions are spatially restricted when the total
inputs are strong, but enlarge as inputs get weaker. These
expansion–contraction effects are adaptive in that they collect
(excitatory) information more widely when the overall signal is
weak but restrict their spatial spread when the signal from more
central RF regions is stronger. It should be noted that the term
‘contrast gain control’ has an ambiguous meaning in the
literature, referring both to instantaneous contrast saturation, as
discussed here, and slower-acting contrast adaptation.
Elsewhere, we have used this model structure to address
contrast adaptation effects (Todorov et al., 1997b).
Other Models
Contrast saturation effects have been achieved by other network
models (e.g. Grossberg, 1973; Heeger, 1992, 1993; Carandini
and Heeger, 1994); however, these models oversimplify cortical
circuitry, effectively yoking together excitatory and inhibitory
responses. Our analysis (Figs 7 and 8) makes clear that an
asymmetry between excitatory and inhibitory contributions is
214 Local Circuit Visual Cortical Model • Somers et al.
required in order to obtain the dynamic switching effects. These
other models restrict all inputs to lie on a single line in our input
plane (see Fig. 7B). This restriction prevents such models from
achieving the full set of phenomena captured by the present
model.
Extraclassical RF facilitation-suppression effects have been
independently addressed by Stemmler et al. (1995); however,
classical RF effects were neglected in that work. In contrast, our
model achieves contrast saturation, length-tuning and sharp
orientation tuning with different saturation levels for different
orientations. This is the first time these diverse visual cortical
effects have been integrated into a single model circuit. Also, the
stochastic resonance mechanism suggested by Stemmler et al.
has no experimental support in visual cortex and plays no role in
the present results. Finally, the modular analysis presented here
makes explicit for the first time the requirements for achieving
extraclassical RF facilitation-suppression effects.
Other Phenomena
We have shown that several orientation-specific facilitation and
suppression effects can be accounted for by a single mechanism.
However, several related phenomena lie outside the present
scope of our model. Neuronal response properties within striate
cortex exhibit greater heterogeneity than is exhibited in our
model. For example, some, but not all, cells exhibit strong
facilitation of responses to cross-orientation center stimuli when
an iso-orientation surround stimulus is presented (Sillito et al.,
1995; Levitt and Lund, 1997). To achieve more diverse response
properties, a model has to incorporate cells receiving widely
varying numbers of synapses. This was not the case here. Since
we define the probability of a synaptic connection between two
cells independently of all other synapses that each cell receives,
this variability averages out on the cell level. Thus all cells
receive very similar numbers of synapses. Elsewhere we have
presented a related model (Todorov et al., 1997a) which incor-
porated cells receiving higher numbers of local intracortical
synapses and lower numbers of thalamocortical synapses; such
cells exhibited stronger supersaturation, end-stopping and
sensitivity to orientation contrast (Sillito et al., 1995).
Co-aligned, iso-orientation surround stimuli tend to facilitate
responses for both high- and low-contrast center stimuli
(Kapadia et al., 1995; Polat et al., 1998). This effect may be
related to perceptual contour integration (Grossberg and
Mingolla, 1985; Field et al., 1993; Polat and Sagi 1993) and
may result from excitatory–excitatory connections between
co-aligned, iso-orientation cell clusters (Bosking et al., 1997).
Long-range connections in our model are not biased for
alignment-specific spatial anisotropies. Our model could achieve
this facilitation by adding alignment-specific long-range inputs
that are more biased to synapse onto excitatory targets than are
the present alignment-nonspecific long-range inputs. To
illustrate that this ‘pure’ facilitation could coexist with
nonaligned facilitation/suppression effects in our model,
consider adding a class of long-range inputs which target only
excitatory neurons (see Fig. 7). Such input will always increase
responses regardless of the local contrast gain state. Our model
could similarly be extended to incorporate other specific
patterns of long-range excitation, such as feedback from area V2
(Bullier et al., 1996).
NotesWe wish to thank Sacha Nelson for thoughtful discussions about cortical
gain control and long-range connections. We thank Frank Sengpiel for
kindly sharing his preliminary experimental data. We also thank Martha
Myer for her help in preparing this manuscript. This work was funded in
part by an NIMH post-doctoral fellowship to D.S. (MH-10671), a Howard
Hughes Predoctoral Fellowship to E.T. and an NIH grant to M.S.
(EY-07023).
Address correspondence to David Somers, Ph.D. Department of Brain
and Cognitive Sciences, MIT, E10–120, 79 Amherst Street, Cambridge,
MA 02139, USA. Email: [email protected].
ReferencesAbbott LF, Varela JA, Sen K, Nelson SB (1997) Synaptic depression and
cortical gain control. Science 275:220–224.
Albrecht DG, Geisler W (1991) Motion selectivity and the
contrast-response function of simple cells in the striate cortex. Vis
Neurosci 7:531–546.
Albrecht DG, Hamilton DB (1982) Striate cortex of monkey and cat:
contrast response function. J Neurosci 48:217–237.
Anderson JC, Douglas RJ, Martin KAC, and Nelson JC (1994a) Synaptic
output of physiologically identified spiny stellate neurons in cat visual
cortex. J Comp Neurol 341:16–24.
Beaulieu C, Somogyi P (1990) Targets and quantitative distribution of
GABAergic synapses in the visual cortex of the cat. Eur J Neurosci
2:296–303.
Ben-Yishai R, Bar-Or RL, Sompolinsky H (1995) Theory of orientation
tuning in visual cortex. Proc Natl Acad Sci USA 92:3844–3848.
Blakemore C, Tobin EA (1972) Lateral inhibition between orientation
detectors in the cat’s visual cortex. Exp Brain Res 15:439–440.
Bonds AB (1991) Temporal dynamics of contrast gain in single cells of the
cat striate cortex. Vis Neurosci 6:239–255.
Born RT, Tootell RBH (1991) Single-unit and 2-deoxyglucose studies of
side inhibition in macaque striate cortex. Proc Natl Acad Sci USA
88:7071–7075.
Bosking WH, Zhang Y, Schofield B, Fitzpatrick D (1997) Orientation
selectivity and the arrangement of horizontal connections in tree
shrew striate cortex. J Neurosci 17:2112–2127.
Bullier J, Hupe JM, James A, Girard P (1996) Functional interactions
between areas V1 and V2 in the monkey. J Physiol (Paris) 90:217–220.
Bush PC, Sejnowski TJ (1994) Effects of inhibition and dendritic
saturation in simulated neocortical pyramidal cells. J Neurophysiol
71:2183–2193.
Carandini M, Heeger DJ (1994) Summation and division by neurons in
primate visual cortex. Science 264:1333–1336.
Connors BW, Gutnick MJ, Prince DA (1982) Electrophysiological
properties of neocortical neurons in vitro. J Neurophysiol
48:1302–1320.
DeAngelis GC, Freeman RD, Ohzawa I (1994) Length and width tuning of
neurons in the cat’s primary visual cortex. J Neurophysiol
71:347–374.
DeAngelis GC, Ohzawa, I, Freeman, RD (1995) Receptive field dynamics
in the central visual pathways. Trends Neurosci 18:451–458 .
Douglas RJ, Koch C, Mahowald M, Martin KAC, Suarez HH (1995)
Recurrent excitation in neocortical circuits. Science 269:981–985.
Douglas RJ, Martin KAC (1991a) Opening the grey box. Trends Neurosci
14:286–293.
Douglas RJ, Martin KAC (1991b) A functional microcircuit for cat visual
cortex. J Physiol 440:735–769.
Douglas RJ, Martin KAC, Whitteridge D (1988) Selective responses of
visual cortical neurones do not depend on shunting inhibition. Nature
332:642—644.
Douglas, RJ, Martin, KAC, Whitteridge, D (1989) A canonical
microcircuit for neocortex. Neural Comput 1:480—488.
Elias S, Grossberg S (1975) Pattern formation, contrast control, and
oscillations in the short-term memory of shunting on-center
off-surround networks. Biol Cybernet 20:69–98.
Ferster, D, Jagadeesh, B (1992) EPSP-IPSP interactions in cat visual cortex
studied with in vivo whole-cell patch recording. J Neurosci
12:1262–1274.
Field DJ, Hayes A, Hess RF (1993) Contour integration by the human
visual system: evidence for a local ‘association field’. Vis Res
33:173–193.
Fregnac Y, Debanne D (1993) Potentiation and depression in visual
cortical neurons: a functional approach to synaptic plasticity. In: Brain
mechanisms of perception and memory: from neuron to behavior
(Ono T, Squire L, Raichle ME, Perrett DI, Fukuda M, eds), pp.
533–561. Oxford: Oxford University Press.
Cerebral Cortex Apr/May 1998, V 8 N 3 215

Gabbott PLA, Somogyi P (1986) Quantitative distribution of GABA-
immunoreceptive neurons in the visual cortex (area 17) of the cat.
Exp Brain Res 61:323–331.
Gilbert CD (1992) Horizontal integration and cortical dynamics. Neuron
9:1–13.
Gilbert CD, Das A, Ito M, Kapadia M, Westheimer G (1996) Spatial
integration and cortical dynamics. Proc Natl Acad Sci USA
93:615–622.
Gilbert CD, Wiesel TN (1983) Clustered intrinsic connections in cat visual
cortex. J Neurosci 3:1116–1133.
Gilbert CD, Wiesel TN (1989) Columnar specificity of intrinsic horizontal
and corticocortical connections in cat visual cortex. J Neurosci
9:2432–2442.
Grinvald A, Lieke EE, Frostig RD, Hildesheim R (1994) Cortical
point-spread function and long-range lateral interactions revealed by
real-time optical imaging of macaque monkey primary visual cortex. J
Neurosci 14:2545–2568.
Grossberg S (1973) Contour enhancement, short-term memory, and
constancies in reverberating neural networks. Stud Appl Math
52:217–257.
Grossberg S, Mingolla E (1985) Neural dynamics of perceptual grouping:
textures, boundaries, and emergent segmentations. Percept
Psychophys 38:141–171.
Gulyas B, Orban GA, Duysens J, Maes H (1987) The suppressive inf luence
of moving textured backgrounds on responses of cat striate neurons
to moving bars. J Neurophysiol 57:1767–1791.
Hartline HK (1940) The receptive fields of optic nerve fibers. Am J
Physiol 130:700–711.
Heeger DJ (1992) Normalization of cell responses in cat striate cortex. Vis
Neurosci 9: 181–197.
Heeger DJ (1993) Modeling simple-cell direction selectivity with
normalized, half-squared, linear operators. J Neurophysiol
70:1885–1898.
Hirsch JA (1995) Synaptic integration in layer IV of the ferret striate
cortex. J Physiol 483:183–199.
Hirsch JA, Gilbert CD (1991) Synaptic physiology of horizontal
connections in the cat’s visual cortex. J Neurosci 11:1800–1809.
Hubel DH, Wiesel TN (1962) Receptive fields, binocular interaction and
functional architecture in the cat’s visual cortex. J Physiol
165:559—568.
Hubel DH, Wiesel TN (1965) Receptive fields and functional architecture
in two non-striate visual areas. J Neurophysiol 41:229–289.
Hubel DH, Wiesel TN (1977) Functional architecture of macaque monkey
visual cortex. Proc R Soc Lond B 198:1–59.
Humphrey AL, Sur M, Uhlrich DJ, Sherman SM (1985) Projection patterns
of individual x- and y-cell axons from the lateral geniculate nucleus to
cortical area 17 in the cat. J Comp Neurol 233:159–189.
Jagadeesh B, Ferster D (1990) Receptive field lengths in cat striate cortex
can increase with decreasing stimulus contrast. Soc Neurosci Abstr
16:130.11.
Jagadeesh B (1993) The construction of receptive field properties of cells
in the cat visual cortex from the synaptic inputs to the cortex. Ph.D.
Dissertation. Northwestern University.
Jones JP , Palmer LA (1987) The two-dimensional spatial structure of
simple receptive fields in cat striate cortex. J Neurophysiol
58:1187—1211
Kapadia MK, Ito M, Gilbert CD, Westheimer G (1995) Improvement in
visual sensitivity by changes in local context: parallel studies in human
observers and in V1 of alert monkeys. Neuron 15:843–856.
Kisvarday ZF, Martin KAC, Fruend TF, Magloczky Z, Whitteridge D,
Somogyi P (1986) Synaptic targets of HRP-filled layer III pyramidal
cells in the cat striate cortex. Exp Brain Res 64:541–552.
Knierim JJ, Van Essen DC (1992) Neuronal responses to static texture
patterns in area V1 of the alert macaque monkey. J Neurophysiol
67:961–980.
Kuff ler SW (1953) Discharge patterns and functional organization of the
mammalian retina. J Neurophysiol 16:37–68.
Levitt JB, Lund JS (1997) Contrast dependence of contextual effects in
primate visual cortex. Nature 387: 73–76.
Li CY, Creutzfeldt OD (1984) The representation of contrast and other
stimulus parameters by single neurons in area 17 of the cat. Pf lüger’s
Arch 401:304–314.
Lund JS, Yoshioka T, Levitt JB (1993) Comparison of intrinsic connectivity
in different areas of macaque monkey cerebral cortex. Cereb Cortex
3:148–162.
Lund JS, Wu Q, Hadingham PT, Levitt JB (1995) Cells and circuits
contributing to functional properties in area V1 of macaque monkey
cerebral cortex: bases for neuroanatomically realistic models. J Anat
187:563–581.
Maffei L, Fiorentini A (1976) The unresponsive regions of visual cortical
receptive fields. Vis Res 16:1131–1139.
Malach R, Amir Y, Harel M, Grinvald A (1993) Relationship between
intrinsic connections and functional architecture revealed by optical
imaging and in vivo targeted biocytin injections in primate striate
cortex. Proc Natl Acad Sci USA 90:10469–10473.
McCormick DA, Connors BW, Lighthall JW, Prince DA (1985)
Comparative electrophysiology of physiology of pyramidal and
sparsely spiny stellate neurons of the neocortex. J Neurophysiol
54:782–806.
McGuire, BA, Gilbert, CD, Rivlin, PK, Wiesel, TN (1991) Targets of
horizontal connections in macaque primary visual cortex. J Comp
Neurol 305, 370–392.
Mountcastle, VB (1978) An organizing principle for the cerebral function:
the unit module and the distributed system. In: The mindful brain
(Edelman GM, Mountcastle VB, eds), pp. 7–50. Cambridge, MA: MIT
Press.
Movshon JA, Thompson ID, Tolhurst DJ (1978) Spatial summation in the
receptive fields of simple cells in the cat’s striate cortex. J Physiol
283:53–77.
Nelson JI, Frost BJ (1978) Orientation-selective inhibition from beyond
the classic visual receptive field. Brain Res 139:359–365.
Nelson JI, Frost BJ (1985) Intracortical facilitation among co-oriented,
co-axially aligned simple cells in cat striate cortex. Exp Brain Res
61:54–61.
Orban GA, Kato H, Bishop PO (1979) Dimensions and properties of
end-zone inhibitory areas in receptive fields of hypercomplex cells in
cat striate cortex. J Neurophysiol 42:833–849.
Peters A, Yilmaz E (1993) Neuronal organization in area 17 of cat visual
cortex. Cereb Cortex 3:49–68.
Peters A, Sethares C (1991) Organization of pyramidal neurons in area 17
of monkey visual cortex. J Comp Neurol 306:1–23.
Peters A, Sethares C (1996) Myelinated axons and the pyramidal cell
modules in monkey primary visual cortex. J Comp Neurol
365:232–255.
Polat U, Sagi D (1993) Lateral interactions between spatial channels:
suppression and facilitation revealed by lateral masking experiments.
Vis Res 33: 993–999.
Polat U, Mizobe K, Pettet MW, Kasamatsu T, Norcìa AM (1998) Collinear
stimuli regulate visual responses depending on a cell’s contrast
threshold. Nature 391:580–584.
Rakic P (1988) specification of cerebral cortical areas. Science
241:170–176.
Rockland KS, Lund JS (1982) Intrinsic laminate lattice connection in
primate visual cortex. Science 215:1532–1534.
Roig BR, Kabara JF, Snider RK, Bonds AB (1996) Non-uniform inf luence
from stimuli outside the classical receptive field on gain control of cat
visual cortical neurons. Invest Opthalmol Vis Sci Suppl 37:2198.
Salinas E, Abbott LF (1996) A model of multiplicative neural responses in
parietal cortex. Proc Natl Acad Sci USA 93:11956–11961.
Sengpiel F, Baddeley RJ, Freeman TCB, Harrad R, Blakemore C (1998)
Different mechanisms underlie three inhibitory phenomena in cat
area 17. Vis Res (in press).
Sillito AM, Grieve KL, Jones HE, Cudeiro J, Davis J (1995) Visual cortical
mechanisms detecting focal orientation discontinuities. Nature
378:492–496.
Somers DC, Nelson SB, Sur M (1994) Effects of long-range connections on
gain control in an emergent model of visual cortical orientation
selectivity. Soc Neurosci Abstr 20:646.7.
Somers DC, Nelson SB, Sur M (1995a) An emergent model of orientation
selectivity in cat visual cortical simple cells. J Neurosci 15:5448–5465.
Somers DC, Toth LJ, Todorov E, Rao SC, Kim D-S, Nelson SB, Siapas AG,
Sur M (1995b) Variable gain control in local cortical circuitry supports
context-dependent modulation by long-range connections. In: Lateral
interactions in the cortex: structure and function (Sirosh J,
Miikkulainen R, Choe Y, eds). Austin, TX: University of Texas Press
WWW electronic book: http://www.cs.utexas.edu/users/nn/lateral_
interactions_book/coverhtml.
Stemmler M, Usher M, Niebur E (1995) Lateral interactions in primary
visual cortex: a model bridging physiology and psychophysics.
Science 269:1877–1880.
216 Local Circuit Visual Cortical Model • Somers et al.

Suarez H, Koch C, Douglas R (1995) Modeling direction selectivity of
simple cells in striate visual cortex within the framework of the
canonical microcircuit. J Neurosci 15:6700–6719.
Swindale NV (1990) Is the cerebral cortex modular? Trends Neurosci
13:487–492.
Szentagothai J (1975) The ‘module-concept’ in cerebral cortex
architecture. Brain Res 95:475–496.
Thomson AM, Deuchars J (1994) Temporal and spatial properties of local
circuits in neocortex. Trends Neurosci 17:119–126.
Thomson AM, West DC (1993) Fluctuations in pyramid-pyramid
excitatory postsynaptic potentials modified by presynaptic firing
pattern and postsynaptic membrane potential using paired
intracellular recordings in rat neocortex. Neuroscience 54:329–346.
Thomson AM, Deuchars J, West DC (1993a) Large, deep layer
pyramid-pyramid single axon EPSPs in slices of rat motor cortex
display paired pulse and frequency-dependent depression, mediated
presynaptically and self-facilitation, mediated postsynaptically.
J Neurophysiol 70:2354–2369.
Thomson AM, Deuchars J, West DC (1993b) Single axon excitatory
postsynaptic potentials in neocortical interneurons exhibit
pronounced paired pulse facilitation. Neuroscience 54:347–360.
Thomson AM, West DC, Deuchars J (1995) Properties of single axon
excitatory postsynaptic potentials elicited in spiny interneurons by
action potentials in pyramidal neurons in slices of rat neocortex.
Neuroscience 69:727–738.
Todorov EV, Siapas AG, Somers DC (1997a) A model of recurrent
interactions in primary visual cortex. In: Advances in neural
information processing systems (Mozer MC, Jordan MI, Petsche T,
eds), Vol. 9, pp. 118–124. Cambridge MA: MIT Press.
Todorov EV, Siapas AG, Somers DC, Nelson [ ] (1997b) Modeling visual
cortical contrast adaptation effects. In: Computational neuroscience,
trends in research 1997 (Bower JM, ed), pp. 525–531. New York:
Plenum Press.
Toth LJ, Rao SC, Kim D-S, Somers D, Sur M (1996) Subthreshold
facilitation and suppression in primary visual cortex revealed by
intrinsic signal imaging. Proc Natl Acad Sci USA 93:9869–9874.
T’so DY, Gilbert CD, Wiesel TN (1986) Relationship between horizontal
interactions and functional architecture in cat striate cortex as
revealed by cross-correlation analysis. J Neurosci 6:1160–1170.
Tsodyks MV, Markram H (1997) The neural code between pyramidal
neurons depends on neurotransmitter release probability. Proc Natl
Acad Sci USA 94:719–723.
Weliky M, Kandler K, Fitzpatrick D, Katz LC (1995) Patterns of excitation
and inhibition evoked by horizontal connections in visual cortex share
a common relationship to orientation columns. Neuron 15:541–552.
White EL (1989) Cortical Circuits, pp 46–82. Boston, MA: Birkhauser.
Cerebral Cortex Apr/May 1998, V 8 N 3 217