Embed Size (px)
Citation preview

BioMed CentralBMC Genomics
ss
Open AcceResearch articleA linkage map of the Atlantic salmon (Salmo salar) based on EST-derived SNP markersThomas Moen*1,2, Ben Hayes1,2, Matthew Baranski1,2, Paul R Berg1,3, Sissel Kjøglum4, Ben F Koop5, Willie S Davidson6, Stig W Omholt1,3 and Sigbjørn Lien1,3Address: 1CIGENE – Centre of Integrative Genetics, Ås, Norway, 2AKVAFORSK – Institute of Aquaculture Research, Ås, Norway, 3Institute of Animal and Aquacultural Sciences, Norwegian University of Life Science, Ås, Norway, 4Aqua Gen AS, Trondheim, Norway, 5Centre for Biomedical Research, Department of Biology, University of Victoria, Victoria, British Columbia, Canada and 6Department of Molecular Biology and Biochemistry, Simon Fraser University, Burnaby, British Columbia, Canada
Email: Thomas Moen* - [email protected]; Ben Hayes - [email protected]; Matthew Baranski - [email protected]; Paul R Berg - [email protected]; Sissel Kjøglum - [email protected]; Ben F Koop - [email protected]; Willie S Davidson - [email protected]; Stig W Omholt - [email protected]; Sigbjørn Lien - [email protected]
* Corresponding author
AbstractBackground: The Atlantic salmon is a species of commercial and ecological significance. Like other salmonids, thespecies displays residual tetrasomy and a large difference in recombination rate between sexes. Linkage maps with fullgenome coverage, containing both type I and type II markers, are needed for progress in genomics. Furthermore, it isimportant to estimate levels of linkage disequilibrium (LD) in the species. In this study, we developed several hundredsingle nucleotide polymorphism (SNP) markers for the Atlantic salmon, and constructed male and female linkage mapscontaining SNP and microsatellite markers. We also investigated further the distribution of male and femalerecombination events across the genome, and estimated levels of LD between pairs of markers.
Results: The male map had 29 linkage groups and was 390 cM long. The female map had 30 linkage groups as was 1983cM long. In total, the maps contained 138 microsatellite markers and 304 SNPs located within genes, most of which weresuccessfully annotated. The ratio of male to female recombination events was either close to zero or very large, indicatingthat there is little overlap between regions in which male and female crossovers occur. The female map is likely to haveclose to full genome coverage, while the majority of male linkage groups probably lack markers in telomeric regionswhere male recombination events occur. Levels of r2 increased with decreasing inter-marker distance in a bimodalfashion; increasing slowly from ~60 cM, and more rapidly more from ~12 cM. Long-ranging LD may be consequence ofrecent admixture in the population, the population being a 'synthetic' breeding population with contributions fromseveral distinct rivers. Levels of r2 dropped to half its maximum value (above baseline) within 15 cM, and were higherthan 0.2 above baseline for unlinked markers ('useful LD') at inter-marker distances less than 5 cM.
Conclusion: The linkage map presented here is an important resource for genetic, comparative, and physical mappingof the Atlantic salmon. The female map is likely to have a map coverage that is not far from complete, whereas the malemap length is likely to be significantly shorter than the true map, due to suboptimal marker coverage in the apparentlysmall physical regions where male crossovers occur. 'Useful LD' was found at inter-marker distances less than 5 cM.
Published: 15 May 2008
BMC Genomics 2008, 9:223 doi:10.1186/1471-2164-9-223
Received: 19 October 2007Accepted: 15 May 2008
This article is available from: http://www.biomedcentral.com/1471-2164/9/223
© 2008 Moen et al; licensee BioMed Central Ltd. This is an Open Access article distributed under the terms of the Creative Commons Attribution License (http://creativecommons.org/licenses/by/2.0), which permits unrestricted use, distribution, and reproduction in any medium, provided the original work is properly cited.
Page 1 of 14(page number not for citation purposes)

BMC Genomics 2008, 9:223 http://www.biomedcentral.com/1471-2164/9/223
BackgroundThe Atlantic salmon (Salmo salar) is a species of world-wide significance as a prized species in recreational fishingand a major contributor to the world's aquaculture pro-duction. The genomes of the Atlantic salmon and othersalmonids are purported to be derivates of an autotetra-ploidisation event that occurred in their common ances-tor 25 to 100 million years ago (reviewed in [1]). Thesubsequent re-diploidisation process is not yet complete,and is illustrated in such phenomena as duplicated DNAmarkers (e.g. [1]); the formation of tetravalent complexesduring male meioses [2]; the apparent linkage of non-linked loci due to non-random dissociation of the tetrav-alent complexes (pseudolinkage) [3,4]; unusual, partlytetrasomic, segregation patterns [1,5-7]; as well as chro-mosome arm numbers twice that of most other fin-fishspecies (reviewed in [8]). Furthermore, the formation oftetravalent complexes in males is believed to be the causeof another phenomenon observed in salmonids, verylarge differences in recombination rates between malesand females that vary according to chromosomal region[6,9-13].
Two low-density maps have been published for Atlanticsalmon [10,14], in addition to the SALMAP map, ahigher-density, female microsatellite map made availableonline [15]. This latter map is developed from segregationdata from two females from the river Tay in Scotland[12,16], and contains ~700 microsatellite type I and typeII markers, out of which approximately 200 have beenlinked to BACs in the physical map [17]. Further progressin Atlantic salmon genomics relies on these existing mapsbeing expanded with additional markers; in particularwith Single Nucleotide Polymorphism (SNP) markers,since these are the most frequent polymorphisms in addi-tion to being the markers of choice for high-throughputgenotyping. Of particular value are SNP markers locatedwithin transcribed regions, to create more links betweenthe genetic and physical maps.
Here, we provide an update of an ongoing project aimingat detecting, testing, and mapping large numbers of EST-derived SNP markers in Atlantic salmon [18,19]. We alsopresent a SNP/microsatellite map to be used as a frame-work map, onto which additional SNP markers can laterbe added. Furthermore, we present more detailed resultson sex-specific differences in recombination rates thanhas been provided before for this species. Finally, wereport on levels of linkage disequilibrium (LD) betweenmarkers in the aquaculture strain from whence the map-ping parents were sampled. Levels of LD vary between spe-cies and between populations [20-26], and have majorimplications for the feasibility of performing e.g. associa-tion studies and for fine-mapping Quantitative Trait Loci(QTL).
ResultsDetection and testing of SNP markersHayes et al. [18] previously described the in silico detec-tion of a large number of putative SNPs for Atlanticsalmon, and the subsequent experimental testing of 86 ofthese SNPs in a diverse validation panel. In the presentstudy, another set of 1369 SNP markers were tested in asimilar validation panel (Table 1). Of the 1369 SNPs, 668were polymorphic, reliably scored, and non-duplicated(Table 2). Of the 668 polymorphic, non-duplicated SNPs,307 were chosen to be genotyped in the mapping families.These 307 SNPs had an average minor allele frequency of0.27, and an average observed heterozygosity of 0.29(results for individual SNPs in Additional File 1). Out of307 SNPs, 244 (79%) resided in genes that could be iden-tified and annotated (Additional File 1).
Linkage mapThe mapping families, 10 full-sib families from a com-mercial breeding company, were genotyped for 307 SNPsand for 146 microsatellite markers. Out of the 307 SNPmarkers, 304 were polymorphic in at least one mappingparent. The SNPs belonged to 263 contigs, 222 of thesehaving one SNP, 36 having two SNPs, and five havingthree SNPs.
All but four of the informative SNPs were integrated intothe map, as were all 138 informative microsatellite mark-ers. The male and female maps consisted of 29 and 30linkage groups, respectively (Figures 1 to 3, Table 3, Addi-tional File 2). The male map was 390 cM long with 434markers in total, while the female map was 1983 cM longwith 425 markers in total. Lengths of linkage groupsranged from 0 cM to 59.7 cM on the male map, and from
Table 1: Samples used for SNP validation
Country River/population No of samples
Canada Conne 3Canada Placentia Bay 3Iceland Laxá 3Iceland Leirvogsá 3Ireland Moy 3Ireland Suir 3Norway Aqua Gena,b 4Norway Byglandsfjordenb 4Norway Numedalslågen 3Norway SalmoBreeda 3Norway/Finland Tana-Jiesjokka 3Russia Neva 3Russia Varzuga 3Spain Asou 3Spain Pas 3
aAquacultural populationbThe Aqua Gen and Byglandsfjorden populations came in the form of 8 F1 hybrids between the two.
Page 2 of 14(page number not for citation purposes)
BMC Genomics 2008, 9:223 http://www.biomedcentral.com/1471-2164/9/223
19.8 cM to 117.1 cM on the female map (Table 3). For themost part the same linkage groups were identified for themale and the female, with the following exceptions i) twolinkage groups on the male map (s9 and s17) that eachcorresponded to two linkage groups on the female map,and ii) one linkage group on the female map (d21) thatcorresponded to two linkage groups on the male map. For57 of all possible marker pairs informative in both sexes,the orientation of markers was not the same in the twosexes (Additional File 3). However, in all 57 cases the dis-tance between markers on the male map was relativelysmall (< 1.7 cM), so that these differences most likelyreflect upon minor genotyping errors or missing geno-types.
We did not observe in our data set any certain instances ofpseudolinkage, the apparent linkage of non-linked chro-mosomes sometimes observed in male salmonids [5].One likely homeologous relationship that has not beenreported before [12] was found; marker Ssa418/i waslocated on LG24, while Ssa418/ii was located on LG16.
Difference in recombination patterns between sexes and between parentsMale recombination rates were much lower than femalerecombination rates in large parts of the genome. In someregions, however, male recombination rates were signifi-cantly higher than those of females. Invariably, theseregions were located at the end of linkage groups (Figures1 to 3). Ratios of male to female recombination fractionsfor adjacent markers tended to be either close to zero orvery large (Figure 4). Of the male linkage groups, 16 hadall their markers grouped into one very tight cluster, 11had one large cluster of closely linked markers located atthe end of the linkage group, and one had a large centralcluster bordered by markers on either side (Figures 1 to 3,Table 3).
Linkage disequilibriumLevels of LD, measured through the correlation coefficientbetween pairs of loci r2, were calculated for all microsatel-lite-SNP pairs with minor allele frequency (SNP) > 0.2and heterozygosity (microsatellite) > 0.5. The average r2
for marker pairs with markers located on different linkagegroups was 0.16. The average r2 for physically, but notgenetically linked marker pairs (markers located morethan 50 cM apart on the same linkage group) was 0.20.Levels of r2 increased with decreasing inter-marker dis-tance from ~60 cM, increased more rapidly more from~12 cM (Figure 5), while r2 dropped to half its maximumvalue (above baseline) within 15 cM.
DiscussionLinkage mapThe male map contained 29 linkage groups, correspond-ing well with the most common karyotype in EuropeanAtlantic salmon, which has 2n = 58 [27]. Most likely,therefore, each male linkage group corresponds to a sepa-rate chromosome. The female map, on the other hand,contained 31 linkage groups, including two pairs of link-age groups that each corresponded to a single male homo-logue. Each of these two pairs is likely to correspond to asingle linkage group with a large segment not covered bymarkers.
The lack of markers in at least two segments of the femalemap shows that the female map is shorter than the truefemale genetic map. At the same time, the low number offemale-informative markers that could not be mapped, inconjunction with the relative good fit of the map lengthwith the length of the SALMAP map (1810 cM; [15]), indi-cates that the female map coverage most likely is not farfrom complete. The male map, on the other hand, maystill be considerably shorter than the true male geneticmap, due to recombination events apparently being local-ised to a small physical region (see below).
Map distances should be expected to be slight overesti-mates since any genotype errors would tend to inflategenetic distances. Although practically all genotypesresulting in double crossovers were re-checked in detailand corrected if necessary, genotype errors cannot beruled out, in particular not for markers located at the endof linkage groups (where they cannot be revealed by test-ing for double crossovers).
Contrary to expectation, we did not observe any instancesof pseudolinkage in the data set. Pseudolinkage describesthe apparent linkage in male mapping parents of markersthat are not linked in female mapping parents, with anexcess of non-parental genotypes in offspring, and isbelieved to be caused by the non-random breaking up oftetravalent complexes formed during male meiosis [5].
Table 2: Experimental validation of SNPs
SNP type No. Freq.
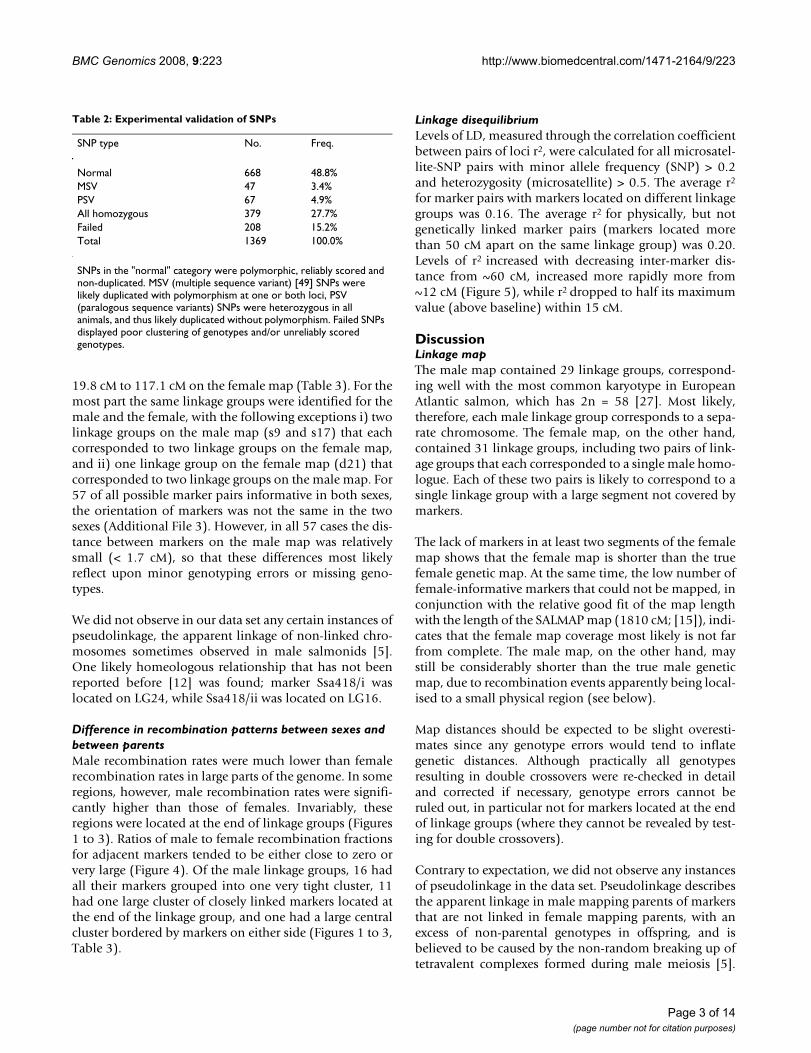
Normal 668 48.8%MSV 47 3.4%PSV 67 4.9%All homozygous 379 27.7%Failed 208 15.2%Total 1369 100.0%
SNPs in the "normal" category were polymorphic, reliably scored and non-duplicated. MSV (multiple sequence variant) [49] SNPs were likely duplicated with polymorphism at one or both loci, PSV (paralogous sequence variants) SNPs were heterozygous in all animals, and thus likely duplicated without polymorphism. Failed SNPs displayed poor clustering of genotypes and/or unreliably scored genotypes.
Page 3 of 14(page number not for citation purposes)

BMC Genomics 2008, 9:223 http://www.biomedcentral.com/1471-2164/9/223
Pseudolinkage has earlier been found in several salmonidmapping studies [3,4,6,9,13]. In a recent study on an F1cross between Atlantic salmon of Canadian and Europeanorigin, utilising a subset of the SNP markers described inthe present study, pseudolinkage was observed between 5pairs of linkage groups (Boulding et al., submitted). Thedifference in occurrence of pseudolinkage between the lat-ter study and the present study is in line with a hypothesisstating that pseudolinkage occurs more frequently ininter-strain hybrids than in pure strain fish [5,9,28]. Itshould be noted, however, that our findings with respectto pseudolinkage are indicative rather than conclusivesince grandparental genotypes were not available, mean-ing that pseudolinkage could, if present, only be detectedas weak linkage in males between markers unlinked infemales (and not from excess of non-parental genotypes).
Also, since linkage phases were deduced from linkageanalysis and not from grandparental genotyping, linkagebetween markers within male linkage groups could theo-retically be due to pseudolinkage rather than to classicallinkage. However, all markers on the male map wereeither i) very closely linked to other markers within thesame linkage group, and hence very unlikely to be linkedthrough pseudolinkage, or ii) appearing on the homolo-gous linkage group in the female map. From this we con-clude that pseudolinkage would be unlikely to be thecause of any observed linkages on this map.
Difference in recombination patterns between sexesIn salmonids, male recombination rates are muchreduced compared to female recombination rates [9-11,14]. In rainbow trout the ratio between male and
Table 3: Properties of linkage groups
LG � meioses with n recombination events � map length (cM)
� map length (cM)
Markers on � map
Markers on � map
� map marker clusters
n = 0 n = 1 n = 2 n ≥ 31 1118 687 75 0 103.8 1.21 6 6 12 1090 671 108 11 68.4 0 26 23 13 1473 390 17 0 87.6 23 15 14 24 861 787 231 1 117.1 2.4 16 17 15 1065 759 56 0 74.3 1.4 15 17 16 1269 560 48 3 83.5 11.3 20 20 27 1248 630 2 0 56.8 56.4 12 12 28 1416 445 18 1 49.7 8.4 20 21 29� NA NA NA NA NA 32.6 NA 16 29a� 1236 577 66 1 46.1 NA 12 NA NA9b� NA NA NA NA NA NA 1 NA NA10 1014 717 146 3 107.1 20.1 29 30 211 1139 601 139 1 101.9 0 14 14 112 767 907 206 0 99.3 10.8 18 18 213 1589 291 0 0 29.4 12.6 13 29 214 1273 581 25 1 40.2 57.8 12 12 215 1638 242 0 0 38.4 1.5 9 9 116 1661 214 5 0 43.2 4.6 9 9 217� NA NA NA NA NA 29.1 NA 15 317� 1871 9 0 1 2.5 NA 2 NA NA17� 1458 300 111 11 109.4 NA 13 NA NA18 1417 431 32 0 65.8 58.3 9 9 219 1691 189 0 0 26.8 1.2 6 6 120 1586 282 12 0 56.5 0.5 9 9 121� 1625 240 15 0 41.4 NA 10 NA NA21a� NA NA NA NA NA 0 NA 1 121b� NA NA NA NA NA 0.1 NA 9 122 969 862 47 2 68.3 0 15 14 123 1242 595 40 3 98.7 1 16 15 124 1247 561 69 3 103.7 0 9 9 125 1263 595 22 0 55.2 1.3 12 12 128 1334 513 32 1 102 18.2 13 14 231 1815 65 0 0 29.2 3.2 5 5 133 1494 374 9 3 56.2 32.5 9 9 2A 1832 35 13 0 19.8 0.3 6 6 1
�Female-specific linkage groups�Male-specific linkage groups
Page 4 of 14(page number not for citation purposes)

BMC Genomics 2008, 9:223 http://www.biomedcentral.com/1471-2164/9/223
male and female linkage maps for Atlantic salmon (linkage groups d01 to s08)Figure 1male and female linkage maps for Atlantic salmon (linkage groups d01 to s08). Male and female linkage groups have prefixed s- and d-respectively. The linkage group nomenclature (numbers) is the same as in the map developed by the SALMAP project [15], except for one linkage group (sA/dA) that contains no markers present on the SALMAP map. The map units are Kosambi cM.
Page 5 of 14(page number not for citation purposes)
BMC Genomics 2008, 9:223 http://www.biomedcentral.com/1471-2164/9/223
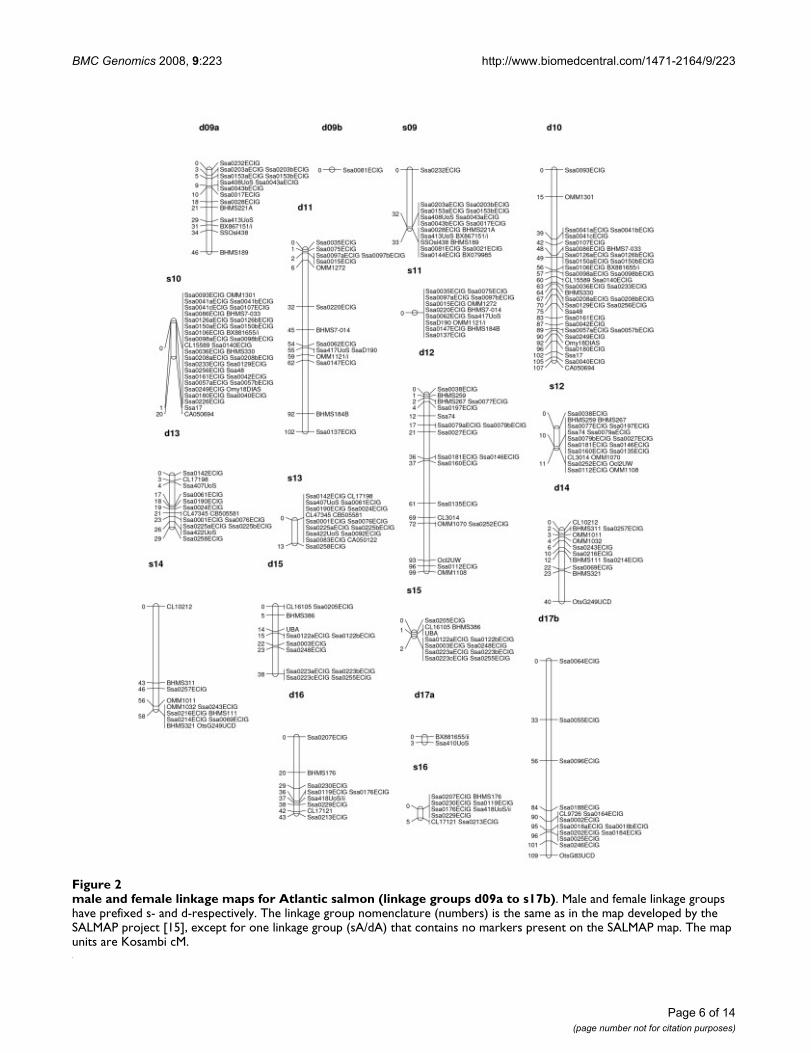
male and female linkage maps for Atlantic salmon (linkage groups d09a to s17b)Figure 2male and female linkage maps for Atlantic salmon (linkage groups d09a to s17b). Male and female linkage groups have prefixed s- and d-respectively. The linkage group nomenclature (numbers) is the same as in the map developed by the SALMAP project [15], except for one linkage group (sA/dA) that contains no markers present on the SALMAP map. The map units are Kosambi cM.
Page 6 of 14(page number not for citation purposes)

BMC Genomics 2008, 9:223 http://www.biomedcentral.com/1471-2164/9/223
male and female linkage maps for Atlantic salmon (linkage groups s17 to dA)Figure 3male and female linkage maps for Atlantic salmon (linkage groups s17 to dA). Male and female linkage groups have prefixed s- and d-respectively. The linkage group nomenclature (numbers) is the same as in the map developed by the SALMAP project [15], except for one linkage group (sA/dA) that contains no markers present on the SALMAP map. The map units are Kosambi cM.
Page 7 of 14(page number not for citation purposes)

BMC Genomics 2008, 9:223 http://www.biomedcentral.com/1471-2164/9/223
female recombination has been found to vary considera-bly across linkage groups, with male recombination ratesbeing severely depressed relative to female recombinationrates in areas proximal to centromeres, but elevated inregions distal to centromeres [9]. This finding has beeninvestigated further in rainbow trout [12], and the samephenomenon has been shown in Arctic char [13] andAtlantic salmon [10,29], though not in detail for the latterspecies. The results presented here support these earlierfindings, but indicate that the site-specific differences inrecombination rate between sexes are even more pro-nounced in Atlantic salmon than in rainbow trout (com-pare Figure 4 with Figure 2 from [9]). Since femalerecombination rates are much higher than male recombi-nation rates for a large majority of adjacent marker pairs(Figures 1 to 3, Figure 4), it seems reasonable to assumethat the regions where male recombination events occurare substantially smaller in physical terms than the corre-sponding female regions. This, again, means that, while itis likely that the female map presented here is close to full
coverage, the true male map may be substantially longerthan the presented male map. Higher marker densitieswill be needed to identify markers located in the regionswhere male recombination occurs, i.e. telomeric regions.
The most common karyotype of European Atlanticsalmon consists of 16 metacentric and 42 acrocentricchromosomes [27]. If one assumes that male recombina-tion occurs on all chromosomes, but only in telomericregions, the complete male map should contain 8 linkagegroups where a large central cluster of markers is sur-rounded by markers on both sides, and 21 groups with alarge cluster at one end. In the map presented here, onlylinkage group 17 has a central cluster surrounded bymarkers on either side, indicating that the correspondingchromosome is one of the metacentric chromosomes. Allother linkage groups have either only one cluster or onecluster with markers on one side, and thus may have oneor two telomeric regions not covered by informativemarkers. Further evidence for the identification of linkage
Male and female recombination rates for pairs of adjacent markers (d09a to s17b)Figure 4Male and female recombination rates for pairs of adjacent markers (d09a to s17b). Only markers on linkage groups with a 1-to-1 relationship between the male and female homologue were considered (i.e. linkage groups 17 and 21 were excluded).
Page 8 of 14(page number not for citation purposes)

BMC Genomics 2008, 9:223 http://www.biomedcentral.com/1471-2164/9/223
groups (i.e. chromosomes) as meta- or acrocentric couldbe extracted from the lengths of linkage groups (femalemap), and from the number of meioses with more thanone recombination event (Table 3); if one assumes com-plete interference [30-33] then acrocentric chromosomesshould have genetic lengths of ~50 cM and a small inci-dence of meioses with more than one crossover, whilemetacentric chromosomes should have genetic lengths of~100 cM and a higher incidence of meiosis with two ormore crossovers [12]. The linkage group size and numberof meioses with > 2 recombinants for linkage group 17supports this hypothesis.
The site-specific distribution of male and female recombi-nation events must be taken into account when QTLexperiments are designed. In Atlantic salmon, it hasbecome quite common to first perform a coarse genomescan using male segregation only and one or a few mark-ers per linkage group, on the assumption that there is
practically no recombination in males ([34]; Boulding etal., submitted). While this strategy will work for mostparts of the genome, QTLs located in telomeric regions(which are also gene-rich regions) will probably bemissed unless markers located in these regions are added.Identification of more markers in telomeric region wouldtherefore be highly useful.
In this study, we exploited the lack of male recombinationin large parts of the genome to draw more informationout of the data. More specifically, for markers located insuch regions, when both parents were heterozygous andidentical within a given family, heterozygous (and thus, apriori uninformative) offspring were assumed to haveinherited the chromosome segment without recombina-tions from their respective fathers. In this way, allelesinherited from sire and dam could be deduced, and themarkers could be re-coded as fully informative. It shouldbe pointed out that this strategy was only used if no male
Levels of LD between microsatellite-SNP pairs located on the same linkage group plotted versus genetic distanceFigure 5Levels of LD between microsatellite-SNP pairs located on the same linkage group plotted versus genetic dis-tance. SNPs with minor allele frequencies < 0.20 and microsatellites with heterozygosity < 0.50 were excluded. Full line = 6th
degree polynomial best fit to the data; broken line = average level of LD between physically unlinked markers (for comparison).
Page 9 of 14(page number not for citation purposes)

BMC Genomics 2008, 9:223 http://www.biomedcentral.com/1471-2164/9/223
recombinations had been observed in a priori informativeoffspring, meaning that no recombination had beenobserved in a minimum of 92 (but usually many more)meioses. The strategy was therefore conservative.
Linkage disequilibriumThe individuals used for the LD study were a subset of themapping parents; more specifically, 16 mapping parentsthat belonged to the same breeding population, theremaining four animals belonging to another population.Phase-known data were used, since haplotypes could bededuced with very high certainty due to large family sizes.
Only microsatellite-SNP pairs were used for calculation ofLD, thus mimicking the mapping of a QTL (usuallyassumed to be bi-allelic) using microsatellites. LD wasalso computed between SNP-SNP pairs (results notshown), and found to be much lower than for microsatel-lite-SNP LD. Levels of microsatellite-microsatellite LDwere comparable to those of microsatellite-SNP LD,though slightly higher (results not shown). Lower LD val-ues for SNP-SNP pairs when compared to microsatellite-SNP or microsatellite-microsatellite pairs is likely to be, atleast in part, a consequence of differences in heterozygos-ity between marker types [35,36]. However, it could alsobe due in part to higher mutation rates of microsatellitesrelative to SNPs, which would impact upon levels of LD(reviewed in [37]). To avoid marker pairs with low infor-mation content, SNPs with minor allele frequenciesbelow 0.2 and microsatellites with heterozygosities below0.5 were culled from LD analysis.
The average r2 between markers located on different link-age group was higher than expected (r2 = 0.16). This couldbe caused by limited effective population size and/or byrelatedness between individuals in the sample (there werethree pairs of full-sibs in the sample). However, removingclosely related animals did not decrease, but ratherincreased r2 between unlinked markers, indicating that thesmall sample size may have been the main reason for highLD between unlinked markers. Levels of r2 is biasedupwards when sample sizes are small, although much lessso than the LD statistic D' [38]. At the same time, LD mayhave been slightly biased downward by the original detec-tion of SNPs in EST sequences coming from a limitednumber of animals of both Canadian and Norwegian ori-gin. Detection of SNPs in a small number of diverse ani-mals could lead to an overrepresentation of old mutationsamong the set of SNPs, and thus to underestimation of LDbetween markers. It is difficult to assess the joint effect ofthese two factors. However, we have assumed that bias inlevels of LD would not greatly affect conclusions regard-ing changes in LD with changing inter-marker distance.
LD between linked markers seemed to increase withdecreasing inter-marker distance in a bi-modal manner.LD first increases slowly from ~60 cM, then more rapidlyfrom ~12 cM. This finding may reflect upon the fact thatthe population from whence the haplotypes were derivedis a 'synthetic' population, formed seven generation agofrom individuals from different Norwegian rivers [39].Due to the limited number of meioses since the formationof the base population (in this context less than fourbecause only female crossovers would occur for mostchromosomal regions), LD within linkage groups causedby population stratification would be expected to persistfor long distances. Over shorter distances, LD would becaused both by population subdivision and by LD inher-ent in the wild population from whence the breedingpopulation was formed. Since LD observed in the popula-tion is likely to be partly caused by population admixture,the results described here may not be relevant for wildAtlantic salmon populations. However, many breedingpopulations, and thus populations used for scanning ofQTL/genes affecting commercial traits, are admixed in thesame sense, and may thus display similar patterns of LD.
Levels of LD were calculated in order to estimate themarker densities needed to perform LD-based mapping inAtlantic salmon. The measure r2 is equal to the amount ofinformation provided by one locus about the other,meaning that for a gene-trait association to be detected,sample size must be increased by 1/r2 if a marker in LDwith the trait-affecting gene is used rather than the geneitself. Levels of r2 from 0.1 to 0.3 have been proposed asminimum values of 'useful ld' [40,41], in which case sam-ple sizes would have to be increased by a factor of three to10 in order to achieve maximum power. If one accepts r2
> 0.2 as the threshold, 'useful LD' could in this study befound at inter-marker distances below ~5 cM, indicatingthat ~400 fully informative, evenly spaced markers wouldbe sufficient to at least start capturing inherent LD infor-mation. Thus, currently available maps ([15]; presentstudy) could in principle provide a template for LD map-ping to some extent. To fully exploit LD in the Atlanticsalmon genome, however, more dense maps would prob-ably be needed.
ConclusionIn this study, we constructed male- and female geneticlinkage maps of Atlantic salmon, elucidated further thedistributions of recombination events in males andfemales, and provided initial data on levels of linkage dis-equilibrium. The female map presented here is likely torepresent the true genetic map well, whereas the male mapis probably incomplete due to male recombination beinglocalised to narrow telomeric regions. There appear to belittle overlap between regions in which male and femalerecombination events occur. Levels of LD (r2) were more
Page 10 of 14(page number not for citation purposes)

BMC Genomics 2008, 9:223 http://www.biomedcentral.com/1471-2164/9/223
than 0.2 above the baseline for unlinked markers at inter-marker distances less than 5 cM. At inter-marker distanceslarger than 15 cM, r2 decreased slowly, possibly reflectingLD due to population admixture that have had limitedtime to be broken down by recombination. The map pre-sented here will serve as a framework map onto which alarger number of SNP markers, currently being identifiedfrom alignment of EST sequences and from DNA re-sequencing [42], will be added.
MethodsSNP discoveryPutative SNP were discovered in silico, as described in [18].In brief, 100,866 EST chromatograms were base-calledand aligned using the software programs Phred [43] andPhrap (P. Green, unpublished), whereupon putative SNPswere identified using PolyBayes [44] and checked by man-ual inspection. The ESTs were derived from several indi-viduals of the Canadian McConnell strain and fromseveral individuals from the Aqua Gen strains [18,45,46].
Validation and characterisation of SNPsFrom among the 2507 putative SNP discovered in silico,1369 were chosen to be experimentally validated basedon read quality and number of reads with rare allele.These SNPs were genotyped in a panel of 47 Atlanticsalmon from across the species range (Table 1). SNP gen-otyping was done using the MassARRAY system fromSequenom (San Diego, USA). PCR-primers and exten-sion-primers were designed using the software SpectroDE-SIGNER v3.0 (Sequenom). Multiplexes and primersequences are available on request [email protected]. Multiplexing levels were between 20and 29. All SNP genotyping was performed according tothe iPLEX protocol from Sequenom (available at [47]).For allele separations the Sequenom MassARRAY™ Ana-lyzer (Autoflex mass spectrometer) was used. Genotypeswere assigned in real time [48] by using the MassARRAYSpectroTYPER RT v3.4 software (Sequenom) based on themass peaks present. All results were manually inspected,using the MassARRAY TyperAnalyzer v3.3 software(Sequenom). Classification of SNPs was based on thismanual inspection. The categories were: 1) normal = poly-morphic, reliably scored and non-duplicated; 2) MSVmultiple sequence variant) [49] = SNPs were likely dupli-cated with polymorphism at one or both loci (character-ised by heterozygote excess, more than one cluster ofheterozygotes, and presence of homozygotes); 3) PSV(paralogous sequence variant) = duplicated SNP withouthomozygotes; 4) all homozygous = all animals werehomozygous; and 5) failed assay = poor clustering of gen-otypes and/or unreliably scored genotypes. Sequences ofSNPs and contigs can be found in Additional File 1.
Annotation of SNPsSequences containing SNPs were clustered into contigsusing a two stage Phrap assembly process. The first stageassembly of 434,384 Atlantic salmon EST sequences(parameters 100 minmatch and 0.99 repeat_stringency)resulted in 119,912 contigs which were then reassembled(2nd stage; 300 minmatch and 0.96 repeat_stringency)into 81,398 contigs [50]. Complete contigs containingSNPs compared (BLASTX) to CDD and Swissprot data-bases and annotated with the top BLASTX hit if the data-base match had an e-value of < 10-10. Matches tohypothetical proteins and genomic sequences were fil-tered out.
Genotyping of mapping populationThe mapping families were provided by the breedingcompany Aqua Gen AS, and were used also for QTL map-ping for resistance against the viral disease Infectious Pan-creatic Necrosis (IPN) (Moen et al., in prep.). Hence, theoffspring had been challenge tested for resistance to IPN.The 20 mapping parents came from two different yearpopulations of Aqua Gen salmon; 16 from year class2001, and 4 from year class 2000. Both populations wereformed in the yearly 1970's from salmon from differentNorwegian rivers [39], and have been maintained as moreor less closed populations since (with increase in inbreed-ing per generation < 0.5%; S. Kjøglum, Aqua Gen, pers.com.). In total, 192 offspring from each of 10 full-sib fam-ilies, and their parents, were genotyped. The parents of themapping population can, in the context of the presentstudy, be regarded as random animals sampled from thebroodstock population. DNA extraction was carried outusing the DNAeasy 96 kit from QIAGEN (Venlo, the Neth-elands). Within each family, microsatellites were geno-typed for the 96 least and the 96 most resistant animals.SNPs were genotyped on the mapping families for tworeasons; 1) to position the SNPs on the linkage map, and2) to provide more markers for eventual fine-mapping ofQTL-regions. In order to achieve these two goals in anaffordable manner, we chose to genotype all SNPs forIPN-resistant animals only. The animals were genotypedfor 307 SNP markers and for 148 microsatellites. SNP gen-otyping was carried out as described above.
Most of the microsatellite markers used in this study werechosen from the SALMAP microsatellite map of Atlanticsalmon (as it was in 2006) [15], and were collectively cho-sen to ensure good genome coverage. The microsatellitemarkers were distributed across 32 PCR multiplexes thatwere subsequently combined into 16 multiplexes for cap-illary electrophoresis. Primer sequences and multiplexinformation is available on request. Polymerase chainreactions (PCR) were performed in volumes of 5 μl, using0.25 units of AmpliTaq Gold (Applied Biosystems), 250μM dNTP mix, 1.5 mM MgCl2, 0.25 –1 pmol of each
Page 11 of 14(page number not for citation purposes)

BMC Genomics 2008, 9:223 http://www.biomedcentral.com/1471-2164/9/223
primer (depending on amplification efficiency of eachmarker in multiplex), 0.25 μl DMSO, and 5 ng DNA tem-plate. PCR cycling conditions were 95°C for 10 minutes,35 cycles of 94°C for 30 seconds, 54°C for 1 minute, and72°C for 1 minute, followed by a final extension of 60°Cfor 45 minutes. The lengths of the fluorescent PCR prod-ucts were determined relative to the LIZ500 size standard(Applied Biosystems) on a 3730 DNA Analyzer (AppliedBiosystems), using GeneMapper 4.0 (Applied Biosystems)software for allele calls.
Construction of linkage mapSince recombination rates in salmonids have been shownto differ dramatically between sexes, separate male andfemale maps were constructed. Marker grouping and ini-tial marker ordering was done in Joinmap 3.0 [51]. A Join-map 3.0 input file was made for each mapping parent (indouble haploid format), containing information on allelesinherited from that parent only. Marker grouping wasdone at a minimum LOD score of 4.0. Following markergrouping, homologous linkage groups from each sire andeach dam were integrated into single sex-specific maps.The marker orders determined by Joinmap 3.0 were testedand corrected using the flips function of CRIMAP, with amoving window of 7 markers (flips7). Using the finalmarker orders as calculated by CRIMAP, the data wasexamined for unlikely double recombinants, for incon-sistencies in marker order between parents, using a cus-tom Visual Basic for Applications (VBA) for Excelprogram. Segregation distortion was tested for using thesame program, by incorporating a Pearson's goodness-of-fit test for 1:1 segregation of alleles from individual par-ents to offspring. Double recombinants occurring oversmall distances were checked for genotyping error. Mark-ers displaying segregation distortion (P < 0.01) were alsoinspected. After marker orders and potential genotypeerrors had been verified, the final maps were constructedusing the fixed function of CRIMAP. The Kosambi map-ping function was used. Map drawings were made usingJoinmap 3.0 [51].
Since SNPs are bi-allelic, there were frequent occurrencesof both parents of a family being heterozygous for thesame two alleles of a SNP. In such cases, all heterozygousoffspring were initially uninformative for mapping. Weexploited the complete lack of male recombinants in mostparts of the genome to deduce the inheritance of alleles insituations where i) both parents were heterozygous for thesame two alleles of a SNP (marker A), and ii) the SNP waslinked without any observed male recombinants toanother marker (marker B); the latter marker being fullyinformative in the male. The steps of the deduction proc-ess were 1) determine the linkage phase between A and Bin the male parent, 2) use the linkage phase to deducewhich allele was inherited from the father at A, to off-
spring heterozygous at that marker, and 3) assign theother allele at A (of heterozygous offspring) to the femaleparent. This strategy was applied during the process ofchecking the data, automated through a VBA program.
Before map construction, SNP markers located within thesame contig were combined to produce one marker point(i.e. a haplotype).
Linkage groups were numbered according to the SALMAPmap, using shared microsatellites to infer homologies.Whenever two or more markers were shared between alinkage group and its SALMAP homologue, the linkagegroup was also oriented in the same way as the SALMAPlinkage group. One linkage group did not share any mark-ers with any linkage group on the SALMAP map, and wastermed "A". In the cases where two unlinked (in this dataset) female segments corresponded to a single malehomologue X, the segments were designated Xa and Xb toindicate that they were likely to be part of the same link-age group (and vice versa for unlinked male segments cor-responding to a single female homologue).
The chrompic function of CRIMAP was used to countnumber of recombination events per meiosis.
Linkage disequilibriumThe animals used for calculation of LD were a subset ofthe mapping parents, more specifically the 16 parents thatcame from the breeding population of major representa-tion. Thus, the data set consisted of 32 haplotypes. Onlymicrosatellite-SNP pairs were used, to mimic the mappingof a QTL using microsatellite markers. SNPs with minorallele frequencies < 0.2 and microsatellites with heterozy-gosities < 0.5 were culled. Composite SNP markers (hap-lotypes of SNPs within the same contigs) were groupedwith microsatellites. The haplotypes of the mapping par-ents were deduced at every linkage group using a custom-made VBA program. Briefly, the program performed thesesteps (for every linkage group within every mapping par-ent): 1) Start at the first informative marker from one ofthe linkage group; 2) find the linkage phase between thatmarker and the next informative marker, minimising thenumber of recombination events in the offspring; 3) pro-ceed in this manner to find the linkage phase between allinformative marker, and thus to build the two haplotypes;and 4) for monomorphic markers, insert the same allelein both haplotypes. Measures of LD were calculated usingthe function haploxt of the program GOLD [52]. The LDmeasure was the correlation coefficient, r2, calculated asthe square of Cramer's V [53]. The sampling effect was cor-rected for by subtracting 1/(number of haplotypes) fromr2 [54]. Sved's equation [55] was fitted to the data usingthe nlinfit function of MATLAB, but provided a poor fit (asexpected, since LD in the population would be expected to
Page 12 of 14(page number not for citation purposes)

BMC Genomics 2008, 9:223 http://www.biomedcentral.com/1471-2164/9/223
be caused by other factors in addition to drift). Instead, a6th degree polynomial was fitted to the data.
Authors' contributionsTM took part in microsatellite genotyping and SNP valida-tion, did data analyses except for SNP detection and anno-tation, and wrote a draft of the manuscript withcontributions from BH, MB, PB, BK, WSD, BFK, and SL.BH did in silico SNP detection. MB coordinated microsat-ellite genotyping and took part in SNP genotyping. PBcoordinated SNP genotyping. SK organised and carriedout tissue sampling. BFK took part in annotation and pro-vided the bulk of EST sequences. WSD took part in anno-tation. SWO provided laboratory facilities and took partin planning the study. SL provided laboratory facilities,did manual inspection of SNP validation data, and tookpart in SNP validation and data collection. All authorsread and approved of the manuscript.
Additional material
AcknowledgementsWe wish to thank Hege Munck, Katrine Hånes, and Mariann Árnyasi for technical assistance; Bjørn Høyheim for proving EST sequences; Elin Berg-seth, BioBank AS (Hamar, Norway), and VESO Vikan (Namsos, Norway) for preparation of samples; Aqua Gen Ltd., Dr. Kjetil Hindar, Dr. Tom Cross, Dr. Ian Fleming, Dr. Guðni Guðbergsson, Dr. Sonia Consuegra and Dr. Arne Jenssen for providing tissue samples; and Dr. Roy Danzmann for providing access to the SALMAP map and microsatellite primer sequences. This study was funded by The Norwegian Research Council (NFR FUGE grant to CIGENE and NFR Havbruk #169522/S40), by Genome Canada and Genome British Colombia (through cGRASP), and by Aqua Gen Ltd. None of the funding bodies had any role in the collection, analysis, or interpreta-tion of data; in the writing of the manuscript; or in the decision to submit the manuscript for publication.
References1. Allendorf FW, Thorgaard GH: Tetraploidy and the evolution of
salmonid fishes. In Evolutionary Genetics of Fishes Edited by: TurnerBJ. New York, Plenum Press; 1984:1-46.
2. Svardson G: Chromosome studies of salmonidae. Rep SwedState Inst Fresh-Water Fish Res 1945, 23:1-151.
3. Wright JE, May B, Stoneking M, Lee GM: Pseudolinkage of theduplicate loci for supernatant aspartate aminotransferase inbrook trout, Salvelinus fontinalis. J Hered 1980, 71:223-228.
4. May B: The salmonid genome: Evolutionary restructuring fol-lowing a tetraploid event. PhD thesis. Volume Ph.D. PennsylvaniaState University; 1980.
5. Wright JE, Johnson K, Hollister A, May B: Meiotic models toexplain classical linkage, pseudolinkage, and chromosomepairing in tetraploid derivative salmonids genomes. IsozymesCurr Top Biol Med Res 1983, 10:239-260.
6. Johnson K, Wright JE, May B: Linkage relationships reflectingancestral tetraploidy in salmonid fish. Genetics 1987,116:579-591.
7. Allendorf FW, Danzmann R: Secondary tetrasomic segregationof MDH-B and preferential pairing of homeologues in rain-bow trout. Genetics 1997, 145:1083-1092.
8. Phillips RB, Rab P: Chromosome evolution in the Salmonidae(Pisces): an update. Biol Rev (Camb) 2001, 76:1-25.
9. Sakamoto T, Danzmann R, Gharbi K, Howard P, Ozaki A, Khoo SK,Woram RA, Okamoto N, Ferguson MM, Holm LE, Guyomard R, Høy-heim B: A microsatellite linkage map of rainbow trout (Onco-rhynchus mykiss) characterized by large sex-specificdifferences in recombination rates. Genetics 2000,155:1331-1345.
10. Moen T, Høyheim B, Munck H, Gomez-Raya L: A linkage map ofAtlantic salmon (Salmo salar) reveals an uncommonly largedifference in recombination rate between the sexes. AnimalGenetics 2004, 35(2):81-92.
11. Woram RA, McGowan C, Stout JA, Gharbi K, Ferguson MM, Høyhe-im B, Davidson EA, Davidson WS, Rexroad C, Danzmann R: Agenetic linkage map for Arctic char (Salvelinus alpinus): evi-dence for higher recombination rates and segregation dis-tortion in hybrid versus pure strain mapping parents. Genome2004, 47:304-315.
12. Danzmann R, Cairney M, Davidson WS, Ferguson MM, Gharbi K,Guyomard R, Holm LE, Leder E, Okamoto N, Ozaki A, Rexroad CE,Sakamoto T, Taggard JB, Woram RA: A comparative analysis ofthe rainbow trout genome with 2 other species of fish (Arc-tic charr and Atlantic salmon) within the tetraploid deriva-tive Salmonidae family (subfamily: Salmoninae). Genome2005, 48:1037–1051.
13. Gharbi K, Gautier A, Danzmann R, Gharbi K, Sakamoto T, HøyheimB, Taggard JB, Cairney M, Powell R, Krieg F, Okamoto N, FergusonMM, Holm LE, Guyomard R: A linkage map for brown trout(Salmo trutta): chromosome homeologies and comparativegenome organization with other salmonid fish. Genetics 2006,172:2405-2419.
14. Gilbey J, Verspoor E, McLay A, Houlihan D: A microsatellite link-age map for Atlantic salmon (Salmo salar). Animal Genetics2004, 35:98-105.
15. ASalBase [http://www.asalbase.org]16. Woram RA, Gharbi K, Sakamoto T, Hoyheim B, Holm LE, Naish K,
McGowan C, Ferguson MM, Phillips RB, Stein J, Guyomard R, CairneyM, Taggart JB, Powell R, Davidson W, Danzmann RG: ComparativeGenome Analysis of the Primary Sex-Determining Locus inSalmonid Fishes. Genome research 2003, 13(2):272-280.
17. Ng SH, Artieri CG, Bosdet IE, Chiu R, Danzmann RG, Davidson WS,Ferguson MM, Fjell CD, Høyheim B, Jones SJ, de Jong PJ, Koop BF,Krzywinski MI, Lubieniecki K, Marra MA, Mitchell LA, Mathewson C,Osoegawa K, Parisotto SE, Phillips RB, Rise ML, von Schalburg KR,Schein JE, Shin H, Siddiqui A, Thorsen J, Wye N, Yang G, Zhu B: Aphysical map of the genome of Atlantic salmon, Salmo salar.Genomics 2005, 86:396-404.
18. Hayes B, Lærdahl JK, Lien S, Moen T, Berg P, Hindar K, Davidson WS,Koop BF, Adzhubei A, Høyheim B: An extensive resource of sin-gle nucleotide polymorphism markers associated withAtlantic salmon (Salmo salar) expressed sequences. Aquacul-ture 2007, 265:82-90.
19. Hayes BJ, Nilsen K, Berg PR, Grindflek E, Lien S: SNP detectionexploiting multiple sources of redundancy in large EST col-
Additional file 1Properties of SNP markers used in the study. Excel workbook containing IDs of SNPs, contigs sequences w/SNP sequence and position, allele fre-quencies, heterozygosities, and BLASTX hitsClick here for file[http://www.biomedcentral.com/content/supplementary/1471-2164-9-223-S1.xls]
Additional file 2Atlantic salmon linkage map. Linkage map in Excel format.Click here for file[http://www.biomedcentral.com/content/supplementary/1471-2164-9-223-S2.xls]
Additional file 3Marker pairs with male-female order discrepancies. Marker pairs for which marker order were inverted in one map relative to the other.Click here for file[http://www.biomedcentral.com/content/supplementary/1471-2164-9-223-S3.xls]
Page 13 of 14(page number not for citation purposes)

BMC Genomics 2008, 9:223 http://www.biomedcentral.com/1471-2164/9/223
Publish with BioMed Central and every scientist can read your work free of charge
"BioMed Central will be the most significant development for disseminating the results of biomedical research in our lifetime."
Sir Paul Nurse, Cancer Research UK
Your research papers will be:
available free of charge to the entire biomedical community
peer reviewed and published immediately upon acceptance
cited in PubMed and archived on PubMed Central
yours — you keep the copyright
Submit your manuscript here:http://www.biomedcentral.com/info/publishing_adv.asp
BioMedcentral
lections improves validation rates. Bioinformatics 2007,23:1692-1693.
20. Slate J, Pemberson JM: Admixture and patterns of linkage dise-quilibrium in a free-living vertebrate population. Journal of Evo-lutionary Biology 2007, 20:1415-1427.
21. Abecasis GR, Noguchi E, Heinzmann A, Traherne JA, BhattacharyyaS, Leaves NI, Anderson GG, Zhang Y, Lench NJ, Carey A, Cardon LR,Moffatt MF, Cookson WOC: Extent and Distribution of LinkageDisequilibrium in Three Genomic Regions. American journal ofhuman genetics 2001, 68(1):191-197.
22. Reich DE, Cargill M, Bolk S, Ireland J, Sabeti PC, Richter DJ, Lavery T,Kouyoumjian R, Farhadian SF, Ward R, Lander ES: Linkage disequi-librium in the human genome. Nature 2001,411(6834):199-204.
23. Farnir F, Coppieters W, Arranz JJ, Berzi P, Cambisano N, Grisart B,Karim L, Marcq F, Moreau L, Mni M, Nezer C, Simon P, Vanman-shoven P, Wagenaar D, Georges M: Extensive Genome-wideLinkage Disequilibrium in Cattle. Genome Research 2000,10:220-227.
24. Nsengimana J, Baret P, Haley CS, Visscher PM: Linkage Disequilib-rium in the Domesticated Pig. Genetics 2004, 166:1395-1404.
25. Lindblad-Toh K, Wade CM, Mikkelsen TS, Karlsson EK, Jaffe DB,Kamal M, Clamp M, Chang JL, Kulbokas EJ, Zody MC, Mauceli E, XieX, Breen M, Wayne RK, Ostrander EA, Ponting CP, Galibert F, SmithDR, dejong PJ, Kirkness E, Alvarez P, Biagi T, Brockman W, Butler J,Chin CW, Cook A, Cuff J, Daly MJ, Decaprio D, Gnerre S, GrabherrM, Kellis M, Kleber M, Bardeleben C, Goodstadt L, Heger A, Hitte C,Kim L, Koepfli KP, Parker HG, Pollinger JP, Searle SMJ, Sutter NB,Thomas R: Genome sequence, comparative analysis and hap-lotype structure of the domestic dog. Nature 2005,438(7069):745-746.
26. Backström N, Qvarnström A, Gustafsson L, Ellegren H: Levels oflinkage disequilibrium in a wild bird population. Biology Letters2006, 2:435-438.
27. Hartley SE, Horne MT: Chromosome polymorphism and con-stitutive heterochromatin in the Atlantic salmon, Salmosalar. Chromosoma 1984, 89:377-380.
28. Davisson MT, Wright JE, Atherton LM: Cytogenetic analysis ofpseudolinkage of LDH loci in the teleost genus Salvelinus.Genetics 1973, 73:645-658.
29. Moen T, Sonesson AK, Hayes B, Lien S, Munck H, Meuwissen THE:Mapping of a quantitative trait locus for resistance againstinfectious salmon anaemia in Atlantic salmon (Salmo Salar):comparing survival analysis with analysis on affected/resist-ant data. BMC Genetics 2007, 8:53.
30. Thorgaard GH, Allendorf FW, Knudsen KL: Gene-centromeremapping in rainbow trout: High interference over long mapdistances. Genetics 1983, 103:771-783.
31. Streisinger GF, Singer F, Walker C, Knauber D, Dower N: Segrega-tion analyses and gene-centromere distances in zebrafish.Genetics 1986, 112:311-319.
32. Allendorf FW, Seeb JE, Knudsen KL, Thorgaard GH: Gene-centro-mere mapping of 25 loci in rainbow trout. J Hered 1986,77:307-312.
33. Lindner KR, Seeb JE, Habicht C, Knudsen KL, Kretschmer E: Gene-centromere mapping of 312 loci in pink salmon by half-tet-rad analysis. Genome 2000, 43:538-549.
34. Gilbey J, Verspoor E, Mo TA, Sterud E, Olstad K, Hytterød S, JonesC, Noble L: Identification of genetic markers associated withGyrodactylus salaris resistance in Atlantic salmon Salmosalar. Dis Aquat Organ 2006, 71:119-129.
35. Sham PC, Zhao JH, Curtis D: The effect of marker characteris-tics on the power to detect linkage disequilibrium due to sin-gle or multiple ancestral mutations . Annals of Human Genetics2000, 64(2):161-169.
36. Varilo T, Paunio T, Parker A, Perola M, Meyer J, Terwilliger JD, Pelto-nen L: The interval of linkage disequilibrium (LD) detectedwith microsatellite and SNP markers in chromosomes ofFinnish populations with different histories. Human MolecularGenetics 2003, 12(1):51-59.
37. Nordborg M, Tavaré S: Linkage disequilibrium: what history hasto tell us. Trends Genet 2002, 18:83-89.
38. Teare M, Dunning A, Durocher F, Rennart G, Easton D: Samplingdistribution of summary linkage disequilibrium measures.Annals of Human Genetics 2002, 66(3):223-233.
39. Gjedrem T, Gjøen HM, Gjerde B: Genetic origin of Norwegianfarmed Atlantic salmon. Aquaculture 1991, 98:41-50.
40. Kruglyak L: Prospects for whole-genome linkage disequilib-rium mapping of common disease genes. Nature genetics 1999,22(2):139-144.
41. Ardlie KG, Kruglyak L, Seielstad M: Patterns of linkage disequilib-rium in the human genome. Nature Reviews Genetics 2002,3:299-309.
42. CIGENE [http://www.cigene.no]43. Ewing B, Hillier L, Wendl CW, Green P: Base-calling of auto-
mated sequencer traces using Phred. I. Accuracy assess-ment. Genome Research 1998, 8:175–185.
44. Marth G T, Korf I, Yandell MD, Yeh RT, Gu Z, Zakeri H, Stitzial NO,Hillier L, Kwok PY, Gish WR: A general approach to single-nucleotide polymorphism discovery. Nature Genetics 1999,23:452–456.
45. Rise ML, von Schalburg KR, Brown GD, Mawer MA, Devlin RH,Kuipers N, Busby M, Beetz-Sargent M, Alberto R, Gibbs AR, Hunt P,Shukin R, Zeznik JA, Nelson C, Jones SRM, Smailus DE, Jones SJM,Schein JE, Marra MA, Butterfield YSN, Stott JM, Ng SHS, DavidsonWS, Koop BF: Development and Application of a SalmonidEST Database and cDNA Microarray: Data Mining and Inter-specific Hybridization Characteristics . Genome Research 2004,14:478-490.
46. Salmon Genome Project [http://www.salmongenome.no]47. Sequenom [http://www.sequenom.com]48. Tang K, Fu DJ, Julien D, Braun A, Cantor CR, Köster H: Chip-based
genotyping by mass spectrometry. Proc Natl Acad Sci USA 1999,96:10016-10020.
49. Freedman D, White SJ, Potter S, Eichler EE, Den Dunnen JT, BrookesAJ: Complex SNP-related sequence variation in segmentalgenome duplications. Nat Genet 2004, 36:861–866.
50. cGRASP [http://www.uvic.ca/cbr/grasp]51. Stam P, Van Ooijen JW: JoinMap (tm) version 2.0: Software for
the calculation of genetic linkage maps. CPRO-DLO, Wage-ningen, The Netherlands; 1995.
52. Abecasis GR, Cookson WO: GOLD--graphical overview of link-age disequilibrium. Bioinformatics 2000, 16:182-183.
53. Cramer H: Mathematical Models of Statistics. Princeton, NewJersey, USA , Princeton University Press; 1946.
54. Hill WG: Estimation of effective population size from data onlinkage disequilibrium. Genetical Research 1981, 38:209–216..
55. Sved JA: Linkage disequilibrium and homozygosity of chro-mosome segments in finite populations. Theoretical PopulationBiology 1971, 2:124-141.
Page 14 of 14(page number not for citation purposes)