Embed Size (px)
Citation preview

A Likert-type Data AnalysisUsing the Partial Credit Model
Sun-Geun BaekKorean Educational Development Institute
This study is about examining the possibility of using thepartial credit model to solve several problems that occurwhen we analyze and interpret Likert-type data bytraditional methods. The problems are as follows: (i) scoresare not directly interpretable and must be examined in thelight of a criterion group; [ii] the absence of a zero pointhandicaps the direct use of individual scores; and (iii) theadequacy of integer scoring, resting upon the Validity of theassumption of equal distances between response categories,is not often verified. This study shows that the partial creditmodel (PCM) solves these problems.
In addition, the PCM provides several advantages in theanalysis and interpretation for Likert-type data (e.g., itemresponse maps, person and item fit statistics). The PCM alsomight help to implement the computerized adaptive testingfor Likert-type scales.
I. Introduction
Measurement in the area of aptitude and achievement dealswith the cognitive characteristic of human behavior and hencemust be relatively sophisticated. Most investigations, however,are related to noncognittve characteristics and involve the use ofquestionnaires, judges, ratings, self-report ratings, interviews,and similar procedures (Gamache, 1983). Clogg (1979), forexample, reports that approximately one half of all recordedobservations in the 1975 General Social Survey used a Likerttype response format. Questionnaires with ordered responsecategories are common in psychological, educational, and socialresearch. Sets of questions are developed to measure underlyingcharacteristics such as fear of crime, attitude to drugs, or likingschool. In these situations the intention is to combine an

112 THE SNU JOURNAL OF EDUCATION RESEARCH
individual's responses to a number of different questions toobtain a measure of that person's standing on the single latentcharacteristic that the questions are intended to define (Masters.1985).
Gamache (1983) examined whether scales constructed underprocedures and criteria outlined by the various traditional andlatent trait methods are varied in characteristics related to scalequality (e.g., coefficient Alpha, scale validity. score equivalence,etc.). Scales were constructed from a common pool of itemsanalyzed in the polychotomous form according to Likert and thepartial credit models. and analyzed in a dichotomous form forthe Guttman, two-parameter Birnbaum. and one-parameterRasch models. According to the study, a traditional methodbased on item to total score correlation produced a slightly morevalid scale. All five method-defined scales, however, wereremarkably similar in other characteristics related to scalequality.
The problem of the traditional method might be not in thescale construction but in the analysis and interpretation. Likert(1932) assigned successive integers to response categories andsimply summed the items to obtain a questionnaire score foreach respondent. However. this approach has been criticized onthe grounds that it assumes equal differences between adjacentresponse categories. Although a variety of alternatives to integerscoring based on systems of empirically-derived weights havebeen proposed, these more complicated schemes have invariablyproven no more useful in practice than integer scoring (Wang &Stanley, 1970). As a result, many standardized attitude andpersonality instruments have reverted to using the simplerintegral weights.
With the Likert approach there are several problems asfollows: (i) scores are not directly interpretable and must beexamined in the light of a criterion group, (ii) the absence of azero point handicaps the direct use of individual scores, and (iii)
the adequacy of integer scoring, resting upon the validity of theassumption of equal distances between response categories, isnot often verified (Gamache. 1983). To overcome the theseproblems, forms of item response models have been applied to arating scale or ordinal data (Andrich, 1978a, 1978b, 1978c,1982; Masters, 1985; Rost, 1985, 1988; Wright & Masters,

A LIKERT-TYPE DATA ANALYSIS USING THE PARTIAL CREDIT MODEL 113
1982). Item response models are claimed to share the uniquepotential, when the data fit the models, that item parameters areestimated independently of the calibration sample and that bothmeasurement of persons and analysis of items is freed from thespecific set of items and persons used for calibration.
In the 1950's, Georg Rasch, introduced and used ameasurement model for dichotomously-scored performances.This model, which is often referred to as 'the Rasch model', hasbeen widely applied to the analysis of educational test data andto the construction and maintenance of item banks. A simpleextension of right/wrong scoring is to identify one or moreintermediate levels of performance on an item and to awardpartial credit for reaching these intermediate levels.
For an item on a Likert-type attitude questionnaire (e.g.,culture shock questionnaire (Baek, 1991)), 'completing the j'thstep' can be thought of as choosing the j'th alternative over the 0- l l'th in response to the item. Thus a person who chooses'Moderate Difficulty' with a statement on a culture shockquestionnaire when given the ordered categories shown inFigure 1 to choose among, can be considered to have chosen'Slight Difficulty' over 'No Difficulty' (first step taken) and also'Moderate Difficulty' over 'Slight Difficulty' (second step taken),but to have failed to choose 'Great Difficulty' over 'ModerateDifficulty' (third step not taken).
The relative difficulties of the 'steps' in a Likert-type scale itemare usually intended to be governed by the fixed set of ratingpoints accompanying the items (Andrich, 1978a, 1978b, 1978c,1982). As the same set of rating points is used with every item, itis usually thought that the relative difficulties of the steps ineach item should not vary from item to item. This expectationcan be incorporated into the extended Rasch model by resolvingeach item step into two components so that
c5y = c5i + 7J
Figure 1. A Typical Likert-type Scale
No Slight Moderate Great ExtremeDifficulty Difficulty Difficulty Difficulty Difficulty
0 1 2 3 4

114 THE SNU JOURNAL OF EDUCATION RESEARCH
where th is the location or 'scale value' of item i on the variableand 1J is the location of the j'th step in each item relative to thatitem's scale value. The extended Rasch model with 0y = 0i + 1J byAndrich (1978a) is called the rating scale model (RSM). The RSMis defined as follows:
xexp 2:1f3n-(Oi+Tj)]
j=om k2: exp 2: lf3n - (Oi + T j )]
k=O j=o
IInix = ----"---.------
ox=O,I,"', m where '£0=0 so that eXP2:If3n-(bi+Tj))=l.
j=o
The IInix is the probability of person n responding in categoryx to item i, f3 is a person's level of ability in a given area, andthere are m categories in the item.
Although we ideally analyze the Likert-type data using theRSM, there is at least an unsolved problem: The assumptionthat the relative difficulties of the steps in each item are thesame is not often verified. In addition, the RSM is, notappropriate for the Likert-type data used in this study (see thedetailed results section in this paper). However, it is possible tosolve this problem. Masters (1982) has extended the Andrich'sRSM to the situation where category alternatives are free to varyin number and structure from item to item, the so-called thepartial credit model (PCM). The PCM does not impose anyparticular expectation of the pattern of difficulties of stepswithin each item. Although the PCM is more general than theRSM, it is a more parsimonious model than the other models (e.g., the graded response model (Samejima, 1969)). The PCMcontains one parameter for each person and one parameter foreach 'step' in an item. Consider an item with five ordered levels,0, 1, 2, 3, and 4, provides four steps. For such an item, fourparameters are estimated. First, bn, governs the modelprobability of scoring 1 rather than O. Second, bi2 , governs themodel probability of scoring 2 rather than I, Third, 0i3' governsthe model probability of scoring 3 rather than 2. Fourth, bi4 ,
governs the model probability of scoring 4 rather than 3. ThePCM with by is defined as follows:

A LIKERT-TYPE DATA ANALYSIS USING THE PARTIAL CREDIT MODEL 115
xexp ~(j3n - by)
j=Omi k~ exp ~(j3n - by)
k=O j=O
llnix = -,--------"-----;-----
ox = 0,1,···, mi where bio" 0 so that exp ~(j3n - by) = 1.
j=o
The Ilnix is the probability of person n responding in categoryx to item i, j3 is a person's level of ability in a given area, and byis a parameter that governs the probability of a response beingmade in category x rather than in category x-I of item i.
This study examines the possibility of using the PCM to solvethree problems in Likert-type data analysis and interpretation:(i) scores are not directly interpretable and must be examined inthe light of a criterion group, (ii) the absence of a zero pointhandicaps the direct use of individual scores, and (iii) theadequacy of integer scoring, resting upon the validity of theassumption of equal distances between response categories, isnot often verified.
II. Method
Subjects: The number of subjects of the study is 104 Koreanstudents at D.C. Berkeley (males> 89, females» 15). They wererandomly selected. The mean age of the subjects was 27.33years (range: 20 - 41 years).
Data: Seven data items are selected from a study (Baek, 1991)using five-category Likert-type culture shock questionnaireitems (see Table I).
Analysis: The data are analyzed according to the partial creditmodel by a computer program: TITAN (Adams & Toon, 1991).
The questions to be answered are: (1) Where is the item i locatedon the variable? (the item's calibration by); (2) How precise is thiscalibration? (the modeled error of calibration si); (3) How well doresponses to item i fit the expectations of the measurementmodel? (the item's fit til; (4) Where is person n located on thevariable? (the person's measure bn); (5) How precise is thismeasure? (the modeled error of measurement sn); and, (6) How

116 THE SNU JOURNAL OF EDUCATION RESEARCH
Table 1. 7 Items' Contents
Items Degree of difficulty*
1. Using facilities (e.g., school store, lounge, rest room).o 1 2 3 4
2. Using educational facilities (e.g. laboratory, computer room, studio).o 1 2 3 4
3. Making friends of the same sex and of another nationality in theschool.
o 1 2 3 44. Making friends of the opposite sex and of the same nationality in theschool.
o 1 2 3 45. Making friends of the opposite sex and of another nationality in the
school.012
6. Joining in circles, clubs or associations in the school.012
7. Joining in school events. 0 I 2
3
33
4
44
*O-no difficulty, l vslight difficulty, 2-moderate difficulty, 3-greatdifficulty, 4-extreme difficulty.
well do responses of person n fit the expectations of the model?(the person's fit tn).
If item's fit ti and person's fit tn are good enough, the PCM willbe a candidate to solve those problems in Likert-type dataanalysis and interpretation.
III. Results
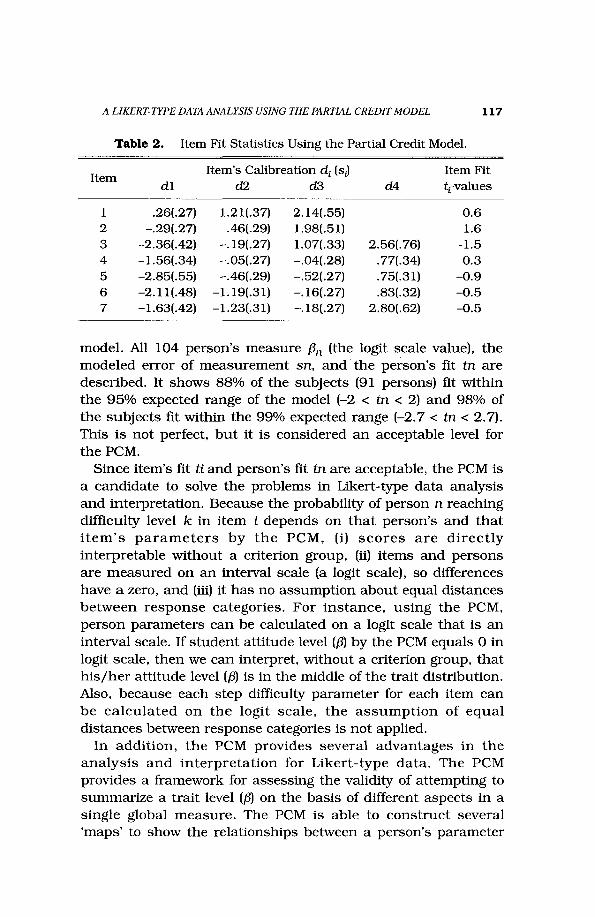
Table 2 shows the item fit statistics using the partial creditmodel. Each item's calibration Di (the logtt scale value), themodeled error of calibration si , and the item's fit ti aredescribed. It shows all 7 items fit the expectations of themeasurement model (-2 < ti < 2). In contrast, the item fitstatistics using the rating scale model and shows two items(item 3 and 4) do not fit the the expectations of themeasurement model (ti = -3.5 and 2.3 respectively). It impliesthe PCM is more appropriate for this data than the RSM.
Table 3 shows the person fit statistics using the partial credit
A LIKERT-TYPE DATA ANALYSIS USING THE PARTIAL CREDIT MODEL 117
Table 2. Item Fit Statistics Using the Partial Credit Model.
ItemItem's Calibreation d i (sJ Item Fit
d1 d2 d3 d4 tcvalues
1 .26(.27) 1.21(.37) 2.14(.55) 0.62 -.29(.27) .46(.29) 1.98(.51) 1.63 -2.36(.42) -.19(.27) 1.07(.33) 2.56(.76) -1.54 -1.56(.34) -.05(.27) -.04(.28) .77(.34) 0.35 -2.85(.55) -.46(.29) -.52(.27) .75(.31) -0.96 -2.11(.48) -1.19(.31) -.16(.27) .83(.32) -0.57 -1.63(.42) -1.23(.31) -.18(.27) 2.80(.62) -0.5
model. All 104 person's measure f3n (the Iogtt scale value), themodeled error of measurement sn, and the person's fit tn aredescribed. It shows 88% of the subjects (91 persons) fit withinthe 95% expected range of the model (-2 < tn < 2) and 98% ofthe subjects fit within the 99% expected range (-2.7 < tn < 2.7).This is not perfect, but it is considered an acceptable level forthe PCM.
Since item's fit ti and person's fit tn are acceptable, the PCM isa candidate to solve the problems in Likert-type data analysisand interpretation. Because the probability of person n reachingdifficulty level k in item i depends on that person's and thatitem's parameters by the PCM, (i] scores are directlyinterpretable without a criterion group, (ii) items and personsare measured on an interval scale (a logtt scale], so differenceshave a zero, and (iii) it has no assumption about equal distancesbetween response categories. For instance, using the PCM,person parameters can be calculated on a logit scale that is aninterval scale. If student attitude level (f3l by the PCM equals 0 inlogit scale, then we can interpret, without a criterion group, thathis/her attitude level (f3) is in the middle of the trait distribution.Also, because each step difficulty parameter for each item canbe calculated on the logtt scale, the assumption of equaldistances between response categories is not applied.
In addition, the PCM provides several advantages in theanalysis and interpretation for Ltkert-type data. The PCMprovides a framework for assessing the validity of attempting tosummarize a trait level (f3l on the basis of different aspects in asingle global measure. The PCM is able to construct several'maps' to show the relationships between a person's parameter

Tab
le3
.P
erso
nF
itS
tati
stic
sU
sin
gth
eP
arti
alC
red
itM
odel
I-"
I-"
Q)
ID#
bn(s
,Jin
ID#
bn(s
,Jin
ID#
bn(s
,Jin
1-.
57
(.4
3)
-1.3
36
-1.4
3(.
50
}-.
971
.34(
.44}
-1.0
2.1
6(.4
3}-.
33
7-.
03
(.4
3}
-.9
72
1.19
(.49
}-.
13
-.5
7(.
43
}-1
.33
8.7
4(.4
6}.7
73
.34(
.44}
.74
-.5
7(.
43
}2
.33
9-1
.19
(.4
8)
-1.4
74
-1.1
9(.4
8}-1
.8;j
5.5
4(.4
5}-.
14
0-.
03
(.4
3}
-1.4
75
-.5
7(.
43
}-.
9t>
i
~6
.34(
.44}
-.9
41-1
.68
(.7
2}
-1.4
76
-1.1
9(.4
8}.2
c::: ~7
-.0
3(.
43
}-1
.14
2.3
4(.4
4}-.
47
7.1
6(.4
3}-.
2~
8.9
6(.4
7}1
.04
3-.
97
(.4
6}
-1.0
78
1.69
(.51
}-.
4;:..
:9
.96(
.47}
1.0
44
1.69
(.51
}-1
.67
9-.
03
(.4
3}
1.0
t- Q
10.1
6(.4
3}-.
74
5-.
57
(.4
3}
-1.3
80
-.5
7(.
43
}2
.2~ gj
11-.
57
(.4
3}
1.6
46
.16(
.43}
.98
1-.
57
(.4
3)
-2.0
c::: ~12
-.5
7(.
43
)-1
.44
7.7
4(.
46
)-.
38
2-.
76
(.4
4}
2.7
:::l13
-.5
7(.
43
)-1
.44
8-.
39
(.4
3)
-1.7
83
-.2
1(.
42
)-.
7~
141
.19
(.4
9)
-1.2
49
.96
(.4
7)
.88
4-2
.40
(.6
6)
-.5
::t> 1351
51
.19
(.4
9)
-1.2
50
.54
(.4
5)
.48
5.3
4(.4
4)-2
.3~ ::t>
16.1
6(.
43
)-.
751
.54
(.4
5)
.88
6.3
4(.4
4)-1
.0Q
17
.34(
.44}
.85
2-.
21
(.4
2}
-1.1
87
-.0
3(.
43
)1
.81
8-.
97
(.4
6)
1.1
53
-2.4
0(.
66
).3
88
.16(
.43)
-.9
19-.
57
(.4
3}
-.3
54
-1.4
3(.
50
)2
.48
9.1
6(.4
3)-1
.12
0-2
.01
(.5
9)
-.2
55
.74
(.4
6)
.69
0.7
4(.4
6).0
21-.
97
(.4
6}
.95
61
.69
(.5
1)
-1.6
91
-1.7
0(.
54
)-2
.6

;... ~
Tab
le3
.(C
on
tin
ued
)~ ';'3
ID#
bn
(s,J
t nID
#bn
(snl
t nID
#bn
(s,J
t n~ t>'
l ~2
21
.19
(.4
9)
-.5
57
-.5
7(.
43
).5
92
.34
(.4
4)
-.5
~
23
-1.1
9(.
48
)-1
.05
8-.
57
(.4
3)
-.0
93
-1.7
0(.
54
)-.
7;..
. 5;2
4.5
4(.
45
)-1
.35
9.3
4(.
44
)-1
.09
4-.
21
(.4
2)
-1.4
r- ;;j2
5-.
21
(.4
2)
-.8
60
-1.1
9(.
48
)1
.49
5-.
97
(.4
6)
-.8
<;;
26
-1.4
3(.
50
)-1
.761
-2.0
1(.
59
)1
.39
6-1
.43
(.5
0)
-1.6
i;5 ~2
7-.
76
(.4
4)
-1.2
62
-1.1
9(.
48
).7
97
-.2
1(.
42
)2
.7C
)
28
-1.7
0(.
54
)-2
.66
3-.
76
(.4
4)
2.3
98
1.1
9(.
49
)4
.25! t>'
l2
91
.44
(.5
0)
-1.0
64
-1.7
0(.
54
)1
.89
9.1
6(.
43
)-.
4~
30
-.2
1(.
42
}1
.16
5.3
4(.
44
)-2
.31
00
-2.4
0(.
66
)::t
l-1
.1~ t--<
31
-.0
3(.
43
)-1
.16
6-.
39
(.4
3)
1.6
10
1-.
97
(.4
6)
4.0
&:53
2-.
57
(.4
3)
1.0
67
-.7
6(.
44
}.1
10
2-.
76
(.4
4)
-.6
gj3
3.3
4{.4
4)-.
96
8-.
39
(.4
3)
-2.4
10
3-.
03
(.4
3)
-1.5
~
34
-.2
1(.
42
).1
69
1.6
9(.
51
)-1
.61
04
-1.1
9(.
48
)-1
.8~ §
35
-.3
9(.
43
)-.
27
0.1
6(.4
3}-.
2~ I-
'I-
'C
£)

120 THE SNU JOURNAL OF EDUCATION RESEARCH
32
'.I,\ '.
"""'1
"~,_...
·1 0
Culture Shock Level
........•..--.........,...,.'.1,\
\,"\ '.\
\ 4I,\
•9
.8
.7
?:: .6
.0
'" .5.0
~0.. .4
.3
.20
.1
0·3 ·2
Figure 2. Item Response Map for Item 4.
and probability (see Figure 2), and between a person's parameterand item thresholds (see Table 4 and Figure 3). These maps helpone to understand and to interpret those relationships (Masters& Wilson, 1991; Wilson. 1990).
Figure 2 shows how the probability of a student's response ineach category of item 4 (Making friends of the opposite sex andof another nationality in the school) changes with increasing'culture shock level'. For example, from Figure 2 we can see thata student with an estimated 'culture shock level' of 0.0 logtts(middle of the picture) has an estimated model probability ofabout 0.05 of scoring 0 (no difficulty) on item 4;0.26 of scoring 1 (slight difficulty); 0.27 of scoring 2 (moderatedifficulty); 0.28 of scoring 3 (great difficulty); 0.13 of scoring 4(extreme difficulty). The relative values of these modelprobabilities change with the changing 'culture shock level'. Asthe 'culture shock level', for example. increases above this level,the estimated model probability of scoring 4 (extreme difficulty)increases.
In addition, Figure 2 shows the 'thresholds (T)' of item 4. The'thresholds' that are analogous to Thurstonian thresholdsprovide a way to summarize information about several partialcredit items. A 'threshold' for an item step is the 'culture shocklevel' that is requtred for an individual to have a 50% probabilityof choosing that level. The 'thresholds (T)' can be interpreted as

A LIKERT-TYPE DATA ANALYSIS USING THE PARTIAL CREDIT MODEL 121
Table 4. Items' Thresholds.
ItemThresholds
Tl 1'2 T3 T4
1 -.08 1.24 2.202 -.66 .50 2.063 -2.50 -.38 1.02 2.644 -1.80 -.47 .12 1.055 -2.97 -.97 -.28 .926 -2.42 -1.23 -.20 1.037 -2.09 -1.17 -.03 2.75
8
7
6~
CIl.0 5E::JZ
4E
0~ 3
2 • T1
XT21 .T3
V'T4
Culture Shock Level
Figure 3. A Summary Item Response Map for 7 Items.
the crest of a wave of predominance of successive dichotomoussegments of the set of categories.
For example, Tl is the estimated point at which categories 1,2, 3, and 4 become more likely than category 0, T2 is theestimated point at which categories 2,3, and 4 become morelikely than categories °and 1, T3 is the estimated point at whichcategories 3 and 4 become more likely than categories 0, 1, and2, and T4 is the estimated point at which category 4 becomemore likely than categories 0, 1, 2, and 3.
Table 4 and Figure 3 show the 'thresholds (T)' of all 7 items.
122 THE SNU JOURNAL OF EDUCATION RESEARCH
From Figure 3, the students have less difficulty with items 1 and2 than with items 3, 4, 5, 6, and 7. For example, a student withan estimated 'culture shock level' of 2.0 logtts will more likelyrespond in category 2 (moderate difficulty), 1 (slight difficulty),and 0 (no difficulty) on items 1 and 2 than in categories 3 (greatdifficulty) and 4 (extreme difficulty). In contrast, the student willmore likely respond in category 4 on items 4, 5, and 6 than incategories 0, 1, 2, and 3 and will more likely respond incategories 4 and 3 on items 3 and 7 than in categories 0, 1, and2.
For another example, a student with an estimated 'cultureshock level' of -1.0 logits will more likely respond in category 0on items 1 and 2 than in categories 1, 2, 3, and 4. In contrast,the student will more likely respond in categories 1 and 0 onitems 3, 4, and 5 than in categories 2, 3, and 4, and will morelikely respond in categories 2, 1, and 0 on items 6 and 7 than incategories 3 and 4. In addition, we can see how students'response to each item changes with increasing 'culture shocklevel'.
From the Figure 3, we can see that the distances among the'thresholds (T)' of each item are different. It means there aredifferences in changes in students' response categories for eachitem with increasing 'culture shock level'. For example, item 4'sdistances among Thurstonian thresholds are relatively smallerthan those of item 3. That is, according to increasing 'cultureshock level', students' response categories to item 4 (Makingfriends of the opposite sex and of another nationality in theschool) more rapidly change than those to item 3 (Makingfriends of the same sex and of another nationality in the school).
The PCM, furthermore, helps to identify particular sources ofmisfit (e.g., particular misfitting items or persons). In case ofitem misfit, for example, the misfitting items do not worktogether well enough to be treated as indicators of a latentvariable estimated by the PCM. In this study, there is no misfititem among the seven analyzed items. In case of person misfit,for example, it helps to find easily individual differences inresponse style. If tn is less than -2, it means the person has anunusually regular pattern of responses - more regular than thePCM expects for persons responding to items. The standardizedresiduals for this person are very close to zero (e.g., student #
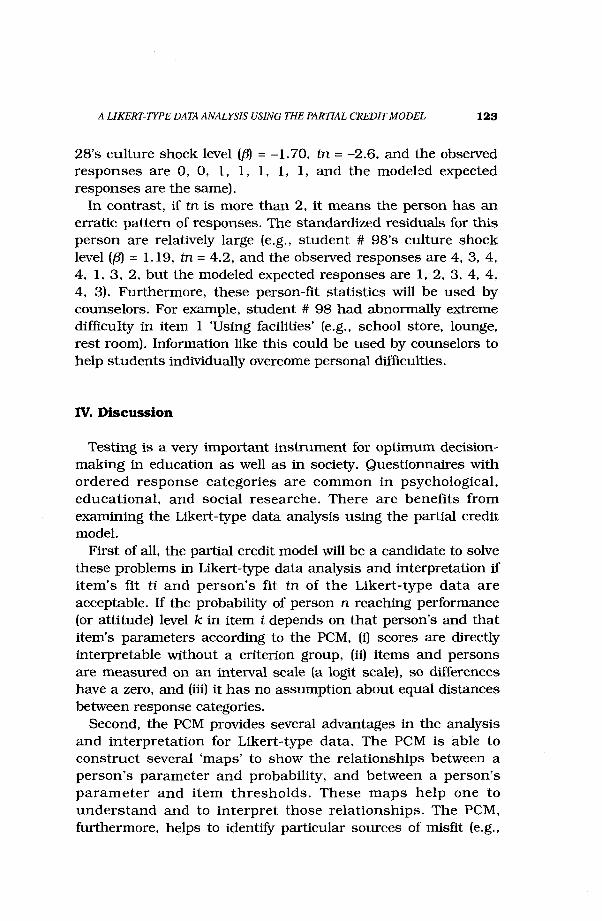
A LIKERT-TYPE DATA ANALYSIS USING THE PARTIAL CREDIT MODEL 123
28's culture shock level (fJ) = -1.70, tn = -2.6, and the observedresponses are 0, 0, 1, 1, 1, 1, 1, and the modeled expectedresponses are the same).
In contrast, if tn is more than 2, it means the person has anerratic pattern of responses. The standardized residuals for thisperson are relatively large (e.g., student # 98's culture shocklevel (13) = 1.19, tn = 4.2, and the observed responses are 4, 3, 4,4, 1, 3, 2, but the modeled expected responses are 1, 2, 3, 4, 4,4, 3). Furthermore, these person-fit statistics will be used bycounselors. For example, student # 98 had abnormally extremedifficulty in item 1 'Using facilities' (e.g., school store, lounge,rest room). Information like this could be used by counselors tohelp students individually overcome personal difficulties.
IV. Discussion
Testing is a very important instrument for optimum decisionmaking in education as well as in society. Questionnaires withordered response categories are common in psychological.educational, and social researche. There are benefits fromexamining the Likert-type data analysis using the partial creditmodel.
First of all, the partial credit model will be a candidate to solvethese problems in Likert-type data analysis and interpretation ifitem's fit ti and person's fit tn of the Likert-type data areacceptable. If the probability of person n reaching performance(or attitude) level k in item i depends on that person's and thatitem's parameters according to the PCM, (i) scores are directlyinterpretable without a criterion group, (ii) items and personsare measured on an interval scale (a logtt scale), so differenceshave a zero, and (iii) it has no assumption about equal distancesbetween response categories.
Second, the PCM provides several advantages in the analysisand interpretation for Likert-type data. The PCM is able toconstruct several 'maps' to show the relationships between aperson's parameter and probability, and between a person'sparameter and item thresholds. These maps help one tounderstand and to interpret those relationships. The PCM,furthermore, helps to identify particular sources of misfit (e.g.,

124 THE SNU JOURNAL OF EDUCATION RESEARCH
particular misfitting items or persons).The PCM also might help to implement the computerized
adaptive testing (CAT) for Likert-type scales (Baek, 1993; Koch &Dodd, 1989). With the item information using each item'scalibration by and the person's background information (e.g.,gender, academic status, marital status.I, a CAT might providethe optimal item to a person in order to estimate his attitudelevel up to the desirable accuracy that is decided before he takesthe questionnaire. It might reduce not only the number of itemsfor the questionnaire but also the measurement error.
References
Adams, RJ. & Khoo, S.T. (1991) TITAN: The Interactive TestAnalysis System, Hawthorn, Australia: ACER
Andrich, D. (1978a). "Scaling Attitude Items Constructed andScored in the Likert Tradition," Educational andPsychological Measurement. 38, 665-680.
(1978b). "Application of a Psychometric RatingModel to Ordered Categories which are Scored withSuccessive Integers," Applied Psychological Measurement. 2(4), 581-594.
(1978c). "A Rating Formulation for OrderedResponse Categories," Psychometrika, 43(4), 561-573.
(1982). "An Extension of the Rasch Model forRatings Providing both Location and Dispersion Parameters," Psychometrika, 47(1), 105-113.
Baek, S.G. (1993). Computerized Adaptive Attitude Testing Usingthe Partial Credit Model, Doctoral dissertation, University ofCalifornia at Berkeley.
----- (1991). The Culture Shock of Korean Students at U.C. Berkeley, (unpublished).
BMDP. (1990). BMDP Statistical Software Manual, 1, Universityof California Press.
Gamache, L.M. (1983). Comparison of Traditional and LatentTrait Procedures in Analysis and Selection of Rating ScaleItems (ERIC. ED230578).
Hambleton, RK. (1989). "Principles and Selected Applications ofItem Response Theory," In RL. Linn (Ed.), EducationalMeasurement. New York: American Council on Education,Macmillan.
_____, & Swaminathan, H. (1985). Item Response Theory:Principles and Applications. Boston: Kluwer-Ntjhoff.
A LIKERT-TYPE DATA ANALYSIS USING THE PARTIAL CREDIT MODEL 125
----- (Ed.). (1983). Applications oj Item Response Theory.Vancouver, BC: Educational Research Institute of BritishColumbia.
Kock, W.R & Dodd, B.G. (1989). "An Investigation of Proceduresfor Computerized Adaptive Testing Using Partial CreditScoring," Applied Measurement in Education, 2(4), 335-57.
Lord, F.M. (1980). Applications oj Item Response Theory toPractical Testing Problems. Hillsdale, NJ.: Erlbaum.
Masters, G.N. (1985). "A Comparison of Latent Trait and LatentClass Analysis of Likert-type Data," Psychometrika, 50(1),69-82.
-----, & Wilson, M. (1991). "The Measurement ofUnderstanding," Paper presented at a Workshop on PartialCredit Model, ETS, Princeton, N.J.
Rost, J. (1985). "A Latent Class Model for Rating Data,"Psychometrika, 50(1), 37-49.
(1988). "Rating Scale Analysis with Latent ClassModels," Psychometrika, 53(3), 327-348.
Samejima, F. (1969). "Estimation of Latent Ability Using aResponse Pattern of Graded Scores," Psychometrika,[Monograph], 34(Suppl. 4).
Wang, M.W. & Stanley, J.C. (1970). "Differential Weighting: AReview of Methods and Empirical Studies," Review ojEducational Research, 40, 663-705.
Wilson, M. & Mislevy, RJ. (1989). "Test Theory for MeasuringUnderstanding and Learning," Paper presented at the ETSInternational Symposium on Language Acquisition andLanguage Assessment. Princeton, N.J.
(1991). (in press), The Partial Order Model: AnExtension oj the Partial Credit Model..
(1990). Measuring Levels oj MathematicalUnderstanding, (unpublished).
Wright, B.D. & Masters, G.N. (1982). Rating Scale Analysis.Chicago: MESA Press.


![The Likert organizational profile: methodological - [email protected]](https://img.pdfslide.us/doc/110x75/6204ecd54c89d3190e0c9844/the-likert-organizational-profile-methodological-emailprotected.jpg)