Embed Size (px)
Citation preview
A LIFE CYCLE INVENTORY FORROAD AND ROOFING ASPHALT
Prepared by:FRANKLIN ASSOCIATES,A SERVICE OF MCLAREN-HART/JONES
Ottawa, CanadaMarch, 2001
ACKNOWLEDGEMENTS
This report was made possible through the support of Natural ResourcesCanada and the federal Climate Change Action Fund under its TechnologyEarly Action Measures Program (TEAM).
DISCLAIMER
Although the ATHENATM Sustainable Materials Institute has done its bestto ensure accurate and reliable information in this report, the Institute doesnot warrant the accuracy thereof. If notified of any errors or omissions,the Institute will take reasonable steps to correct such errors or omissions.
COPYRIGHT
No part of this report may be reproduced in any form or by any means,electronic or mechanical, including photocopying, without the writtenpermission of the ATHENATM Sustainable Materials Institute.
Text © 2001 ATHENATM Sustainable Materials Institute
ATHENATM Sustainable Materials Institute28 St. John Street, P.O. Box 189Merrickville, Ontario, Canada, K0G 1N0Tel: 613-269-3795Fax: 613-269-3796Email: [email protected]
Preface
This report has been prepared as part of a continuing program to extend theknowledge base of the ATHENA Sustainable Materials Institute, a not-for-profitorganization dedicated to helping the building community meet the environmentalchallenges of the future. The data developed in this report will be used inATHENA , the Institute’s systems model for assessing the relative life cycleenvironmental implications of alternative building or assembly designs.
Institute studies and publications fall into two general categories: investigative orexploratory studies intended to further general understanding of life cycleassessment as it applies to building materials and buildings; and individual lifecycle inventory studies which deal with specific industries, product groups orbuilding life cycles stages. All studies in this latter category are firmly groundedon the principles and practices of life cycle assessment (LCA), and follow ourpublished Research Guidelines, which define boundary or scope conditions andensure equal treatment of all building materials and products in terms ofassumptions, research decisions, estimating methods and other aspects of thework.
The integration of all the Institute’s life cycle inventory data is a primary functionof ATHENA itself, and we therefore caution that individual industry life cyclestudy reports may not be entirely stand-alone documents in the sense that they tellthe whole story about an individual set of products. ATHENA also generatesvarious composite measures that can be best described as environmental impactindicators, a step toward the ultimate LCA goal of developing true measures ofimpacts on human and ecosystem health.
Table of Contents
1.0 INTRODUCTION............................................................................................. 1
1.1 MATERIALS ANALYZED .................................................................................... 11.2 REPORT STRUCTURE ......................................................................................... 1
2.0 ROAD ASPHALT ............................................................................................. 3
3.0 ROOFING ASPHALT ...................................................................................... 6
REFERENCES ........................................................................................................... 10
LIST OF TABLES
Table 1 Total Cradle to Production Life Cycle Data for 1 Kilogram of Road Asphalt ............................. 4Table 2 Total Cradle to Production Life Cycle Data for 1 Kilogram of Roofing Asphalt......................... 8
LIST OF FIGURES
Figure 1 Flow Diagram for the Production of 1,000 Kilograms of Road Asphalt....................................... 3Figure 2 Flow Diagram for the Manufacture of 1,000 Kilograms of Roofing Asphalt............................... 7
APPENDIX A:
LCI DATA FOR PETROLEUM PRODUCTION ANDREFINING, INCLUDING ASPHALT PRODUCTION
ATHENATM INSTITUTE
A LIFE CYCLE INVENTORY FOR ROAD AND ROOFING ASPHALT
1.0 Introduction
This report provides supporting documentation for life cycle inventories of asphaltmaterials used in road and roofing applications. The life cycle inventory modeling wasconducted using Franklin Associates’ data and SimaPro 5 software (Beta version) fromPRé Consultants.
1.1 Materials Analyzed
Asphalt is a high molecular weight hydrocarbon, a coproduct of petroleum refining. It isan excellent natural preservative as well as an outstanding waterproofing and adhesiveagent. These properties make it useful in road and roofing applications.
The following specific materials are analyzed in this study:
• road asphalt• roofing asphalt
The analysis is limited to the primary constituents of each material. Unless specificallynoted otherwise, the analysis does not include road aggregate, reinforcing materials,fillers, fire retardants, surface coatings, facings, etc. Furthermore, this analysis does notinclude application or installation of the asphalt road or roofing product, nor theirdisposal at end-of-life.
1.2 Report Structure
For each asphalt application analyzed, this report includes the following information:
• a brief description of the material and its production;• a flow diagram showing all the process steps in the production of the material,
beginning with raw material extraction and continuing through production of thematerial in the form in which it is used in road or roofing applications;
• a cradle-to-production table for each material; and• a list of references for all processes in the production of the material.

ATHENATM INSTITUTE: LCI FOR ROAD AND ROOFING ASPHALT 2
References are listed at the end of the report.
Detailed descriptions and tables for individual processes in petroleum extraction andrefining may be found in Apprendix A: LCI Data for Petroleum Production andRefining, Including Asphalt Production.
ATHENATM INSTITUTE: LCI FOR ROAD AND ROOFING ASPHALT 3
2.0 Road Asphalt
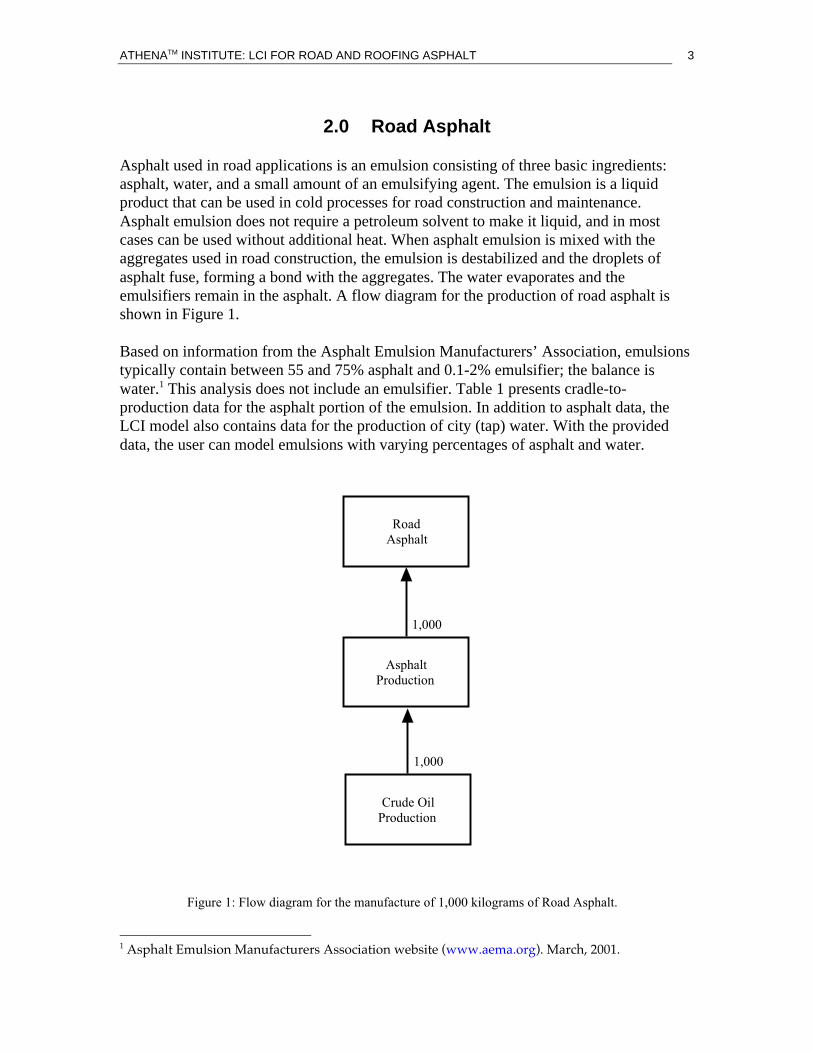
Asphalt used in road applications is an emulsion consisting of three basic ingredients:asphalt, water, and a small amount of an emulsifying agent. The emulsion is a liquidproduct that can be used in cold processes for road construction and maintenance.Asphalt emulsion does not require a petroleum solvent to make it liquid, and in mostcases can be used without additional heat. When asphalt emulsion is mixed with theaggregates used in road construction, the emulsion is destabilized and the droplets ofasphalt fuse, forming a bond with the aggregates. The water evaporates and theemulsifiers remain in the asphalt. A flow diagram for the production of road asphalt isshown in Figure 1.
Based on information from the Asphalt Emulsion Manufacturers’ Association, emulsionstypically contain between 55 and 75% asphalt and 0.1-2% emulsifier; the balance iswater.1 This analysis does not include an emulsifier. Table 1 presents cradle-to-production data for the asphalt portion of the emulsion. In addition to asphalt data, theLCI model also contains data for the production of city (tap) water. With the provideddata, the user can model emulsions with varying percentages of asphalt and water.
RoadAsphalt
AsphaltProduction
Figure 1: Flow diagram for the manufacture of 1,000 kilograms of Road Asphalt.
1,000
Crude OilProduction
1,000
1 Asphalt Emulsion Manufacturers Association website (www.aema.org). March, 2001.
ATHENATM INSTITUTE: LCI FOR ROAD AND ROOFING ASPHALT 4
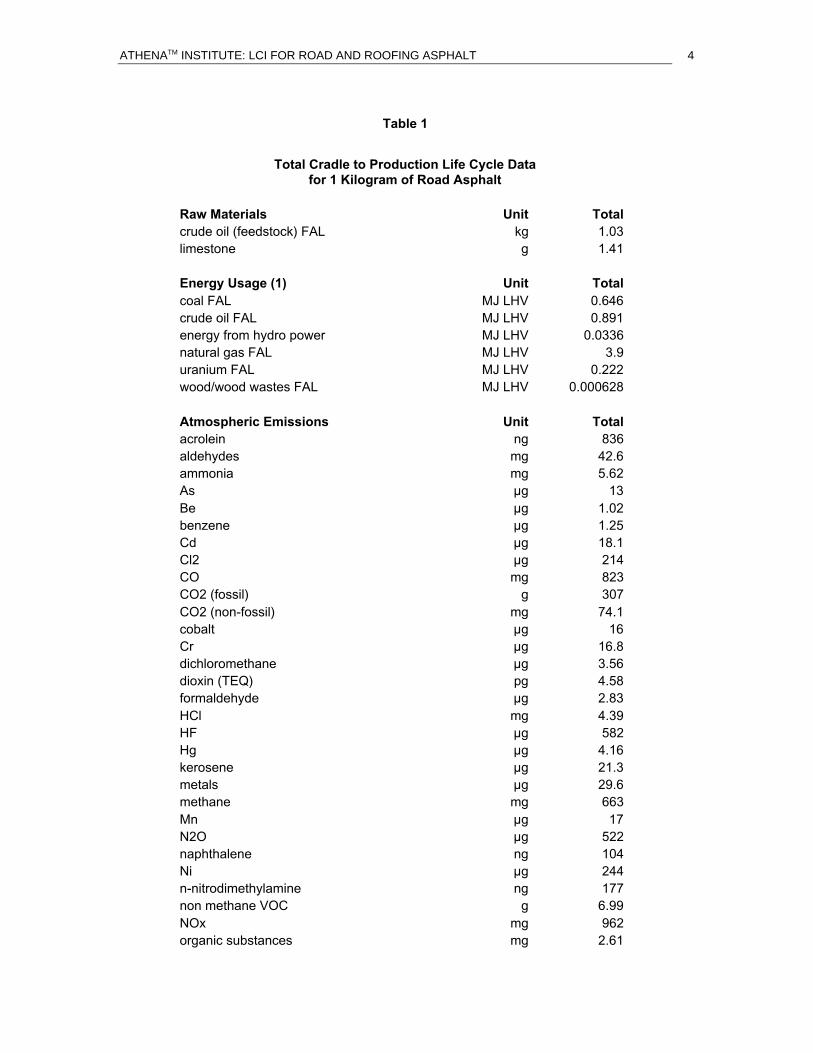
Table 1
Total Cradle to Production Life Cycle Datafor 1 Kilogram of Road Asphalt
Raw Materials Unit Totalcrude oil (feedstock) FAL kg 1.03limestone g 1.41
Energy Usage (1) Unit Totalcoal FAL MJ LHV 0.646crude oil FAL MJ LHV 0.891energy from hydro power MJ LHV 0.0336natural gas FAL MJ LHV 3.9uranium FAL MJ LHV 0.222wood/wood wastes FAL MJ LHV 0.000628
Atmospheric Emissions Unit Totalacrolein ng 836aldehydes mg 42.6ammonia mg 5.62As µg 13Be µg 1.02benzene µg 1.25Cd µg 18.1Cl2 µg 214CO mg 823CO2 (fossil) g 307CO2 (non-fossil) mg 74.1cobalt µg 16Cr µg 16.8dichloromethane µg 3.56dioxin (TEQ) pg 4.58formaldehyde µg 2.83HCl mg 4.39HF µg 582Hg µg 4.16kerosene µg 21.3metals µg 29.6methane mg 663Mn µg 17N2O µg 522naphthalene ng 104Ni µg 244n-nitrodimethylamine ng 177non methane VOC g 6.99NOx mg 962organic substances mg 2.61

ATHENATM INSTITUTE: LCI FOR ROAD AND ROOFING ASPHALT 5
(Continued)particulates mg 181Pb µg 85.6phenol µg 3.13Sb µg 5.62Se µg 11.7SOx g 3.95tetrachloroethene ng 799tetrachloromethane µg 1.44trichloroethene ng 790
Waterborne Wastes Unit TotalAcid as H+ µg 1.12B mg 4.57BOD mg 18.5Ca µg 18.3Cd µg 201chromate µg 14.5Cl- mg 201COD mg 129Cr µg 205cyanide ng 301dissolved solids g 5.39Fe mg 3.74fluoride ions µg 84.9H2SO4 mg 1.14Hg ng 15.8metallic ions mg 24.5Mn mg 1.91Na µg 33.7NH3 mg 1.95nitrate µg 8.01oil mg 122other organics mg 13.5Pb µg 2.04phenol µg 79.6phosphate µg 573sulphate mg 168suspended solids mg 132Zn µg 99.5
Solid Wastes Unit Totalsolid waste g 22.9
Nonmaterial Emissions Unit Totalradioactive substance to air kBq 1.18 (1) The energy usage for this material utilizes the FranklinAssociates fuel data from 1998.
ATHENATM INSTITUTE: LCI FOR ROAD AND ROOFING ASPHALT 6
3.0 Roofing Asphalt
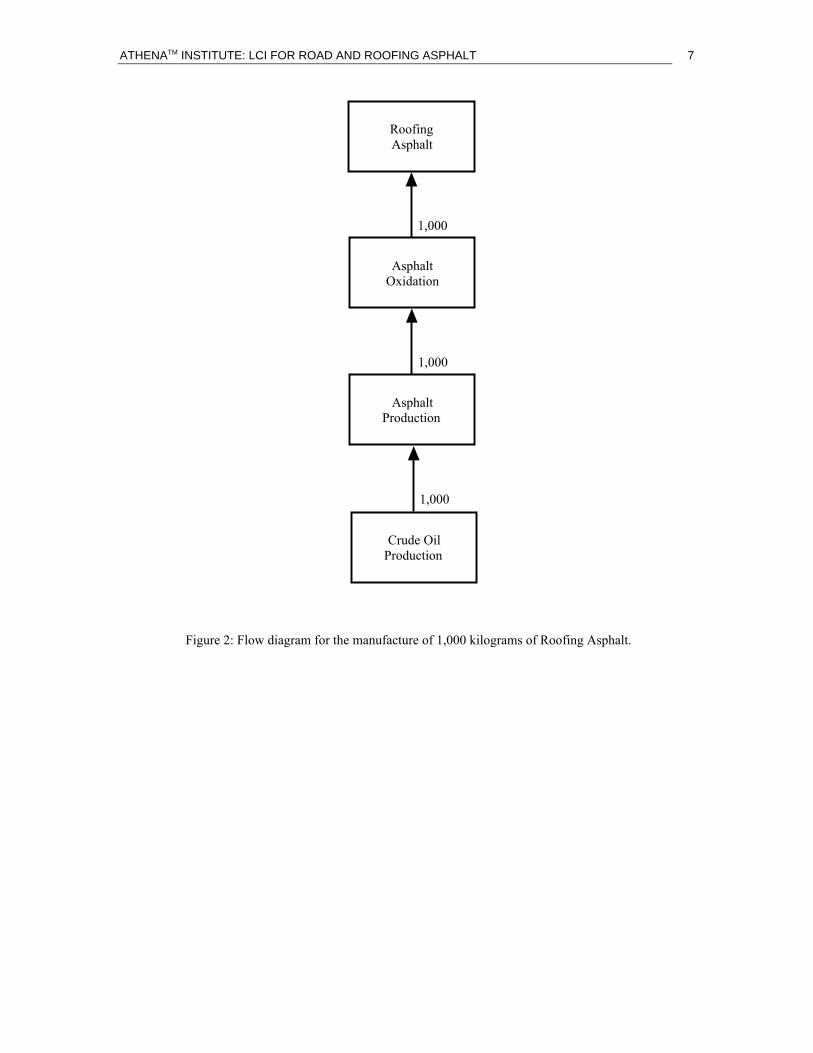
Roofing asphalt is the primary adhesion/waterproofing agent used between roofing pliesin built up roofing (BUR) applications. Roofing asphalt is oxidized by bubbling airthrough it, either at the refinery or at the roofing manufacturing plant.2 Oxidation stiffensthe asphalt, making it more resistant to flow in hot conditions. A flow diagram for theproduction of roofing asphalt is shown in Figure 2.
The asphalt arrives at the job site in solid form, and is then heated and applied as a liquid.Either multiple layers of roofing felts, or membranes and asphalt, may be applied.3
Surface coatings could include films, gravel, ceramic granules, or other materials. Thisanalysis does not include any felts, membranes, surface coatings, etc. Table 2 providesdata for the production of roofing asphalt, including all steps from crude oil extractionthrough production of oxidized roofing asphalt.
2 Information provided by Terrence O’Connor and Phil LaDuke of Firestone Building ProductsCompany. March, 2001.3 Asphalt Roofing Manufacturers Association website (www.asphaltroofing.org). March, 2001.
ATHENATM INSTITUTE: LCI FOR ROAD AND ROOFING ASPHALT 7
RoofingAsphalt
AsphaltOxidation
AsphaltProduction
Figure 2: Flow diagram for the manufacture of 1,000 kilograms of Roofing Asphalt.
1,000
1,000
Crude OilProduction
1,000
ATHENATM INSTITUTE: LCI FOR ROAD AND ROOFING ASPHALT 8
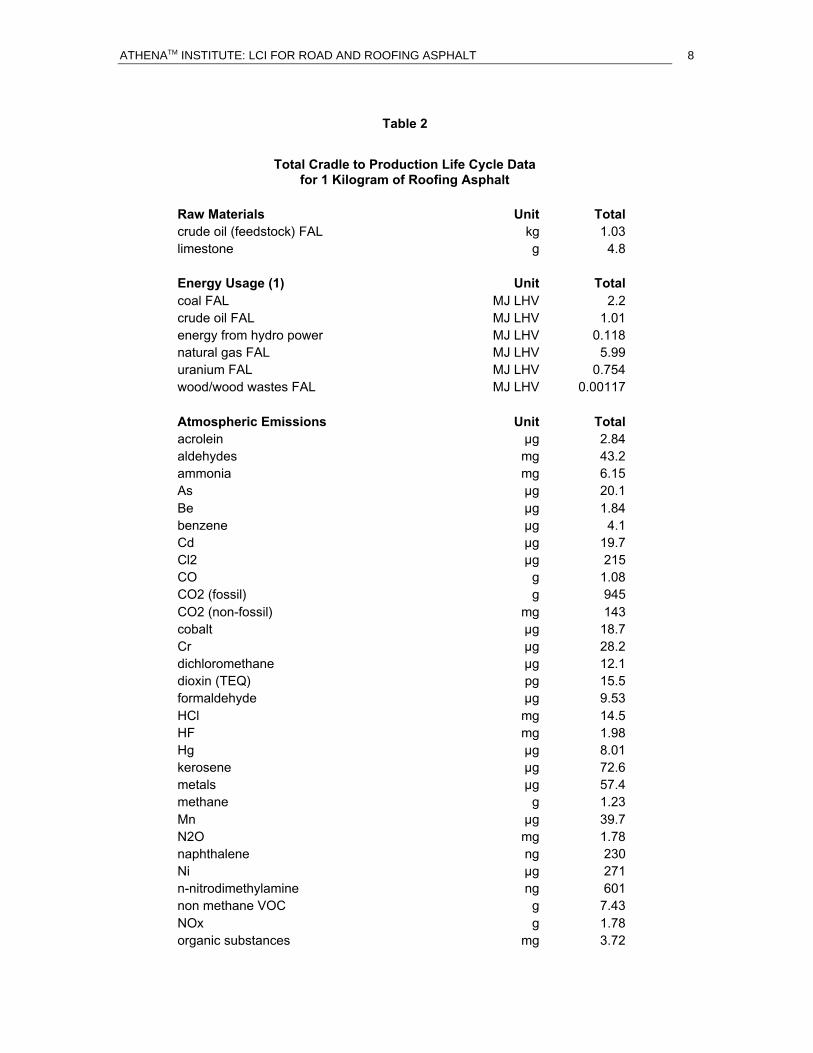
Table 2
Total Cradle to Production Life Cycle Datafor 1 Kilogram of Roofing Asphalt
Raw Materials Unit Totalcrude oil (feedstock) FAL kg 1.03limestone g 4.8
Energy Usage (1) Unit Totalcoal FAL MJ LHV 2.2crude oil FAL MJ LHV 1.01energy from hydro power MJ LHV 0.118natural gas FAL MJ LHV 5.99uranium FAL MJ LHV 0.754wood/wood wastes FAL MJ LHV 0.00117
Atmospheric Emissions Unit Totalacrolein µg 2.84aldehydes mg 43.2ammonia mg 6.15As µg 20.1Be µg 1.84benzene µg 4.1Cd µg 19.7Cl2 µg 215CO g 1.08CO2 (fossil) g 945CO2 (non-fossil) mg 143cobalt µg 18.7Cr µg 28.2dichloromethane µg 12.1dioxin (TEQ) pg 15.5formaldehyde µg 9.53HCl mg 14.5HF mg 1.98Hg µg 8.01kerosene µg 72.6metals µg 57.4methane g 1.23Mn µg 39.7N2O mg 1.78naphthalene ng 230Ni µg 271n-nitrodimethylamine ng 601non methane VOC g 7.43NOx g 1.78organic substances mg 3.72
ATHENATM INSTITUTE: LCI FOR ROAD AND ROOFING ASPHALT 9
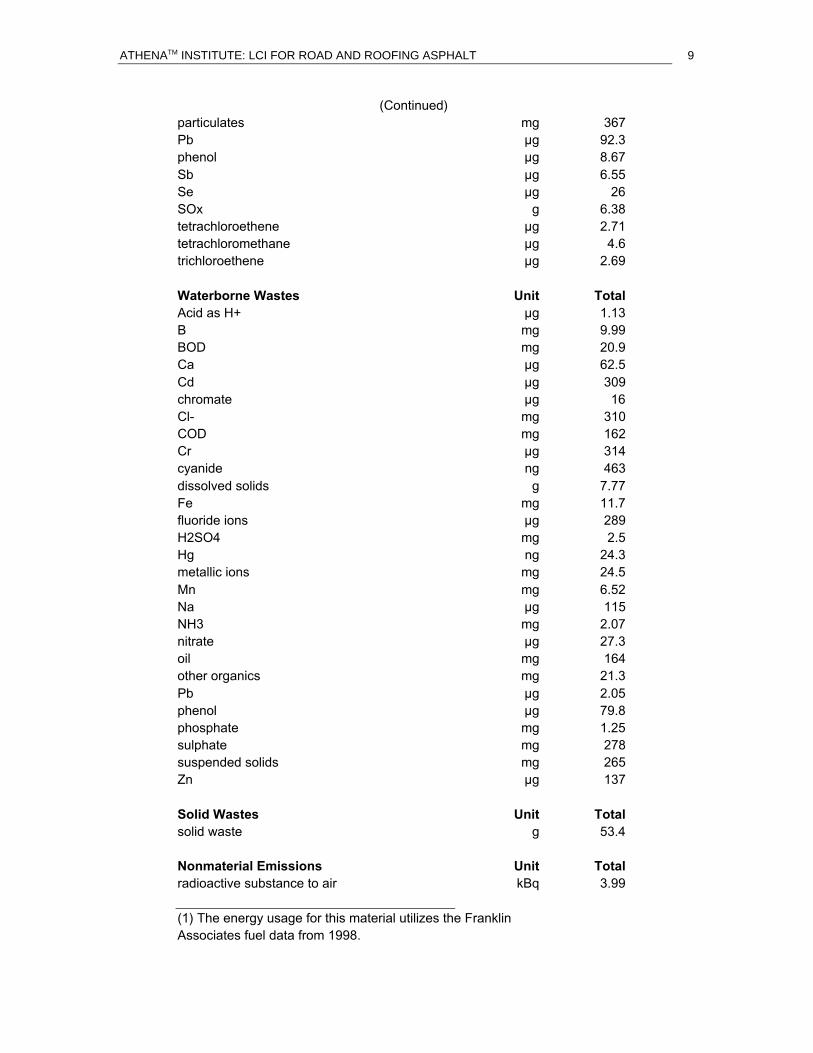
(Continued)particulates mg 367Pb µg 92.3phenol µg 8.67Sb µg 6.55Se µg 26SOx g 6.38tetrachloroethene µg 2.71tetrachloromethane µg 4.6trichloroethene µg 2.69
Waterborne Wastes Unit TotalAcid as H+ µg 1.13B mg 9.99BOD mg 20.9Ca µg 62.5Cd µg 309chromate µg 16Cl- mg 310COD mg 162Cr µg 314cyanide ng 463dissolved solids g 7.77Fe mg 11.7fluoride ions µg 289H2SO4 mg 2.5Hg ng 24.3metallic ions mg 24.5Mn mg 6.52Na µg 115NH3 mg 2.07nitrate µg 27.3oil mg 164other organics mg 21.3Pb µg 2.05phenol µg 79.8phosphate mg 1.25sulphate mg 278suspended solids mg 265Zn µg 137
Solid Wastes Unit Totalsolid waste g 53.4
Nonmaterial Emissions Unit Totalradioactive substance to air kBq 3.99 (1) The energy usage for this material utilizes the FranklinAssociates fuel data from 1998.
ATHENATM INSTITUTE: LCI FOR ROAD AND ROOFING ASPHALT 10
References
Road and Roofing Asphalt Data
U.S. Department of Energy. Industrial Energy Efficiency Improvement Program.Annual Report to the Congress and the President, 1972-1985.
Craft, B.C., W.R. Holden, and E.D. Graves, Jr. Well Design: Drilling and Production.Prentice-Hall, Inc. Englewood Cliffs, New Jersey. 1962.
“Oil and Gas Field Operations.” Census of Mineral Industries. SIC 1311. 1975.
Personal communication between Franklin Associates, Ltd. and G. Hancock, LadridoDrilling. Midland, Texas. February, 1989.
Personal communication between Franklin Associates, Ltd. and L. Gibson, U.S.Environmental Protection Agency, NPDES Permits Branch. Dallas, Texas.
Personal communication between Franklin Associates, Ltd. and the Texas RailroadCommission. January, 1989.
U.S. Department of Energy, Energy Information Administration. Annual EnergyOutlook, 1987 with Projections to 2000. March, 1988.
U.S. Department of Energy. 1987 Annual Environmental Monitoring Report for theStrategic Petroleum Reserve. Document # D506-01728-09. April, 1988.
U.S. Environmental Protection Agency. Screening Report, Crude Oil and Natural GasProduction Processes. EPA Report No. R2-73-285. December, 1982.
Energy and Materials Flows In Petroleum Refining, ANL/CNSV-10. ArgonneNational Laboratory. February, 1981.
Hydrocarbon Processing- Refining Handbook ‘92. Volume 71, Number 11.November, 1992.
1989 Industrial Process Heating Energy Analysis. Gas Research Institute. May, 1991.
Gary, James H. and Glenn E. Handwerk. Petroleum Refining - Technology andEconomics. Marcel Dekker, Inc. 1984.
Hydrocarbon Processing. Refining Handbook. November, 1992 and 1996.
ATHENATM INSTITUTE: LCI FOR ROAD AND ROOFING ASPHALT 11
Riegel’s Handbook of Industrial Chemistry. Ninth Edition. Edited by James A. Kent.Van Nostrand Reinhold. New York. 1992.
Manufacturing Energy Consumption Survey, Consumption of Energy 1988.DOE/EIA-0512(88). Energy Information Administration. May, 1991.
AMOCO/U.S. EPA Pollution Prevention Project, Yorktown Refinery, RefineryRelease Inventory. PB92-228550. United States Environmental Protection Agency.June, 1992.
Petroleum Industry Environmental Performance 1992. American Petroleum Institute(API) Washington, D.C. Pp. 10-12.
AIRS Facility Subsystem Source Classification Codes and Emission Factor Listingfor Criteria Air Pollutants. U.S. EPA. Office of Air Quality. PB90-207242. Pp. 136-137. March, 1990.
Environmental Consequences of, and Control Processes for Energy Technologies.Argonne National Laboratories. Noyes Data Corp. 1990.
Hydrocarbon Processing. Refining Handbook. November, 2000.
Franklin Associates’ estimate of the oxidation energy and the carbon dioxide emissionsfrom the oxidizer for roofing asphalt.
U.S. EPA. 1996 Needs Survey Report to Congress: Assessment of Needed PubliclyOwned Wastewater Treatment Facilities in the United States. 1997.
Personal conversations with Dr. Bruce E. Rittmann, Professor of EnvironmentalEngineering, University of Illinois at Urbana-Champaign. July, 1992.
Personal conversation between Franklin Associates, Ltd. and Don Brandel, JohnsonCounty, KS wastewater facility.
Appendix A
LCI DATA FOR PETROLEUMPRODUCTION AND REFINING,INCLUDING ASPHALT PRODUCTION
Prepared by:FRANKLIN ASSOCIATES
January, 1999
LCI DATA FOR PETROLEUM PRODUCTION AND REFINING,INCLUDING ASPHALT PRODUCTION
Introduction
The following data and documentation are being delivered in fulfillment of ouragreement with The Athena Institute to provide LCI data for asphalt production and forliquid fuel products of a petroleum refinery.
Beginning on page 13 are fourteen tables. Included are data tables and tablesshowing LCI results for petroleum production and refining into asphalt or general liquidrefinery products using U.S. transportation. A set of additional tables were prepared withCanadian transportation data, and a set of basic transportation factor tables are includedso that new transportation scenarios can be analyzed.
The petroleum production and refining are based upon typical practice in the U.S.,although transportation of oil to the refinery is based upon both average U.S. conditionsand a different set of transportation data reflecting conditions in Canada (with datasupplied by Jan Consultants). Because the results will be used primarily for Canadianapplications, there is a concern about the applicability of U.S. data. However, thetechnology used in the U.S. and in Canada is very similar. In fact, many of the samemulti-national companies own or control many facilities in both countries. Ourexperience has been that because of the similarity in technology, Canadian and U.S.operations are quite similar in natural resource consumption in the processes, and in totalenergy. It is interesting to observe that the European data gathered for the highlyregarded APME plastics industry database is quite consistent with the U.S. data forpetroleum production and refining presented here.
Because environmental laws and regulations are different in the U.S. and Canada,emissions may be more variable. Generally speaking, the LCI data quality and thesubsequent quality of LCI results are much higher for natural resource consumption andenergy use. Given a large number of facilities in a national population, the site-to-sitetotal range of variation between facilities producing the same product is generally withina range of a factor of two for these measures. However, the range of emissions data fromsite-to-site may vary by as much as a maximum of a factor of 10. While the variationsare typically less than this (especially for criteria pollutants which are strictly controlled),this means that the emissions data quality is quite low at best, and conclusions basedupon emissions data need to be made quite carefully. Because of this high level ofvariability between facilities and the generally low quality of LCI emissions data, thedifferences between U.S. and Canadian data are likely not greater than the variabilityalready present in the data.
Generally speaking, because of data quality issues, LCI results are most usefullyapplied when comparing products or processes using a uniform database for all elementsbeing compared. That is, if different products are to be compared, the same refining datashould be used consistently for all products. When deciding whether there are significantdifferences between products, the effects of data quality needs to be included.
Asphalt Production Methodology
Asphalt is a coproduct from petroleum refining, which produces a very largenumber of chemicals through a complex set of physical and chemical processes. In the
ATHENATM INSTITUTE: ROAD AND ROOFING ASPHALT – APPENDIX A 2
U.S., the dominant products of refineries are fuels, especially gasoline. In recent years,the category of “asphalt and roofing oils” has accounted for less than 3% annually of theoutput of petroleum refineries. The refining data reported here assumes that the crude oilstream is processed into asphalt by being passed through four subprocesses: desalting,atmospheric and vacuum distillation, and deasphalting of a vacuum distillation outputstream.
The methodology of using these four subprocesses to develop data is veryimportant to the issue of U.S. and Canadian data comparability. The crude oil input toCanadian and U.S. refineries may be quite different. Crude oil from different productionfields is chemically very different. Because of this, different refineries may have verydifferent overall energy requirements and emissions. For example, refining of a veryheavy crude oil may require more energy to be expended on cracking large molecules toachieve the smaller molecules desired for gasoline. Thus, that refinery may require moreenergy per barrel of output than a refinery receiving a lighter crude oil. However, if wefocus only on the asphalt product, the energy to produce a pound of product depends onthe energy to distill that particular fraction from the crude. While there will be someenergy differences for asphalt produced from different crude oils, focusing on theproduction of a fixed amount of asphalt using only the specific subprocesses minimizeserrors.
Franklin Associates first developed the production and basic refinery data in theearly 1970’s. Since that time, the data have undergone frequent updating and revision.Along the way, they have been peer-reviewed dozens of times by petroleum andpetrochemical experts. We have just recently (1997) undertaken another revision andupdating effort on these numbers. While some of the references are more than 10 yearsold, after our recent investigations, we have not found reason to change them. Productionand refining technology is not rapidly changing. In fact, in the U.S., new petroleumrefineries have not been initiated for some time. The numbers have been confirmedwithin the past five years on several occasions by petrochemical firms with extensiveexploration and refining operations. We have also compared our numbers to theEuropean Plastics Energy Database (Reference C-24). The petroleum production valuesare quite close, and the refinery values are also consistent with ours. We have alsocompared our data with U.S. Department of Energy calculations of petroleum productionand refining, and once again find that the values included here are quite consistent withthe DoE database (Reference C-27). However, the allocation to subprocesses is notpossible without expert input that is absent from published data.
Crude Oil Production
Oil is produced by drilling into porous rock structures generally located severalthousand feet underground. Once an oil deposit is located, numerous holes are drilledand lined with steel casing. Some oil is brought to the surface by natural pressure in therock structure, although most oil requires some energy to drive pumps that lift oil to thesurface. Once oil is on the surface, it is separated from water and stored in tanks to awaittransportation to a refinery. In some cases it is immediately transferred to a pipeline thattransports the oil to a larger terminal.
There are two primary sources of waste from crude oil production. The firstsource is the “oil field brine,” or water that is extracted with the oil. The brine goesthrough a separator at or near the well head in order to remove the oil from the water.These separators are very efficient and leave minimal oil in the water.
ATHENATM INSTITUTE: ROAD AND ROOFING ASPHALT – APPENDIX A 3
According to the American Petroleum Institute (API) it is estimated that 21 billionbarrels of brine water were produced from crude oil production in 1985 (Reference C-1).This quantity of water equates to a ratio of 5.4 barrels of water per barrel of oil. Themajority of this water (85 percent) is injected into separate wells specifically designed toaccept production-related waters. This represents all waters produced by onshore oilproduction facilities that are not permitted to discharge “oil field brine” to surface waters(Reference C-2). The remainder of the produced water is from offshore oil productionfacilities and is assumed to be discharged to the ocean. Therefore, the waterborne wastesrepresent the brine wastes present in this 15 percent of brine water (Reference C-3).
The second source of waste is the gas produced from oil wells. While most of thisis recovered for sale, some is not. Atmospheric emissions from crude oil production areprimarily hydrocarbons, which are predominately methane, but with dozens of otheridentified chemical species (Reference C-25). They are attributed to the natural gasproduced from combination wells and relate to line or transmission losses and unflaredventing.
The transportation data assume a mix of foreign and domestically produced crudeoil. According to the Petroleum Supply Annual, June 1994, 49 percent of the crude oilused in the United States is imported.
The energy requirements and environmental emissions for the production of 1,000pounds of crude oil are given in Table C-1.
Desalting, Distillation, and Deasphalting
A petroleum refinery is a complex combination of processes that serve to separateand physically and chemically transform the mixture of hydrocarbons found in crude oilinto a large number of products. Modern refineries are able to vary the differentprocessing steps through which a charge of crude oil passes in order to maximize theoutput of higher value products. This variation of processing steps can change accordingto the make-up of the crude oil as well as the economic value of the products. Because ofthis variation, it is necessary to identify the specific subsystems within a refinery that areused to produce a specific product.
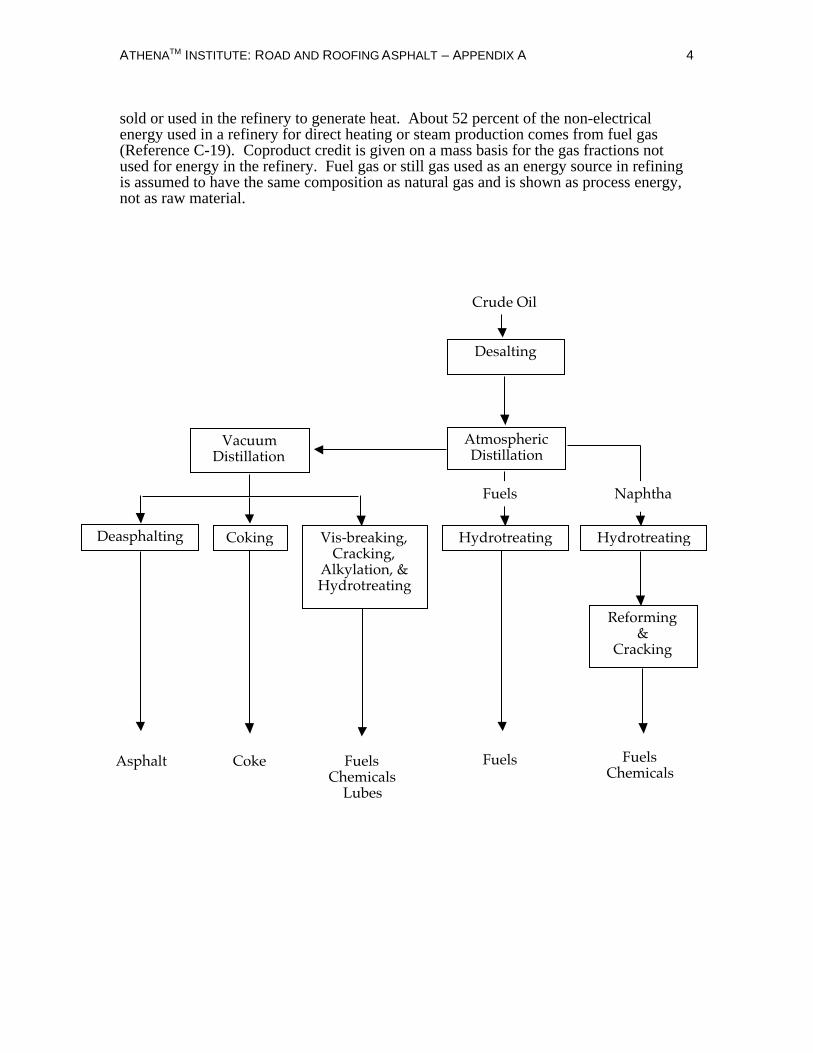
For this analysis, it is assumed that crude oil used to produce asphalt goes throughthe following refinery operations: desalting, atmospheric and vacuum distillation, anddeasphalting. Due to a lack of facility-specific data, literature sources were used toestimate the energy requirements for these refining steps. A number of literaturereferences were used, most of which showed similar energy inputs (References C-13through C-17). A greatly simplified flow diagram for a refinery is shown in the figure.
Crude oil desalting is the water washing of crude oil to remove water-solubleminerals and entrained solids (Reference C-18). For this analysis it is assumed that all ofthe crude that enters a refinery passes through the desalting step (References C-16 and C-18).
Crude oil atmospheric distillation separates the desalted crude oil into fractionswith differing boiling ranges. Atmospheric distillation is used to separate the fractionswith a boiling point less than 650° F (References C-16, C-17, and C-18). Attemperatures greater than 650° F thermal cracking of the hydrocarbons starts. Fuel gas orstill gas that is liberated from the crude during distillation is further processed intoliquefied petroleum gas or natural gas, depending on the carbon chain length. This gas is
ATHENATM INSTITUTE: ROAD AND ROOFING ASPHALT – APPENDIX A 4
sold or used in the refinery to generate heat. About 52 percent of the non-electricalenergy used in a refinery for direct heating or steam production comes from fuel gas(Reference C-19). Coproduct credit is given on a mass basis for the gas fractions notused for energy in the refinery. Fuel gas or still gas used as an energy source in refiningis assumed to have the same composition as natural gas and is shown as process energy,not as raw material.
Crude Oil
AtmosphericDistillation
VacuumDistillation
Reforming&
Cracking
Deasphalting Coking Vis-breaking,Cracking,
Alkylation, &Hydrotreating
Hydrotreating Hydrotreating
Desalting
Asphalt Coke FuelsChemicals
Lubes
Fuels FuelsChemicals
Fuels Naphtha

ATHENATM INSTITUTE: ROAD AND ROOFING ASPHALT – APPENDIX A 5
The higher boiling point residues from the atmospheric distillation unit passes to avacuum distillation unit where separation of the various fractions can be accomplished atlower temperatures than would be required at atmospheric pressure. The residue orbottoms of the vacuum distillation unit is a valuable coproduct that is further processed tomake usable products. Coproduct credit is given on a weight basis for this residue. It isassumed that all of the crude passes through atmospheric distillation, while only 46percent of the initial crude oil charge passes through vacuum distillation (References C-13, C-14, and C-18).
Deasphalting is accomplished by extracting the vacuum residue with liquidhydrocarbon solvent. Asphalt is steam stripped from the solvent, and the solvent isrecovered for reuse (Reference C- 17).
Energy requirements for petroleum refineries are usually listed in literaturesources as Btu of fuel, pounds of steam, and electricity per 42-gallon barrel of crudeprocessed. For this analysis, a conversion of 3.385 barrels of crude per 1,000 pounds wasused. Steam inputs were converted to Btu requirements using a conversion of 1,200 Btuper pound. Btu inputs for steam were added to the Btu inputs listed as fuels, and the totalwas converted to quantities of fuels using the combustion energy values and thefollowing refinery fuel mix: residual oil and residues (coke), 22 percent; purchasednatural gas, 24 percent; LPG, 2 percent; and fuel gas or still gas, 52 percent (ReferenceC-20). Negligible quantities of coal and distillate oil are also used in the “average”refinery.
The energy requirements and environmental emissions for desalting, distilling,and deasphalting 1,000 pounds of crude oil are presented in Table C-2. Still gasproduced in the refinery is combined with purchased natural gas in the table. Rawmaterial inputs are calculated from the average loss due to atmospheric, waterborne, andsolid waste emissions per 1,000 pounds of crude processed in a one-year period(Reference C-20). The data in Table C-2 are assumed to be representative of petroleumrefineries in 1992.
No data were available that allow the determination of emissions to water, air andland for specific sub-processes within the refinery. The emission data were obtainedfrom total refinery operations, allocating emissions to each product based upon therelative mass of the various products. Table numbers correspond to Franklin spreadsheetnumbers and are used here to facilitate cross-referencing by the research team.
Results and Use of the Tables
The following tables are included. They are grouped together at the end of thisreport, following the references.• Table C-1 Data for production of crude oil• Table C-2 Data for the processing of crude oil into asphalt• Table C-3 LCI results for the production of crude oil (derived from Table C-1)• Table C-4 LCI results for the processing of crude oil into asphalt (derived from Table
C-2)• Table C-5 LCI results for cradle-to-grave production of asphalt (combination of
Tables C-3 and C-4)• Table C-6 Data for production of average refinery products
ATHENATM INSTITUTE: ROAD AND ROOFING ASPHALT – APPENDIX A 6
• Table C-7 LCI results for cradle-to-grave production of average refinery products(combination of Tables C-3 and C-6)
• Table C-8 Revision of Table C-3 using Canadian transportation• Table C-9 Revision of Table C-5 using Canadian transportation• Table C-10 Revision of Table C-7 using Canadian transportation• Table A-5 Transportation energy requirements• Table A-7N Electricity factors• Tables A-28a and 28b Environmental emissions for tractor-trailer trucks• Table A-32 Environmental emissions for ocean freighters
Tables C-1, C-2 and C-6 were prepared to show actual data in physical units.Tables C-3, C-4, C-5 and C-7 were prepared to show the LCI results of combining thedata from the data tables with fuel combustion and electricity generation emissionsfactors.
Table C-1 will be used as an example of the data tables. The first entry is thenatural resource requirement entry, showing that to deliver 1,000 pounds of crude oil to arefinery, 1,035 lb of oil is extracted from the ground. This means that 35 lb of oil is lostfrom the system as leaks, minor spills or evaporative or waterborne losses.
The next set of entries is for the process energy. The entry of 15.2 kWh ofelectricity, 542 cu ft of natural gas, etc., are the process energy requirements to producethe 1,000 lb of crude oil. These values are direct process requirements, and do not include“precombustion” energy, such as that required to produce and process the natural gas foruse. Following this are the transportation data, listed both as the ton-miles by mode, andthe fuels required. The environmental emissions listed in this table are direct processemissions only, and do not include emissions from fuel combustion.
Table C-2 is the data table for converting crude oil into asphalt in a petroleumrefinery. The format is the same as for Table C-1. The raw material requirement is 1,005lb of crude oil to produce 1,000 lb of asphalt. This means that the particular set ofsubprocesses discussed above result in the loss of 0.5% of the molecules that would haveended up in the asphalt. The methodology used is to take total refinery output andallocate the input to each product. For example, suppose a refinery produces 20,000 lb ofproducts over some period of time. Most of this, perhaps 15,000 lb ends up as fuels (oiland gasoline), 1,000 lb as asphalt 4,000 lb as other products. In our methodology, thiswould require 20,100 lb of crude oil (20,000 X1.005=20,100), or 15,075 lb for the fuels,1,005 lb for asphalt and 4,020 lb for the remaining products. However, because we areonly interested in the asphalt in table C-2, we show 1,005 lb as the crude oil allocated tothe product of interest. As in the case of Table C-1, this table contains the direct processdata only. No transportation of the finished product is included.
Table C-3 is an LCI results table. It is linked to the data on Table C-1. The fuelsdata on Table C-1 have been processed using a comprehensive U.S. average fuels andelectricity database to calculate the energy and emissions for the production of crude oil.The combustion energy section in C-3 shows the process energy in physical units andalso in million Btu. The next section shows the precombustion energy. It includes thefuels used in the “upstream” energy processes necessary to produce, process andtransport fuels. The table also lists the transportation energy, the precombustiontransportation energy, as well as the emissions to land, water and air.
Table C-4 is a similar to C-3. It reports the transformation of the data on Table C-2 into the LCI results.
ATHENATM INSTITUTE: ROAD AND ROOFING ASPHALT – APPENDIX A 7
Table C-5 is total system LCI results including both the crude oil production andthe refining into asphalt. It is a combination of C-3 and C-4. Because the refineryrequires 1,005 lb of crude oil, the results of Table C-3 are multiplied by 1.005, and addedto the values on Table C-4. For example, the electricity on C-3 is 15.2 kWh. Thismultiplied by 1.005 is 15.3 kWh. Adding to this the 13.3 on Table C-4 gives us the 28.6kWh on Table C-5.
Table C-6 was added to generalize the refinery results. It provides data for therefinery processes of desalting, atmospheric and vacuum distillation and hydrotreating.This more nearly reflects typical refinery products of the U.S., and this process is suitablefor use for petrochemical feedstocks and for fuels. While the fuels require cracking ofsome portion of the crude, and hydrotreating of a different portion, the error incurred byassuming that all of the crude that ends up as fuels is hydrotreated is small.
Table C-7 is the transformation of Table C-6 and Table C-3 into a total systemgeneric refinery product. Comparing Tables C-7 and C-5 for asphalt production, wenotice that asphalt requires more energy than average refinery products. This is causedby the energy intensity of extracting the high boiling point components of asphalt fromthe mixture of hydrocarbons.
Because transportation of crude oil in Canada is very different than for the U.S.,Tables C-8, C-9 and C-10 were prepared as revisions of Tables C-3, C-5 and C-7 bysubstituting a set of Canadian transportation data for the U.S. transportation data. Thedata submitted was 201,000 cu m/day by pipeline an average distance of 1,500 km,90,000 cu m/day of crude shipped by ocean tanker a distance of 4,000 miles. For 1,000lb of crude, this translates into 322 ton-miles by pipeline and 620 ton-miles by oceantanker.
In order to use other transportation scenarios, a set of Franklin AssociatesAppendix tables are included. Table A-5 gives our ton-mile factors by mode. It is used tocalculate the fuels required and the energy values. Tables A-7N, A-28a, A-28b and A-32are used to find the emissions from use of electricity and fuels for transportation modes.
ATHENATM INSTITUTE: ROAD AND ROOFING ASPHALT – APPENDIX A 8
REFERENCES
C-1 Oil and Gas Industry Exploration and Production Wastes. Prepared by ERT forAmerican Petroleum Institute. Document #471-01-09. July, 1987.
C-2 Personal communication between Franklin Associates, Ltd. and L. Gibson. U.S.Environmental Production Agency. NPDES Permits Branch. Dallas, Texas.
C-3 Energy Information Administration. Petroleum Supply Annual 1993. Volume 1. June,1994.
C-4 U.S. Department of Energy. Industrial Energy Efficiency Improvement Program. AnnualReport to the Congress and the President, 1972-1985.
C-5 Craft, B.C., W.R. Holden, and E.D. Graves, Jr. Well Design: Drilling and Production.Prentice-Hall, Inc. Englewood Cliffs, New Jersey. 1962.
C-6 “Oil and Gas Field Operations.” Census of Mineral Industries. SIC 1311. 1975.
C-7 Personal communication between Franklin Associates, Ltd. and G. Hancock, LadridoDrilling. Midland, Texas. February 1989.
C-8 Personal communication between Franklin Associates, Ltd. and L. Gobson. U.S.Environmental Protection Agency, NPDES Permits Branch. Dallas, Texas.
C-9 Personal communication between Franklin Associates, Ltd. and the Texas RailroadCommission. January 1989.
C-10 U.S. Department of Energy, Energy Information Administration. Annual EnergyOutlook, 1987 with Projections to 2000. March 1988.
C-11 U.S. Department of Energy. 1987 Annual Environmental Monitoring Report for theStrategic Petroleum Reserve. Document # D506-01728-09. April 1988.
C-12 U.S. Environmental Protection Agency. Screening Report, Crude Oil and Natural GasProduction Processes. EPA Report No. R2-73-285. December 1982.
C-13 Energy and Materials Flows In Petroleum Refining, ANL/CNSV-10. Argonne NationalLaboratory. February 1981.
C-14 Hydrocarbon Processing- Refining Handbook ‘92. November, 1992. Volume 71. Number11.
C-15 1989 Industrial Process Heating Energy Analysis. Gas Research Institute. May, 1991.
C-16 Gary, James H. and Glenn E. Handwerk. Petroleum Refining- Technology andEconomics. Marcel Dekker, Inc. 1984.
C-17 Hydrocarbon Processing. Refining Handbook. November 1992 and 1996.
C-18 Riegel’s Handbook of Industrial Chemistry. Ninth Edition. Edited by James A. Kent. VanNostrand Reinhold. New York. 1992.
ATHENATM INSTITUTE: ROAD AND ROOFING ASPHALT – APPENDIX A 9
C-19 Manufacturing Energy Consumption Survey, Consumption of Energy 1988. DOE/EIA-0512(88). Energy Information Administration. May, 1991.
C-20 AMOCO/U.S. EPA Pollution Prevention Project, Yorktown Refinery, Refinery ReleaseInventory. PB92-228550. United States Environmental Protection Agency. June, 1992.
C-21 Petroleum Industry Environmental Performance 1992. American Petroleum Institute(API) Washington, D.C. pp. 10-12.
C-22 AIRS Facility Subsystem Source Classification Codes and Emission Factor Listing forCriteria Air Pollutants. U.S. EPA. Office of Air Quality. PB90-207242. March, 1990. pp.136-137.
C-23 Environmental Consequences of, and Control Processes for Energy Technologies.Argonne National Laboratories. Noyes Data Corp. 1990.
C-24 Eco-profiles of the European Plastics Industry, Report 2: Olefin Feedstock Sources, TheEuropean Centre for Plastics in the Environment, Brussels, 1993
C-25 Air Emissions Species Manual, Vol. 1, Volatile Organic Compound Species Profiles, 2nded., (PB90-185844), Environmental Protection Agency, January 1990.
C-26 Energy Workbook for Fugitive Fuel Emissions, National Greenhouse Gas InventoryCommittee, Workbook 2.1 1996, Australia Deparment of the Environment, Sport andTerritories.
C-27 Fuel Cycle Evaluations of Biomass Ethanol and Reformulated Gasoline, Report No.NREL/TP-463-4950, Appendix F: Benchmark Reformulated Gasoline Fuel Cycle,National Renewable Energy Laboratory, Golden, CO. November 1993.
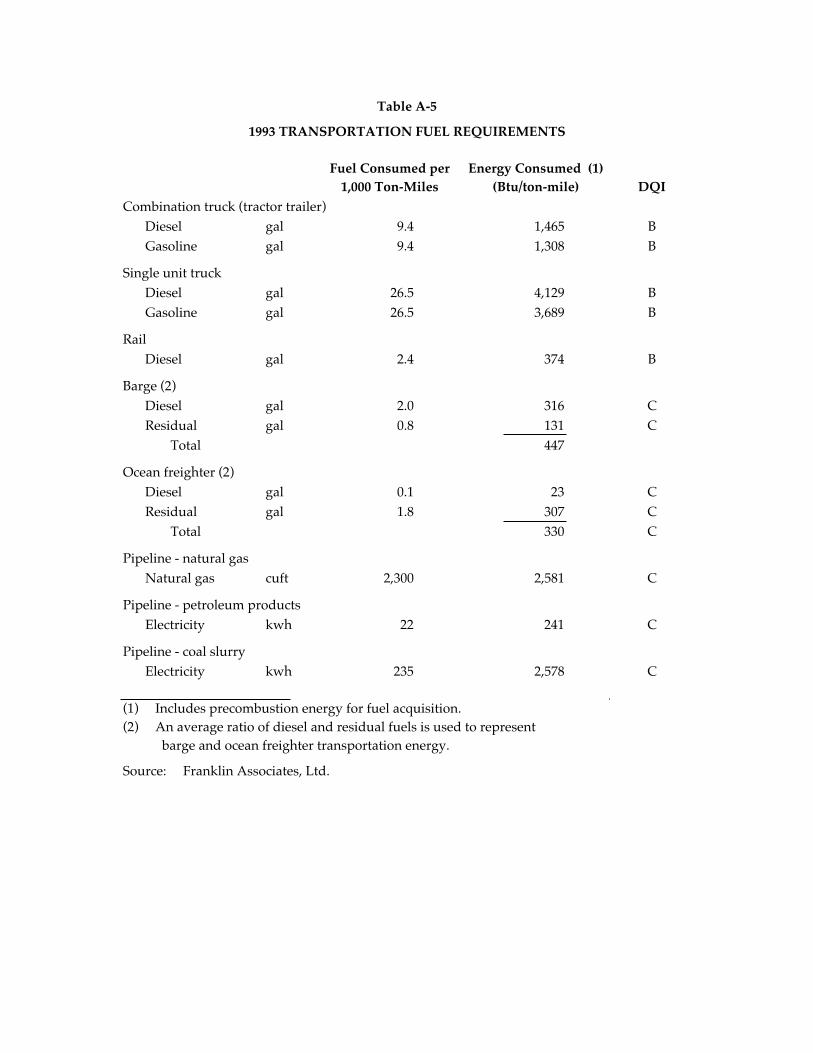
Table A-5
1993 TRANSPORTATION FUEL REQUIREMENTS
Fuel Consumed per Energy Consumed (1)1,000 Ton-Miles (Btu/ton-mile) DQI
Combination truck (tractor trailer)Diesel gal 9.4 1,465 BGasoline gal 9.4 1,308 B
Single unit truckDiesel gal 26.5 4,129 BGasoline gal 26.5 3,689 B
RailDiesel gal 2.4 374 B
Barge (2)Diesel gal 2.0 316 CResidual gal 0.8 131 C
Total 447
Ocean freighter (2)Diesel gal 0.1 23 CResidual gal 1.8 307 C
Total 330 C
Pipeline - natural gasNatural gas cuft 2,300 2,581 C
Pipeline - petroleum productsElectricity kwh 22 241 C
Pipeline - coal slurryElectricity kwh 235 2,578 C
(1) Includes precombustion energy for fuel acquisition.(2) An average ratio of diesel and residual fuels is used to represent
barge and ocean freighter transportation energy.
Source: Franklin Associates, Ltd.
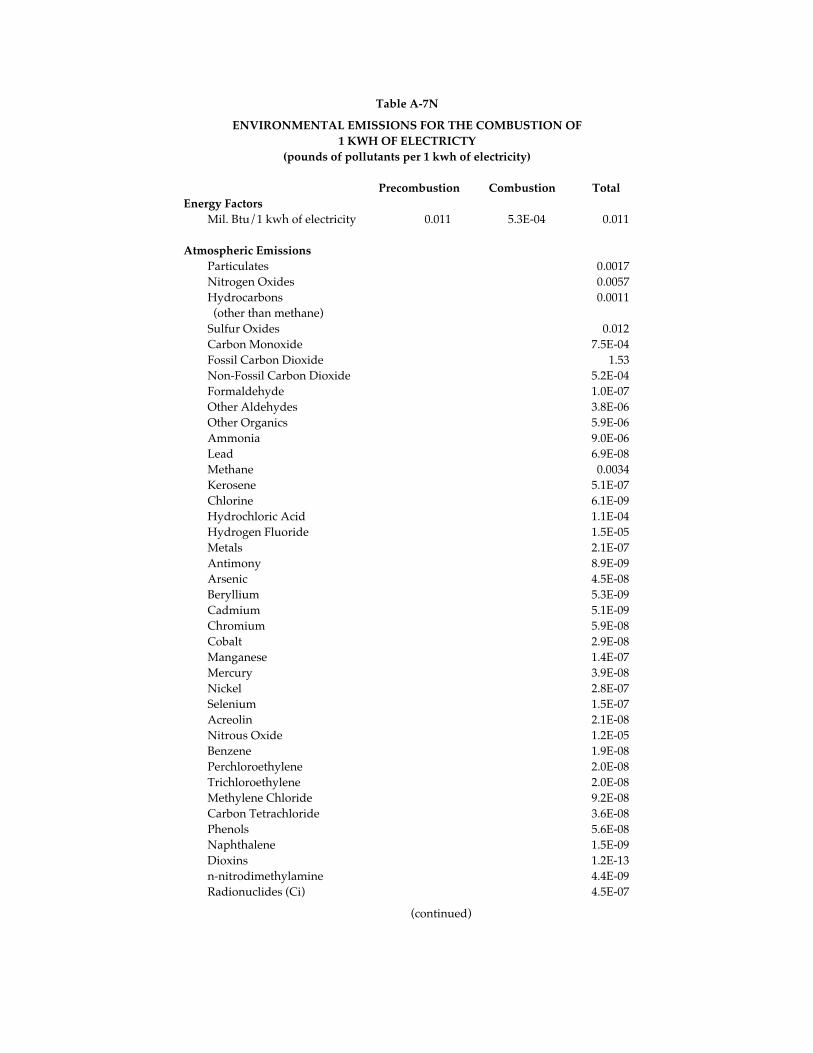
Table A-7N
ENVIRONMENTAL EMISSIONS FOR THE COMBUSTION OF1 KWH OF ELECTRICTY
(pounds of pollutants per 1 kwh of electricity)
Precombustion Combustion TotalEnergy Factors
Mil. Btu/1 kwh of electricity 0.011 5.3E-04 0.011
Atmospheric EmissionsParticulates 0.0017Nitrogen Oxides 0.0057Hydrocarbons 0.0011 (other than methane)Sulfur Oxides 0.012Carbon Monoxide 7.5E-04Fossil Carbon Dioxide 1.53Non-Fossil Carbon Dioxide 5.2E-04Formaldehyde 1.0E-07Other Aldehydes 3.8E-06Other Organics 5.9E-06Ammonia 9.0E-06Lead 6.9E-08Methane 0.0034Kerosene 5.1E-07Chlorine 6.1E-09Hydrochloric Acid 1.1E-04Hydrogen Fluoride 1.5E-05Metals 2.1E-07Antimony 8.9E-09Arsenic 4.5E-08Beryllium 5.3E-09Cadmium 5.1E-09Chromium 5.9E-08Cobalt 2.9E-08Manganese 1.4E-07Mercury 3.9E-08Nickel 2.8E-07Selenium 1.5E-07Acreolin 2.1E-08Nitrous Oxide 1.2E-05Benzene 1.9E-08Perchloroethylene 2.0E-08Trichloroethylene 2.0E-08Methylene Chloride 9.2E-08Carbon Tetrachloride 3.6E-08Phenols 5.6E-08Naphthalene 1.5E-09Dioxins 1.2E-13n-nitrodimethylamine 4.4E-09Radionuclides (Ci) 4.5E-07
(continued)
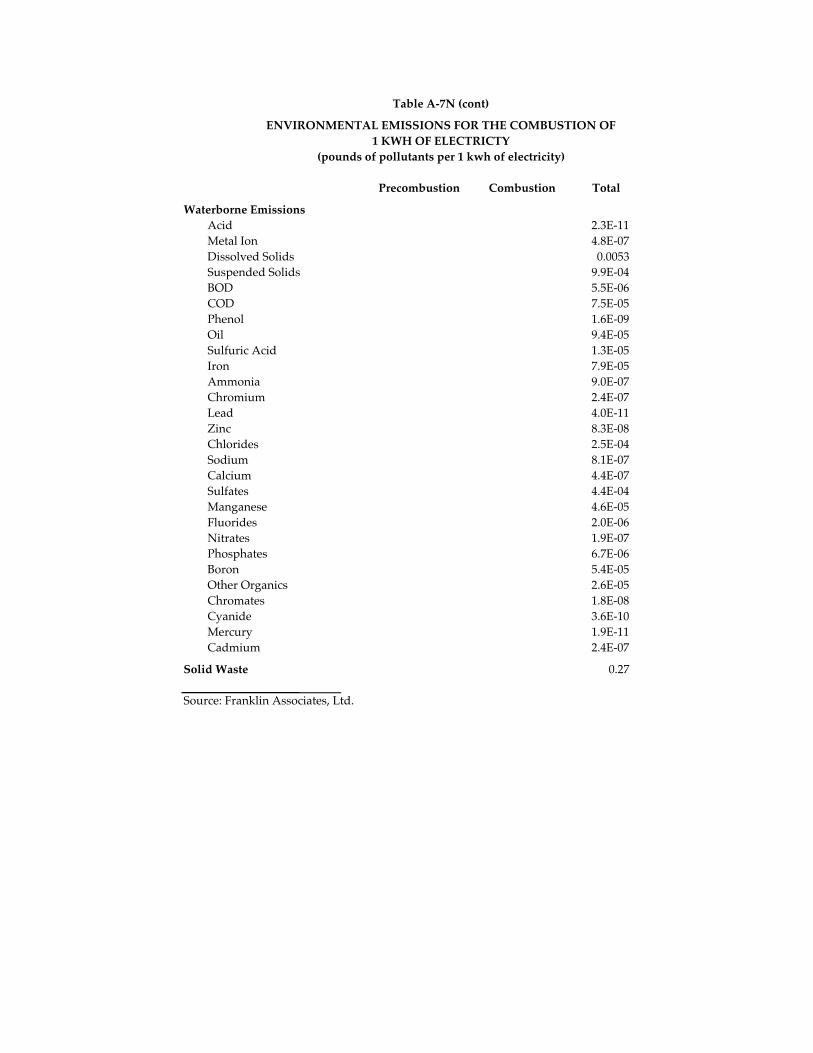
Table A-7N (cont)
ENVIRONMENTAL EMISSIONS FOR THE COMBUSTION OF1 KWH OF ELECTRICTY
(pounds of pollutants per 1 kwh of electricity)
Precombustion Combustion Total
Waterborne EmissionsAcid 2.3E-11Metal Ion 4.8E-07Dissolved Solids 0.0053Suspended Solids 9.9E-04BOD 5.5E-06COD 7.5E-05Phenol 1.6E-09Oil 9.4E-05Sulfuric Acid 1.3E-05Iron 7.9E-05Ammonia 9.0E-07Chromium 2.4E-07Lead 4.0E-11Zinc 8.3E-08Chlorides 2.5E-04Sodium 8.1E-07Calcium 4.4E-07Sulfates 4.4E-04Manganese 4.6E-05Fluorides 2.0E-06Nitrates 1.9E-07Phosphates 6.7E-06Boron 5.4E-05Other Organics 2.6E-05Chromates 1.8E-08Cyanide 3.6E-10Mercury 1.9E-11Cadmium 2.4E-07
Solid Waste 0.27
Source: Franklin Associates, Ltd.
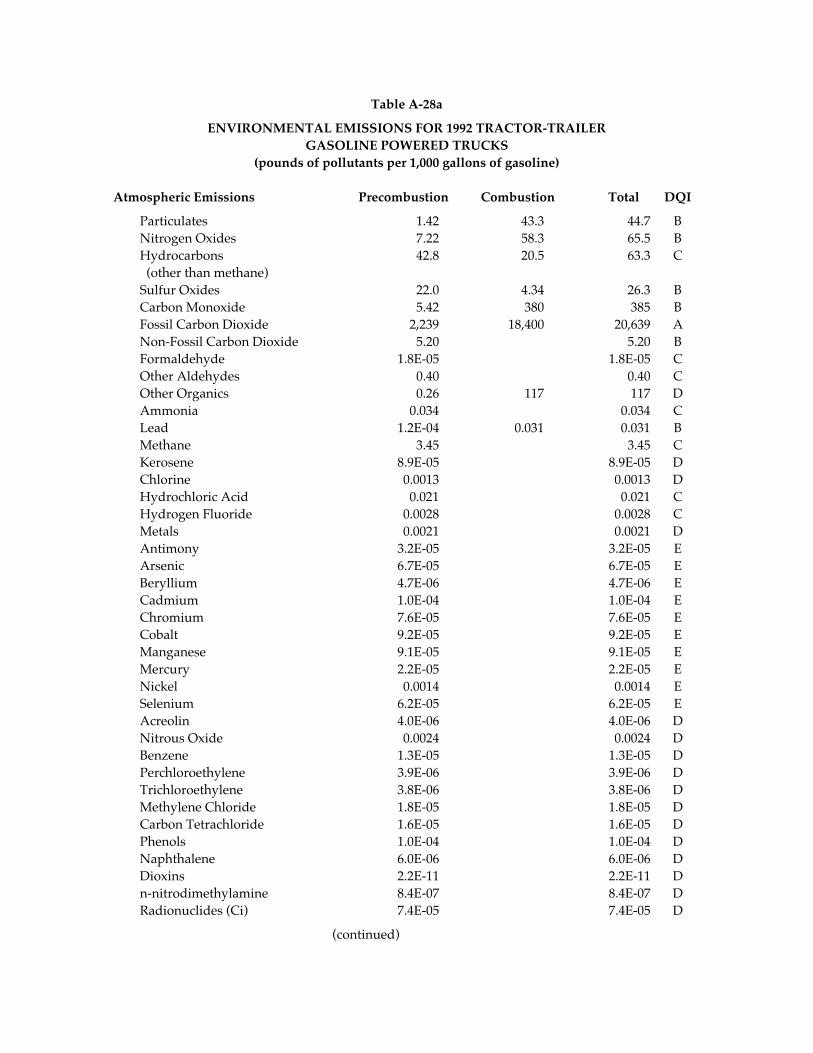
Table A-28a
ENVIRONMENTAL EMISSIONS FOR 1992 TRACTOR-TRAILERGASOLINE POWERED TRUCKS
(pounds of pollutants per 1,000 gallons of gasoline)
Atmospheric Emissions Precombustion Combustion Total DQI
Particulates 1.42 43.3 44.7 BNitrogen Oxides 7.22 58.3 65.5 BHydrocarbons 42.8 20.5 63.3 C (other than methane)Sulfur Oxides 22.0 4.34 26.3 BCarbon Monoxide 5.42 380 385 BFossil Carbon Dioxide 2,239 18,400 20,639 ANon-Fossil Carbon Dioxide 5.20 5.20 BFormaldehyde 1.8E-05 1.8E-05 COther Aldehydes 0.40 0.40 COther Organics 0.26 117 117 DAmmonia 0.034 0.034 CLead 1.2E-04 0.031 0.031 BMethane 3.45 3.45 CKerosene 8.9E-05 8.9E-05 DChlorine 0.0013 0.0013 DHydrochloric Acid 0.021 0.021 CHydrogen Fluoride 0.0028 0.0028 CMetals 0.0021 0.0021 DAntimony 3.2E-05 3.2E-05 EArsenic 6.7E-05 6.7E-05 EBeryllium 4.7E-06 4.7E-06 ECadmium 1.0E-04 1.0E-04 EChromium 7.6E-05 7.6E-05 ECobalt 9.2E-05 9.2E-05 EManganese 9.1E-05 9.1E-05 EMercury 2.2E-05 2.2E-05 ENickel 0.0014 0.0014 ESelenium 6.2E-05 6.2E-05 EAcreolin 4.0E-06 4.0E-06 DNitrous Oxide 0.0024 0.0024 DBenzene 1.3E-05 1.3E-05 DPerchloroethylene 3.9E-06 3.9E-06 DTrichloroethylene 3.8E-06 3.8E-06 DMethylene Chloride 1.8E-05 1.8E-05 DCarbon Tetrachloride 1.6E-05 1.6E-05 DPhenols 1.0E-04 1.0E-04 DNaphthalene 6.0E-06 6.0E-06 DDioxins 2.2E-11 2.2E-11 Dn-nitrodimethylamine 8.4E-07 8.4E-07 DRadionuclides (Ci) 7.4E-05 7.4E-05 D
(continued)
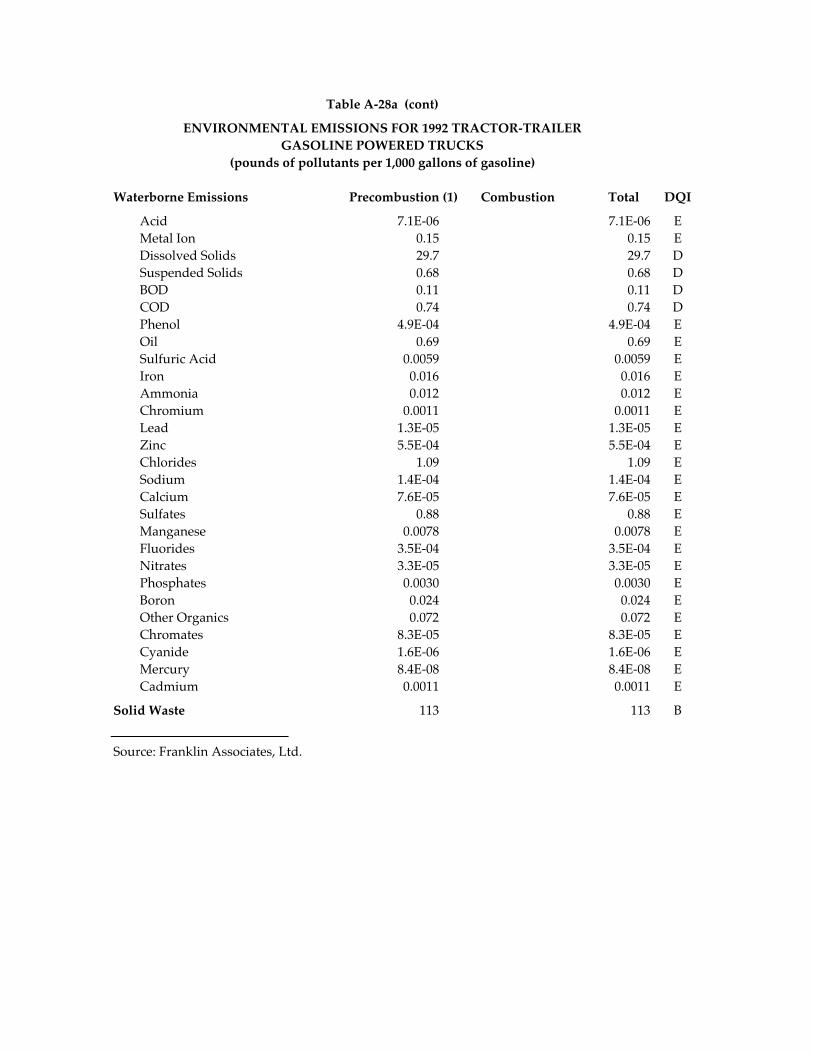
Table A-28a (cont)
ENVIRONMENTAL EMISSIONS FOR 1992 TRACTOR-TRAILERGASOLINE POWERED TRUCKS
(pounds of pollutants per 1,000 gallons of gasoline)
Waterborne Emissions Precombustion (1) Combustion Total DQI
Acid 7.1E-06 7.1E-06 EMetal Ion 0.15 0.15 EDissolved Solids 29.7 29.7 DSuspended Solids 0.68 0.68 DBOD 0.11 0.11 DCOD 0.74 0.74 DPhenol 4.9E-04 4.9E-04 EOil 0.69 0.69 ESulfuric Acid 0.0059 0.0059 EIron 0.016 0.016 EAmmonia 0.012 0.012 EChromium 0.0011 0.0011 ELead 1.3E-05 1.3E-05 EZinc 5.5E-04 5.5E-04 EChlorides 1.09 1.09 ESodium 1.4E-04 1.4E-04 ECalcium 7.6E-05 7.6E-05 ESulfates 0.88 0.88 EManganese 0.0078 0.0078 EFluorides 3.5E-04 3.5E-04 ENitrates 3.3E-05 3.3E-05 EPhosphates 0.0030 0.0030 EBoron 0.024 0.024 EOther Organics 0.072 0.072 EChromates 8.3E-05 8.3E-05 ECyanide 1.6E-06 1.6E-06 EMercury 8.4E-08 8.4E-08 ECadmium 0.0011 0.0011 E
Solid Waste 113 113 B
Source: Franklin Associates, Ltd.
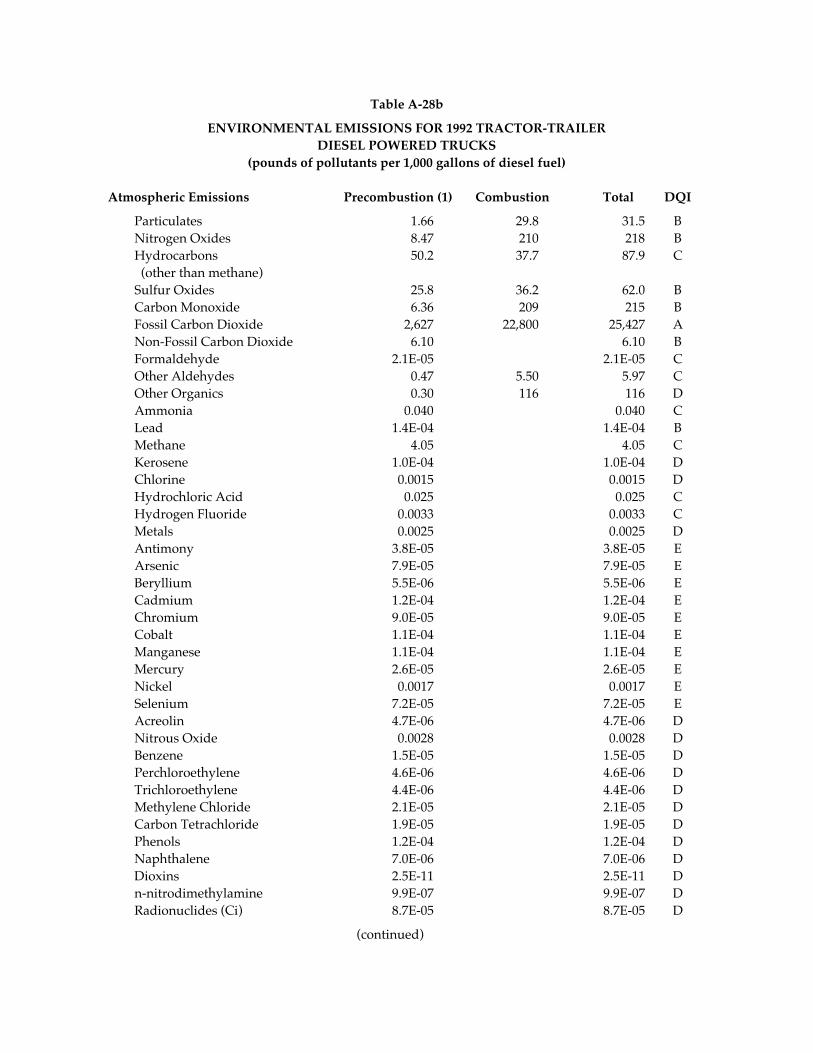
Table A-28b
ENVIRONMENTAL EMISSIONS FOR 1992 TRACTOR-TRAILERDIESEL POWERED TRUCKS
(pounds of pollutants per 1,000 gallons of diesel fuel)
Atmospheric Emissions Precombustion (1) Combustion Total DQI
Particulates 1.66 29.8 31.5 BNitrogen Oxides 8.47 210 218 BHydrocarbons 50.2 37.7 87.9 C (other than methane)Sulfur Oxides 25.8 36.2 62.0 BCarbon Monoxide 6.36 209 215 BFossil Carbon Dioxide 2,627 22,800 25,427 ANon-Fossil Carbon Dioxide 6.10 6.10 BFormaldehyde 2.1E-05 2.1E-05 COther Aldehydes 0.47 5.50 5.97 COther Organics 0.30 116 116 DAmmonia 0.040 0.040 CLead 1.4E-04 1.4E-04 BMethane 4.05 4.05 CKerosene 1.0E-04 1.0E-04 DChlorine 0.0015 0.0015 DHydrochloric Acid 0.025 0.025 CHydrogen Fluoride 0.0033 0.0033 CMetals 0.0025 0.0025 DAntimony 3.8E-05 3.8E-05 EArsenic 7.9E-05 7.9E-05 EBeryllium 5.5E-06 5.5E-06 ECadmium 1.2E-04 1.2E-04 EChromium 9.0E-05 9.0E-05 ECobalt 1.1E-04 1.1E-04 EManganese 1.1E-04 1.1E-04 EMercury 2.6E-05 2.6E-05 ENickel 0.0017 0.0017 ESelenium 7.2E-05 7.2E-05 EAcreolin 4.7E-06 4.7E-06 DNitrous Oxide 0.0028 0.0028 DBenzene 1.5E-05 1.5E-05 DPerchloroethylene 4.6E-06 4.6E-06 DTrichloroethylene 4.4E-06 4.4E-06 DMethylene Chloride 2.1E-05 2.1E-05 DCarbon Tetrachloride 1.9E-05 1.9E-05 DPhenols 1.2E-04 1.2E-04 DNaphthalene 7.0E-06 7.0E-06 DDioxins 2.5E-11 2.5E-11 Dn-nitrodimethylamine 9.9E-07 9.9E-07 DRadionuclides (Ci) 8.7E-05 8.7E-05 D
(continued)
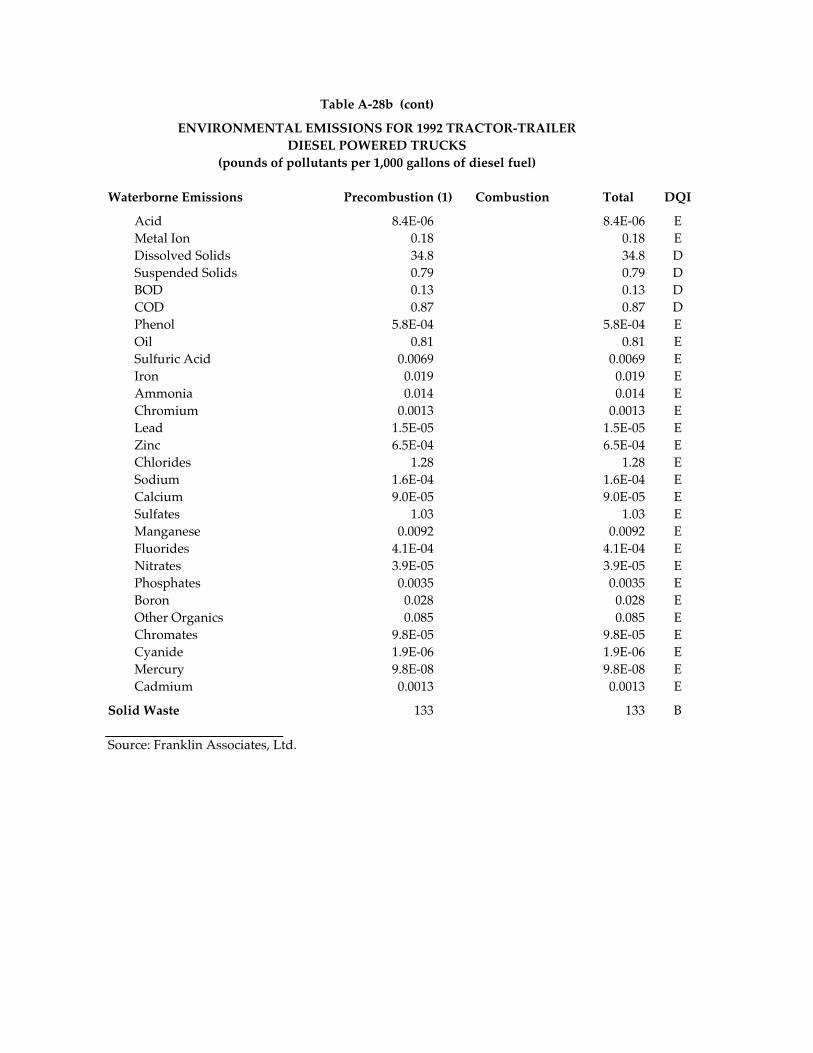
Table A-28b (cont)
ENVIRONMENTAL EMISSIONS FOR 1992 TRACTOR-TRAILERDIESEL POWERED TRUCKS
(pounds of pollutants per 1,000 gallons of diesel fuel)
Waterborne Emissions Precombustion (1) Combustion Total DQI
Acid 8.4E-06 8.4E-06 EMetal Ion 0.18 0.18 EDissolved Solids 34.8 34.8 DSuspended Solids 0.79 0.79 DBOD 0.13 0.13 DCOD 0.87 0.87 DPhenol 5.8E-04 5.8E-04 EOil 0.81 0.81 ESulfuric Acid 0.0069 0.0069 EIron 0.019 0.019 EAmmonia 0.014 0.014 EChromium 0.0013 0.0013 ELead 1.5E-05 1.5E-05 EZinc 6.5E-04 6.5E-04 EChlorides 1.28 1.28 ESodium 1.6E-04 1.6E-04 ECalcium 9.0E-05 9.0E-05 ESulfates 1.03 1.03 EManganese 0.0092 0.0092 EFluorides 4.1E-04 4.1E-04 ENitrates 3.9E-05 3.9E-05 EPhosphates 0.0035 0.0035 EBoron 0.028 0.028 EOther Organics 0.085 0.085 EChromates 9.8E-05 9.8E-05 ECyanide 1.9E-06 1.9E-06 EMercury 9.8E-08 9.8E-08 ECadmium 0.0013 0.0013 E
Solid Waste 133 133 B
Source: Franklin Associates, Ltd.
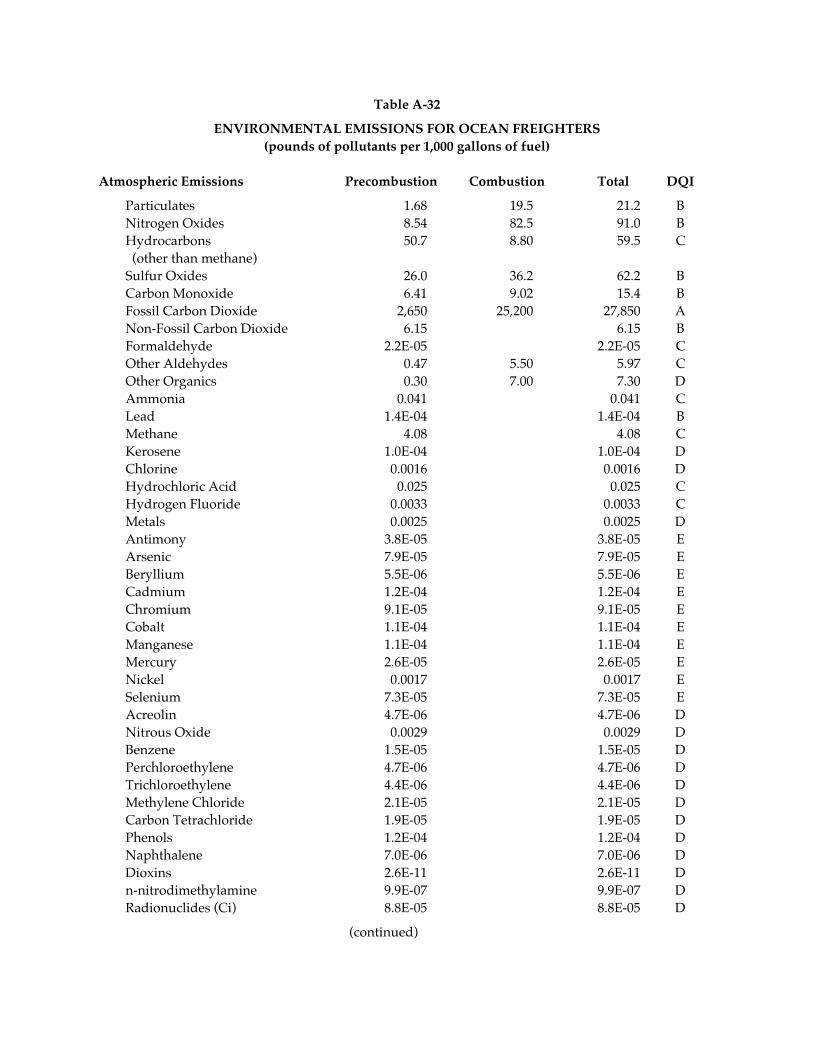
Table A-32
ENVIRONMENTAL EMISSIONS FOR OCEAN FREIGHTERS(pounds of pollutants per 1,000 gallons of fuel)
Atmospheric Emissions Precombustion Combustion Total DQI
Particulates 1.68 19.5 21.2 BNitrogen Oxides 8.54 82.5 91.0 BHydrocarbons 50.7 8.80 59.5 C (other than methane)Sulfur Oxides 26.0 36.2 62.2 BCarbon Monoxide 6.41 9.02 15.4 BFossil Carbon Dioxide 2,650 25,200 27,850 ANon-Fossil Carbon Dioxide 6.15 6.15 BFormaldehyde 2.2E-05 2.2E-05 COther Aldehydes 0.47 5.50 5.97 COther Organics 0.30 7.00 7.30 DAmmonia 0.041 0.041 CLead 1.4E-04 1.4E-04 BMethane 4.08 4.08 CKerosene 1.0E-04 1.0E-04 DChlorine 0.0016 0.0016 DHydrochloric Acid 0.025 0.025 CHydrogen Fluoride 0.0033 0.0033 CMetals 0.0025 0.0025 DAntimony 3.8E-05 3.8E-05 EArsenic 7.9E-05 7.9E-05 EBeryllium 5.5E-06 5.5E-06 ECadmium 1.2E-04 1.2E-04 EChromium 9.1E-05 9.1E-05 ECobalt 1.1E-04 1.1E-04 EManganese 1.1E-04 1.1E-04 EMercury 2.6E-05 2.6E-05 ENickel 0.0017 0.0017 ESelenium 7.3E-05 7.3E-05 EAcreolin 4.7E-06 4.7E-06 DNitrous Oxide 0.0029 0.0029 DBenzene 1.5E-05 1.5E-05 DPerchloroethylene 4.7E-06 4.7E-06 DTrichloroethylene 4.4E-06 4.4E-06 DMethylene Chloride 2.1E-05 2.1E-05 DCarbon Tetrachloride 1.9E-05 1.9E-05 DPhenols 1.2E-04 1.2E-04 DNaphthalene 7.0E-06 7.0E-06 DDioxins 2.6E-11 2.6E-11 Dn-nitrodimethylamine 9.9E-07 9.9E-07 DRadionuclides (Ci) 8.8E-05 8.8E-05 D
(continued)
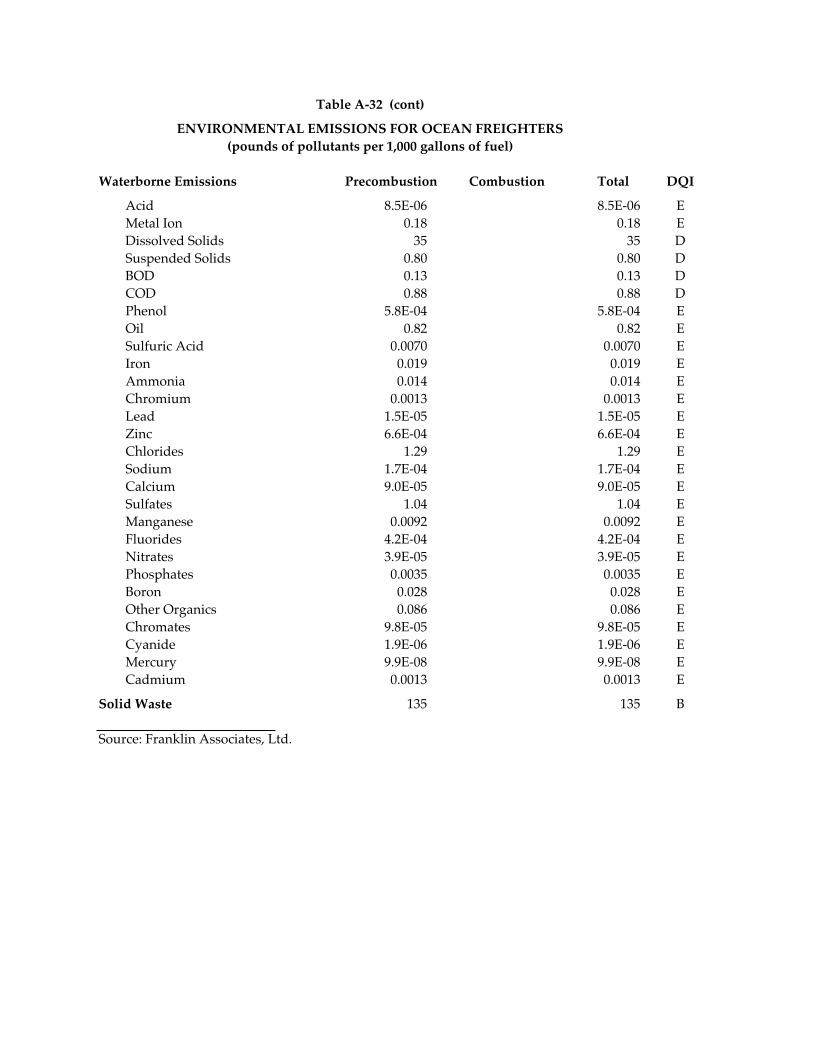
Table A-32 (cont)
ENVIRONMENTAL EMISSIONS FOR OCEAN FREIGHTERS(pounds of pollutants per 1,000 gallons of fuel)
Waterborne Emissions Precombustion Combustion Total DQI
Acid 8.5E-06 8.5E-06 EMetal Ion 0.18 0.18 EDissolved Solids 35 35 DSuspended Solids 0.80 0.80 DBOD 0.13 0.13 DCOD 0.88 0.88 DPhenol 5.8E-04 5.8E-04 EOil 0.82 0.82 ESulfuric Acid 0.0070 0.0070 EIron 0.019 0.019 EAmmonia 0.014 0.014 EChromium 0.0013 0.0013 ELead 1.5E-05 1.5E-05 EZinc 6.6E-04 6.6E-04 EChlorides 1.29 1.29 ESodium 1.7E-04 1.7E-04 ECalcium 9.0E-05 9.0E-05 ESulfates 1.04 1.04 EManganese 0.0092 0.0092 EFluorides 4.2E-04 4.2E-04 ENitrates 3.9E-05 3.9E-05 EPhosphates 0.0035 0.0035 EBoron 0.028 0.028 EOther Organics 0.086 0.086 EChromates 9.8E-05 9.8E-05 ECyanide 1.9E-06 1.9E-06 EMercury 9.9E-08 9.9E-08 ECadmium 0.0013 0.0013 E
Solid Waste 135 135 B
Source: Franklin Associates, Ltd.
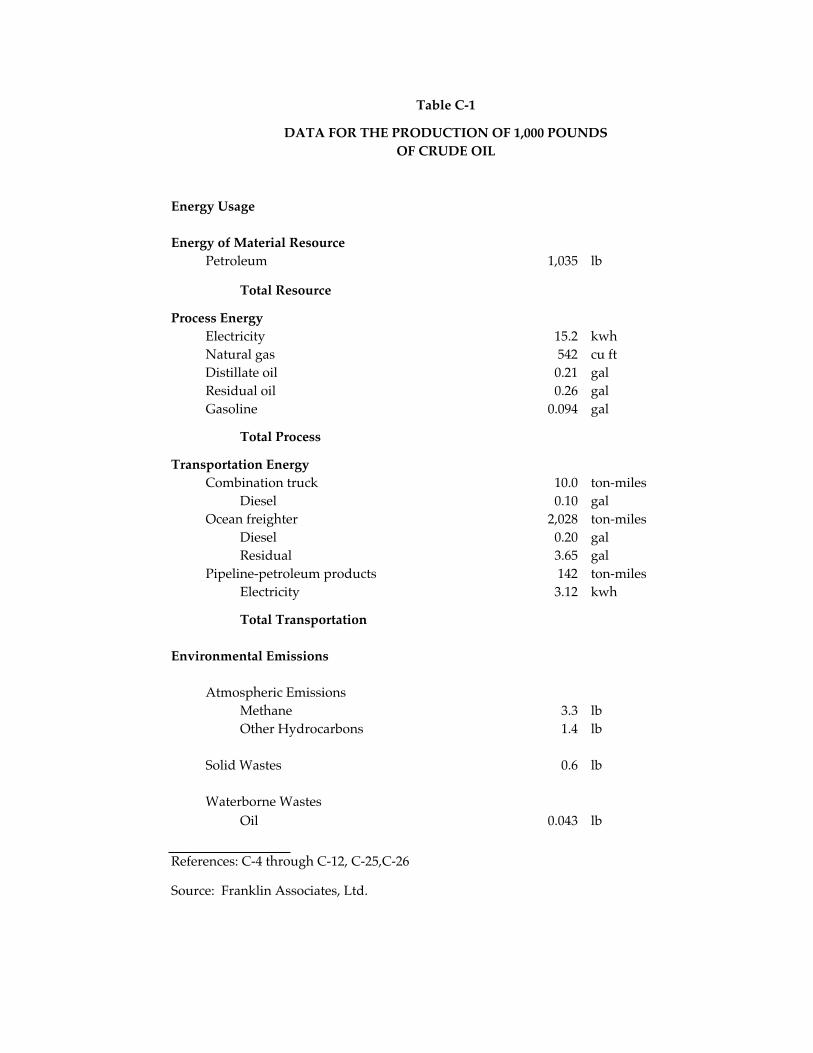
Energy Usage
Energy of Material ResourcePetroleum 1,035 lb
Total Resource
Process EnergyElectricity 15.2 kwhNatural gas 542 cu ftDistillate oil 0.21 galResidual oil 0.26 galGasoline 0.094 gal
Total Process
Transportation EnergyCombination truck 10.0 ton-miles
Diesel 0.10 galOcean freighter 2,028 ton-miles
Diesel 0.20 galResidual 3.65 gal
Pipeline-petroleum products 142 ton-milesElectricity 3.12 kwh
Total Transportation
Environmental Emissions
Atmospheric EmissionsMethane 3.3 lbOther Hydrocarbons 1.4 lb
Solid Wastes 0.6 lb
Waterborne WastesOil 0.043 lb
References: C-4 through C-12, C-25,C-26
Source: Franklin Associates, Ltd.
Table C-1
DATA FOR THE PRODUCTION OF 1,000 POUNDSOF CRUDE OIL

Table C-2
DATA FOR THE PROCESSING OF OF CRUDE OILIN A REFINERY TO PRODUCE 1,000 POUNDS OF ASPHALT
(INCLUDING DESALTING, DISTALLATION AND DEASPHALTING)
Raw Materials
Crude oil 1,005 lb
Energy Usage
Process EnergyElectricity 13.3 kwhNatural gas 937 cu ftLPG 0.27 galResidual oil 1.90 gal
Total Process
Environmental Emissions
Atmospheric EmissionsNonmethane VOC 1.38 lbParticulates 0.060 lbSulfur Oxides 0.20 lbAldehydes 0.040 lbAmmonia 0.0053 lbLead 1.4E-06 lbChlorine 2.1E-04 lbHydrochloric Acid 1.6E-04 lb
Solid Wastes 3.36 lb
Waterborne WastesBOD 0.014 lbCOD 0.066 lbSuspended solids 0.013 lbDissolved solids 0.94 lbAcid 1.1E-06 lbMetal ion 0.024 lbPhenol 7.8E-05 lbOil 8.1E-04 lbIron 4.2E-04 lbAmmonia 0.0018 lbChromium 4.5E-06 lbLead 2.0E-06 lbZinc 3.0E-05 lb
References: C-13 through C-23,C-25,C-26Source: Franklin Associates, Ltd.
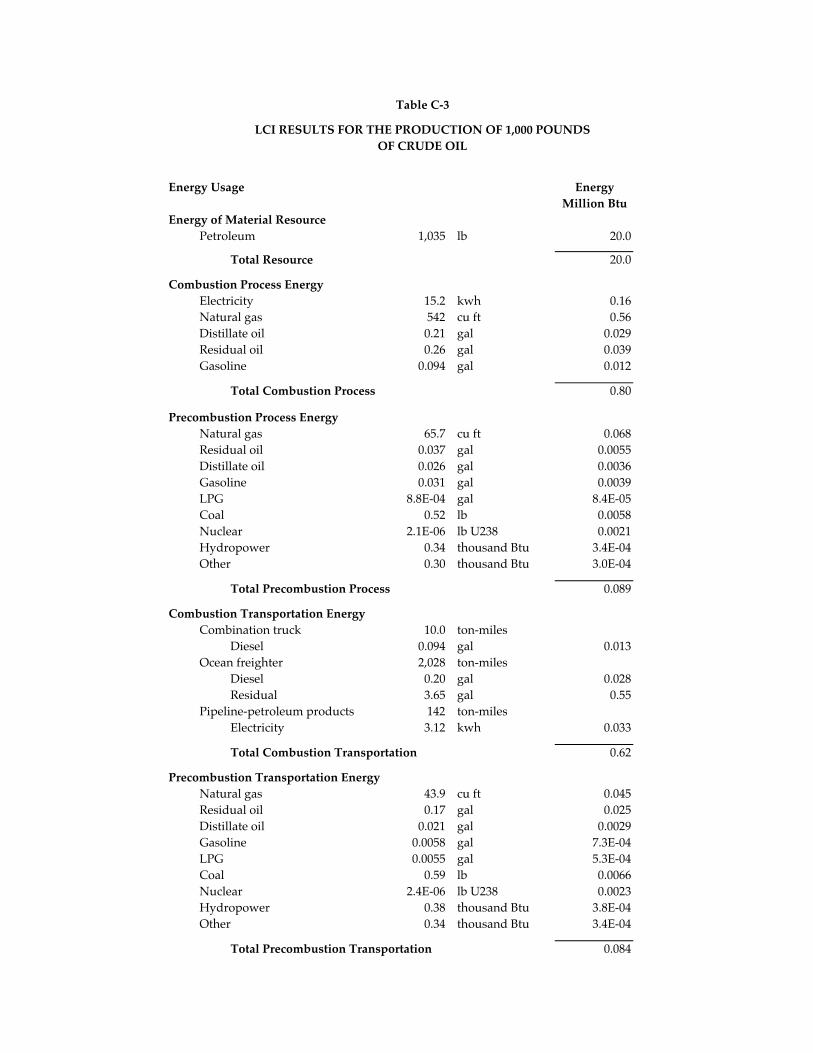
Table C-3
LCI RESULTS FOR THE PRODUCTION OF 1,000 POUNDSOF CRUDE OIL
Energy Usage EnergyMillion Btu
Energy of Material ResourcePetroleum 1,035 lb 20.0
Total Resource 20.0
Combustion Process EnergyElectricity 15.2 kwh 0.16Natural gas 542 cu ft 0.56Distillate oil 0.21 gal 0.029Residual oil 0.26 gal 0.039Gasoline 0.094 gal 0.012
Total Combustion Process 0.80
Precombustion Process EnergyNatural gas 65.7 cu ft 0.068Residual oil 0.037 gal 0.0055Distillate oil 0.026 gal 0.0036Gasoline 0.031 gal 0.0039LPG 8.8E-04 gal 8.4E-05Coal 0.52 lb 0.0058Nuclear 2.1E-06 lb U238 0.0021Hydropower 0.34 thousand Btu 3.4E-04Other 0.30 thousand Btu 3.0E-04
Total Precombustion Process 0.089
Combustion Transportation EnergyCombination truck 10.0 ton-miles
Diesel 0.094 gal 0.013Ocean freighter 2,028 ton-miles
Diesel 0.20 gal 0.028Residual 3.65 gal 0.55
Pipeline-petroleum products 142 ton-milesElectricity 3.12 kwh 0.033
Total Combustion Transportation 0.62
Precombustion Transportation EnergyNatural gas 43.9 cu ft 0.045Residual oil 0.17 gal 0.025Distillate oil 0.021 gal 0.0029Gasoline 0.0058 gal 7.3E-04LPG 0.0055 gal 5.3E-04Coal 0.59 lb 0.0066Nuclear 2.4E-06 lb U238 0.0023Hydropower 0.38 thousand Btu 3.8E-04Other 0.34 thousand Btu 3.4E-04
Total Precombustion Transportation 0.084
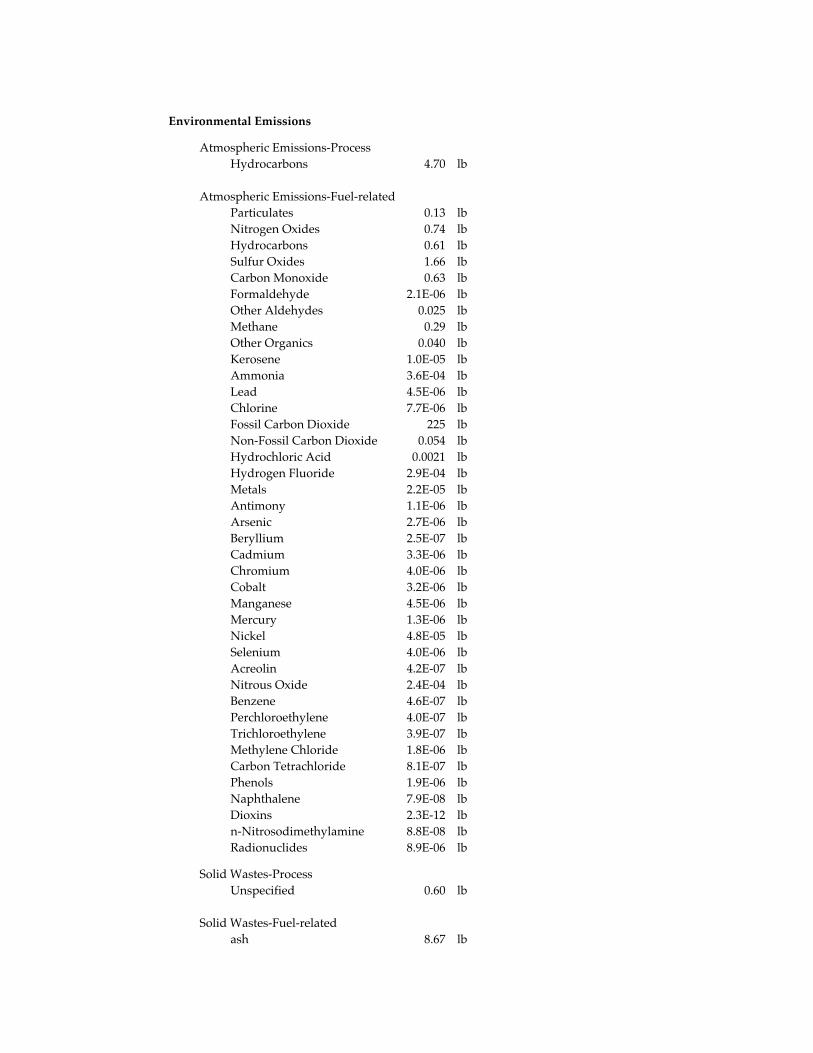
Environmental Emissions
Atmospheric Emissions-ProcessHydrocarbons 4.70 lb
Atmospheric Emissions-Fuel-relatedParticulates 0.13 lbNitrogen Oxides 0.74 lbHydrocarbons 0.61 lbSulfur Oxides 1.66 lbCarbon Monoxide 0.63 lbFormaldehyde 2.1E-06 lbOther Aldehydes 0.025 lbMethane 0.29 lbOther Organics 0.040 lbKerosene 1.0E-05 lbAmmonia 3.6E-04 lbLead 4.5E-06 lbChlorine 7.7E-06 lbFossil Carbon Dioxide 225 lbNon-Fossil Carbon Dioxide 0.054 lbHydrochloric Acid 0.0021 lbHydrogen Fluoride 2.9E-04 lbMetals 2.2E-05 lbAntimony 1.1E-06 lbArsenic 2.7E-06 lbBeryllium 2.5E-07 lbCadmium 3.3E-06 lbChromium 4.0E-06 lbCobalt 3.2E-06 lbManganese 4.5E-06 lbMercury 1.3E-06 lbNickel 4.8E-05 lbSelenium 4.0E-06 lbAcreolin 4.2E-07 lbNitrous Oxide 2.4E-04 lbBenzene 4.6E-07 lbPerchloroethylene 4.0E-07 lbTrichloroethylene 3.9E-07 lbMethylene Chloride 1.8E-06 lbCarbon Tetrachloride 8.1E-07 lbPhenols 1.9E-06 lbNaphthalene 7.9E-08 lbDioxins 2.3E-12 lbn-Nitrosodimethylamine 8.8E-08 lbRadionuclides 8.9E-06 lb
Solid Wastes-ProcessUnspecified 0.60 lb
Solid Wastes-Fuel-related ash 8.67 lb
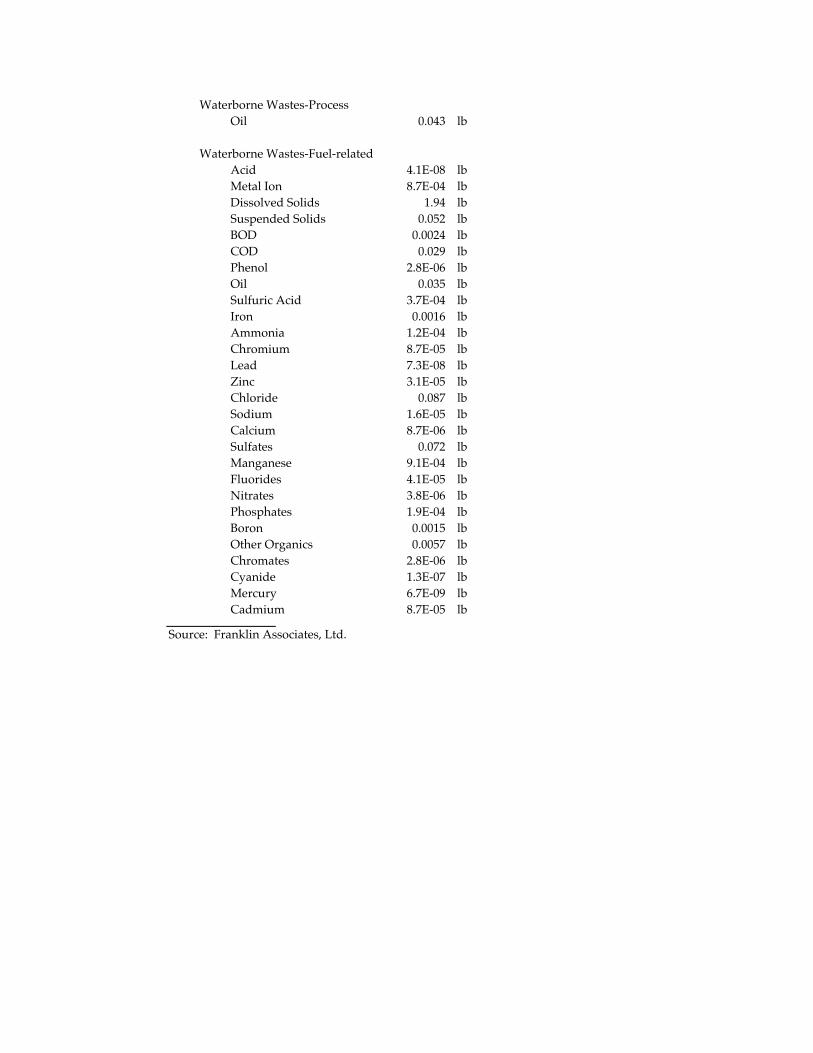
Waterborne Wastes-ProcessOil 0.043 lb
Waterborne Wastes-Fuel-relatedAcid 4.1E-08 lbMetal Ion 8.7E-04 lbDissolved Solids 1.94 lbSuspended Solids 0.052 lbBOD 0.0024 lbCOD 0.029 lbPhenol 2.8E-06 lbOil 0.035 lbSulfuric Acid 3.7E-04 lbIron 0.0016 lbAmmonia 1.2E-04 lbChromium 8.7E-05 lbLead 7.3E-08 lbZinc 3.1E-05 lbChloride 0.087 lbSodium 1.6E-05 lbCalcium 8.7E-06 lbSulfates 0.072 lbManganese 9.1E-04 lbFluorides 4.1E-05 lbNitrates 3.8E-06 lbPhosphates 1.9E-04 lbBoron 0.0015 lbOther Organics 0.0057 lbChromates 2.8E-06 lbCyanide 1.3E-07 lbMercury 6.7E-09 lbCadmium 8.7E-05 lb
Source: Franklin Associates, Ltd.
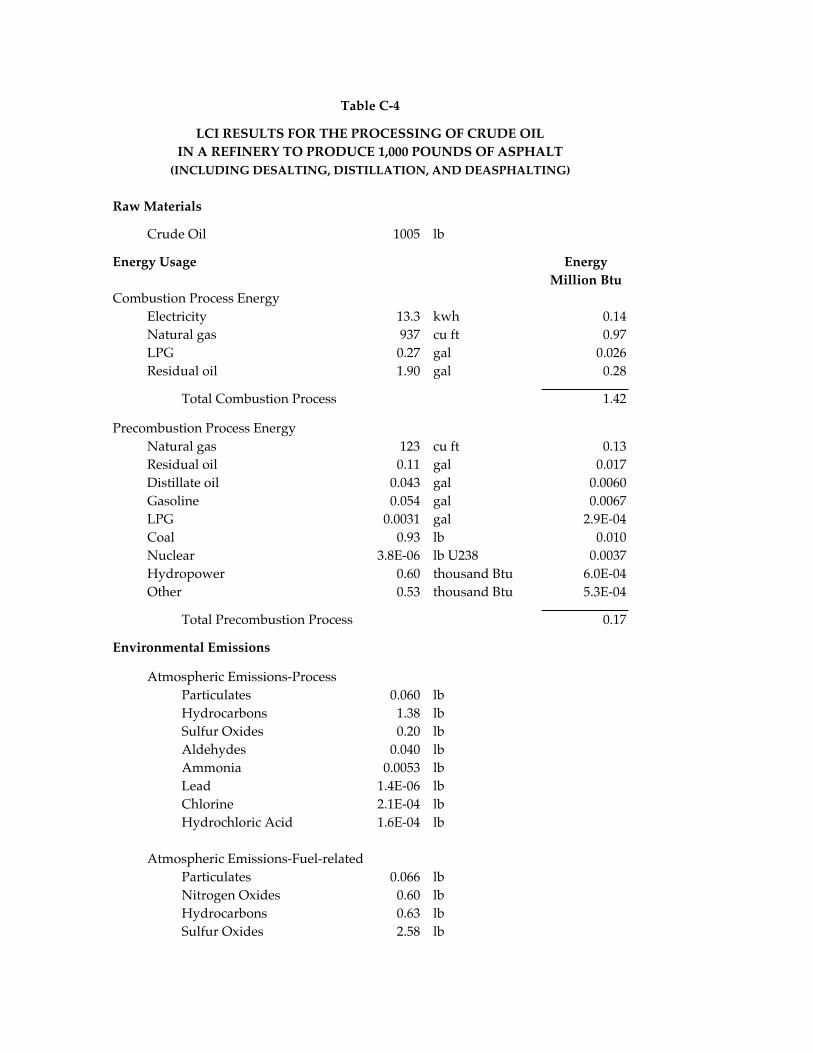
Table C-4
LCI RESULTS FOR THE PROCESSING OF CRUDE OILIN A REFINERY TO PRODUCE 1,000 POUNDS OF ASPHALT
(INCLUDING DESALTING, DISTILLATION, AND DEASPHALTING)
Raw Materials
Crude Oil 1005 lb
Energy Usage EnergyMillion Btu
Combustion Process EnergyElectricity 13.3 kwh 0.14Natural gas 937 cu ft 0.97LPG 0.27 gal 0.026Residual oil 1.90 gal 0.28
Total Combustion Process 1.42
Precombustion Process EnergyNatural gas 123 cu ft 0.13Residual oil 0.11 gal 0.017Distillate oil 0.043 gal 0.0060Gasoline 0.054 gal 0.0067LPG 0.0031 gal 2.9E-04Coal 0.93 lb 0.010Nuclear 3.8E-06 lb U238 0.0037Hydropower 0.60 thousand Btu 6.0E-04Other 0.53 thousand Btu 5.3E-04
Total Precombustion Process 0.17
Environmental Emissions
Atmospheric Emissions-ProcessParticulates 0.060 lbHydrocarbons 1.38 lbSulfur Oxides 0.20 lbAldehydes 0.040 lbAmmonia 0.0053 lbLead 1.4E-06 lbChlorine 2.1E-04 lbHydrochloric Acid 1.6E-04 lb
Atmospheric Emissions-Fuel-relatedParticulates 0.066 lbNitrogen Oxides 0.60 lbHydrocarbons 0.63 lbSulfur Oxides 2.58 lb

Carbon Monoxide 0.30 lbFormaldehyde 1.5E-06 lbOther Aldehydes 0.0014 lbMethane 0.42 lbOther Organics 0.0016 lbKerosene 7.5E-06 lbAmmonia 2.2E-04 lbLead 1.8E-05 lbChlorine 3.7E-06 lbFossil Carbon Dioxide 205 lbNon-Fossil Carbon Dioxide 0.047 lbHydrochloric Acid 0.0016 lbHydrogen Fluoride 2.1E-04 lbMetals 1.9E-05 lbAntimony 5.5E-06 lbArsenic 1.1E-05 lbBeryllium 7.2E-07 lbCadmium 1.7E-05 lbChromium 1.2E-05 lbCobalt 1.6E-05 lbManganese 9.7E-06 lbMercury 3.1E-06 lbNickel 2.5E-04 lbSelenium 8.0E-06 lbAcreolin 3.1E-07 lbNitrous Oxide 1.8E-04 lbBenzene 3.5E-07 lbPerchloroethylene 2.9E-07 lbTrichloroethylene 2.9E-07 lbMethylene Chloride 1.3E-06 lbCarbon Tetrachloride 6.3E-07 lbPhenols 1.5E-06 lbNaphthalene 6.6E-08 lbDioxins 1.7E-12 lbn-Nitrosodimethylamine 6.5E-08 lbRadionuclides 6.5E-06 lb
Solid Wastes-ProcessUnspecified 3.36 lb
Solid Wastes-Fuel-related ash 9.31 lb
Waterborne Wastes-ProcessAcid 1.1E-06 lbMetal Ion 0.024 lbDissolved Solids 0.94 lbSuspended Solids 0.013 lb
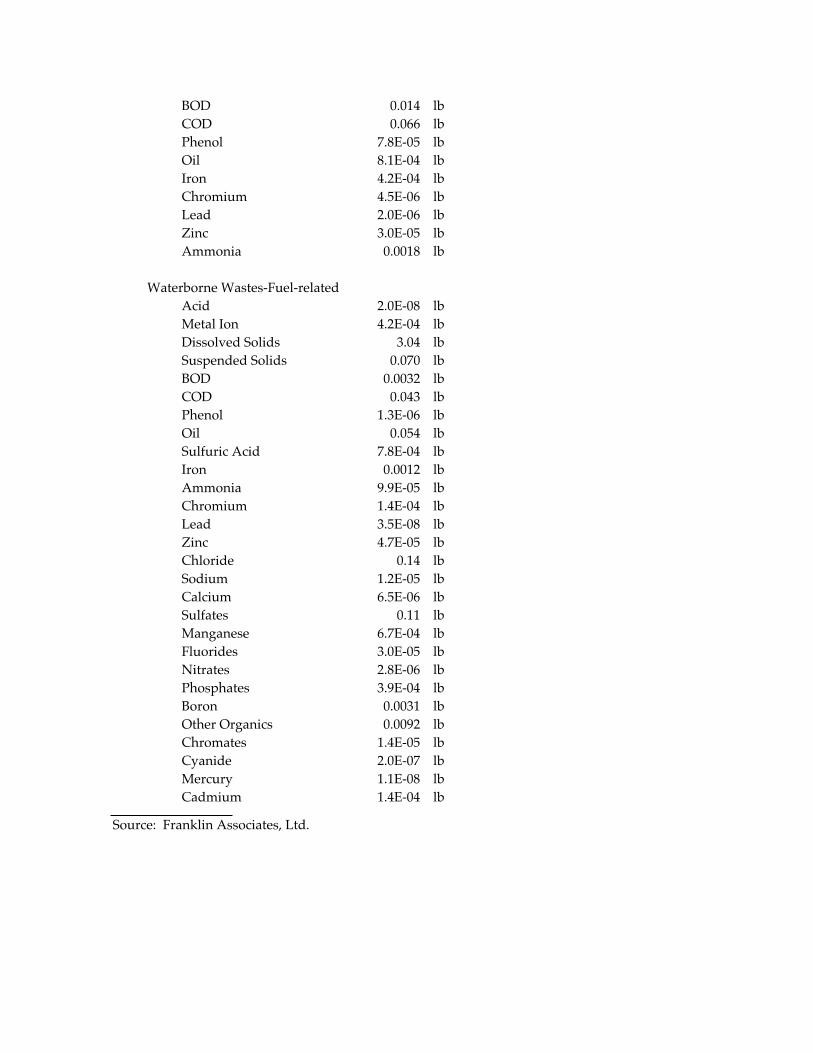
BOD 0.014 lbCOD 0.066 lbPhenol 7.8E-05 lbOil 8.1E-04 lbIron 4.2E-04 lbChromium 4.5E-06 lbLead 2.0E-06 lbZinc 3.0E-05 lbAmmonia 0.0018 lb
Waterborne Wastes-Fuel-relatedAcid 2.0E-08 lbMetal Ion 4.2E-04 lbDissolved Solids 3.04 lbSuspended Solids 0.070 lbBOD 0.0032 lbCOD 0.043 lbPhenol 1.3E-06 lbOil 0.054 lbSulfuric Acid 7.8E-04 lbIron 0.0012 lbAmmonia 9.9E-05 lbChromium 1.4E-04 lbLead 3.5E-08 lbZinc 4.7E-05 lbChloride 0.14 lbSodium 1.2E-05 lbCalcium 6.5E-06 lbSulfates 0.11 lbManganese 6.7E-04 lbFluorides 3.0E-05 lbNitrates 2.8E-06 lbPhosphates 3.9E-04 lbBoron 0.0031 lbOther Organics 0.0092 lbChromates 1.4E-05 lbCyanide 2.0E-07 lbMercury 1.1E-08 lbCadmium 1.4E-04 lb
Source: Franklin Associates, Ltd.
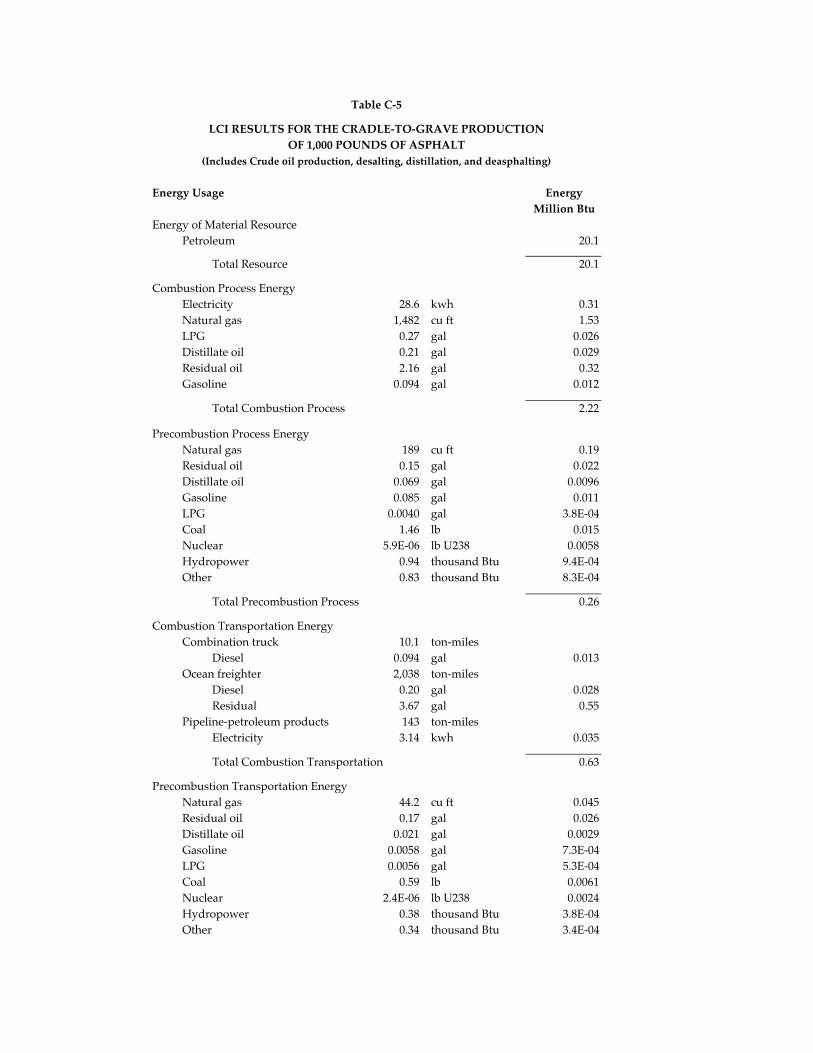
Table C-5
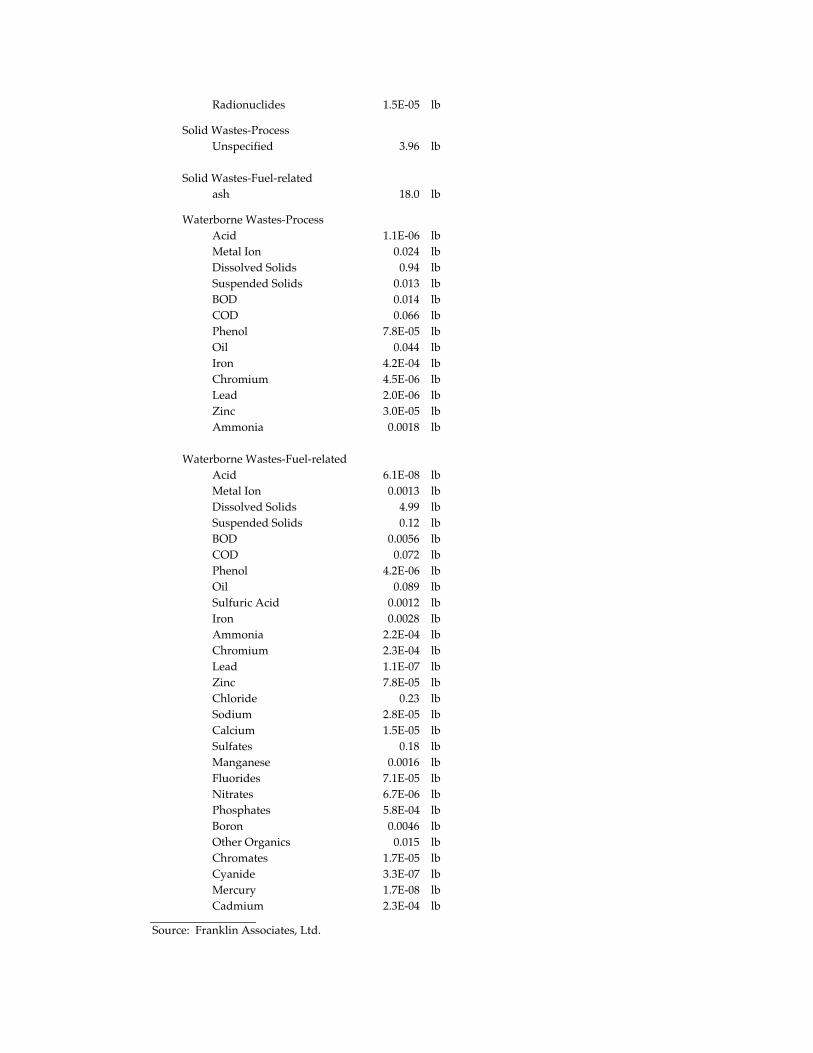
LCI RESULTS FOR THE CRADLE-TO-GRAVE PRODUCTIONOF 1,000 POUNDS OF ASPHALT
(Includes Crude oil production, desalting, distillation, and deasphalting)
Energy Usage EnergyMillion Btu
Energy of Material ResourcePetroleum 20.1
Total Resource 20.1
Combustion Process EnergyElectricity 28.6 kwh 0.31Natural gas 1,482 cu ft 1.53LPG 0.27 gal 0.026Distillate oil 0.21 gal 0.029Residual oil 2.16 gal 0.32Gasoline 0.094 gal 0.012
Total Combustion Process 2.22
Precombustion Process EnergyNatural gas 189 cu ft 0.19Residual oil 0.15 gal 0.022Distillate oil 0.069 gal 0.0096Gasoline 0.085 gal 0.011LPG 0.0040 gal 3.8E-04Coal 1.46 lb 0.015Nuclear 5.9E-06 lb U238 0.0058Hydropower 0.94 thousand Btu 9.4E-04Other 0.83 thousand Btu 8.3E-04
Total Precombustion Process 0.26
Combustion Transportation EnergyCombination truck 10.1 ton-miles
Diesel 0.094 gal 0.013Ocean freighter 2,038 ton-miles
Diesel 0.20 gal 0.028Residual 3.67 gal 0.55
Pipeline-petroleum products 143 ton-milesElectricity 3.14 kwh 0.035
Total Combustion Transportation 0.63
Precombustion Transportation EnergyNatural gas 44.2 cu ft 0.045Residual oil 0.17 gal 0.026Distillate oil 0.021 gal 0.0029Gasoline 0.0058 gal 7.3E-04LPG 0.0056 gal 5.3E-04Coal 0.59 lb 0.0061Nuclear 2.4E-06 lb U238 0.0024Hydropower 0.38 thousand Btu 3.8E-04Other 0.34 thousand Btu 3.4E-04
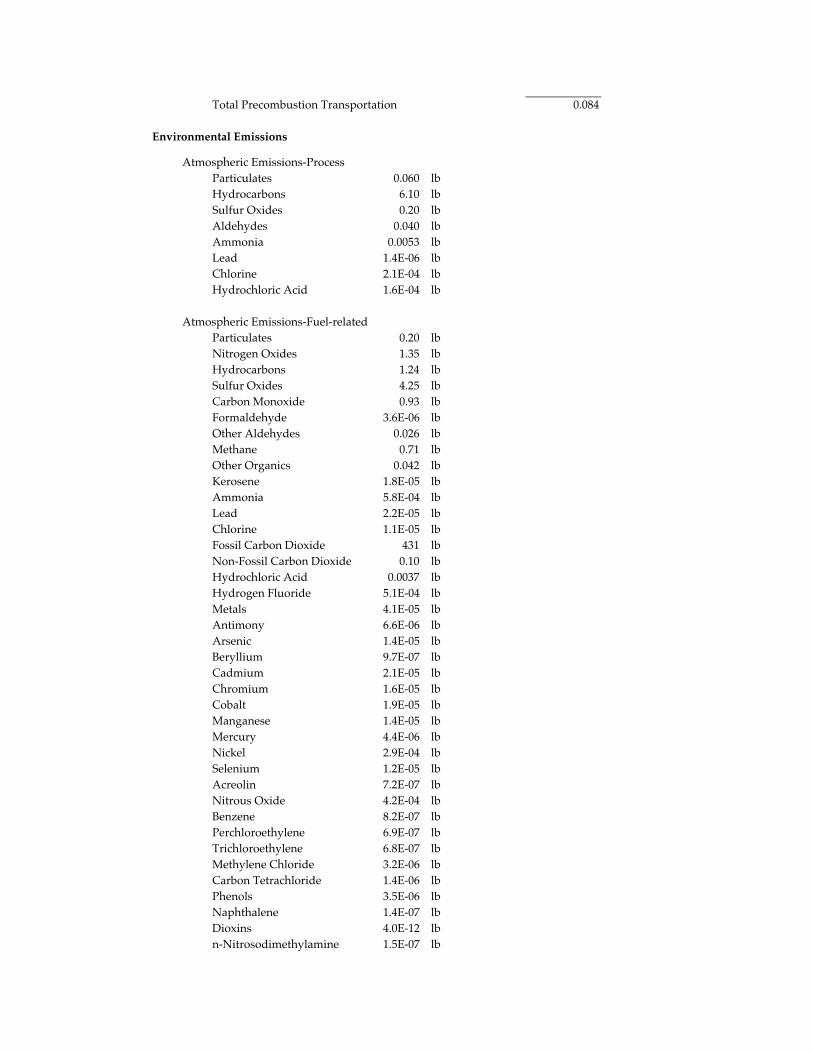
Total Precombustion Transportation 0.084
Environmental Emissions
Atmospheric Emissions-ProcessParticulates 0.060 lbHydrocarbons 6.10 lbSulfur Oxides 0.20 lbAldehydes 0.040 lbAmmonia 0.0053 lbLead 1.4E-06 lbChlorine 2.1E-04 lbHydrochloric Acid 1.6E-04 lb
Atmospheric Emissions-Fuel-relatedParticulates 0.20 lbNitrogen Oxides 1.35 lbHydrocarbons 1.24 lbSulfur Oxides 4.25 lbCarbon Monoxide 0.93 lbFormaldehyde 3.6E-06 lbOther Aldehydes 0.026 lbMethane 0.71 lbOther Organics 0.042 lbKerosene 1.8E-05 lbAmmonia 5.8E-04 lbLead 2.2E-05 lbChlorine 1.1E-05 lbFossil Carbon Dioxide 431 lbNon-Fossil Carbon Dioxide 0.10 lbHydrochloric Acid 0.0037 lbHydrogen Fluoride 5.1E-04 lbMetals 4.1E-05 lbAntimony 6.6E-06 lbArsenic 1.4E-05 lbBeryllium 9.7E-07 lbCadmium 2.1E-05 lbChromium 1.6E-05 lbCobalt 1.9E-05 lbManganese 1.4E-05 lbMercury 4.4E-06 lbNickel 2.9E-04 lbSelenium 1.2E-05 lbAcreolin 7.2E-07 lbNitrous Oxide 4.2E-04 lbBenzene 8.2E-07 lbPerchloroethylene 6.9E-07 lbTrichloroethylene 6.8E-07 lbMethylene Chloride 3.2E-06 lbCarbon Tetrachloride 1.4E-06 lbPhenols 3.5E-06 lbNaphthalene 1.4E-07 lbDioxins 4.0E-12 lbn-Nitrosodimethylamine 1.5E-07 lb
Radionuclides 1.5E-05 lb
Solid Wastes-ProcessUnspecified 3.96 lb
Solid Wastes-Fuel-related ash 18.0 lb
Waterborne Wastes-ProcessAcid 1.1E-06 lbMetal Ion 0.024 lbDissolved Solids 0.94 lbSuspended Solids 0.013 lbBOD 0.014 lbCOD 0.066 lbPhenol 7.8E-05 lbOil 0.044 lbIron 4.2E-04 lbChromium 4.5E-06 lbLead 2.0E-06 lbZinc 3.0E-05 lbAmmonia 0.0018 lb
Waterborne Wastes-Fuel-relatedAcid 6.1E-08 lbMetal Ion 0.0013 lbDissolved Solids 4.99 lbSuspended Solids 0.12 lbBOD 0.0056 lbCOD 0.072 lbPhenol 4.2E-06 lbOil 0.089 lbSulfuric Acid 0.0012 lbIron 0.0028 lbAmmonia 2.2E-04 lbChromium 2.3E-04 lbLead 1.1E-07 lbZinc 7.8E-05 lbChloride 0.23 lbSodium 2.8E-05 lbCalcium 1.5E-05 lbSulfates 0.18 lbManganese 0.0016 lbFluorides 7.1E-05 lbNitrates 6.7E-06 lbPhosphates 5.8E-04 lbBoron 0.0046 lbOther Organics 0.015 lbChromates 1.7E-05 lbCyanide 3.3E-07 lbMercury 1.7E-08 lbCadmium 2.3E-04 lb
Source: Franklin Associates, Ltd.
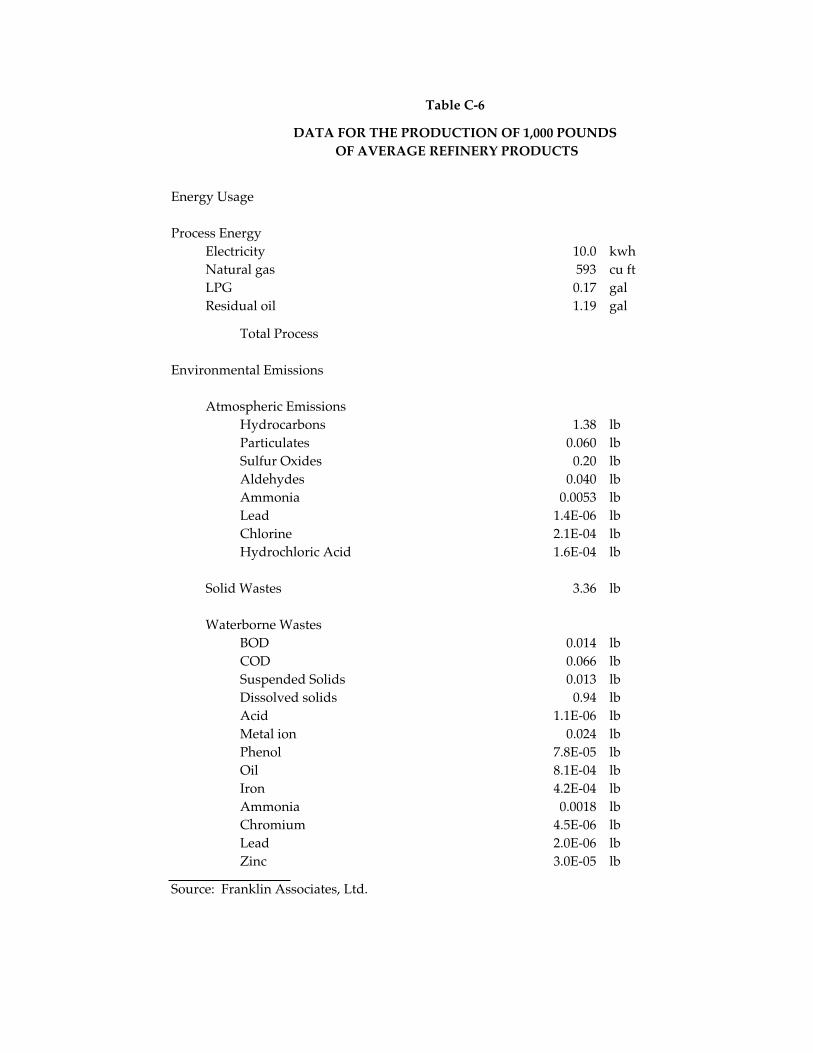
Energy Usage
Process EnergyElectricity 10.0 kwhNatural gas 593 cu ftLPG 0.17 galResidual oil 1.19 gal
Total Process
Environmental Emissions
Atmospheric EmissionsHydrocarbons 1.38 lbParticulates 0.060 lbSulfur Oxides 0.20 lbAldehydes 0.040 lbAmmonia 0.0053 lbLead 1.4E-06 lbChlorine 2.1E-04 lbHydrochloric Acid 1.6E-04 lb
Solid Wastes 3.36 lb
Waterborne WastesBOD 0.014 lbCOD 0.066 lbSuspended Solids 0.013 lbDissolved solids 0.94 lbAcid 1.1E-06 lbMetal ion 0.024 lbPhenol 7.8E-05 lbOil 8.1E-04 lbIron 4.2E-04 lbAmmonia 0.0018 lbChromium 4.5E-06 lbLead 2.0E-06 lbZinc 3.0E-05 lb
Source: Franklin Associates, Ltd.
Table C-6
DATA FOR THE PRODUCTION OF 1,000 POUNDS OF AVERAGE REFINERY PRODUCTS
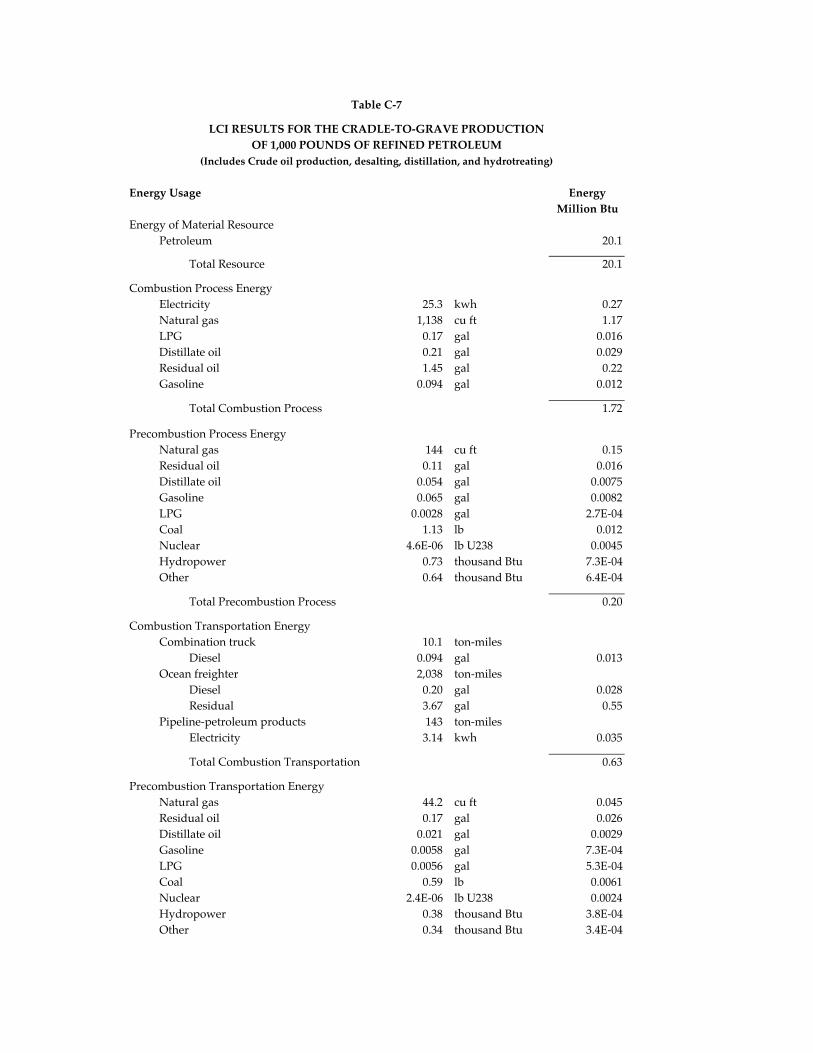
Table C-7
LCI RESULTS FOR THE CRADLE-TO-GRAVE PRODUCTIONOF 1,000 POUNDS OF REFINED PETROLEUM
(Includes Crude oil production, desalting, distillation, and hydrotreating)
Energy Usage EnergyMillion Btu
Energy of Material ResourcePetroleum 20.1
Total Resource 20.1
Combustion Process EnergyElectricity 25.3 kwh 0.27Natural gas 1,138 cu ft 1.17LPG 0.17 gal 0.016Distillate oil 0.21 gal 0.029Residual oil 1.45 gal 0.22Gasoline 0.094 gal 0.012
Total Combustion Process 1.72
Precombustion Process EnergyNatural gas 144 cu ft 0.15Residual oil 0.11 gal 0.016Distillate oil 0.054 gal 0.0075Gasoline 0.065 gal 0.0082LPG 0.0028 gal 2.7E-04Coal 1.13 lb 0.012Nuclear 4.6E-06 lb U238 0.0045Hydropower 0.73 thousand Btu 7.3E-04Other 0.64 thousand Btu 6.4E-04
Total Precombustion Process 0.20
Combustion Transportation EnergyCombination truck 10.1 ton-miles
Diesel 0.094 gal 0.013Ocean freighter 2,038 ton-miles
Diesel 0.20 gal 0.028Residual 3.67 gal 0.55
Pipeline-petroleum products 143 ton-milesElectricity 3.14 kwh 0.035
Total Combustion Transportation 0.63
Precombustion Transportation EnergyNatural gas 44.2 cu ft 0.045Residual oil 0.17 gal 0.026Distillate oil 0.021 gal 0.0029Gasoline 0.0058 gal 7.3E-04LPG 0.0056 gal 5.3E-04Coal 0.59 lb 0.0061Nuclear 2.4E-06 lb U238 0.0024Hydropower 0.38 thousand Btu 3.8E-04Other 0.34 thousand Btu 3.4E-04
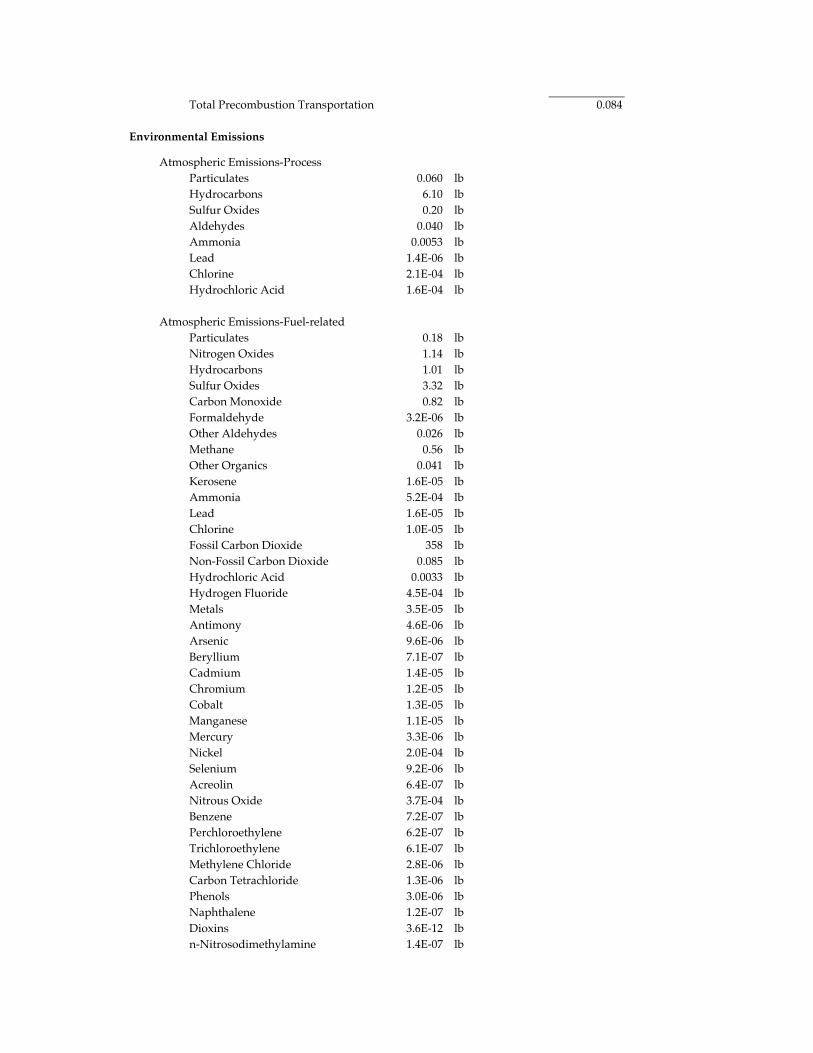
Total Precombustion Transportation 0.084
Environmental Emissions
Atmospheric Emissions-ProcessParticulates 0.060 lbHydrocarbons 6.10 lbSulfur Oxides 0.20 lbAldehydes 0.040 lbAmmonia 0.0053 lbLead 1.4E-06 lbChlorine 2.1E-04 lbHydrochloric Acid 1.6E-04 lb
Atmospheric Emissions-Fuel-relatedParticulates 0.18 lbNitrogen Oxides 1.14 lbHydrocarbons 1.01 lbSulfur Oxides 3.32 lbCarbon Monoxide 0.82 lbFormaldehyde 3.2E-06 lbOther Aldehydes 0.026 lbMethane 0.56 lbOther Organics 0.041 lbKerosene 1.6E-05 lbAmmonia 5.2E-04 lbLead 1.6E-05 lbChlorine 1.0E-05 lbFossil Carbon Dioxide 358 lbNon-Fossil Carbon Dioxide 0.085 lbHydrochloric Acid 0.0033 lbHydrogen Fluoride 4.5E-04 lbMetals 3.5E-05 lbAntimony 4.6E-06 lbArsenic 9.6E-06 lbBeryllium 7.1E-07 lbCadmium 1.4E-05 lbChromium 1.2E-05 lbCobalt 1.3E-05 lbManganese 1.1E-05 lbMercury 3.3E-06 lbNickel 2.0E-04 lbSelenium 9.2E-06 lbAcreolin 6.4E-07 lbNitrous Oxide 3.7E-04 lbBenzene 7.2E-07 lbPerchloroethylene 6.2E-07 lbTrichloroethylene 6.1E-07 lbMethylene Chloride 2.8E-06 lbCarbon Tetrachloride 1.3E-06 lbPhenols 3.0E-06 lbNaphthalene 1.2E-07 lbDioxins 3.6E-12 lbn-Nitrosodimethylamine 1.4E-07 lb
Radionuclides 1.4E-05 lb
Solid Wastes-ProcessUnspecified 3.96 lb
Solid Wastes-Fuel-related ash 15.0 lb
Waterborne Wastes-ProcessAcid 1.1E-06 lbMetal Ion 0.024 lbDissolved Solids 0.94 lbSuspended Solids 0.013 lbBOD 0.014 lbCOD 0.066 lbPhenol 7.8E-05 lbOil 0.044 lbIron 4.2E-04 lbChromium 4.5E-06 lbLead 2.0E-06 lbZinc 3.0E-05 lbAmmonia 0.0018 lb
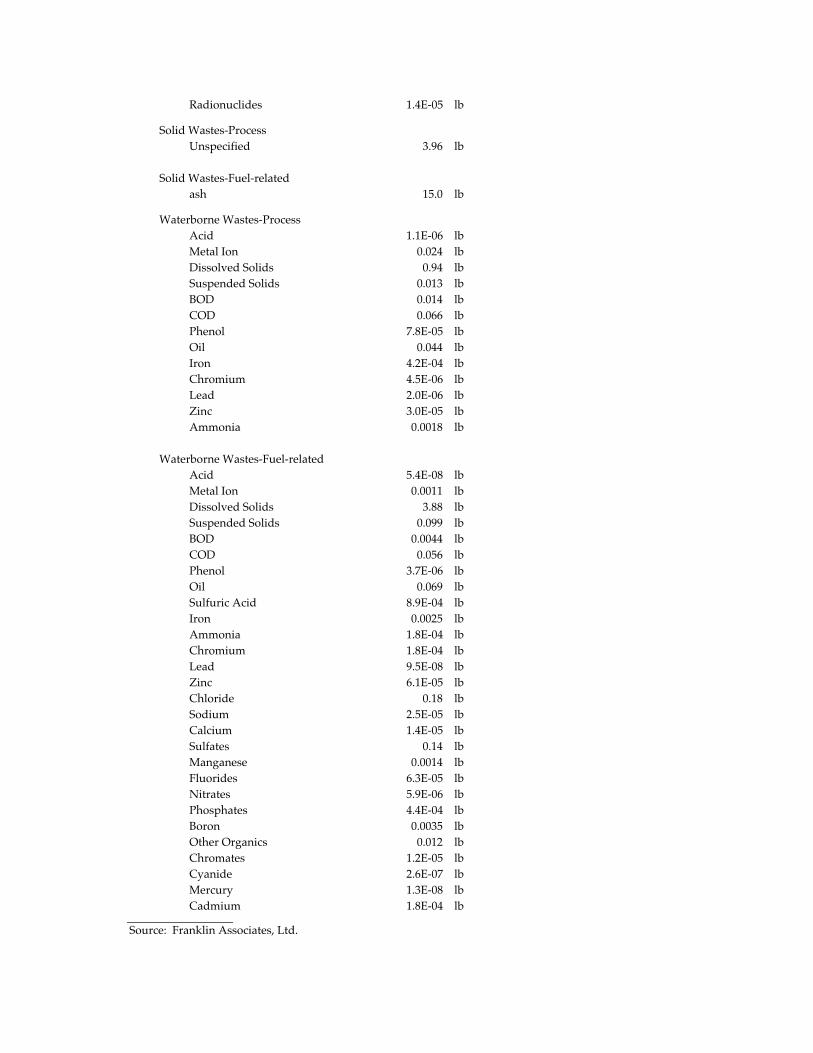
Waterborne Wastes-Fuel-relatedAcid 5.4E-08 lbMetal Ion 0.0011 lbDissolved Solids 3.88 lbSuspended Solids 0.099 lbBOD 0.0044 lbCOD 0.056 lbPhenol 3.7E-06 lbOil 0.069 lbSulfuric Acid 8.9E-04 lbIron 0.0025 lbAmmonia 1.8E-04 lbChromium 1.8E-04 lbLead 9.5E-08 lbZinc 6.1E-05 lbChloride 0.18 lbSodium 2.5E-05 lbCalcium 1.4E-05 lbSulfates 0.14 lbManganese 0.0014 lbFluorides 6.3E-05 lbNitrates 5.9E-06 lbPhosphates 4.4E-04 lbBoron 0.0035 lbOther Organics 0.012 lbChromates 1.2E-05 lbCyanide 2.6E-07 lbMercury 1.3E-08 lbCadmium 1.8E-04 lb
Source: Franklin Associates, Ltd.
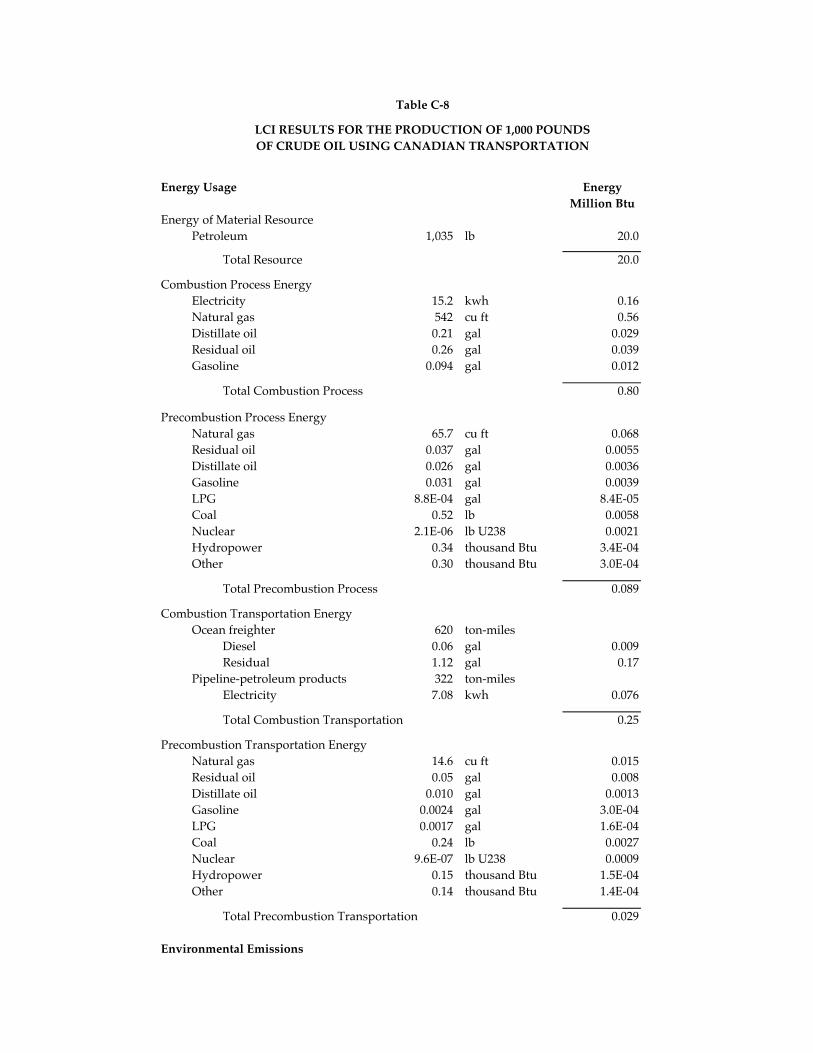
Table C-8
LCI RESULTS FOR THE PRODUCTION OF 1,000 POUNDSOF CRUDE OIL USING CANADIAN TRANSPORTATION
Energy Usage EnergyMillion Btu
Energy of Material ResourcePetroleum 1,035 lb 20.0
Total Resource 20.0
Combustion Process EnergyElectricity 15.2 kwh 0.16Natural gas 542 cu ft 0.56Distillate oil 0.21 gal 0.029Residual oil 0.26 gal 0.039Gasoline 0.094 gal 0.012
Total Combustion Process 0.80
Precombustion Process EnergyNatural gas 65.7 cu ft 0.068Residual oil 0.037 gal 0.0055Distillate oil 0.026 gal 0.0036Gasoline 0.031 gal 0.0039LPG 8.8E-04 gal 8.4E-05Coal 0.52 lb 0.0058Nuclear 2.1E-06 lb U238 0.0021Hydropower 0.34 thousand Btu 3.4E-04Other 0.30 thousand Btu 3.0E-04
Total Precombustion Process 0.089
Combustion Transportation EnergyOcean freighter 620 ton-miles
Diesel 0.06 gal 0.009Residual 1.12 gal 0.17
Pipeline-petroleum products 322 ton-milesElectricity 7.08 kwh 0.076
Total Combustion Transportation 0.25
Precombustion Transportation EnergyNatural gas 14.6 cu ft 0.015Residual oil 0.05 gal 0.008Distillate oil 0.010 gal 0.0013Gasoline 0.0024 gal 3.0E-04LPG 0.0017 gal 1.6E-04Coal 0.24 lb 0.0027Nuclear 9.6E-07 lb U238 0.0009Hydropower 0.15 thousand Btu 1.5E-04Other 0.14 thousand Btu 1.4E-04
Total Precombustion Transportation 0.029
Environmental Emissions
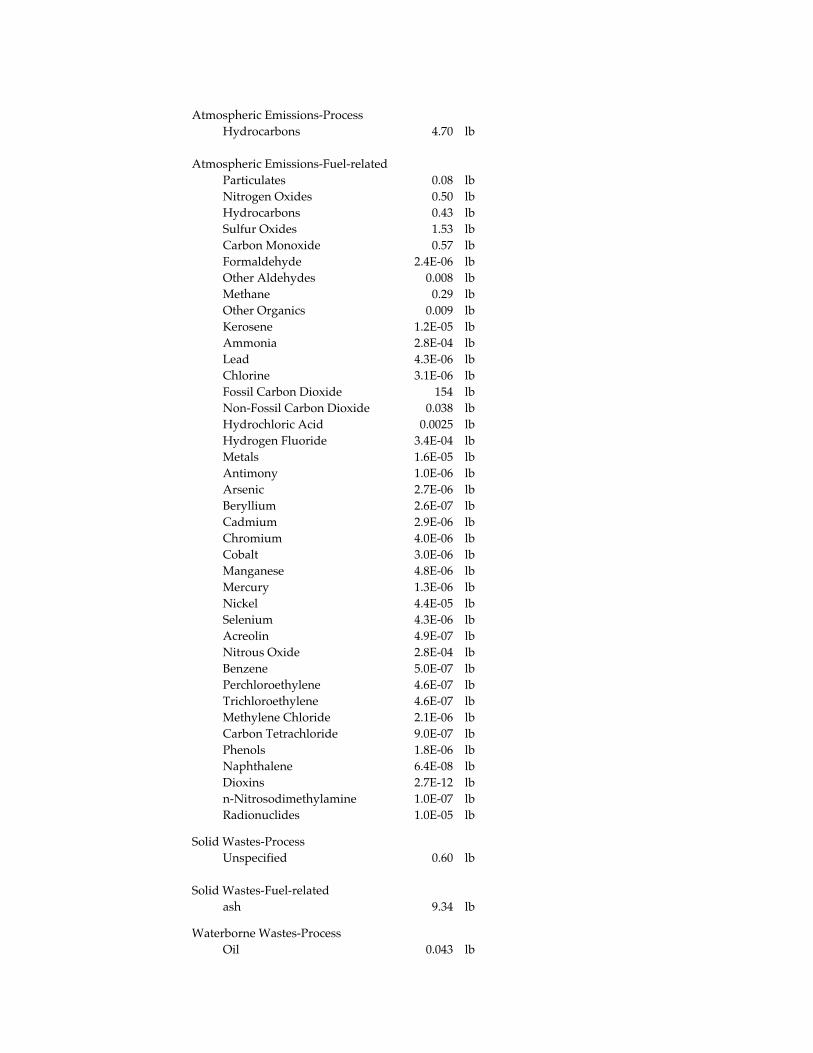
Atmospheric Emissions-ProcessHydrocarbons 4.70 lb
Atmospheric Emissions-Fuel-relatedParticulates 0.08 lbNitrogen Oxides 0.50 lbHydrocarbons 0.43 lbSulfur Oxides 1.53 lbCarbon Monoxide 0.57 lbFormaldehyde 2.4E-06 lbOther Aldehydes 0.008 lbMethane 0.29 lbOther Organics 0.009 lbKerosene 1.2E-05 lbAmmonia 2.8E-04 lbLead 4.3E-06 lbChlorine 3.1E-06 lbFossil Carbon Dioxide 154 lbNon-Fossil Carbon Dioxide 0.038 lbHydrochloric Acid 0.0025 lbHydrogen Fluoride 3.4E-04 lbMetals 1.6E-05 lbAntimony 1.0E-06 lbArsenic 2.7E-06 lbBeryllium 2.6E-07 lbCadmium 2.9E-06 lbChromium 4.0E-06 lbCobalt 3.0E-06 lbManganese 4.8E-06 lbMercury 1.3E-06 lbNickel 4.4E-05 lbSelenium 4.3E-06 lbAcreolin 4.9E-07 lbNitrous Oxide 2.8E-04 lbBenzene 5.0E-07 lbPerchloroethylene 4.6E-07 lbTrichloroethylene 4.6E-07 lbMethylene Chloride 2.1E-06 lbCarbon Tetrachloride 9.0E-07 lbPhenols 1.8E-06 lbNaphthalene 6.4E-08 lbDioxins 2.7E-12 lbn-Nitrosodimethylamine 1.0E-07 lbRadionuclides 1.0E-05 lb
Solid Wastes-ProcessUnspecified 0.60 lb
Solid Wastes-Fuel-related ash 9.34 lb
Waterborne Wastes-ProcessOil 0.043 lb
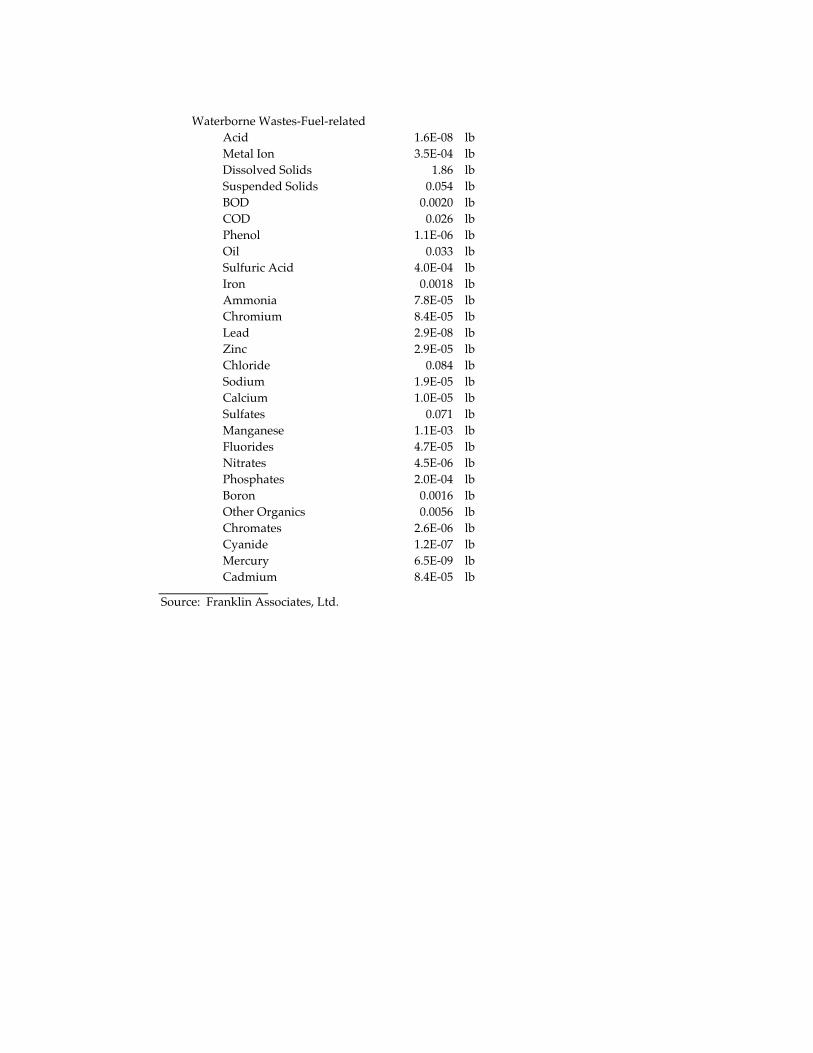
Waterborne Wastes-Fuel-relatedAcid 1.6E-08 lbMetal Ion 3.5E-04 lbDissolved Solids 1.86 lbSuspended Solids 0.054 lbBOD 0.0020 lbCOD 0.026 lbPhenol 1.1E-06 lbOil 0.033 lbSulfuric Acid 4.0E-04 lbIron 0.0018 lbAmmonia 7.8E-05 lbChromium 8.4E-05 lbLead 2.9E-08 lbZinc 2.9E-05 lbChloride 0.084 lbSodium 1.9E-05 lbCalcium 1.0E-05 lbSulfates 0.071 lbManganese 1.1E-03 lbFluorides 4.7E-05 lbNitrates 4.5E-06 lbPhosphates 2.0E-04 lbBoron 0.0016 lbOther Organics 0.0056 lbChromates 2.6E-06 lbCyanide 1.2E-07 lbMercury 6.5E-09 lbCadmium 8.4E-05 lb
Source: Franklin Associates, Ltd.

Table C-9
LCI RESULTS FOR THE CRADLE-TO-GRAVE PRODUCTION
OF 1,000 POUNDS OF ASPHALT USING CANADIAN TRANSPORTATION
(Includes Crude oil production, desalting, distillation, and deasphalting)
Energy Usage EnergyMillion Btu
Energy of Material ResourcePetroleum 20.1
Total Resource 20.1
Combustion Process EnergyElectricity 28.6 kwh 0.31Natural gas 1,482 cu ft 1.53LPG 0.27 gal 0.026Distillate oil 0.21 gal 0.029Residual oil 2.16 gal 0.32Gasoline 0.094 gal 0.012
Total Combustion Process 2.22
Precombustion Process EnergyNatural gas 189 cu ft 0.19Residual oil 0.15 gal 0.022Distillate oil 0.069 gal 0.0096Gasoline 0.085 gal 0.011LPG 0.0040 gal 3.8E-04Coal 1.46 lb 0.015Nuclear 5.9E-06 lb U238 0.0058Hydropower 0.94 thousand Btu 9.4E-04Other 0.83 thousand Btu 8.3E-04
Total Precombustion Process 0.26
Combustion Transportation EnergyOcean freighter 623 ton-miles
Diesel 0.062 gal 0.0086Residual 1.12 gal 0.17
Pipeline-petroleum products 324 ton-milesElectricity 7.12 kwh 0.079
Total Combustion Transportation 0.26
Precombustion Transportation EnergyNatural gas 14.7 cu ft 0.045Residual oil 0.052 gal 0.0078Distillate oil 0.0097 gal 0.0013Gasoline 0.0024 gal 3.0E-04LPG 0.0017 gal 1.6E-04Coal 0.24 lb 0.0061Nuclear 9.7E-07 lb U238 9.5E-04Hydropower 0.15 thousand Btu 1.5E-04Other 0.14 thousand Btu 1.4E-04
Total Precombustion Transportation 0.062
Environmental Emissions
Atmospheric Emissions-ProcessParticulates 0.060 lbHydrocarbons 6.10 lbSulfur Oxides 0.20 lbAldehydes 0.040 lbAmmonia 0.0053 lbLead 1.4E-06 lbChlorine 2.1E-04 lbHydrochloric Acid 1.6E-04 lb
Atmospheric Emissions-Fuel-relatedParticulates 0.14 lbNitrogen Oxides 1.11 lbHydrocarbons 1.07 lbSulfur Oxides 4.12 lbCarbon Monoxide 0.87 lbFormaldehyde 3.9E-06 lbOther Aldehydes 0.0095 lbMethane 0.71 lbOther Organics 0.011 lbKerosene 1.9E-05 lbAmmonia 5.0E-04 lbLead 2.2E-05 lbChlorine 6.8E-06 lbFossil Carbon Dioxide 359 lbNon-Fossil Carbon Dioxide 0.085 lbHydrochloric Acid 0.0040 lbHydrogen Fluoride 5.5E-04 lbMetals 3.5E-05 lbAntimony 6.5E-06 lbArsenic 1.4E-05 lbBeryllium 9.8E-07 lbCadmium 2.0E-05 lbChromium 1.6E-05 lbCobalt 1.9E-05 lbManganese 1.4E-05 lbMercury 4.5E-06 lbNickel 2.9E-04 lbSelenium 1.2E-05 lbAcreolin 7.9E-07 lbNitrous Oxide 4.5E-04 lbBenzene 8.5E-07 lbPerchloroethylene 7.6E-07 lbTrichloroethylene 7.5E-07 lbMethylene Chloride 3.5E-06 lbCarbon Tetrachloride 1.5E-06 lbPhenols 3.3E-06 lbNaphthalene 1.3E-07 lbDioxins 4.4E-12 lbn-Nitrosodimethylamine 1.7E-07 lbRadionuclides 1.7E-05 lb

Solid Wastes-ProcessUnspecified 3.96 lb
Solid Wastes-Fuel-related ash 18.7 lb
Waterborne Wastes-ProcessAcid 1.1E-06 lbMetal Ion 0.024 lbDissolved Solids 0.94 lbSuspended Solids 0.013 lbBOD 0.014 lbCOD 0.066 lbPhenol 7.8E-05 lbOil 0.044 lbIron 4.2E-04 lbChromium 4.5E-06 lbLead 2.0E-06 lbZinc 3.0E-05 lbAmmonia 0.0018 lb
Waterborne Wastes-Fuel-relatedAcid 3.6E-08 lbMetal Ion 7.6E-04 lbDissolved Solids 4.90 lbSuspended Solids 0.12 lbBOD 0.0052 lbCOD 0.070 lbPhenol 2.5E-06 lbOil 0.087 lbSulfuric Acid 0.0012 lbIron 0.0030 lbAmmonia 1.8E-04 lbChromium 2.2E-04 lbLead 6.4E-08 lbZinc 7.6E-05 lbChloride 0.22 lbSodium 3.1E-05 lbCalcium 1.7E-05 lbSulfates 0.18 lbManganese 0.0017 lbFluorides 7.8E-05 lbNitrates 7.3E-06 lbPhosphates 6.0E-04 lbBoron 0.0048 lbOther Organics 0.015 lbChromates 1.7E-05 lbCyanide 3.3E-07 lbMercury 1.7E-08 lbCadmium 2.2E-04 lb
Source: Franklin Associates, Ltd.
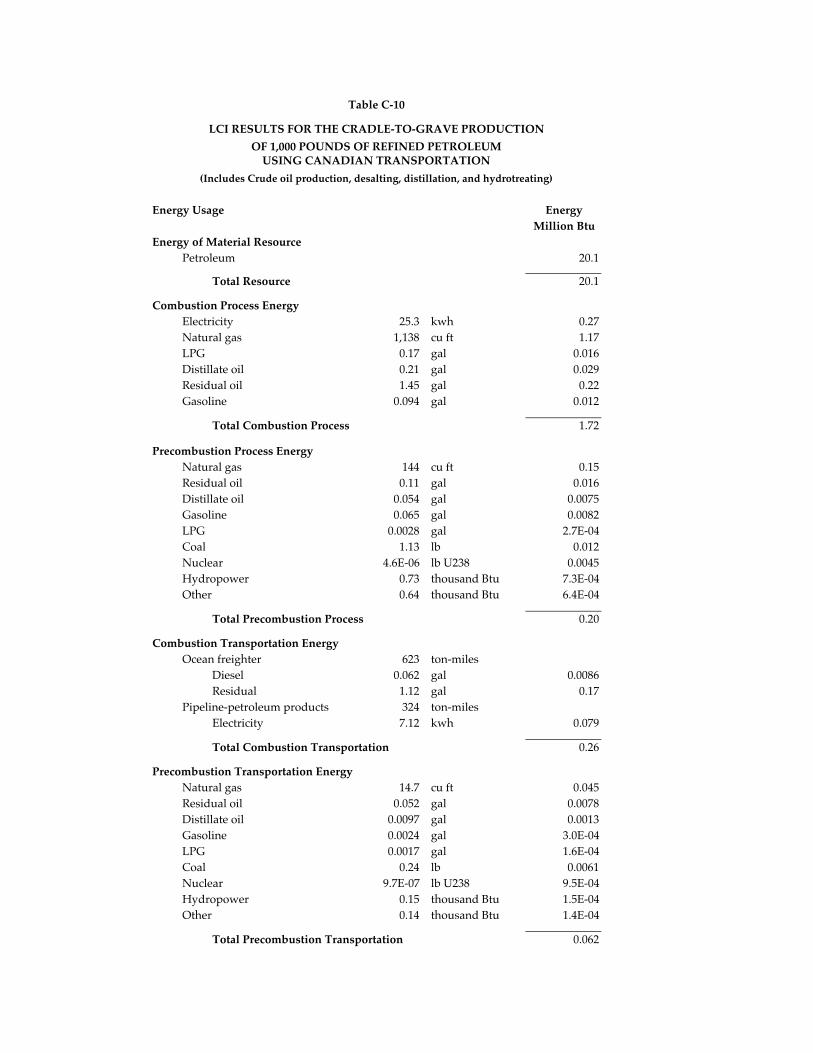
Table C-10
LCI RESULTS FOR THE CRADLE-TO-GRAVE PRODUCTION
OF 1,000 POUNDS OF REFINED PETROLEUM USING CANADIAN TRANSPORTATION
(Includes Crude oil production, desalting, distillation, and hydrotreating)
Energy Usage EnergyMillion Btu
Energy of Material ResourcePetroleum 20.1
Total Resource 20.1
Combustion Process EnergyElectricity 25.3 kwh 0.27Natural gas 1,138 cu ft 1.17LPG 0.17 gal 0.016Distillate oil 0.21 gal 0.029Residual oil 1.45 gal 0.22Gasoline 0.094 gal 0.012
Total Combustion Process 1.72
Precombustion Process EnergyNatural gas 144 cu ft 0.15Residual oil 0.11 gal 0.016Distillate oil 0.054 gal 0.0075Gasoline 0.065 gal 0.0082LPG 0.0028 gal 2.7E-04Coal 1.13 lb 0.012Nuclear 4.6E-06 lb U238 0.0045Hydropower 0.73 thousand Btu 7.3E-04Other 0.64 thousand Btu 6.4E-04
Total Precombustion Process 0.20
Combustion Transportation EnergyOcean freighter 623 ton-miles
Diesel 0.062 gal 0.0086Residual 1.12 gal 0.17
Pipeline-petroleum products 324 ton-milesElectricity 7.12 kwh 0.079
Total Combustion Transportation 0.26
Precombustion Transportation EnergyNatural gas 14.7 cu ft 0.045Residual oil 0.052 gal 0.0078Distillate oil 0.0097 gal 0.0013Gasoline 0.0024 gal 3.0E-04LPG 0.0017 gal 1.6E-04Coal 0.24 lb 0.0061Nuclear 9.7E-07 lb U238 9.5E-04Hydropower 0.15 thousand Btu 1.5E-04Other 0.14 thousand Btu 1.4E-04
Total Precombustion Transportation 0.062

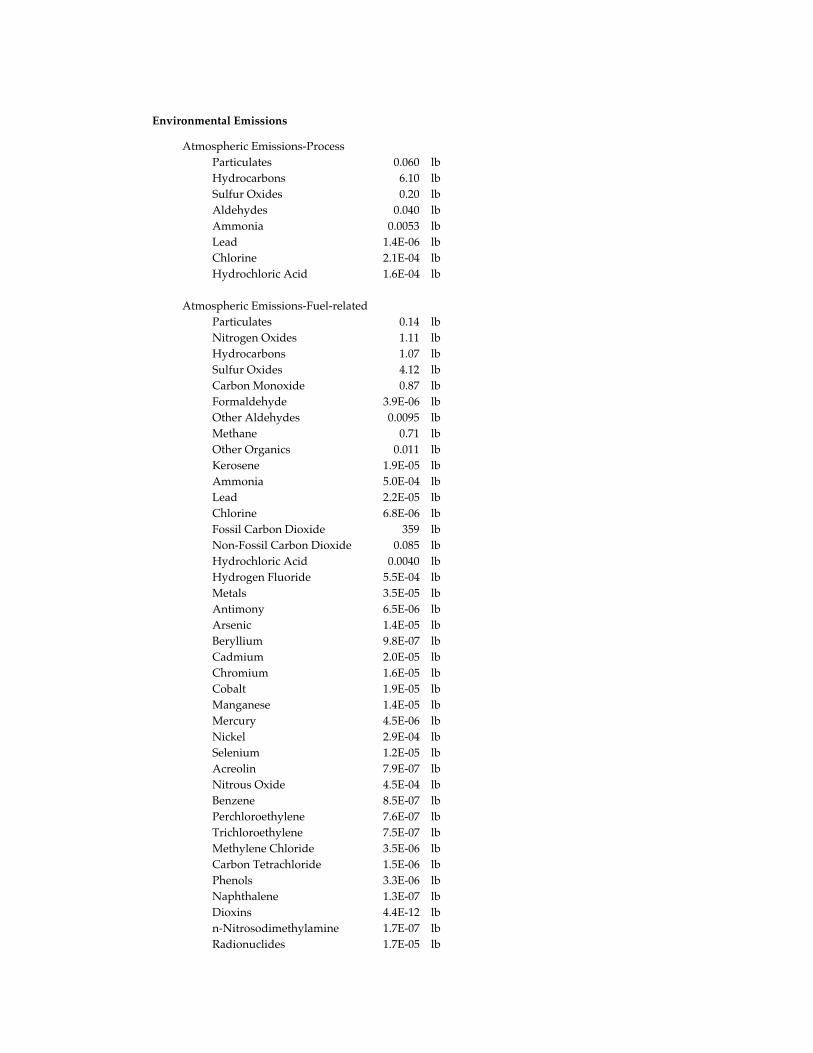
Environmental Emissions
Atmospheric Emissions-ProcessParticulates 0.060 lbHydrocarbons 6.10 lbSulfur Oxides 0.20 lbAldehydes 0.040 lbAmmonia 0.0053 lbLead 1.4E-06 lbChlorine 2.1E-04 lbHydrochloric Acid 1.6E-04 lb
Atmospheric Emissions-Fuel-relatedParticulates 0.14 lbNitrogen Oxides 1.11 lbHydrocarbons 1.07 lbSulfur Oxides 4.12 lbCarbon Monoxide 0.87 lbFormaldehyde 3.9E-06 lbOther Aldehydes 0.0095 lbMethane 0.71 lbOther Organics 0.011 lbKerosene 1.9E-05 lbAmmonia 5.0E-04 lbLead 2.2E-05 lbChlorine 6.8E-06 lbFossil Carbon Dioxide 359 lbNon-Fossil Carbon Dioxide 0.085 lbHydrochloric Acid 0.0040 lbHydrogen Fluoride 5.5E-04 lbMetals 3.5E-05 lbAntimony 6.5E-06 lbArsenic 1.4E-05 lbBeryllium 9.8E-07 lbCadmium 2.0E-05 lbChromium 1.6E-05 lbCobalt 1.9E-05 lbManganese 1.4E-05 lbMercury 4.5E-06 lbNickel 2.9E-04 lbSelenium 1.2E-05 lbAcreolin 7.9E-07 lbNitrous Oxide 4.5E-04 lbBenzene 8.5E-07 lbPerchloroethylene 7.6E-07 lbTrichloroethylene 7.5E-07 lbMethylene Chloride 3.5E-06 lbCarbon Tetrachloride 1.5E-06 lbPhenols 3.3E-06 lbNaphthalene 1.3E-07 lbDioxins 4.4E-12 lbn-Nitrosodimethylamine 1.7E-07 lbRadionuclides 1.7E-05 lb
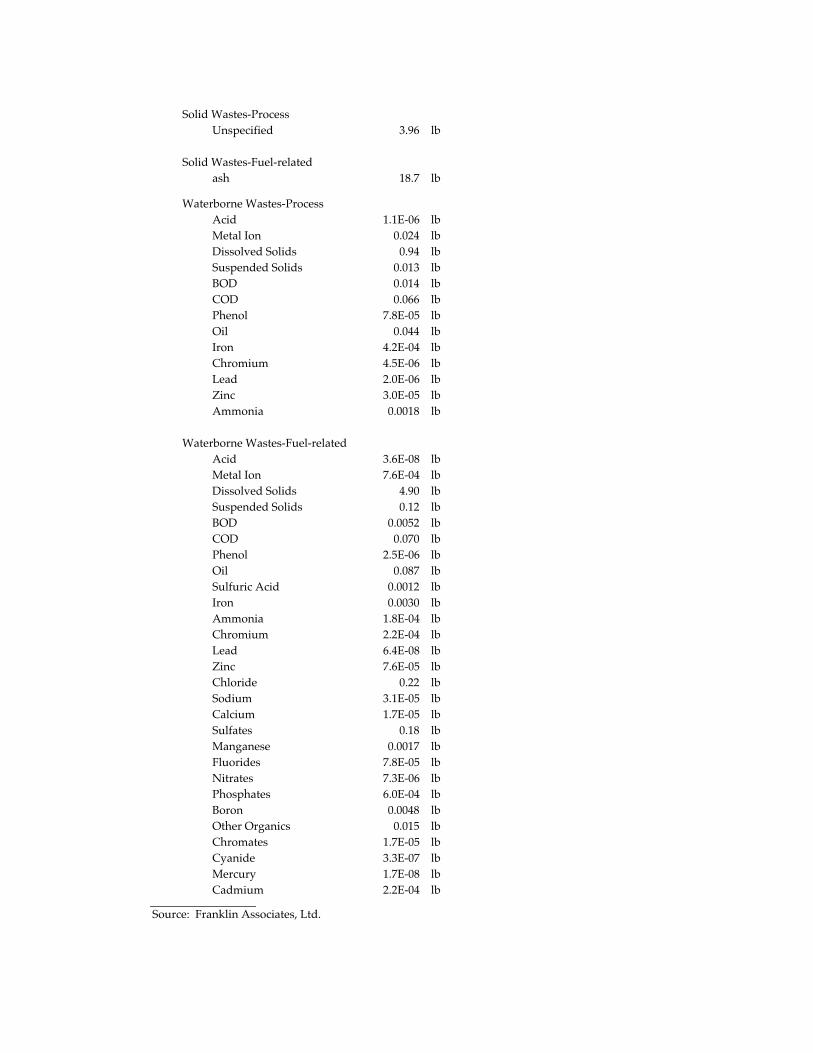
Solid Wastes-ProcessUnspecified 3.96 lb
Solid Wastes-Fuel-related ash 18.7 lb
Waterborne Wastes-ProcessAcid 1.1E-06 lbMetal Ion 0.024 lbDissolved Solids 0.94 lbSuspended Solids 0.013 lbBOD 0.014 lbCOD 0.066 lbPhenol 7.8E-05 lbOil 0.044 lbIron 4.2E-04 lbChromium 4.5E-06 lbLead 2.0E-06 lbZinc 3.0E-05 lbAmmonia 0.0018 lb
Waterborne Wastes-Fuel-relatedAcid 3.6E-08 lbMetal Ion 7.6E-04 lbDissolved Solids 4.90 lbSuspended Solids 0.12 lbBOD 0.0052 lbCOD 0.070 lbPhenol 2.5E-06 lbOil 0.087 lbSulfuric Acid 0.0012 lbIron 0.0030 lbAmmonia 1.8E-04 lbChromium 2.2E-04 lbLead 6.4E-08 lbZinc 7.6E-05 lbChloride 0.22 lbSodium 3.1E-05 lbCalcium 1.7E-05 lbSulfates 0.18 lbManganese 0.0017 lbFluorides 7.8E-05 lbNitrates 7.3E-06 lbPhosphates 6.0E-04 lbBoron 0.0048 lbOther Organics 0.015 lbChromates 1.7E-05 lbCyanide 3.3E-07 lbMercury 1.7E-08 lbCadmium 2.2E-04 lb
Source: Franklin Associates, Ltd.