Embed Size (px)
DESCRIPTION
A Life Cycle Analysis for Tomatoes in NH
Citation preview
1
A Life Cycle Analysis for Tomatoes in NH
ENGS 171
Spring 2008
Kara Pydynkowski Andrew Herchek David Drennan Wendy Chen
2
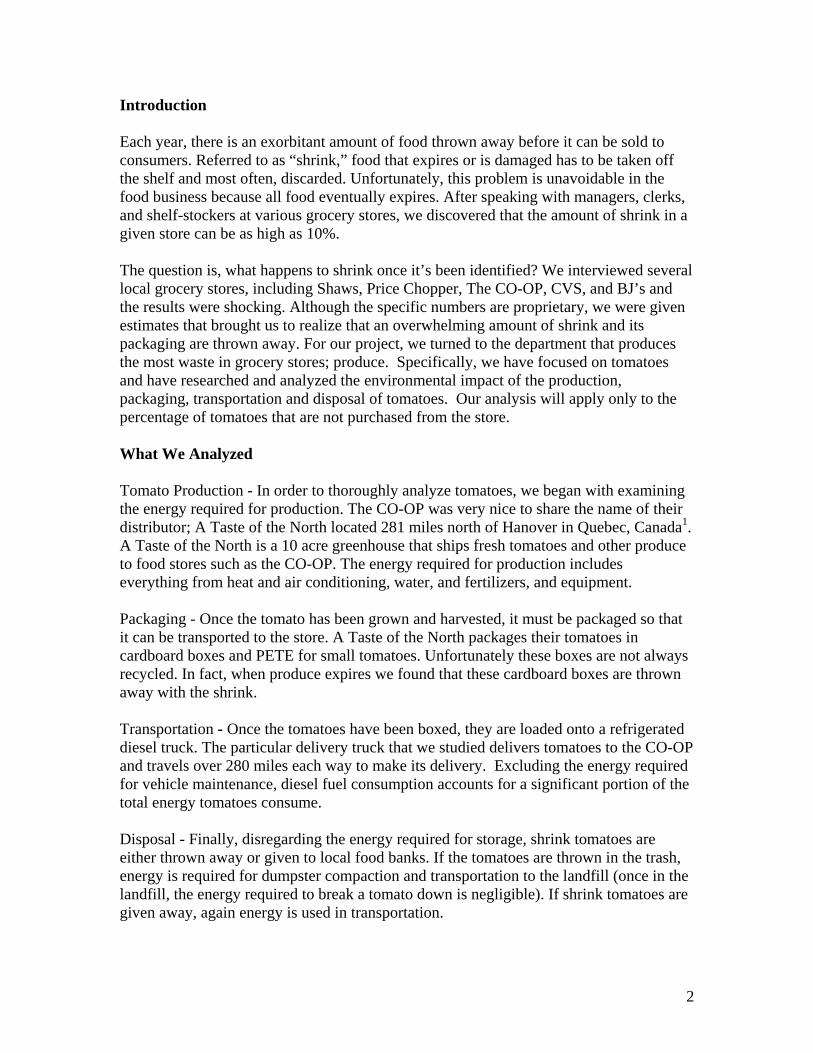
Introduction Each year, there is an exorbitant amount of food thrown away before it can be sold to consumers. Referred to as “shrink,” food that expires or is damaged has to be taken off the shelf and most often, discarded. Unfortunately, this problem is unavoidable in the food business because all food eventually expires. After speaking with managers, clerks, and shelf-stockers at various grocery stores, we discovered that the amount of shrink in a given store can be as high as 10%. The question is, what happens to shrink once it’s been identified? We interviewed several local grocery stores, including Shaws, Price Chopper, The CO-OP, CVS, and BJ’s and the results were shocking. Although the specific numbers are proprietary, we were given estimates that brought us to realize that an overwhelming amount of shrink and its packaging are thrown away. For our project, we turned to the department that produces the most waste in grocery stores; produce. Specifically, we have focused on tomatoes and have researched and analyzed the environmental impact of the production, packaging, transportation and disposal of tomatoes. Our analysis will apply only to the percentage of tomatoes that are not purchased from the store. What We Analyzed Tomato Production - In order to thoroughly analyze tomatoes, we began with examining the energy required for production. The CO-OP was very nice to share the name of their distributor; A Taste of the North located 281 miles north of Hanover in Quebec, Canada1. A Taste of the North is a 10 acre greenhouse that ships fresh tomatoes and other produce to food stores such as the CO-OP. The energy required for production includes everything from heat and air conditioning, water, and fertilizers, and equipment. Packaging - Once the tomato has been grown and harvested, it must be packaged so that it can be transported to the store. A Taste of the North packages their tomatoes in cardboard boxes and PETE for small tomatoes. Unfortunately these boxes are not always recycled. In fact, when produce expires we found that these cardboard boxes are thrown away with the shrink. Transportation - Once the tomatoes have been boxed, they are loaded onto a refrigerated diesel truck. The particular delivery truck that we studied delivers tomatoes to the CO-OP and travels over 280 miles each way to make its delivery. Excluding the energy required for vehicle maintenance, diesel fuel consumption accounts for a significant portion of the total energy tomatoes consume. Disposal - Finally, disregarding the energy required for storage, shrink tomatoes are either thrown away or given to local food banks. If the tomatoes are thrown in the trash, energy is required for dumpster compaction and transportation to the landfill (once in the landfill, the energy required to break a tomato down is negligible). If shrink tomatoes are given away, again energy is used in transportation.
3
Life Cycle Analysis Each of the five stages in tomato production consumes a large amount of energy in many different forms. From data compiled from various sources we were able to determine the energy usage throughout the entire life cycle of a unit amount of tomatoes. The amount we chose is based on the tomatoes that are grown and will potentially become shrink at the Co-op. This amounts to .3% of the tomatoes produced at a hypothetical 10 acre farm. This report details the energy from each stage separately and then examines the total LCA. Production Since the two main production procedures in the US are field tomatoes and greenhouse-grown tomatoes we detail each of the processes separately to examine the overall impact of each.
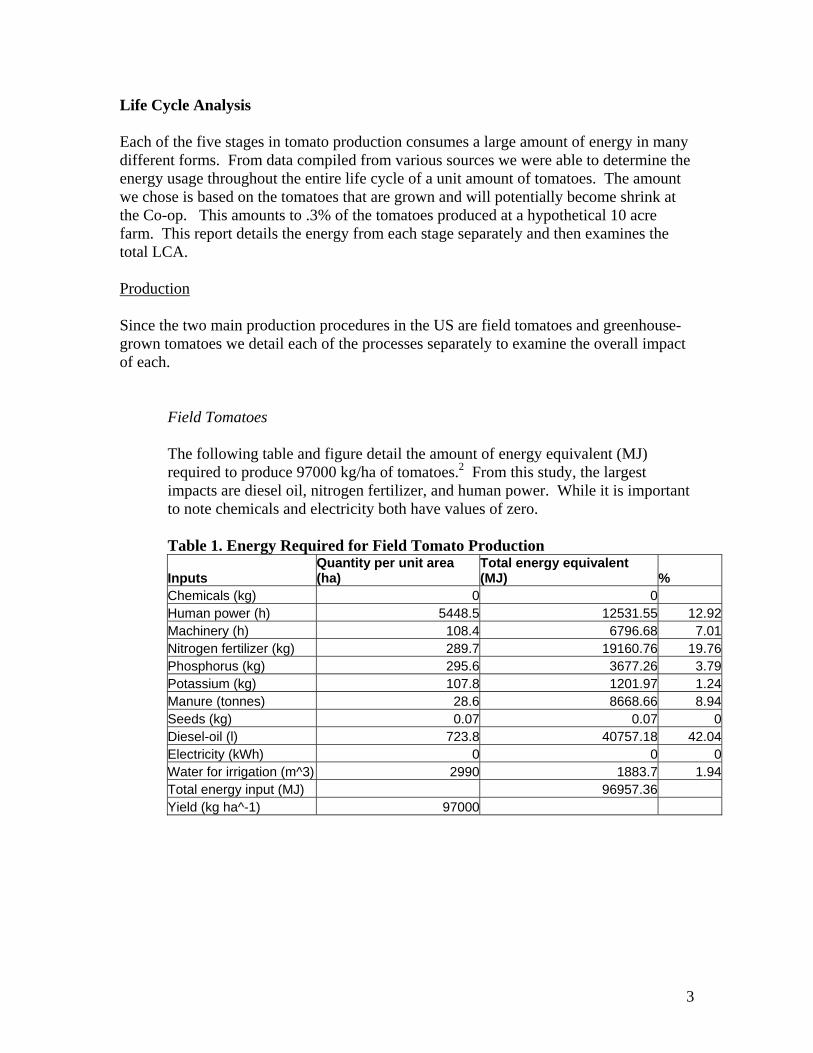
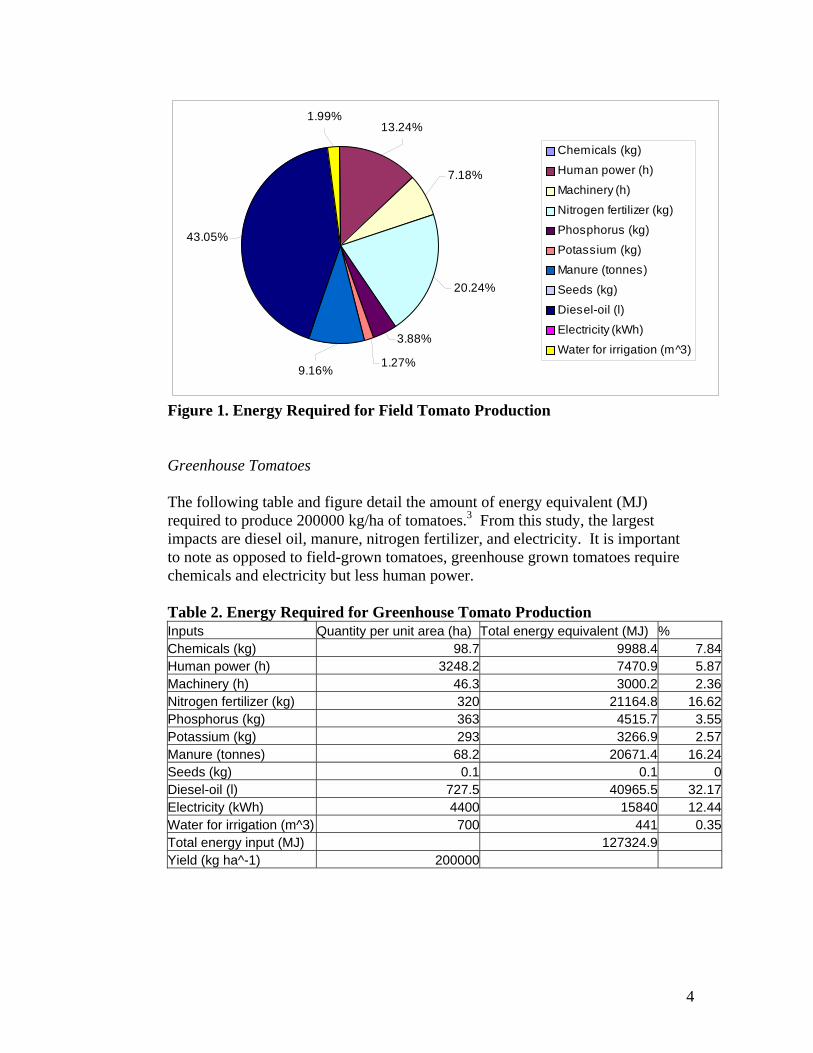
Field Tomatoes The following table and figure detail the amount of energy equivalent (MJ) required to produce 97000 kg/ha of tomatoes.2 From this study, the largest impacts are diesel oil, nitrogen fertilizer, and human power. While it is important to note chemicals and electricity both have values of zero. Table 1. Energy Required for Field Tomato Production
Inputs Quantity per unit area (ha)
Total energy equivalent (MJ) %
Chemicals (kg) 0 0 Human power (h) 5448.5 12531.55 12.92Machinery (h) 108.4 6796.68 7.01Nitrogen fertilizer (kg) 289.7 19160.76 19.76Phosphorus (kg) 295.6 3677.26 3.79Potassium (kg) 107.8 1201.97 1.24Manure (tonnes) 28.6 8668.66 8.94Seeds (kg) 0.07 0.07 0Diesel-oil (l) 723.8 40757.18 42.04Electricity (kWh) 0 0 0Water for irrigation (m^3) 2990 1883.7 1.94Total energy input (MJ) 96957.36 Yield (kg ha^-1) 97000
4
3.88%
1.99%13.24%
7.18%
20.24%
9.16%
43.05%
1.27%
Chemicals (kg)
Human power (h)
Machinery (h)
Nitrogen fertilizer (kg)
Phosphorus (kg)
Potassium (kg)
Manure (tonnes)
Seeds (kg)
Diesel-oil (l)
Electricity (kWh)
Water for irrigation (m^3)
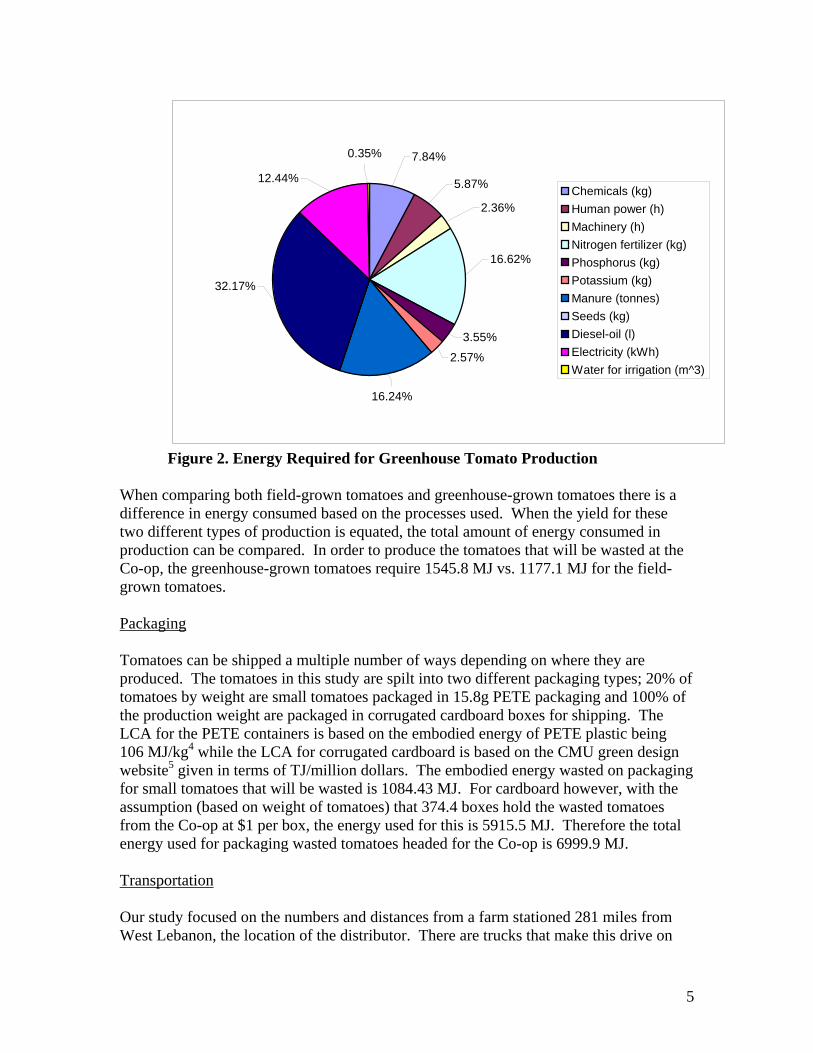
Figure 1. Energy Required for Field Tomato Production Greenhouse Tomatoes The following table and figure detail the amount of energy equivalent (MJ) required to produce 200000 kg/ha of tomatoes.3 From this study, the largest impacts are diesel oil, manure, nitrogen fertilizer, and electricity. It is important to note as opposed to field-grown tomatoes, greenhouse grown tomatoes require chemicals and electricity but less human power. Table 2. Energy Required for Greenhouse Tomato Production Inputs Quantity per unit area (ha) Total energy equivalent (MJ) % Chemicals (kg) 98.7 9988.4 7.84Human power (h) 3248.2 7470.9 5.87Machinery (h) 46.3 3000.2 2.36Nitrogen fertilizer (kg) 320 21164.8 16.62Phosphorus (kg) 363 4515.7 3.55Potassium (kg) 293 3266.9 2.57Manure (tonnes) 68.2 20671.4 16.24Seeds (kg) 0.1 0.1 0Diesel-oil (l) 727.5 40965.5 32.17Electricity (kWh) 4400 15840 12.44Water for irrigation (m^3) 700 441 0.35Total energy input (MJ) 127324.9 Yield (kg ha^-1) 200000
5
3.55%
2.57%
16.24%
32.17%
16.62%
2.36%
5.87%
7.84%0.35%
12.44%Chemicals (kg)Human power (h)Machinery (h)Nitrogen fertilizer (kg)Phosphorus (kg)Potassium (kg)Manure (tonnes)Seeds (kg)Diesel-oil (l)Electricity (kWh)Water for irrigation (m^3)
Figure 2. Energy Required for Greenhouse Tomato Production When comparing both field-grown tomatoes and greenhouse-grown tomatoes there is a difference in energy consumed based on the processes used. When the yield for these two different types of production is equated, the total amount of energy consumed in production can be compared. In order to produce the tomatoes that will be wasted at the Co-op, the greenhouse-grown tomatoes require 1545.8 MJ vs. 1177.1 MJ for the field-grown tomatoes. Packaging Tomatoes can be shipped a multiple number of ways depending on where they are produced. The tomatoes in this study are spilt into two different packaging types; 20% of tomatoes by weight are small tomatoes packaged in 15.8g PETE packaging and 100% of the production weight are packaged in corrugated cardboard boxes for shipping. The LCA for the PETE containers is based on the embodied energy of PETE plastic being 106 MJ/kg4 while the LCA for corrugated cardboard is based on the CMU green design website5 given in terms of TJ/million dollars. The embodied energy wasted on packaging for small tomatoes that will be wasted is 1084.43 MJ. For cardboard however, with the assumption (based on weight of tomatoes) that 374.4 boxes hold the wasted tomatoes from the Co-op at $1 per box, the energy used for this is 5915.5 MJ. Therefore the total energy used for packaging wasted tomatoes headed for the Co-op is 6999.9 MJ. Transportation Our study focused on the numbers and distances from a farm stationed 281 miles from West Lebanon, the location of the distributor. There are trucks that make this drive on
6
average 2.5 times a week with as many as 20 stops along the way6. We have made the assumption that the Co-op tomatoes account for about 10% of this trip since it is so far from the farm. Then, from the distributor, trucks go back and forth to the Co-op 6 times a week7. All tomatoes are shipped in refrigerated trucks, which get on average a fuel efficiency of 10 mi/gal8. With the distance driven for wasted tomatoes being 456.3 miles this amounts to 5354.4 MJ/yr of energy used to transport wasted tomatoes. Storage One of the assumptions made before doing this study was that storage of tomatoes requires no additional energy on the part of the store. They require no refrigeration and the 6% of wasted tomatoes takes up negligible amount of floor space so electricity and heating are insignificant in this case. Therefore the energy required for storage of tomatoes that will be wasted at the Co-op is 0 MJ. Disposal Based on current practices at the Co-op, tomatoes that are not appropriate for sale will be taken care of in one of two ways. First, if they can still be consumed they are set aside and given to a program called Willing Hands. Second, the tomatoes may be culled (a process of picking through “bad” produce and throwing it out) and sent out back to the trash compactor and then shipped to the landfill on a large semi-truck. For this analysis we assume 75% of tomatoes are sent to families in need through Willing Hands and 25% sent to the landfill. Willing Hands
This program uses a sprinter van (fuel efficiency of 20 mi/gal) to pick up the tomatoes and deliver them to various places around the Upper Valley for a total of about 800 miles per week9. The energy required for sending tomatoes through Willing Hands is based on the fuel efficiency of the van and the assumptions that 2% by weight of the “wasted” produce is tomatoes and 20% of the van’s travel is based on trips to or from the Co-op. This total is 859.66 MJ used transporting tomatoes that were wasted. Compactor & Landfill The energy use for the compactor is based on the energy required to run the compactor for 15 seconds 5 times a day. It is then factored in that tomatoes only require the compactor to run 2% of the time giving a total of 2.59 MJ required to run the compactor based on wasted tomatoes. Adding in a trip to the landfill which is 9.8 mi from the Co-op on a semi-truck with a fuel efficiency of 6 mi/gal, the energy required for this is 58.5 MJ. The total energy, therefore, for compacting and landfilling tomatoes for a year is 60.1 MJ.
Therefore the total amount of energy to “dispose” of wasted tomatoes is 920.76 MY/yr.
7
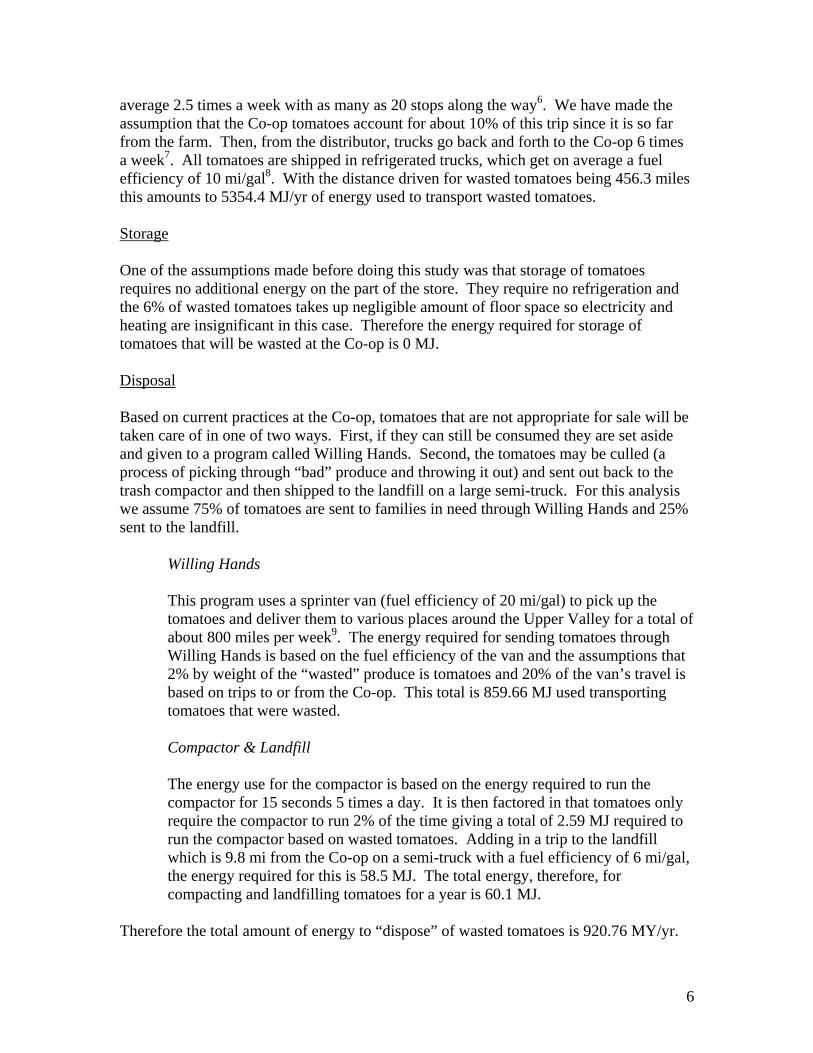
Discussion of total LCA based on Energy Usage Based on energy alone, the LCA of waste tomatoes shows that the two largest impacts are packaging and transportation. Production is actually only 10% of the energy used despite all of the perceived energy required for greenhouse production. The embodied energy of the materials required for packaging, along with the sheer amount of packages used each year contributed to 46% of the entire lifecycle. Comparatively, the distance covered by frequent trips to New Hampshire from Canada in inefficient trucks accounts for 41% of the energy usage in the lifecycle. (Refer to Appendix A for complete calculations). Table 3. Energy Consumption of Greenhouse-grown Tomatoes Production (MJ/yr) 1545.797Packaging (MJ/yr) 6711.176Transportation (MJ/yr) 6278.421Storage 0Disposal (Willing Hands) 920.7598
LCA - Greenhouse Tomatoes
43%
41%
6% 10%
Production (MJ/yr)
Packaging (MJ/yr)
Transportation (MJ/yr)Storage
Disposal (Willing Hands)
Figure 3. LCA of Energy Usage for Greenhouse-grown tomatoes Alternatives Based on the different levels of Design for Environment (DfE) there are many different opportunities to reduce the energy consumption during the life cycle of a tomato. We will start our analysis with the basic ecology principles: avoidance, reduction, reuse, recycle, recovery, treatment, and safe disposal.
8
Avoidance We can avoid the environmental impact of a tomato by simply eliminating the production of tomatoes completely. This is not a feasible option, however, because tomatoes are a central ingredient for many popular foods around the world. There may be a way to avoid the energy input to a greenhouse or the elimination of certain chemicals through different technologies. Packaging could be eliminated entirely as well as transportation if tomatoes were produced onsite. Reduction The next step would be to examine the reduction of wasted tomatoes. There could be a system designed so that each tomato that is produced is used for consumption in some form or another. A reduction in weight of the packaging could easily reduce the amount of cardboard or PETE produced yearly. There may be a potential to redesign the boxes so that more tomatoes shipped per box would reduce the total amount of boxes used. To reduce energy required during transportation, more fuel-efficient trucks could be used, perhaps non-refrigerated trucks or smaller trucks with better mileage. A different disposal method could also reduce energy; the system for Willing Hands could be reassessed to provide the most fuel-efficient process/route. Maybe it is more efficient for “Willing Hands” customers to pick up their food when they come to the store. Reuse Materials used throughout the life of the tomatoes may have byproducts and wastes that could be reused in the process again or to supplement an existing process thus getting the maximum use out of any material. Tomatoes wasted at the Co-op could be returned on shipment trucks (in a non-consumable form to avoid problems) for use in compost and reuse on the farm. Or along the same lines, environmentally conscious customers could take home small tubs of compost to add to their own compost piles off site from the Co-op. For packaging, a reusable container for shipment from farm to store and visa versa would reduce the amount of packaging produced each year through the possibility of reuse. Farmers and the stores can each invest in this type of packaging (thus making both parties responsible) that could have a lifetime that far exceeds that of the corrugated cardboard boxes.
9
Recycle Consumers like to think that a majority of tomato packaging, including corrugated cardboard and PETE packages are recycled but that is not always the case. A program to encourage complete recycling or a different type of material that is easier to recycle might also be another option. Compost piles on grocery store property could be examined so that the nutrients from the tomatoes can be reused. Another recycling option might be to give shrink tomatoes to animals as they are less picky about expired or damaged food than humans. Energy Recovery If the boxes are not recycled they could be incinerated to produce heat and therefore energy for many applications in the process. Compost piles could also be used to capture some of the natural gas from the decomposing tomatoes. Treatment Fuel used for transportation could be treated so that its impact is minimized or made to last longer. Furthermore, plastics or cardboard could be treated so that they can be more easily disposed of or recycled. Preservatives may be added to tomatoes increasing their longevity. In addition, stronger packaging could be used to reduce the number of tomatoes that get damaged before they are purchased. Safe Disposal The packaging that is created could be made of materials that are safe to biodegrade quickly in a landfill or another landfill type setting. Possible Alternatives- in Depth Since we are interested in making the life cycle of tomato production to consumption more energy efficient we must examine alternatives at each of the stages individually. These alternatives originated from ideas based on the hierarchy of pollution prevention and design for environment mentioned above. Production Our LCA analysis concluded that approximately 10% of the energy required to grow greenhouse tomatoes was due to production. Furthermore, we found that nearly one third of the energy expended during production was from oil (mostly for heating the greenhouse in the colder months). To reduce the use of oil for tomato production, we found a number of different alternatives.
10
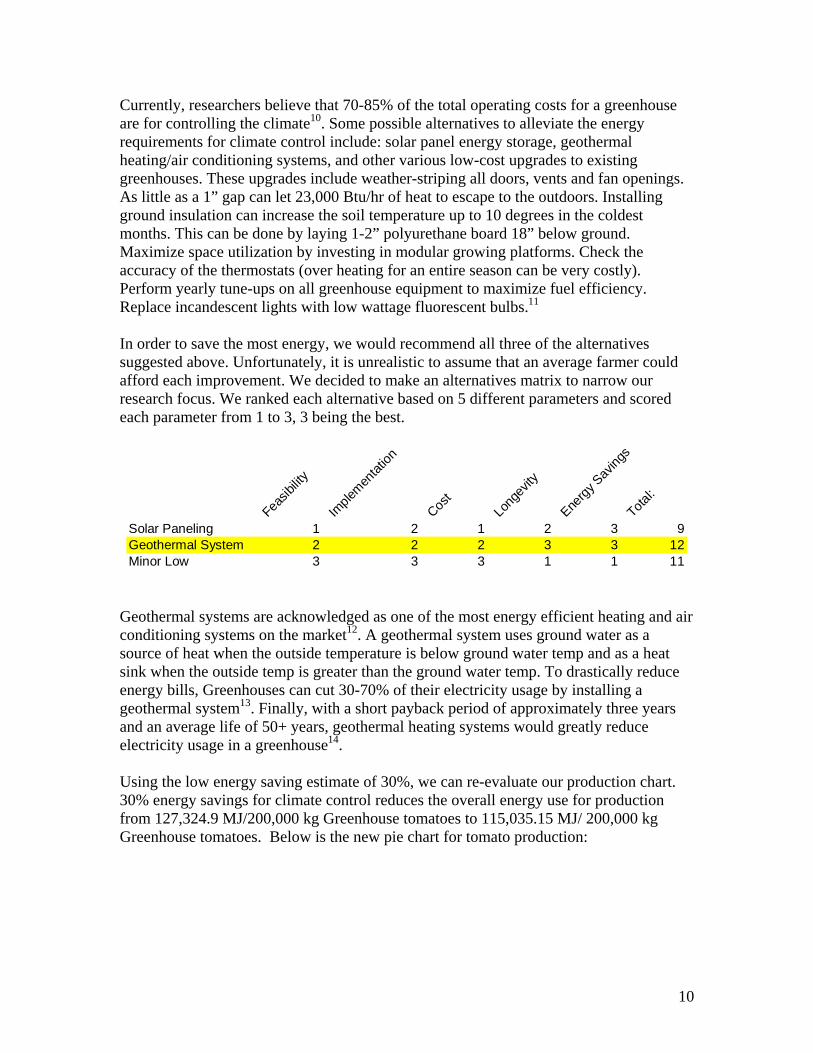
Currently, researchers believe that 70-85% of the total operating costs for a greenhouse are for controlling the climate10. Some possible alternatives to alleviate the energy requirements for climate control include: solar panel energy storage, geothermal heating/air conditioning systems, and other various low-cost upgrades to existing greenhouses. These upgrades include weather-striping all doors, vents and fan openings. As little as a 1” gap can let 23,000 Btu/hr of heat to escape to the outdoors. Installing ground insulation can increase the soil temperature up to 10 degrees in the coldest months. This can be done by laying 1-2” polyurethane board 18” below ground. Maximize space utilization by investing in modular growing platforms. Check the accuracy of the thermostats (over heating for an entire season can be very costly). Perform yearly tune-ups on all greenhouse equipment to maximize fuel efficiency. Replace incandescent lights with low wattage fluorescent bulbs.11 In order to save the most energy, we would recommend all three of the alternatives suggested above. Unfortunately, it is unrealistic to assume that an average farmer could afford each improvement. We decided to make an alternatives matrix to narrow our research focus. We ranked each alternative based on 5 different parameters and scored each parameter from 1 to 3, 3 being the best.
Feasib
ility
Imple
mentat
ion
Cost
Long
evity
Energy
Saving
s
Total:
Solar Paneling 1 2 1 2 3 9Geothermal System 2 2 2 3 3 12Minor Low 3 3 3 1 1 11
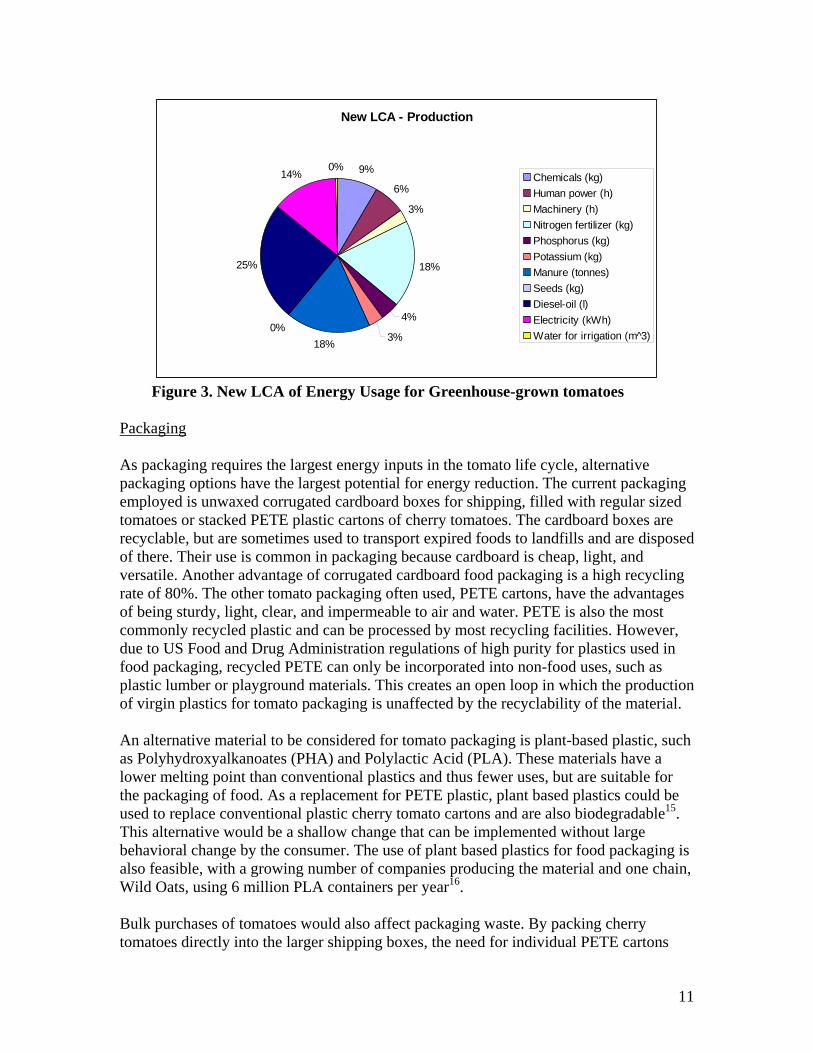
Geothermal systems are acknowledged as one of the most energy efficient heating and air conditioning systems on the market12. A geothermal system uses ground water as a source of heat when the outside temperature is below ground water temp and as a heat sink when the outside temp is greater than the ground water temp. To drastically reduce energy bills, Greenhouses can cut 30-70% of their electricity usage by installing a geothermal system13. Finally, with a short payback period of approximately three years and an average life of 50+ years, geothermal heating systems would greatly reduce electricity usage in a greenhouse14. Using the low energy saving estimate of 30%, we can re-evaluate our production chart. 30% energy savings for climate control reduces the overall energy use for production from 127,324.9 MJ/200,000 kg Greenhouse tomatoes to 115,035.15 MJ/ 200,000 kg Greenhouse tomatoes. Below is the new pie chart for tomato production:
11
New LCA - Production
9%
6%
3%
18%
4%
3%18%0%
25%
14%0%
Chemicals (kg)Human power (h)Machinery (h)Nitrogen fertilizer (kg)Phosphorus (kg)Potassium (kg)Manure (tonnes)Seeds (kg)Diesel-oil (l)Electricity (kWh)Water for irrigation (m^3)
Figure 3. New LCA of Energy Usage for Greenhouse-grown tomatoes Packaging As packaging requires the largest energy inputs in the tomato life cycle, alternative packaging options have the largest potential for energy reduction. The current packaging employed is unwaxed corrugated cardboard boxes for shipping, filled with regular sized tomatoes or stacked PETE plastic cartons of cherry tomatoes. The cardboard boxes are recyclable, but are sometimes used to transport expired foods to landfills and are disposed of there. Their use is common in packaging because cardboard is cheap, light, and versatile. Another advantage of corrugated cardboard food packaging is a high recycling rate of 80%. The other tomato packaging often used, PETE cartons, have the advantages of being sturdy, light, clear, and impermeable to air and water. PETE is also the most commonly recycled plastic and can be processed by most recycling facilities. However, due to US Food and Drug Administration regulations of high purity for plastics used in food packaging, recycled PETE can only be incorporated into non-food uses, such as plastic lumber or playground materials. This creates an open loop in which the production of virgin plastics for tomato packaging is unaffected by the recyclability of the material. An alternative material to be considered for tomato packaging is plant-based plastic, such as Polyhydroxyalkanoates (PHA) and Polylactic Acid (PLA). These materials have a lower melting point than conventional plastics and thus fewer uses, but are suitable for the packaging of food. As a replacement for PETE plastic, plant based plastics could be used to replace conventional plastic cherry tomato cartons and are also biodegradable15. This alternative would be a shallow change that can be implemented without large behavioral change by the consumer. The use of plant based plastics for food packaging is also feasible, with a growing number of companies producing the material and one chain, Wild Oats, using 6 million PLA containers per year16. Bulk purchases of tomatoes would also affect packaging waste. By packing cherry tomatoes directly into the larger shipping boxes, the need for individual PETE cartons
12
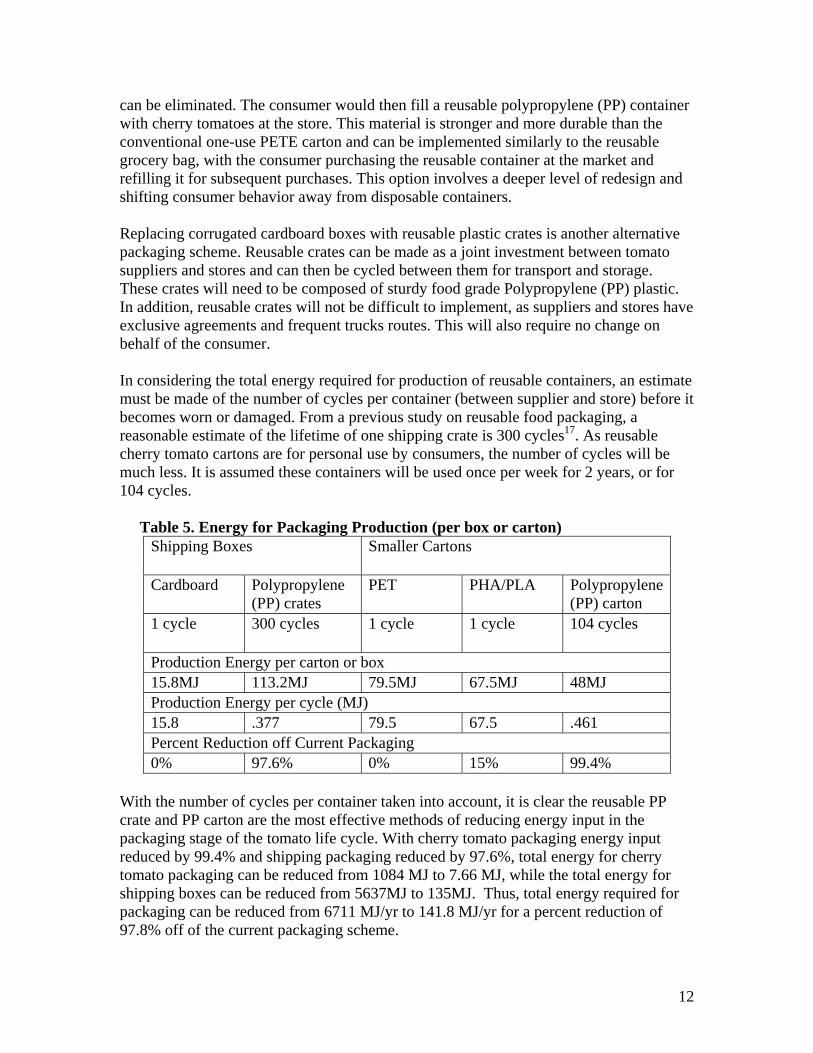
can be eliminated. The consumer would then fill a reusable polypropylene (PP) container with cherry tomatoes at the store. This material is stronger and more durable than the conventional one-use PETE carton and can be implemented similarly to the reusable grocery bag, with the consumer purchasing the reusable container at the market and refilling it for subsequent purchases. This option involves a deeper level of redesign and shifting consumer behavior away from disposable containers. Replacing corrugated cardboard boxes with reusable plastic crates is another alternative packaging scheme. Reusable crates can be made as a joint investment between tomato suppliers and stores and can then be cycled between them for transport and storage. These crates will need to be composed of sturdy food grade Polypropylene (PP) plastic. In addition, reusable crates will not be difficult to implement, as suppliers and stores have exclusive agreements and frequent trucks routes. This will also require no change on behalf of the consumer. In considering the total energy required for production of reusable containers, an estimate must be made of the number of cycles per container (between supplier and store) before it becomes worn or damaged. From a previous study on reusable food packaging, a reasonable estimate of the lifetime of one shipping crate is 300 cycles17. As reusable cherry tomato cartons are for personal use by consumers, the number of cycles will be much less. It is assumed these containers will be used once per week for 2 years, or for 104 cycles. Table 5. Energy for Packaging Production (per box or carton)
Shipping Boxes Smaller Cartons
Cardboard
Polypropylene (PP) crates
PET PHA/PLA Polypropylene (PP) carton
1 cycle 300 cycles 1 cycle 1 cycle 104 cycles
Production Energy per carton or box 15.8MJ 113.2MJ 79.5MJ 67.5MJ 48MJ Production Energy per cycle (MJ) 15.8 .377 79.5 67.5 .461 Percent Reduction off Current Packaging 0% 97.6% 0% 15% 99.4%
With the number of cycles per container taken into account, it is clear the reusable PP crate and PP carton are the most effective methods of reducing energy input in the packaging stage of the tomato life cycle. With cherry tomato packaging energy input reduced by 99.4% and shipping packaging reduced by 97.6%, total energy for cherry tomato packaging can be reduced from 1084 MJ to 7.66 MJ, while the total energy for shipping boxes can be reduced from 5637MJ to 135MJ. Thus, total energy required for packaging can be reduced from 6711 MJ/yr to 141.8 MJ/yr for a percent reduction of 97.8% off of the current packaging scheme.
13
Transportation Accounting for about 36% of the energy use per year, transportation is one of the most energy-consuming stages of a tomato’s life. Exclusively due to automobiles, the variables that affect the amount of energy consumed in transportation are distance of trips, frequency of trips, type of automobile used, and type of fuel. Taste of the North farm supplies a variety of fruits and vegetables to a number of locations around the northeast United States and Quebec. Delivery routes and frequency of trips are determined by the demand and location of the clients that the farm serves. To reduce the number of trips delivering produce, the farm should carefully plan and optimize routes that could be determined by studying regular delivery demand and fluctuations due to seasonality. Generally speaking, the fewer trips made, the less fuel will be consumed, as long as the routes are well planned. To reduce the number of miles traveled to ship tomatoes to grocers, the farm could choose to only produce goods for local distributors only, and deliver only within a certain distance from farm. This could be less economical for the farm, and Taste of the North may in fact be the closest off-season tomato producer for the Co-op. It can be assumed that the Taste of the North farm currently optimizes its routes and only delivers to locations that economically benefit the business. It is likely that it would be expensive and time consuming to further optimize routes and impractical to expect the farm to stop supplying to locations that provide profit. For these reasons, we do not suggest these as our primary solutions for reducing the energy in transportation. The area of transportation that could best improve the energy consumption is the fuel efficiency of the automobile used to carry the tomatoes. To reduce the fuel used per mile, there are high efficiency refrigerated vans and trucks that could be used for transportation of the products. The best alternative is a diesel-electric hybrid refrigerated truck. This could reduce the current fuel efficiency of about 10 miles per gallon (MPG) to approximately 18 MPG18. The hybrid technology utilizes an onboard battery and electric motor to power the vehicle at slow speed and when stopped19. This means that there will not be wasted gasoline when idling and moving between deliveries in city traffic. The decreased use of diesel fuel per mile will also in turn reduce the CO2 and NOX emissions. (This fact is something to be noted but we did analyze it in the scope of this project.) Switching the truck used between the farm to the Co-Op to a hybrid would reduce the fuel consumption by 45%, reducing the current 5354 MJ/year used for transportation to 2975 MJ/year. Future alternative solutions for automobiles may soon enter the spectrum as transportation technology increases. Certain other fuels or energy sources may become more viable, such as bio-diesel or fuel cells. Depending on these technologies’ implementation, this could reduce the energy use of tomato transportation even further.
14
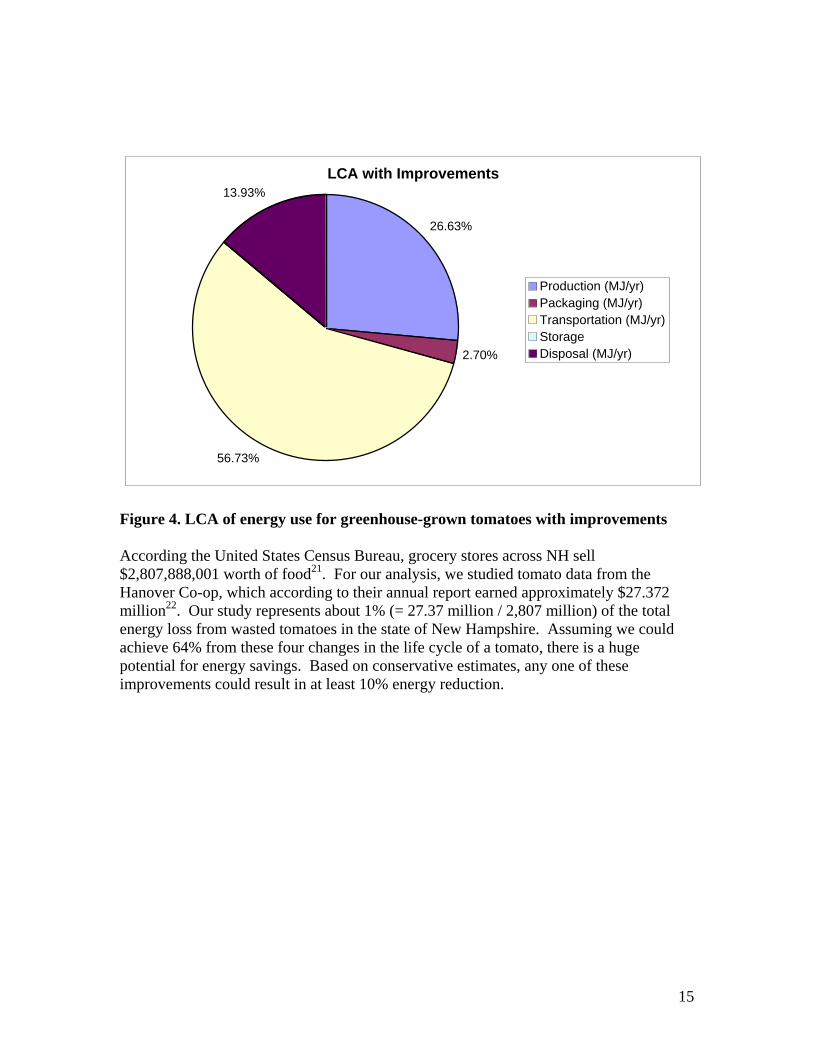
Disposal Disposal only accounts for about 6% of the energy usage of tomatoes but improvements can still be made. Willing Hands uses about 40 gallons of diesel fuel per week based on the 800 miles they travel to and from stores and local food banks20. However, since this program is important to the Upper Valley we do not want to suggest that it be eliminated. One possible alternative might be to assign identification to customers of both Willing Hands and the Co-op and allow customers to pick up their food there. This would combine two trips into one for the customer as well as well as reduce the distance of the weekly route for the sprinter van. If an estimated 15% of Willing Hands receivers use this method then the energy required per year for these tomatoes would reduce to 730.71 MJ/yr. Another possibility to reduce the impact of this program would be to transport the food in vehicles that get better mileage. This however is a task for future technology as 20 mpg for a refrigerated van of its size and weight is comparable to some of the new hybrids. In order to employ hybrids in the Willing Hands fleet less food would be carried at once requiring multiple trips and therefore more energy. The only feasible idea for reducing the energy of this stage would be in reducing the length of the route to save fuel. The energy used to landfill tomatoes, however, is a complete waste of energy and should be eliminated entirely. With the reductions in Willing Hands and the elimination of land filling then the total energy used to “dispose” of tomatoes would be 730.71 vs. the original 920.76 MJ/yr. Conclusions Ideally, the waste of tomatoes would be eliminated, making this life cycle analysis unnecessary. However, due to the impossibility of this goal we are forced to draw conclusions from the feasible alternatives. For the production stage, we found the use of geothermal heating reduced greenhouse energy use by 9.7%. Reusable shipping containers and packaging reduced energy use in the packaging stage by 97.8%. Transportation energy requirements were then reduced by 45% through the use of hybrid vehicles. Lastly, slight improvements to the Willing Hands program and the elimination of landfill trips decreased energy use in disposal by 21%. These reductions amount to a total net energy savings of 64%. The table and figure below illustrate the new LCA with each of these improvements in the life cycle of tomatoes. Table 6. Energy consumption of greenhouse-grown tomatoes with improvements Production (MJ/yr) 1396.59Packaging (MJ/yr) 141.8Transportation (MJ/yr) 2975Storage 0Disposal (MJ/yr) 730.71
15
LCA with Improvements
26.63%
2.70%
56.73%
13.93%
Production (MJ/yr) Packaging (MJ/yr)Transportation (MJ/yr)StorageDisposal (MJ/yr)
Figure 4. LCA of energy use for greenhouse-grown tomatoes with improvements According the United States Census Bureau, grocery stores across NH sell $2,807,888,001 worth of food21. For our analysis, we studied tomato data from the Hanover Co-op, which according to their annual report earned approximately $27.372 million22. Our study represents about 1% (= 27.37 million / 2,807 million) of the total energy loss from wasted tomatoes in the state of New Hampshire. Assuming we could achieve 64% from these four changes in the life cycle of a tomato, there is a huge potential for energy savings. Based on conservative estimates, any one of these improvements could result in at least 10% energy reduction.
16
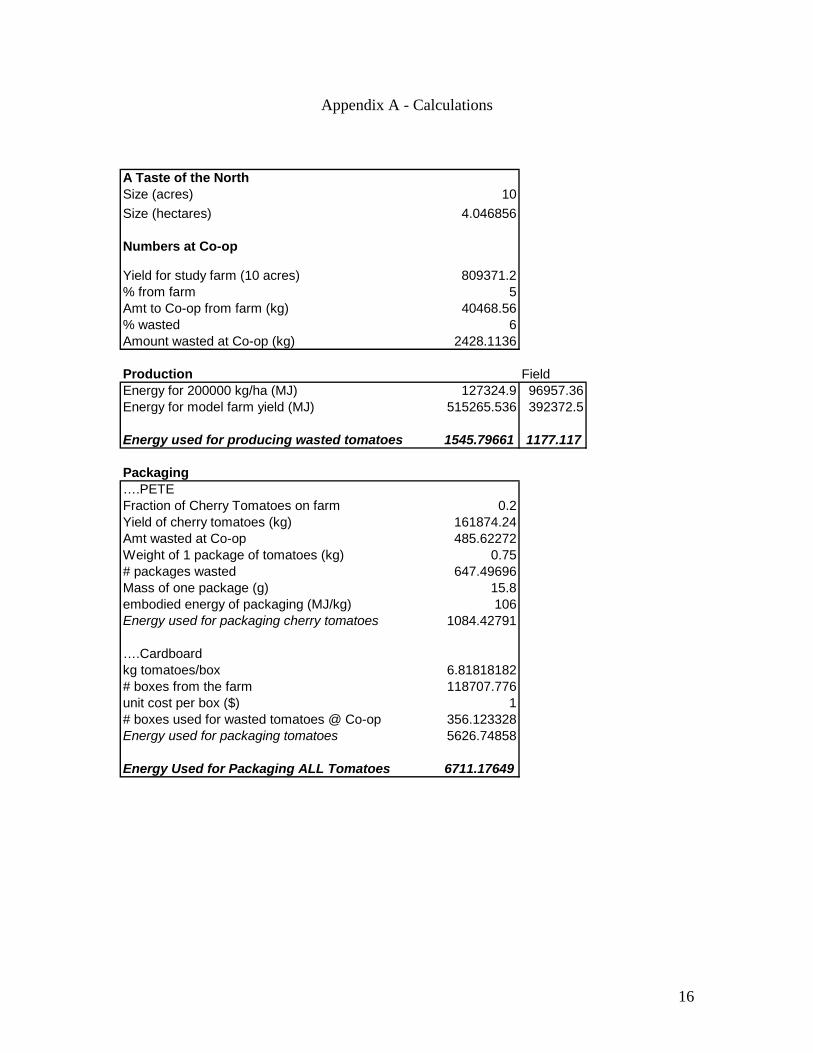
Appendix A - Calculations A Taste of the NorthSize (acres) 10Size (hectares) 4.046856
Numbers at Co-op
Yield for study farm (10 acres) 809371.2% from farm 5Amt to Co-op from farm (kg) 40468.56% wasted 6Amount wasted at Co-op (kg) 2428.1136
Production FieldEnergy for 200000 kg/ha (MJ) 127324.9 96957.36Energy for model farm yield (MJ) 515265.536 392372.5
Energy used for producing wasted tomatoes 1545.79661 1177.117
Packaging….PETEFraction of Cherry Tomatoes on farm 0.2Yield of cherry tomatoes (kg) 161874.24Amt wasted at Co-op 485.62272Weight of 1 package of tomatoes (kg) 0.75# packages wasted 647.49696Mass of one package (g) 15.8embodied energy of packaging (MJ/kg) 106Energy used for packaging cherry tomatoes 1084.42791
….Cardboardkg tomatoes/box 6.81818182# boxes from the farm 118707.776unit cost per box ($) 1# boxes used for wasted tomatoes @ Co-op 356.123328Energy used for packaging tomatoes 5626.74858
Energy Used for Packaging ALL Tomatoes 6711.17649
17
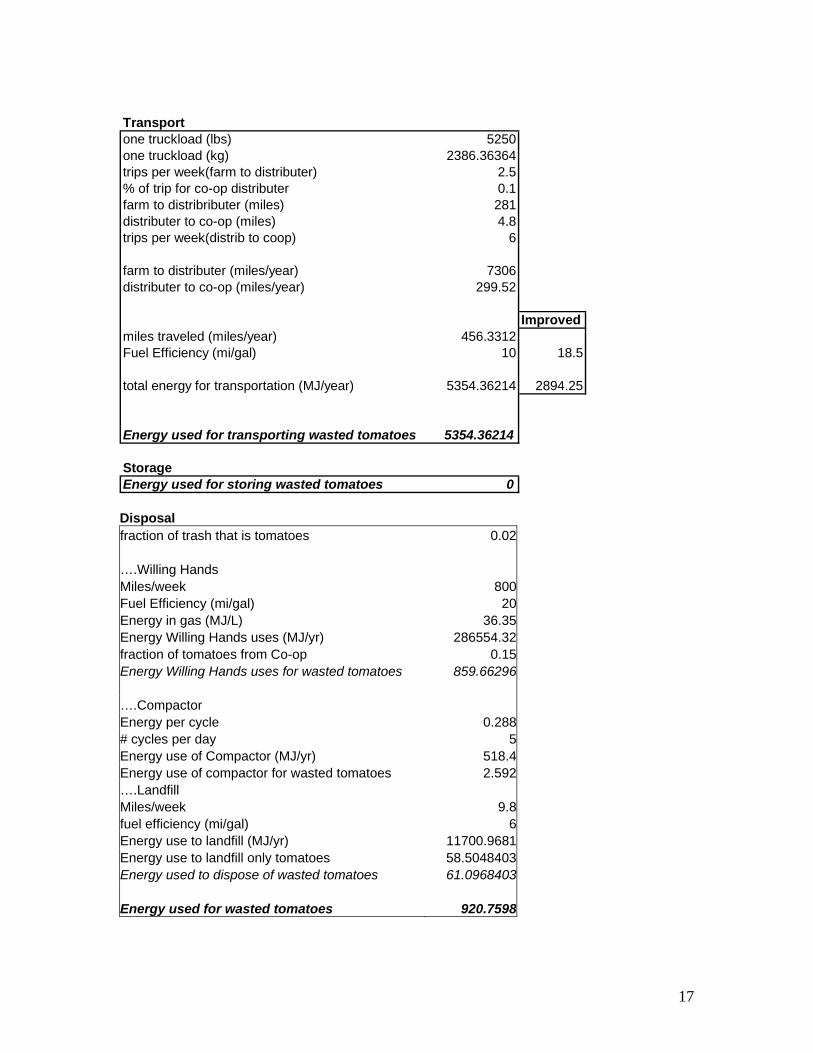
Transportone truckload (lbs) 5250one truckload (kg) 2386.36364trips per week(farm to distributer) 2.5% of trip for co-op distributer 0.1farm to distribributer (miles) 281distributer to co-op (miles) 4.8trips per week(distrib to coop) 6
farm to distributer (miles/year) 7306distributer to co-op (miles/year) 299.52
Improvedmiles traveled (miles/year) 456.3312Fuel Efficiency (mi/gal) 10 18.5
total energy for transportation (MJ/year) 5354.36214 2894.25
Energy used for transporting wasted tomatoes 5354.36214
StorageEnergy used for storing wasted tomatoes 0
Disposal fraction of trash that is tomatoes 0.02 ….Willing Hands Miles/week 800Fuel Efficiency (mi/gal) 20Energy in gas (MJ/L) 36.35Energy Willing Hands uses (MJ/yr) 286554.32fraction of tomatoes from Co-op 0.15Energy Willing Hands uses for wasted tomatoes 859.66296 ….Compactor Energy per cycle 0.288# cycles per day 5Energy use of Compactor (MJ/yr) 518.4Energy use of compactor for wasted tomatoes 2.592….Landfill Miles/week 9.8fuel efficiency (mi/gal) 6Energy use to landfill (MJ/yr) 11700.9681Energy use to landfill only tomatoes 58.5048403Energy used to dispose of wasted tomatoes 61.0968403 Energy used for wasted tomatoes 920.7598
18
Cover Photo: http://upload.wikimedia.org/wikipedia/commons/8/89/Tomato_je.jpg 1 http://tasteofthenorth.com/ 2Kemal Esengun, Gülistan Erdal, Orhan Gündüz, and Hilmi Erdal. “An economic analysis and energy use in stake-tomato production in Tokat province of Turkey”. Science Direct. http://www.sciencedirect.com/science?_ob=ArticleURL&_udi=B6V4S-4M4CVJJ-2&_user=4257664&_rdoc=1&_fmt=&_orig=search&_sort=d&view=c&_acct=C000022698&_version=1&_urlVersion=0&_userid=4257664&md5=a581f8ec440553d6506dc77259419b7a#bib25 3Burhan Ozkan, Ahmet Kurklu, and Handan Akcaoz. “An input–output energy analysis in greenhouse vegetable production: a case study for Antalya region of Turkey”. Science Direct. http://www.sciencedirect.com/science?_ob=ArticleURL&_udi=B6V22-48TM585-2&_user=4257664&_rdoc=1&_fmt=&_orig=search&_sort=d&view=c&_acct=C000022698&_version=1&_urlVersion=0&_userid=4257664&md5=b1c7508d069dbe82065b14e9de72086c#sec3.2 4 "Embodied Energy Coefficients". http://www.victoria.ac.nz/cbpr/documents/pdfs/ee-coefficients.pdf 5 http://www.eiolca.net/use.html 6 Conversation with Owner of Taste of the North, Eric Frechette, 5/5/08 7 Conversation with Co-op produce manager, Jack, 5/26/08 8 email from owner of Taste of the North, Eric Frechette 5/26/08 9 Conversation with Willing Hands employee on 4/29/08 10http://www.hrt.msu.edu/Energy/Notebook/pdf/Sec3/Greenhouse_Energy_Conservation_and_Alternatives_by_Rorabaugh_et_al.pdf 11http://www.hort.uconn.edu/ipm/greenhs/bartok/htms/Greenhouse%20Energy%20Conservation%20Checklist.htm 12 http://en.wikipedia.org/wiki/Geothermal_exchange_heat_pump#cite_note-ghpcFAQ-9 13 http://geoexchange.org/forum/announcement.php?f=110 14 http://www.econar.com/faq.htm 15 Gerngross, Tillman U. and Steven C. Slater. “How Green are Green Plastics?”. Scientific American. August 2000. 16 Royle, Elizabeth. “Corn Plastic to the Rescue”. Smithsonian Magazine. August 2006. http://www.smithsonianmag.com/science-nature/plastic.html 17 Life Cycle Inventory of Reusable Plastic Containers and Display-Ready Corrugated Containers Used for Fresh Produce Applications. Reusable Pallet and Container Coalition, Inc. November 2004 http://usereusables.com/downloads/LCI%20Preface%20&%20Executive%20Summary.pdf 18 http://en.wikipedia.org/wiki/Fuel_efficiency 19 http://en.wikipedia.org/wiki/Hybrid_vehicle 20 http://www.willinghandsinc.org/learnmore.htm 21 http://www.census.gov/econ/census02/data/nh/NH000_44.HTM#N445 22 http://www.coopfoodstore.com/files/coop2007annualreport.pdf