Embed Size (px)
Citation preview
A Lean Six Sigma Case Study: Medication Reconciliation
Vickie L. Kamataris, RN, MSN, HCSM, CPHQ, LSSMBBE-Squared Performance Partners
1

A Road Less Traveled
2Copyright© 2016 E-Squared Performance Partners All Rights Reserved
What is Medication Reconciliation?
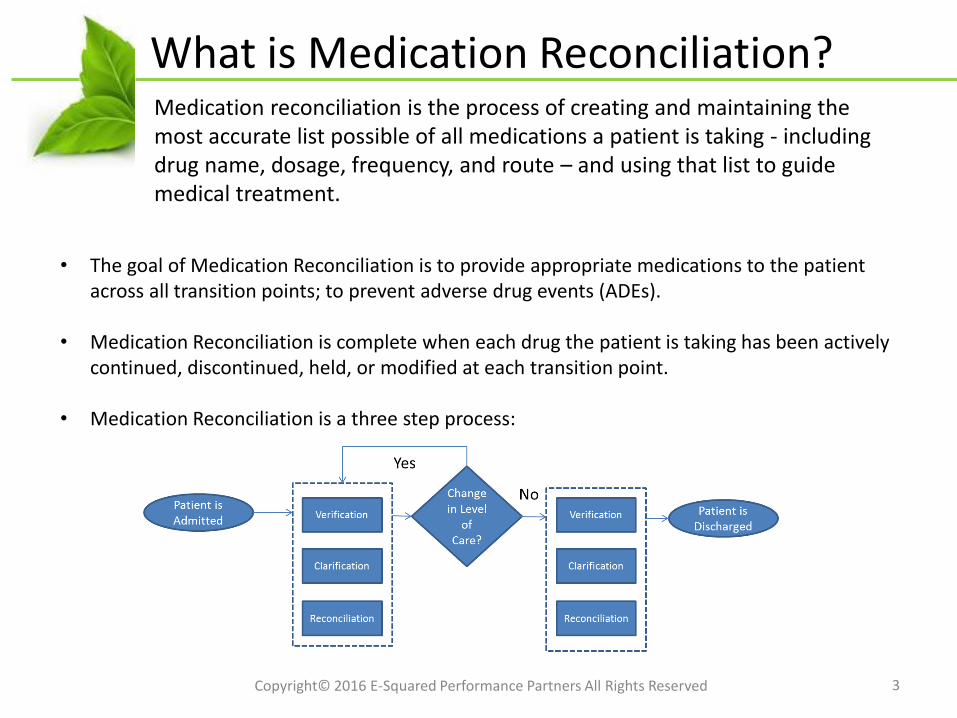
• The goal of Medication Reconciliation is to provide appropriate medications to the patient across all transition points; to prevent adverse drug events (ADEs).
• Medication Reconciliation is complete when each drug the patient is taking has been actively continued, discontinued, held, or modified at each transition point.
• Medication Reconciliation is a three step process:
3Copyright© 2016 E-Squared Performance Partners All Rights Reserved
Medication reconciliation is the process of creating and maintaining the most accurate list possible of all medications a patient is taking - including drug name, dosage, frequency, and route – and using that list to guide medical treatment.
Background
4Copyright© 2016 E-Squared Performance Partners All Rights Reserved
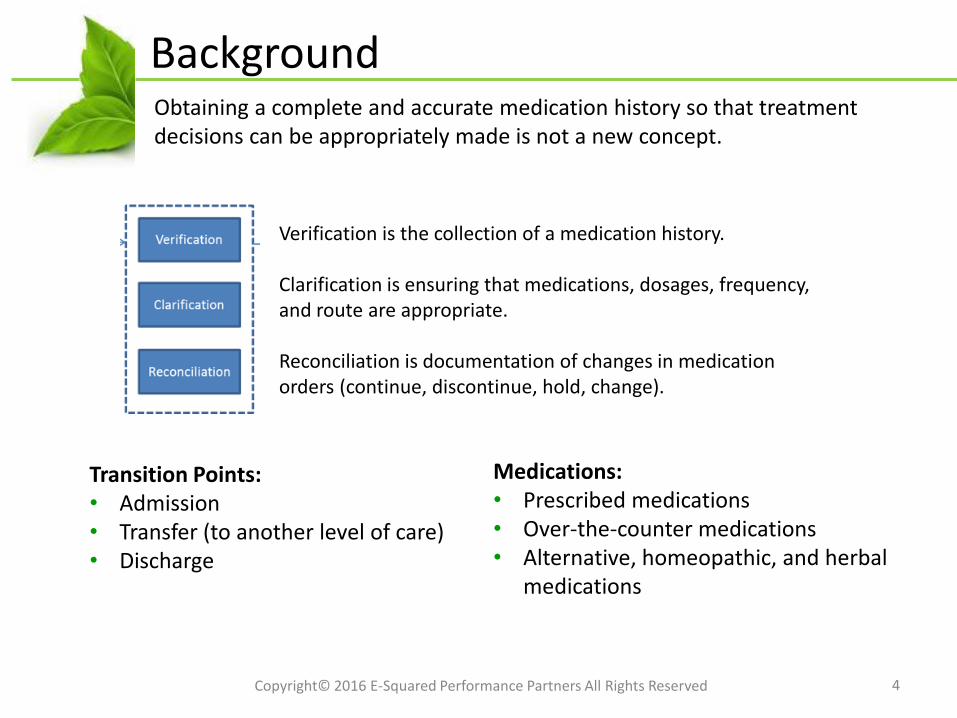
Obtaining a complete and accurate medication history so that treatment decisions can be appropriately made is not a new concept.
Verification is the collection of a medication history.
Clarification is ensuring that medications, dosages, frequency, and route are appropriate.
Reconciliation is documentation of changes in medication orders (continue, discontinue, hold, change).
Transition Points:• Admission• Transfer (to another level of care)• Discharge
Medications:• Prescribed medications• Over-the-counter medications• Alternative, homeopathic, and herbal
medications

Meet Janet
5Copyright© 2016 E-Squared Performance Partners All Rights Reserved
68-year old Janet Doe comes to the Emergency Department for worsening chest pain. Janet has a history of hypertension, gout, diabetes, and asthma.
Meds Janet brought from home:• Some in bottles• Some in zip lock bags• Do not include Over the Counter
(OTC), homeopathic/ alternative meds
On average, Americans aged 65 to 69 take 14 prescription medications.
-Am Society of Consultant Pharmacists
Janet’s Home Meds List
6Copyright© 2016 E-Squared Performance Partners All Rights Reserved
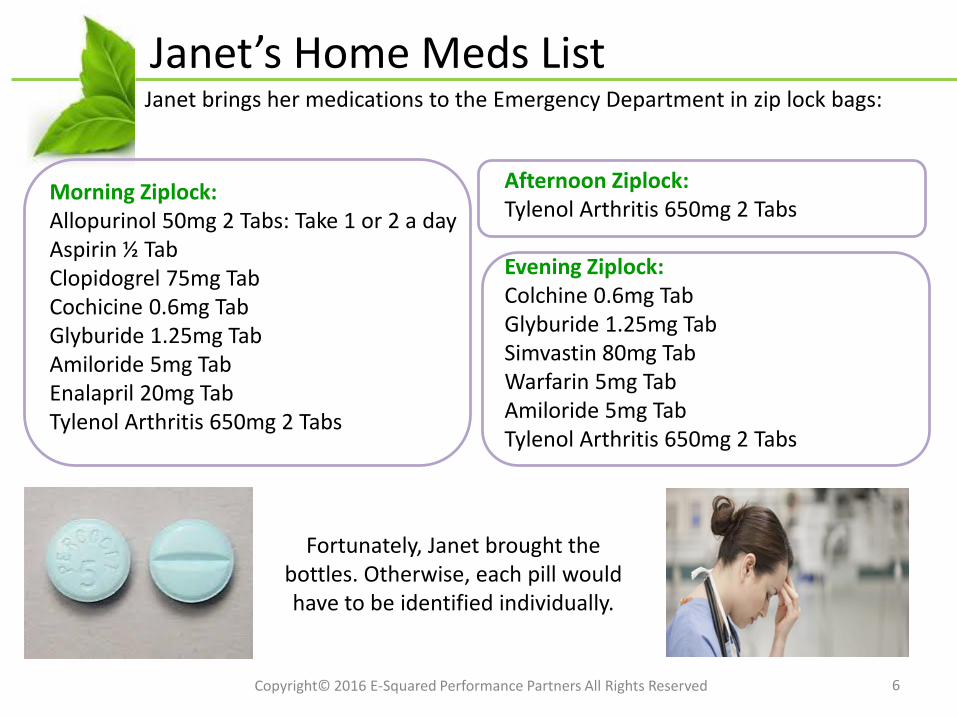
Janet brings her medications to the Emergency Department in zip lock bags:
Morning Ziplock:Allopurinol 50mg 2 Tabs: Take 1 or 2 a dayAspirin ½ TabClopidogrel 75mg TabCochicine 0.6mg TabGlyburide 1.25mg TabAmiloride 5mg TabEnalapril 20mg TabTylenol Arthritis 650mg 2 Tabs
Afternoon Ziplock:Tylenol Arthritis 650mg 2 Tabs
Evening Ziplock:Colchine 0.6mg TabGlyburide 1.25mg TabSimvastin 80mg TabWarfarin 5mg TabAmiloride 5mg TabTylenol Arthritis 650mg 2 Tabs
Fortunately, Janet brought the bottles. Otherwise, each pill would have to be identified individually.
Janet’s Pharmacy Med List
7Copyright© 2016 E-Squared Performance Partners All Rights Reserved
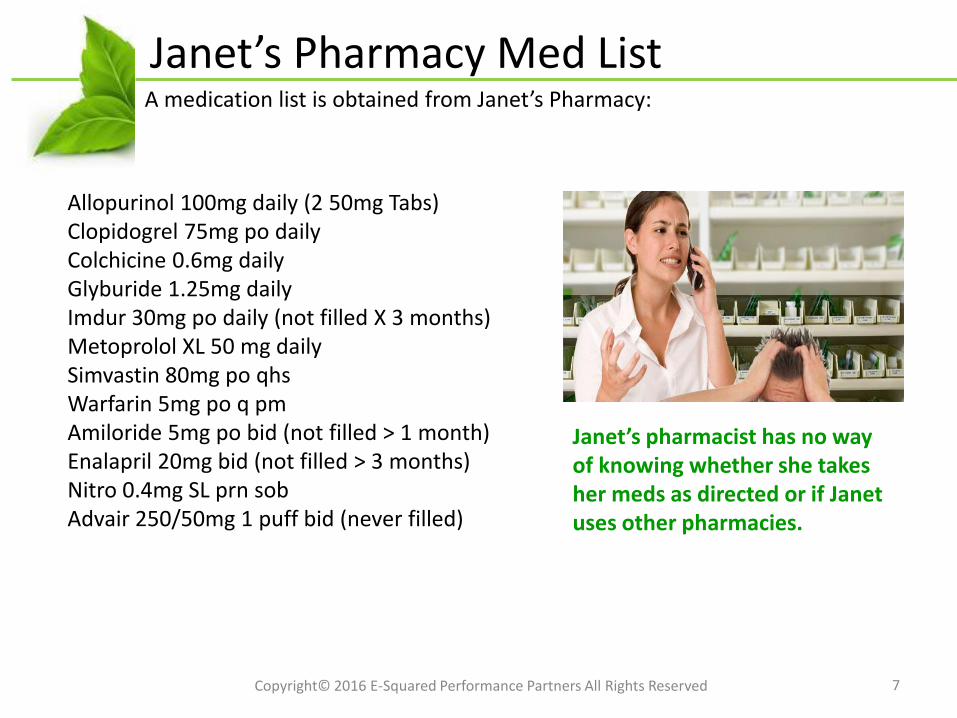
A medication list is obtained from Janet’s Pharmacy:
Allopurinol 100mg daily (2 50mg Tabs)Clopidogrel 75mg po dailyColchicine 0.6mg dailyGlyburide 1.25mg dailyImdur 30mg po daily (not filled X 3 months)Metoprolol XL 50 mg dailySimvastin 80mg po qhsWarfarin 5mg po q pmAmiloride 5mg po bid (not filled > 1 month)Enalapril 20mg bid (not filled > 3 months)Nitro 0.4mg SL prn sobAdvair 250/50mg 1 puff bid (never filled)
Janet’s pharmacist has no way of knowing whether she takes her meds as directed or if Janet uses other pharmacies.
Janet’s PCP (Doctor’s) Med List
8Copyright© 2016 E-Squared Performance Partners All Rights Reserved
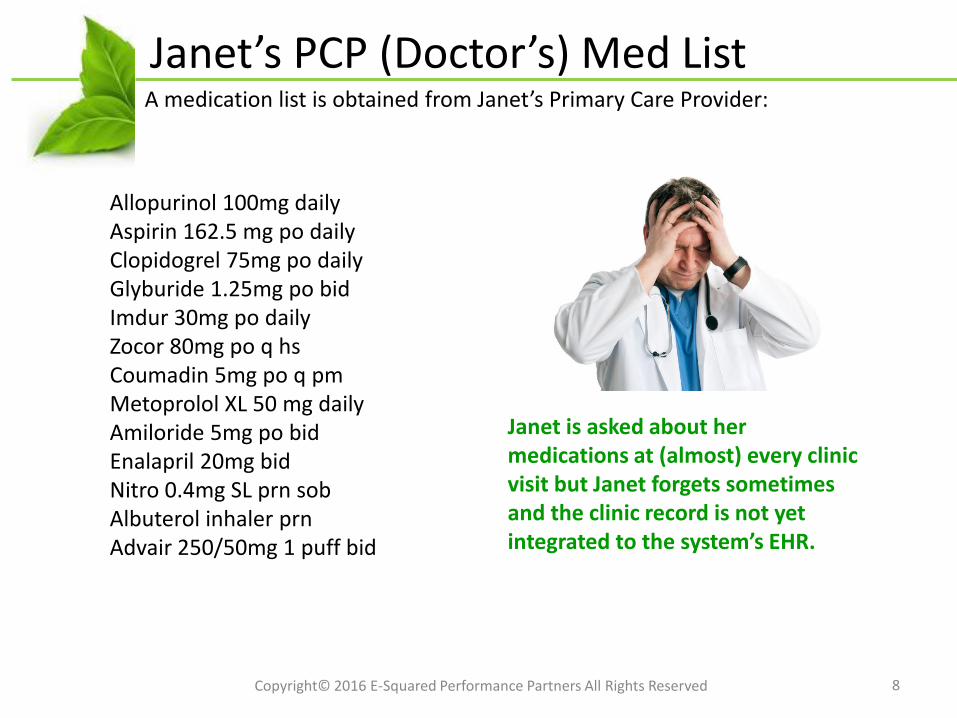
A medication list is obtained from Janet’s Primary Care Provider:
Allopurinol 100mg dailyAspirin 162.5 mg po dailyClopidogrel 75mg po dailyGlyburide 1.25mg po bidImdur 30mg po daily Zocor 80mg po q hsCoumadin 5mg po q pmMetoprolol XL 50 mg dailyAmiloride 5mg po bid Enalapril 20mg bid Nitro 0.4mg SL prn sobAlbuterol inhaler prn Advair 250/50mg 1 puff bid
Janet is asked about her medications at (almost) every clinic visit but Janet forgets sometimes and the clinic record is not yet integrated to the system’s EHR.
Janet’s Discharge Med List
9Copyright© 2016 E-Squared Performance Partners All Rights Reserved
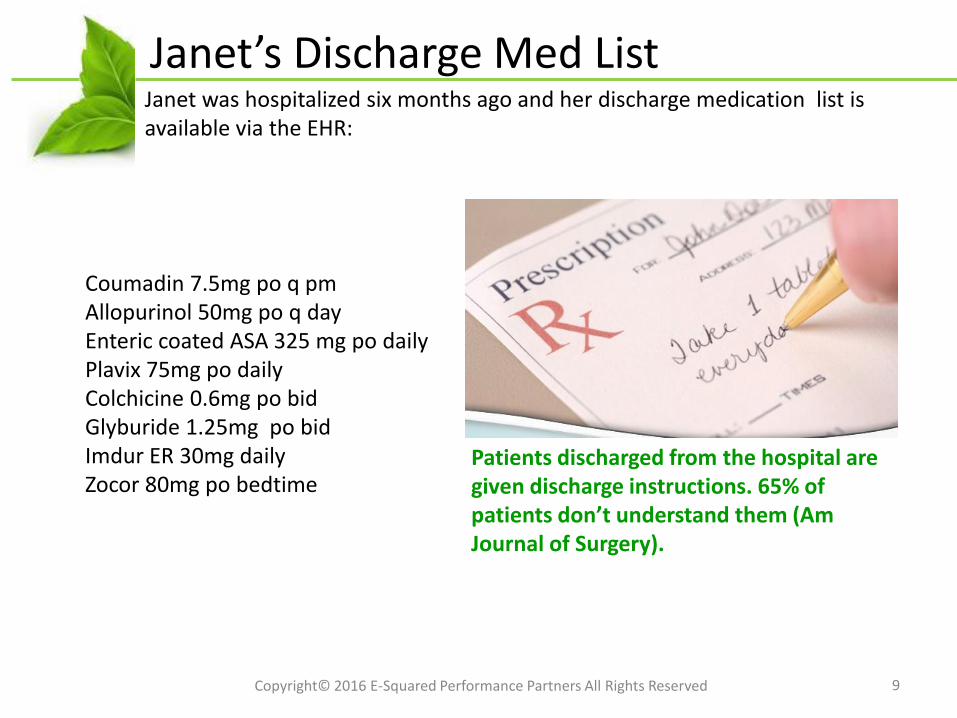
Janet was hospitalized six months ago and her discharge medication list is available via the EHR:
Coumadin 7.5mg po q pmAllopurinol 50mg po q dayEnteric coated ASA 325 mg po dailyPlavix 75mg po dailyColchicine 0.6mg po bidGlyburide 1.25mg po bidImdur ER 30mg dailyZocor 80mg po bedtime
Patients discharged from the hospital are given discharge instructions. 65% of patients don’t understand them (Am Journal of Surgery).
Janet’s ‘Complete’ Med List
10Copyright© 2016 E-Squared Performance Partners All Rights Reserved
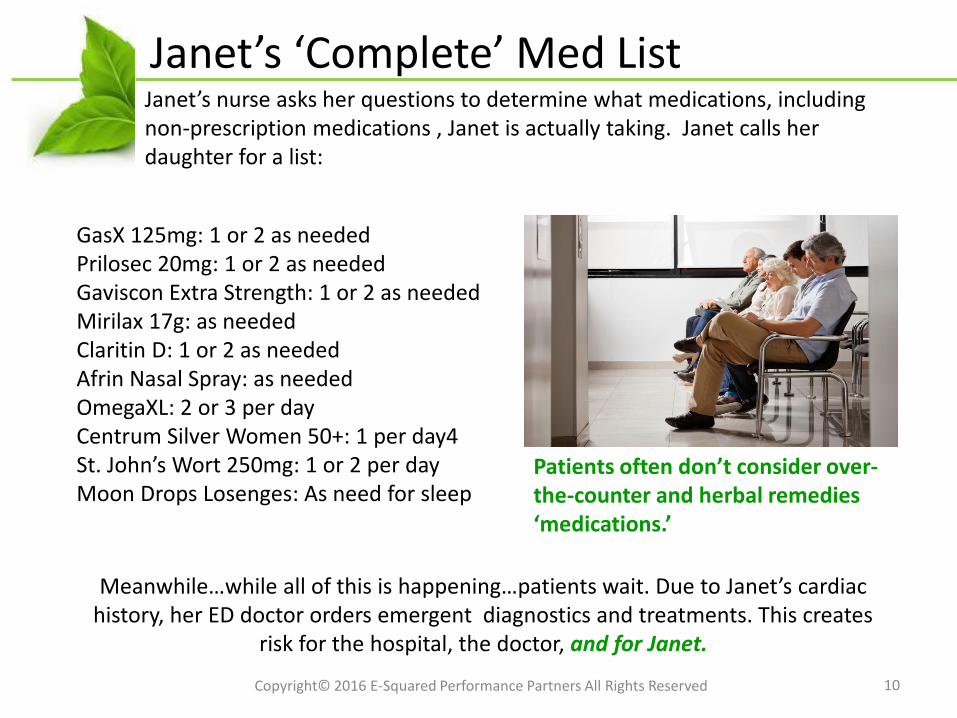
Janet’s nurse asks her questions to determine what medications, including non-prescription medications , Janet is actually taking. Janet calls her daughter for a list:
GasX 125mg: 1 or 2 as neededPrilosec 20mg: 1 or 2 as neededGaviscon Extra Strength: 1 or 2 as neededMirilax 17g: as neededClaritin D: 1 or 2 as neededAfrin Nasal Spray: as neededOmegaXL: 2 or 3 per day Centrum Silver Women 50+: 1 per day4St. John’s Wort 250mg: 1 or 2 per dayMoon Drops Losenges: As need for sleep
Patients often don’t consider over-the-counter and herbal remedies ‘medications.’
Meanwhile…while all of this is happening…patients wait. Due to Janet’s cardiac history, her ED doctor orders emergent diagnostics and treatments. This creates
risk for the hospital, the doctor, and for Janet.
Context
11Copyright© 2016 E-Squared Performance Partners All Rights Reserved
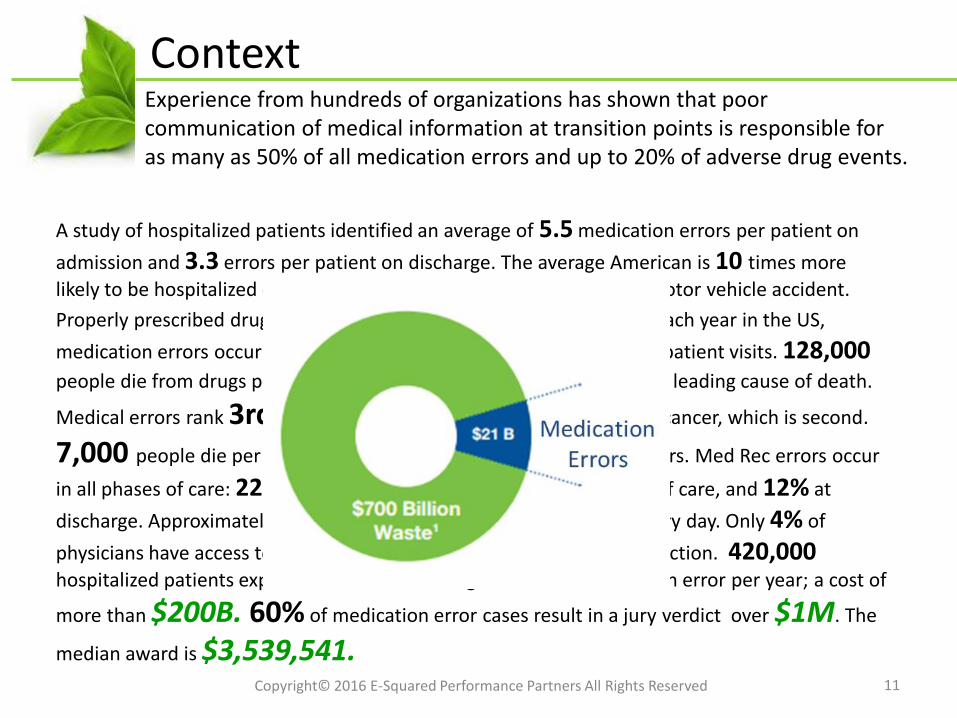
Experience from hundreds of organizations has shown that poor communication of medical information at transition points is responsible for as many as 50% of all medication errors and up to 20% of adverse drug events.
A study of hospitalized patients identified an average of 5.5 medication errors per patient on
admission and 3.3 errors per patient on discharge. The average American is 10 times more
likely to be hospitalized due to an adverse drug reaction than from a motor vehicle accident.
Properly prescribed drugs cause about 1.9M hospitalizations a year. Each year in the US,
medication errors occur in 3.8M inpatient admissions and 3.3M outpatient visits. 128,000people die from drugs prescribed to them, ranking 4th with stroke as a leading cause of death.
Medical errors rank 3rd, behind heart disease, which is the first, and cancer, which is second.
7,000 people die per year as a result of preventable medication errors. Med Rec errors occur
in all phases of care: 22% during admission, 66% during transitions of care, and 12% at
discharge. Approximately 100 undetected dispensing errors occur every day. Only 4% of
physicians have access to an EMR with a fully functional prescribing function. 420,000hospitalized patients experience an adverse drug reaction or medication error per year; a cost of
more than $200B. 60% of medication error cases result in a jury verdict over $1M. The
median award is $3,539,541.
We’re the Government…
12Copyright© 2016 E-Squared Performance Partners All Rights Reserved
Medication Reconciliation was developed in the mid 2000s as a response to a rising incidence of adverse drug events (ADEs) and the risk for unnecessary (and costly) subsequent care.
Regulatory Requirements:2005: Joint Commission National Patient Safety
Goal (NPSG) #8 2006: JC accredited organizations required to
comply or face penalties2009–2011: Scoring suspended due to a ‘lack of
proven strategies’ 2011: Med Rec was incorporated into NPSG #3 2011: Meaningful Use 170.314(b)(a) requires
Clinical Information Reconciliation
Financial Implications:• Failure to comply with Meaningful Use will result in $600M in penalties in 2016.• Hospital Value-Based Purchasing (HVBP) program redistributed about $140M
from hospitals that received penalties to hospitals that received bonuses in 2015.
A Universal Healthcare Challenge
13
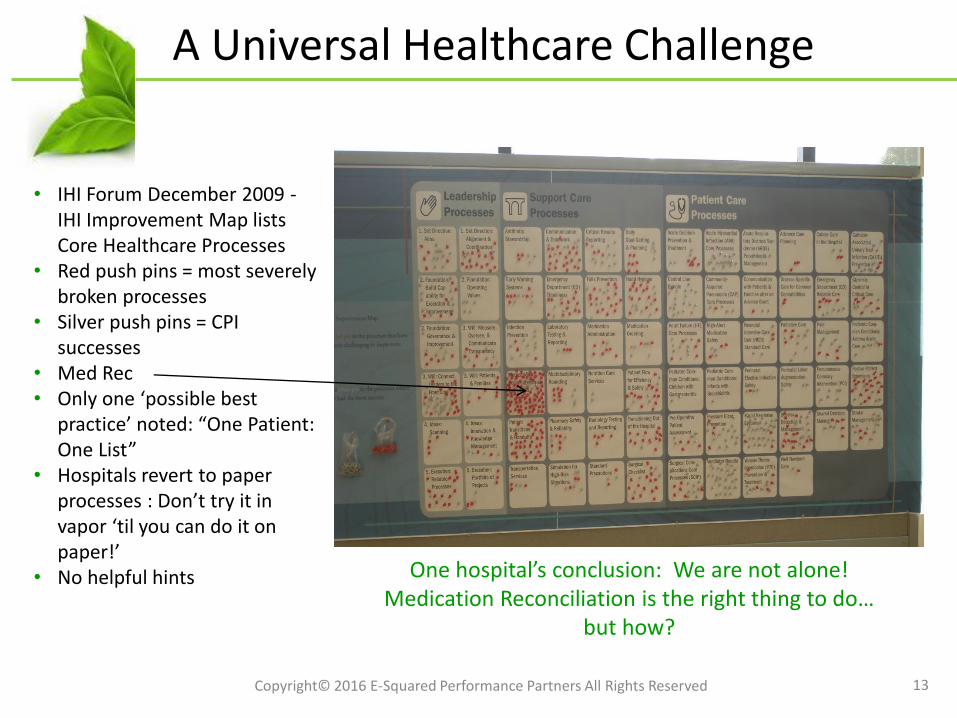
• IHI Forum December 2009 -IHI Improvement Map lists Core Healthcare Processes
• Red push pins = most severely broken processes
• Silver push pins = CPI successes
• Med Rec• Only one ‘possible best
practice’ noted: “One Patient: One List”
• Hospitals revert to paper processes : Don’t try it in vapor ‘til you can do it on paper!’
• No helpful hints One hospital’s conclusion: We are not alone! Medication Reconciliation is the right thing to do…
but how?
Copyright© 2016 E-Squared Performance Partners All Rights Reserved
From Parking Lot to Priority
14
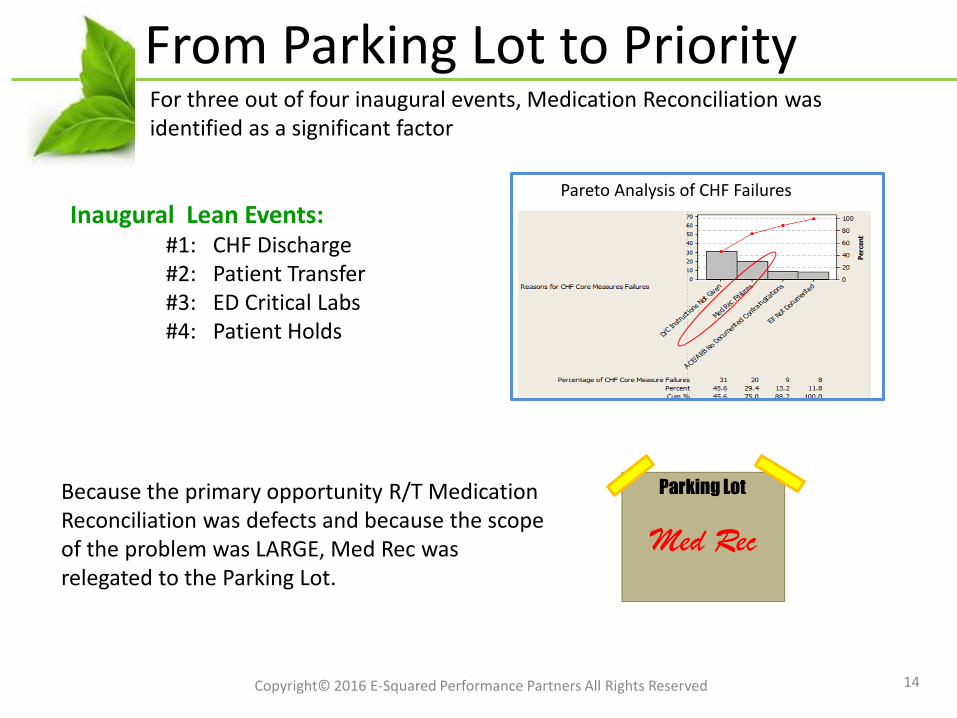
Because the primary opportunity R/T Medication Reconciliation was defects and because the scope of the problem was LARGE, Med Rec was relegated to the Parking Lot.
Inaugural Lean Events: #1: CHF Discharge#2: Patient Transfer#3: ED Critical Labs#4: Patient Holds
Pareto Analysis of CHF Failures
Copyright© 2016 E-Squared Performance Partners All Rights Reserved
For three out of four inaugural events, Medication Reconciliation was identified as a significant factor
The Problem
15
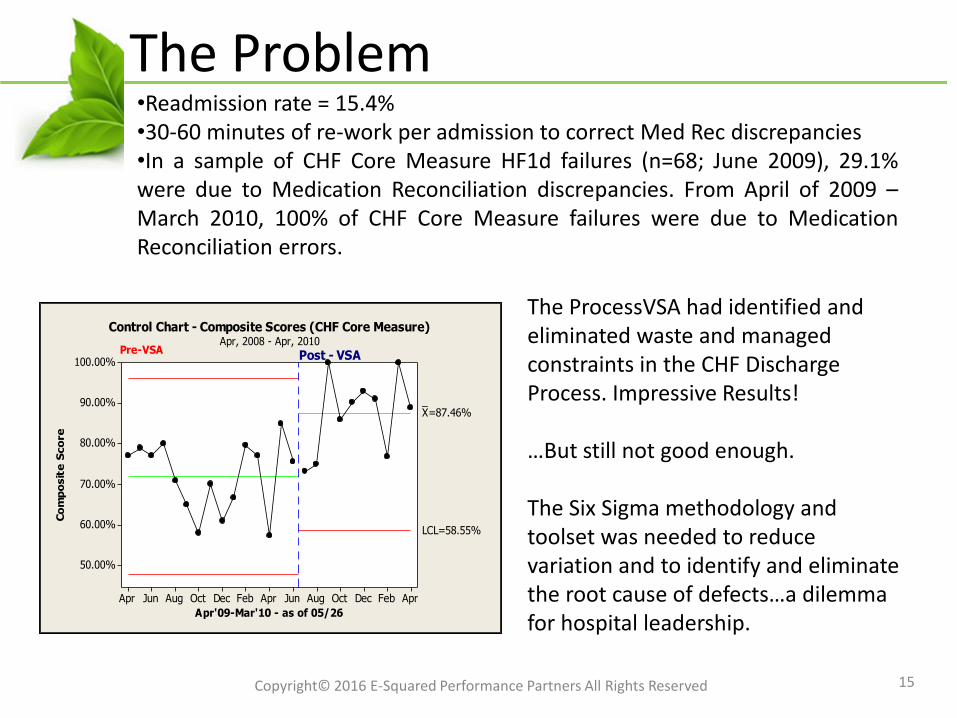
•Readmission rate = 15.4%•30-60 minutes of re-work per admission to correct Med Rec discrepancies•In a sample of CHF Core Measure HF1d failures (n=68; June 2009), 29.1%were due to Medication Reconciliation discrepancies. From April of 2009 –March 2010, 100% of CHF Core Measure failures were due to MedicationReconciliation errors.
AprFebDecOctAugJunAprFebDecOctAugJunApr
100.00%
90.00%
80.00%
70.00%
60.00%
50.00%
Apr'09-Mar'10 - as of 05/26
Co
mp
osit
e S
co
re
_X=87.46%
LCL=58.55%
Control Chart - Composite Scores (CHF Core Measure)Apr, 2008 - Apr, 2010
Post - VSAPre-VSA
The ProcessVSA had identified and eliminated waste and managed constraints in the CHF Discharge Process. Impressive Results!
…But still not good enough.
The Six Sigma methodology and toolset was needed to reduce variation and to identify and eliminate the root cause of defects…a dilemma for hospital leadership.
Copyright© 2016 E-Squared Performance Partners All Rights Reserved
The Six Sigma Roadmap
16
Define
Measure
Analyze
Improve
Control
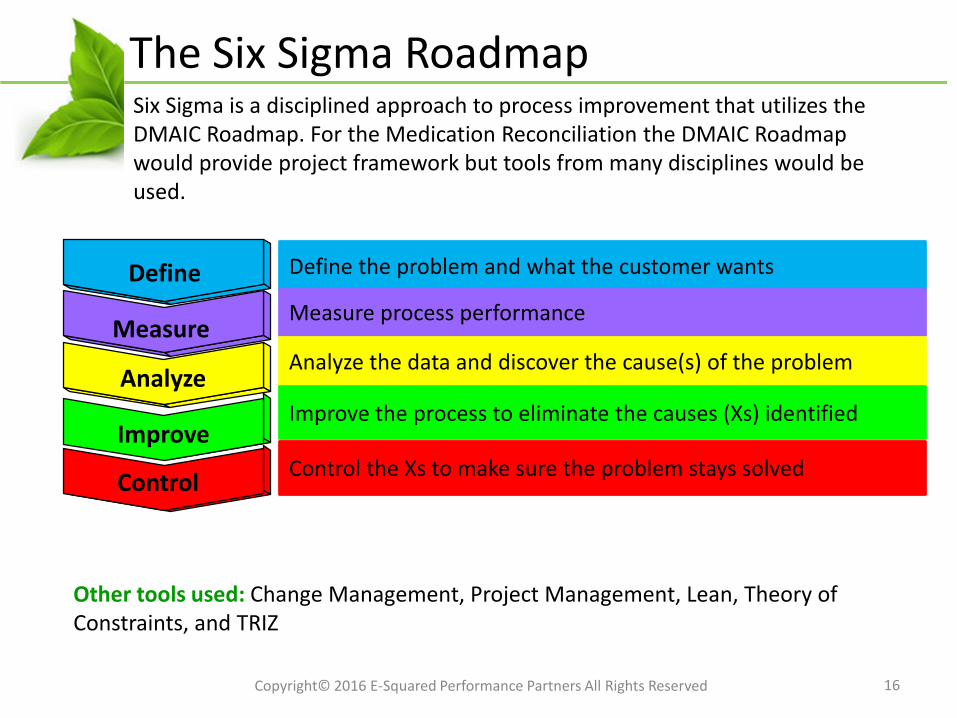
Define the problem and what the customer wants
Measure process performance
Analyze the data and discover the cause(s) of the problem
Improve the process to eliminate the causes (Xs) identified
Control the Xs to make sure the problem stays solved
Six Sigma is a disciplined approach to process improvement that utilizes the DMAIC Roadmap. For the Medication Reconciliation the DMAIC Roadmap would provide project framework but tools from many disciplines would be used.
Copyright© 2016 E-Squared Performance Partners All Rights Reserved
Other tools used: Change Management, Project Management, Lean, Theory of Constraints, and TRIZ
17
Medication Reconciliation: Define
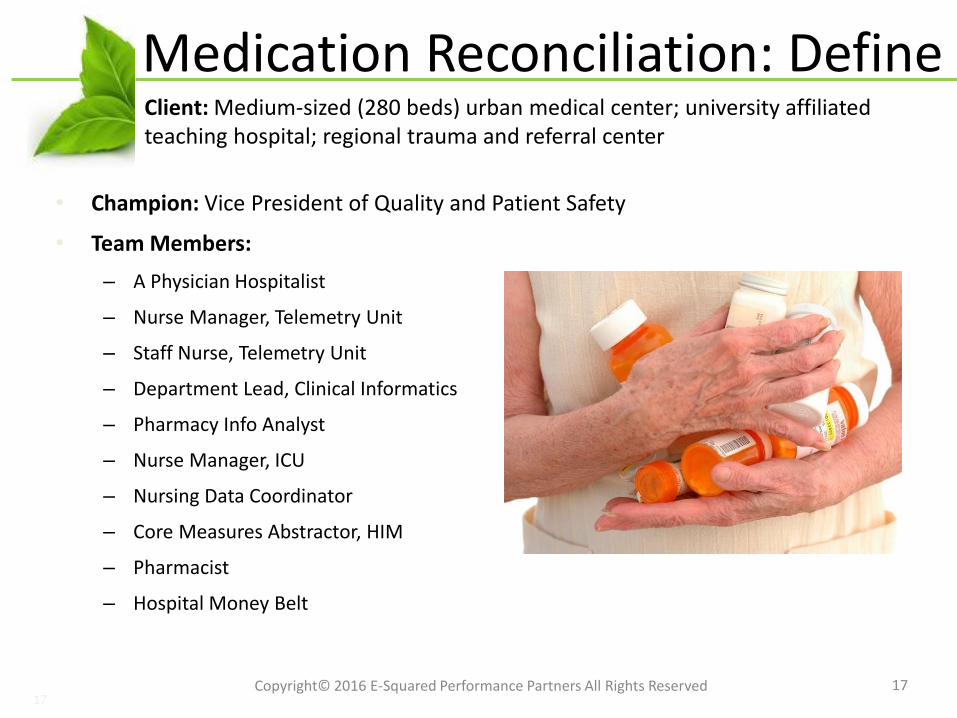
• Champion: Vice President of Quality and Patient Safety
• Team Members:
– A Physician Hospitalist
– Nurse Manager, Telemetry Unit
– Staff Nurse, Telemetry Unit
– Department Lead, Clinical Informatics
– Pharmacy Info Analyst
– Nurse Manager, ICU
– Nursing Data Coordinator
– Core Measures Abstractor, HIM
– Pharmacist
– Hospital Money Belt
17
Client: Medium-sized (280 beds) urban medical center; university affiliated teaching hospital; regional trauma and referral center
Copyright© 2016 E-Squared Performance Partners All Rights Reserved
1818
The Project Charter
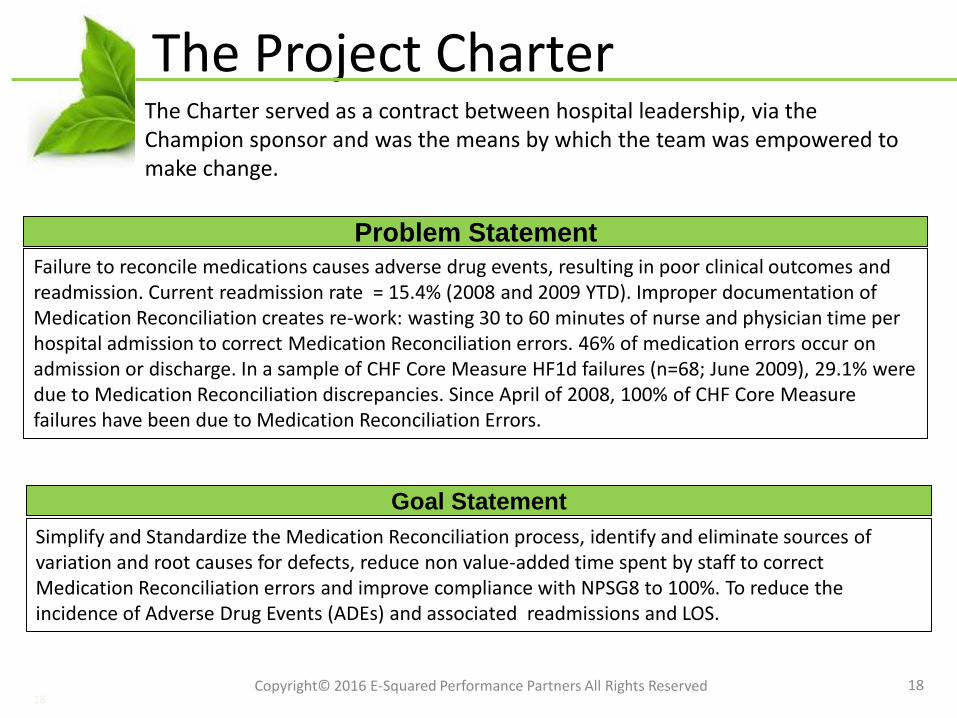
Failure to reconcile medications causes adverse drug events, resulting in poor clinical outcomes and readmission. Current readmission rate = 15.4% (2008 and 2009 YTD). Improper documentation of Medication Reconciliation creates re-work: wasting 30 to 60 minutes of nurse and physician time per hospital admission to correct Medication Reconciliation errors. 46% of medication errors occur on admission or discharge. In a sample of CHF Core Measure HF1d failures (n=68; June 2009), 29.1% were due to Medication Reconciliation discrepancies. Since April of 2008, 100% of CHF Core Measure failures have been due to Medication Reconciliation Errors.
Problem Statement
Simplify and Standardize the Medication Reconciliation process, identify and eliminate sources of variation and root causes for defects, reduce non value-added time spent by staff to correct Medication Reconciliation errors and improve compliance with NPSG8 to 100%. To reduce the incidence of Adverse Drug Events (ADEs) and associated readmissions and LOS.
Goal Statement
The Charter served as a contract between hospital leadership, via the Champion sponsor and was the means by which the team was empowered to make change.
Copyright© 2016 E-Squared Performance Partners All Rights Reserved
1919
The Project Charter
Scope
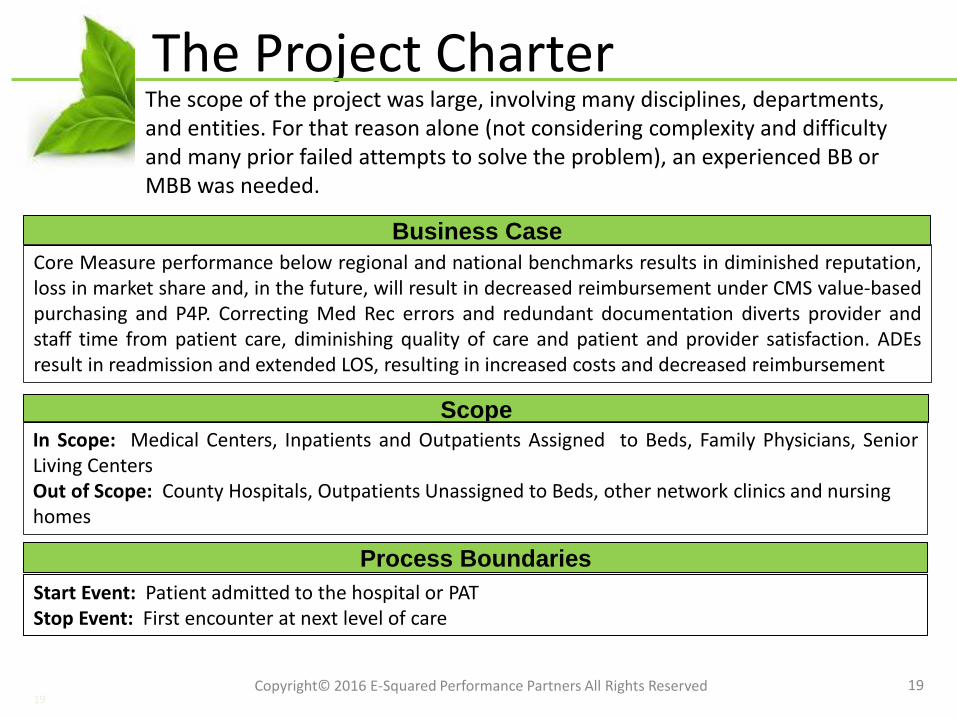
In Scope: Medical Centers, Inpatients and Outpatients Assigned to Beds, Family Physicians, SeniorLiving CentersOut of Scope: County Hospitals, Outpatients Unassigned to Beds, other network clinics and nursing homes
The scope of the project was large, involving many disciplines, departments, and entities. For that reason alone (not considering complexity and difficulty and many prior failed attempts to solve the problem), an experienced BB or MBB was needed.
Start Event: Patient admitted to the hospital or PATStop Event: First encounter at next level of care
Process Boundaries
Copyright© 2016 E-Squared Performance Partners All Rights Reserved
Business Case
Core Measure performance below regional and national benchmarks results in diminished reputation,loss in market share and, in the future, will result in decreased reimbursement under CMS value-basedpurchasing and P4P. Correcting Med Rec errors and redundant documentation diverts provider andstaff time from patient care, diminishing quality of care and patient and provider satisfaction. ADEsresult in readmission and extended LOS, resulting in increased costs and decreased reimbursement
2020
The Project Charter
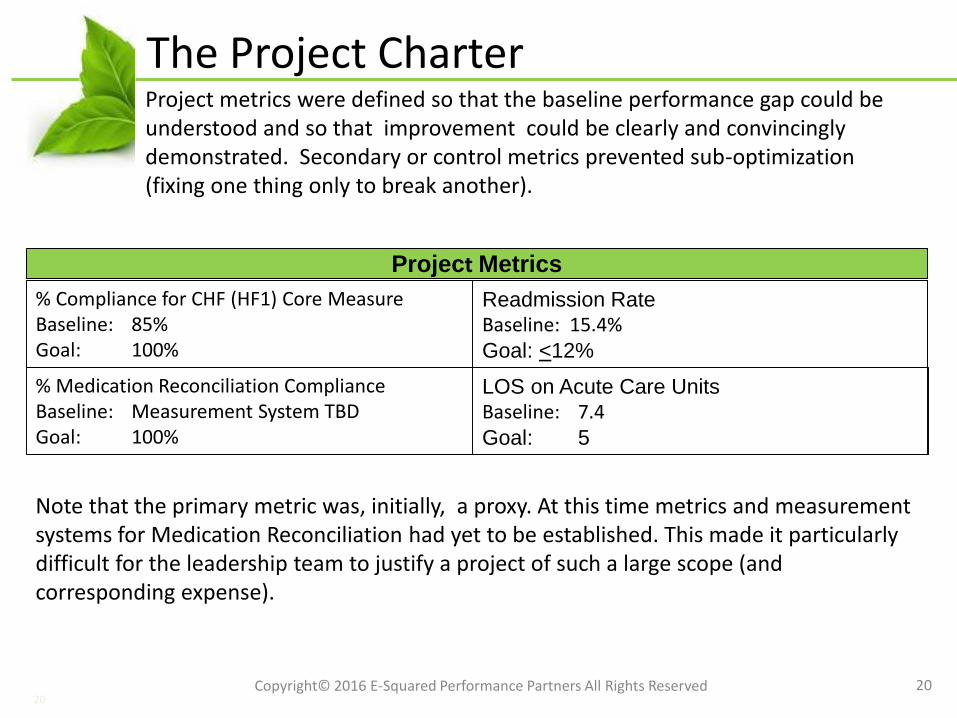
% Compliance for CHF (HF1) Core MeasureBaseline: 85%Goal: 100%
Project Metrics
Readmission RateBaseline: 15.4%Goal: <12%
LOS on Acute Care UnitsBaseline: 7.4Goal: 5
% Medication Reconciliation ComplianceBaseline: Measurement System TBDGoal: 100%
Project metrics were defined so that the baseline performance gap could be understood and so that improvement could be clearly and convincingly demonstrated. Secondary or control metrics prevented sub-optimization (fixing one thing only to break another).
Copyright© 2016 E-Squared Performance Partners All Rights Reserved
Note that the primary metric was, initially, a proxy. At this time metrics and measurement systems for Medication Reconciliation had yet to be established. This made it particularly difficult for the leadership team to justify a project of such a large scope (and corresponding expense).
2121
The Project Charter
Projected Financial Impact
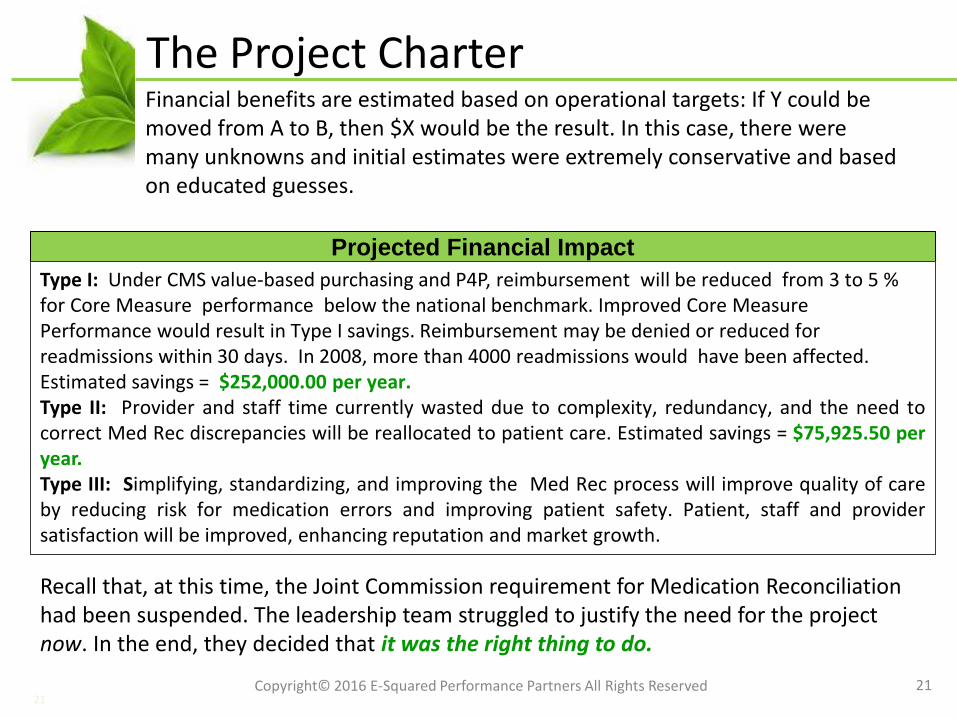
Type I: Under CMS value-based purchasing and P4P, reimbursement will be reduced from 3 to 5 % for Core Measure performance below the national benchmark. Improved Core Measure Performance would result in Type I savings. Reimbursement may be denied or reduced for readmissions within 30 days. In 2008, more than 4000 readmissions would have been affected. Estimated savings = $252,000.00 per year.Type II: Provider and staff time currently wasted due to complexity, redundancy, and the need tocorrect Med Rec discrepancies will be reallocated to patient care. Estimated savings = $75,925.50 peryear.Type III: Simplifying, standardizing, and improving the Med Rec process will improve quality of careby reducing risk for medication errors and improving patient safety. Patient, staff and providersatisfaction will be improved, enhancing reputation and market growth.
Financial benefits are estimated based on operational targets: If Y could be moved from A to B, then $X would be the result. In this case, there were many unknowns and initial estimates were extremely conservative and based on educated guesses.
Copyright© 2016 E-Squared Performance Partners All Rights Reserved
Recall that, at this time, the Joint Commission requirement for Medication Reconciliation had been suspended. The leadership team struggled to justify the need for the project now. In the end, they decided that it was the right thing to do.
22
Pareto Analysis
22
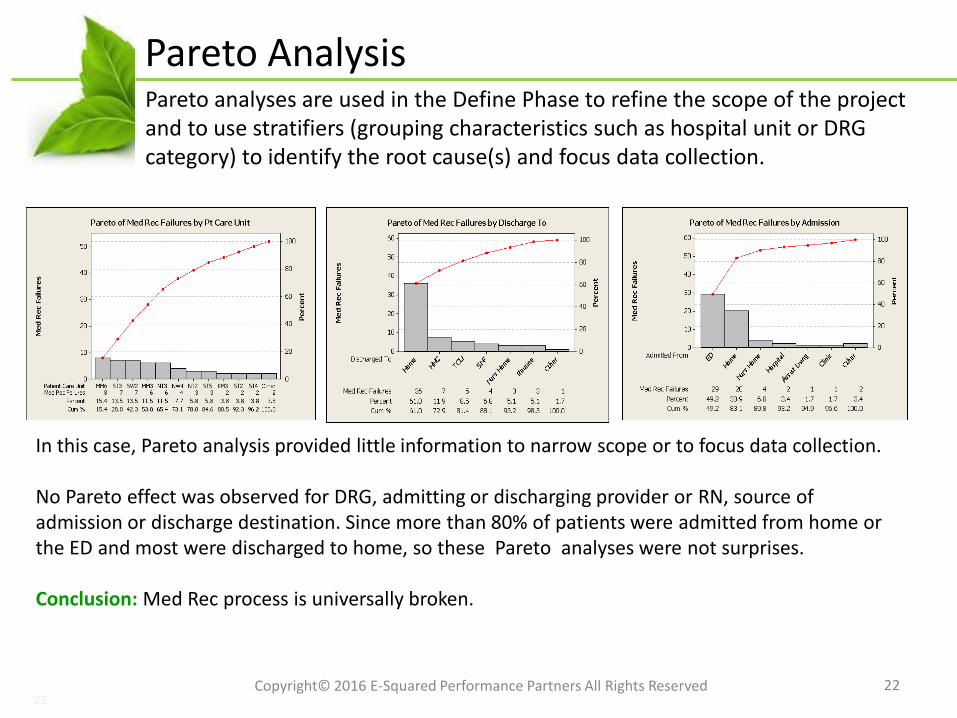
In this case, Pareto analysis provided little information to narrow scope or to focus data collection.
No Pareto effect was observed for DRG, admitting or discharging provider or RN, source of admission or discharge destination. Since more than 80% of patients were admitted from home or the ED and most were discharged to home, so these Pareto analyses were not surprises.
Conclusion: Med Rec process is universally broken.
Pareto analyses are used in the Define Phase to refine the scope of the project and to use stratifiers (grouping characteristics such as hospital unit or DRG category) to identify the root cause(s) and focus data collection.
Copyright© 2016 E-Squared Performance Partners All Rights Reserved
Medication Reconciliation: Define
23
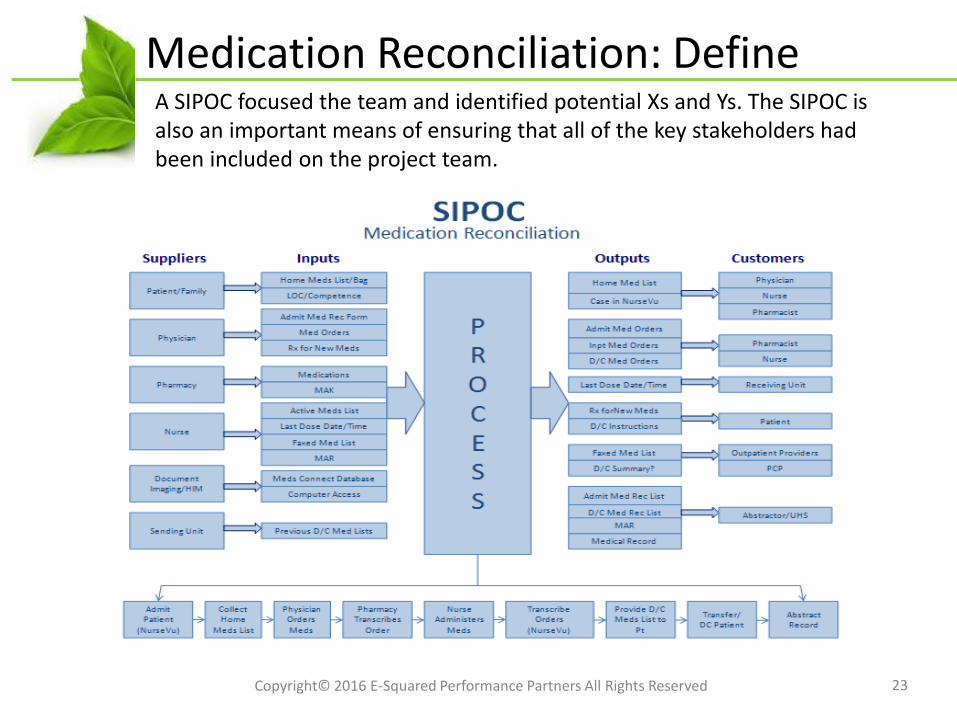
A SIPOC focused the team and identified potential Xs and Ys. The SIPOC is also an important means of ensuring that all of the key stakeholders had been included on the project team.
Copyright© 2016 E-Squared Performance Partners All Rights Reserved
CTQs
24
Customer(s) Key Customer Issue(s)Critical
Customer Requirement(s)
Pt/Family Medication Accuracy and SafetyNo ADEs, Understand
Discharge Med Instructions
PCP/Provider Info to Care for PtMed Info is Correct and
Timely
Hospital Compliance, Performance, Cost Core Measure Performance = 100%; Readmission Rate <
Benchmark; Minimal Resources
Interdisciplinary Care Team Effectiveness, Efficiency Info to Provide Care, Confidence in Process, Minimize Re-Work and
Redundancy
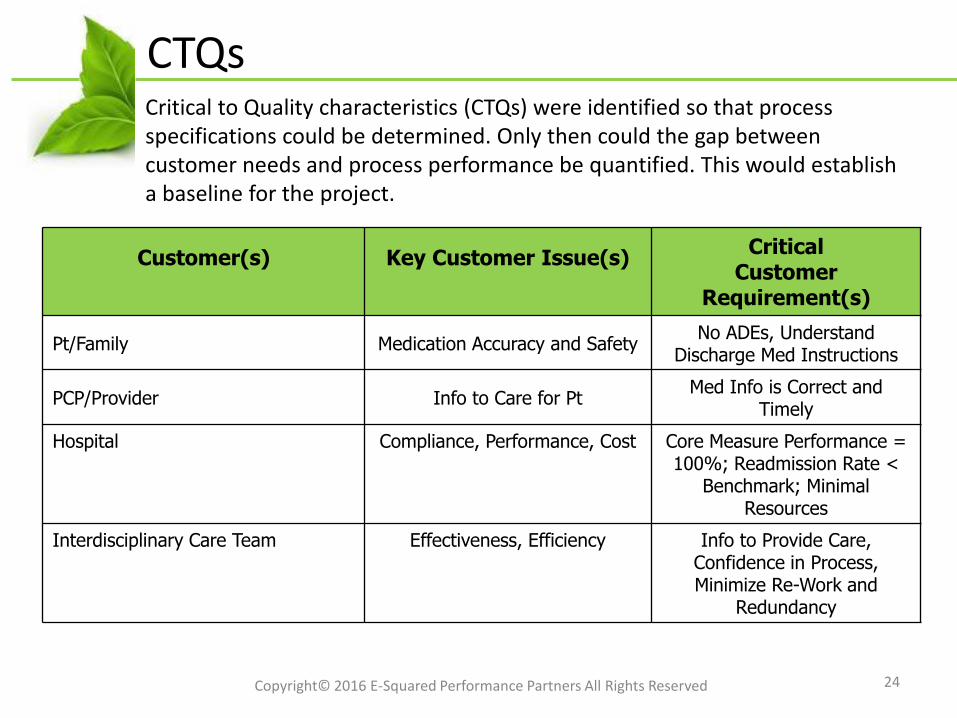
Critical to Quality characteristics (CTQs) were identified so that process specifications could be determined. Only then could the gap between customer needs and process performance be quantified. This would establish a baseline for the project.
Copyright© 2016 E-Squared Performance Partners All Rights Reserved
Define Phase Summary
25
•Scope of the project was discussed at the senior leadership level and the risk of an unsuccessful project was determined to exceed the risk of reducing scope and chartering multiple projects (time being the key factor). •A Stakeholder Analysis reinforced the importance of communication and creating buy-in.•A detailed Communication Plan was launched.•The complexity of the process map was discouraging to some members of the team. Simplificationbecame the #1 initial concern. •A ‘best tool for the job’ approach was used to
•Reinforce the value of a comprehensive tool set.•Provide newly trained Lean Experts opportunities to apply learning.•To map the process
•A Functional Process Map to illustrate handoffs.•ProcessVSA to identify waste.•Constraint Analysis to identify bottlenecks.
•Realizing that the IHI had identified Medication Reconciliation as one of healthcare’s toughest problems was both an incentive and a cause for concern.•Some new team members were added as a result of the SIPOC. Many more would be added later.
The purpose of the Define Phase it to minimize the risk of a failed project. This project, for many reasons, had a high risk of failure. Some highlights of the Define Phase:
Copyright© 2016 E-Squared Performance Partners All Rights Reserved
26
Medication Reconciliation: Measure
26
Medication Reconciliation Process
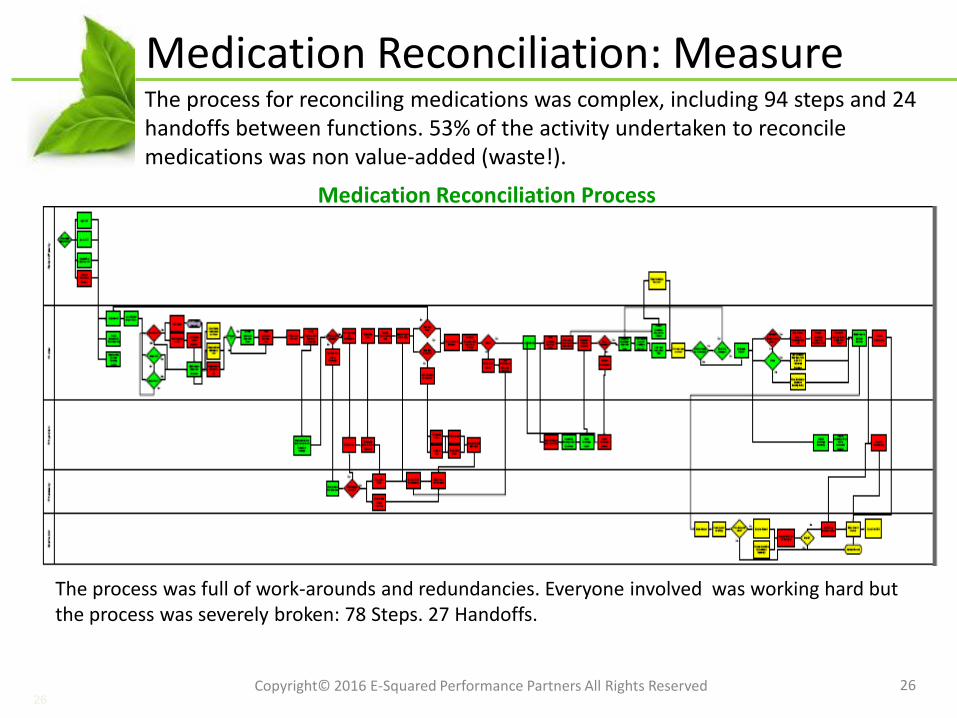
The process for reconciling medications was complex, including 94 steps and 24 handoffs between functions. 53% of the activity undertaken to reconcile medications was non value-added (waste!).
The process was full of work-arounds and redundancies. Everyone involved was working hard but the process was severely broken: 78 Steps. 27 Handoffs.
Copyright© 2016 E-Squared Performance Partners All Rights Reserved
27
Sampling and Data Collection Plan
27
Measure
Operational
Definition
Collection
Method Source Sampling Actionee DateMeasure
what?
[What units?]
Be specific
(Incl. Query if appl.)
How will data
be collected? Where? How many?
Who will
collect? When?
Med Rec Compliance
CHF Core Measures Definitions Chart
AuditHIM 100 QM Abstractors December
2009
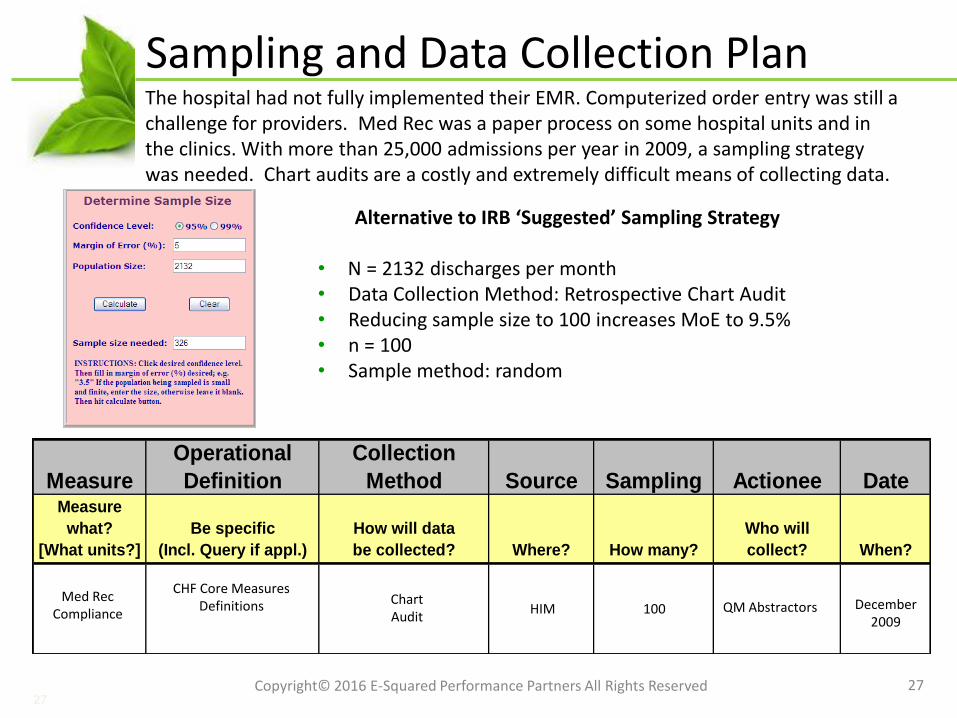
Alternative to IRB ‘Suggested’ Sampling Strategy
• N = 2132 discharges per month• Data Collection Method: Retrospective Chart Audit• Reducing sample size to 100 increases MoE to 9.5%• n = 100• Sample method: random
The hospital had not fully implemented their EMR. Computerized order entry was still a challenge for providers. Med Rec was a paper process on some hospital units and in the clinics. With more than 25,000 admissions per year in 2009, a sampling strategy was needed. Chart audits are a costly and extremely difficult means of collecting data.
Copyright© 2016 E-Squared Performance Partners All Rights Reserved
28
Measurement System Analysis
28
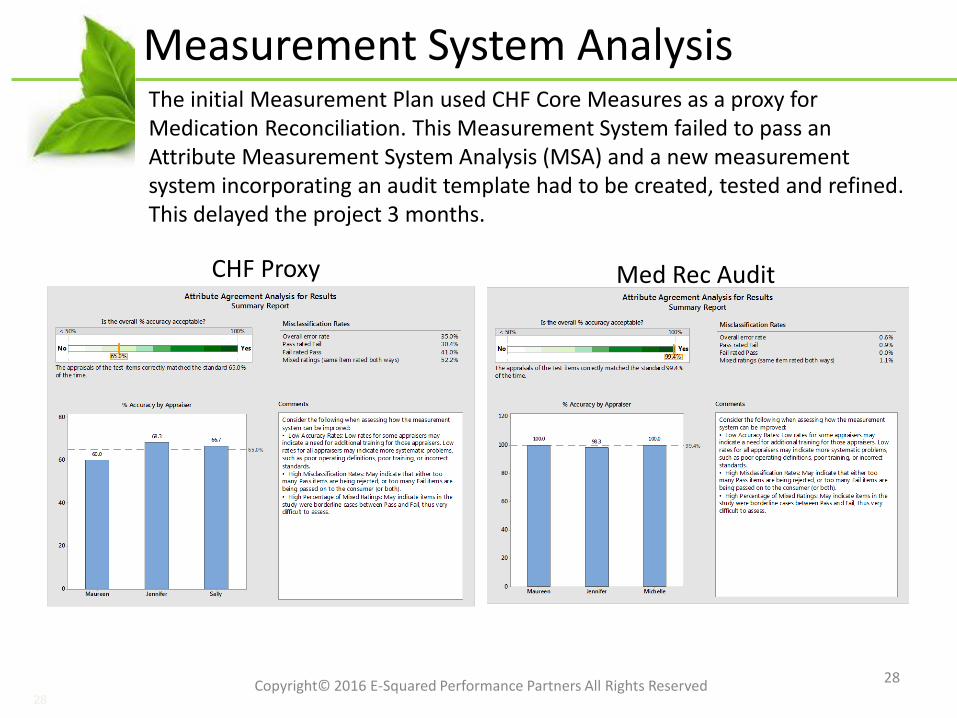
The initial Measurement Plan used CHF Core Measures as a proxy for Medication Reconciliation. This Measurement System failed to pass an Attribute Measurement System Analysis (MSA) and a new measurement system incorporating an audit template had to be created, tested and refined. This delayed the project 3 months.
CHF Proxy Med Rec Audit
Copyright© 2016 E-Squared Performance Partners All Rights Reserved
29
Baseline Process Capability
29
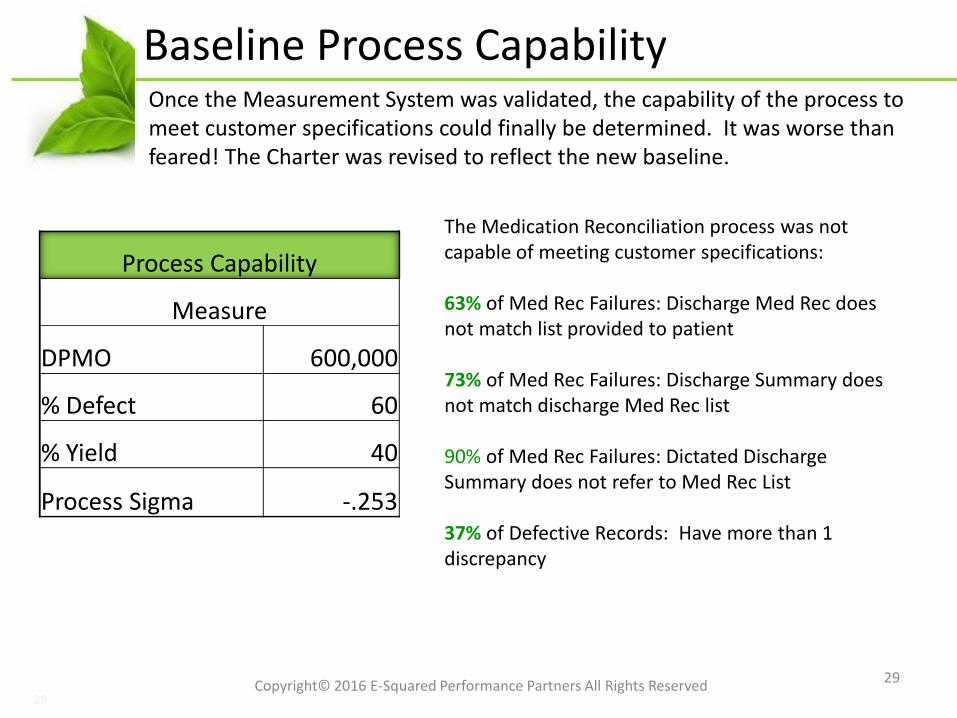
The Medication Reconciliation process was not capable of meeting customer specifications:
63% of Med Rec Failures: Discharge Med Rec does not match list provided to patient
73% of Med Rec Failures: Discharge Summary does not match discharge Med Rec list
90% of Med Rec Failures: Dictated Discharge Summary does not refer to Med Rec List
37% of Defective Records: Have more than 1 discrepancy
Process Capability
Measure
DPMO 600,000
% Defect 60
% Yield 40
Process Sigma -.253
Once the Measurement System was validated, the capability of the process to meet customer specifications could finally be determined. It was worse than feared! The Charter was revised to reflect the new baseline.
Copyright© 2016 E-Squared Performance Partners All Rights Reserved
Measure Phase Summary
30
•Process capability could not be adequately assessed using the CHF Core Measure proxy
•Chart audits are a resource intensive means of collecting data (30 minutes per chart)
•A reasonable sampling plan (balance of power and cost of data collection) was formulated using Minitab
•Measure Phase takes longer than expected when good data is not readily available
•A Measurement Plan •Included detailed instructions for chart auditors•Provided templates for data collection, aggregation, and reporting•Clearly and concisely defined all key terms•Resulted in a 100% acceptable Measurement System
The Measure Phase characterized the process using process flow mapping and descriptive statistics, validated the trustworthiness of the Measurement System, and established baseline process capability.
Copyright© 2016 E-Squared Performance Partners All Rights Reserved
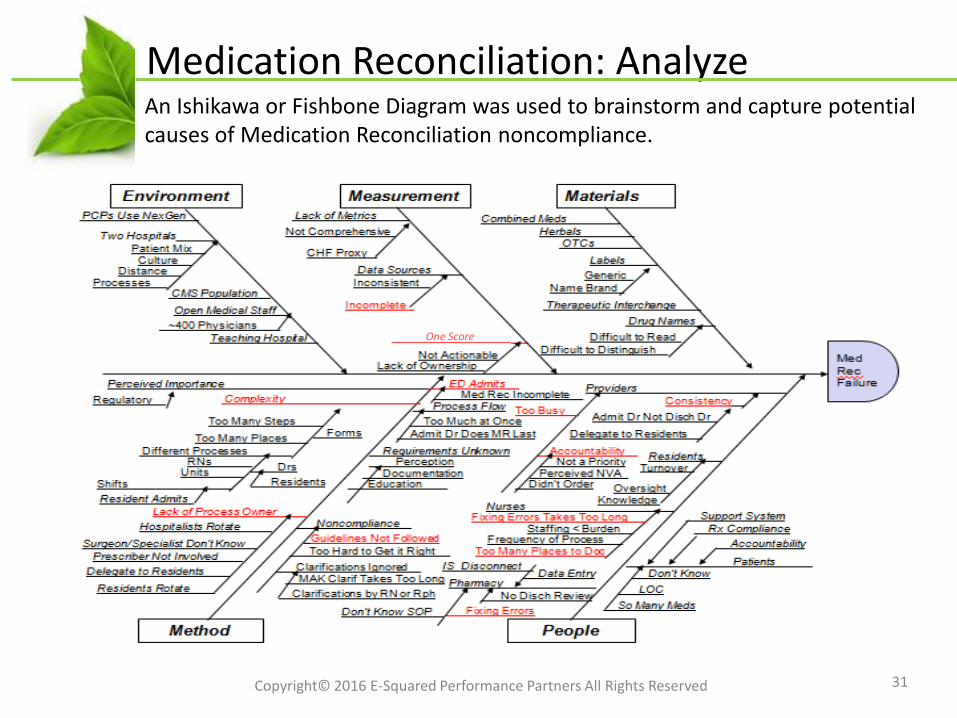
Medication Reconciliation: Analyze
31
An Ishikawa or Fishbone Diagram was used to brainstorm and capture potential causes of Medication Reconciliation noncompliance.
Copyright© 2016 E-Squared Performance Partners All Rights Reserved
One Score
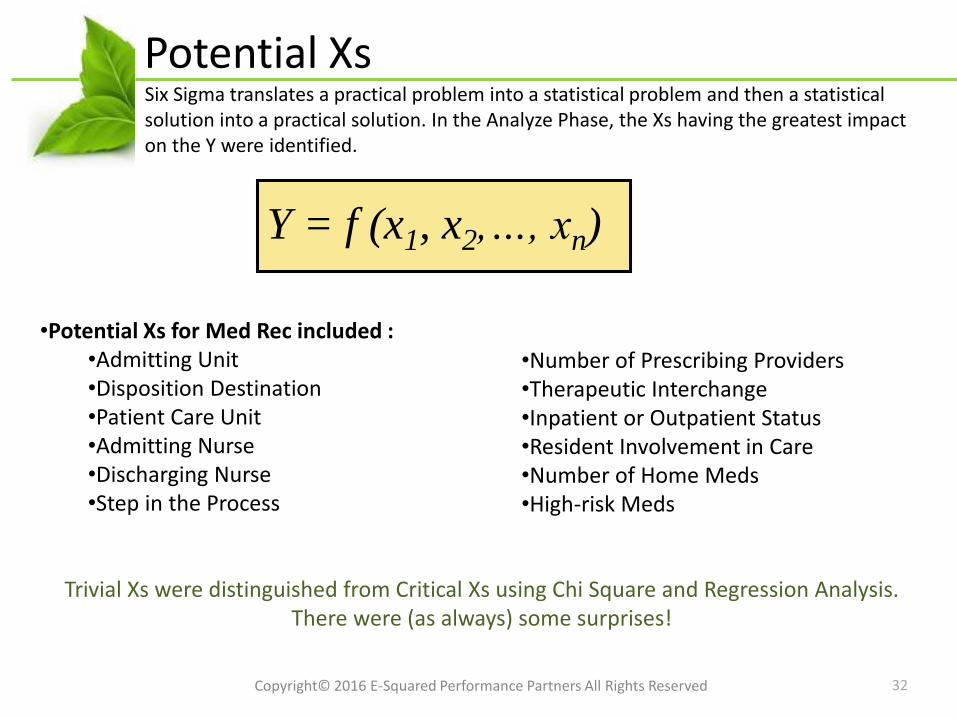
Potential Xs
32
•Potential Xs for Med Rec included :•Admitting Unit•Disposition Destination•Patient Care Unit•Admitting Nurse•Discharging Nurse•Step in the Process
Trivial Xs were distinguished from Critical Xs using Chi Square and Regression Analysis. There were (as always) some surprises!
Y = f (x1, x2,…, xn)
•Number of Prescribing Providers•Therapeutic Interchange•Inpatient or Outpatient Status•Resident Involvement in Care•Number of Home Meds•High-risk Meds
Six Sigma translates a practical problem into a statistical problem and then a statistical solution into a practical solution. In the Analyze Phase, the Xs having the greatest impact on the Y were identified.
Copyright© 2016 E-Squared Performance Partners All Rights Reserved
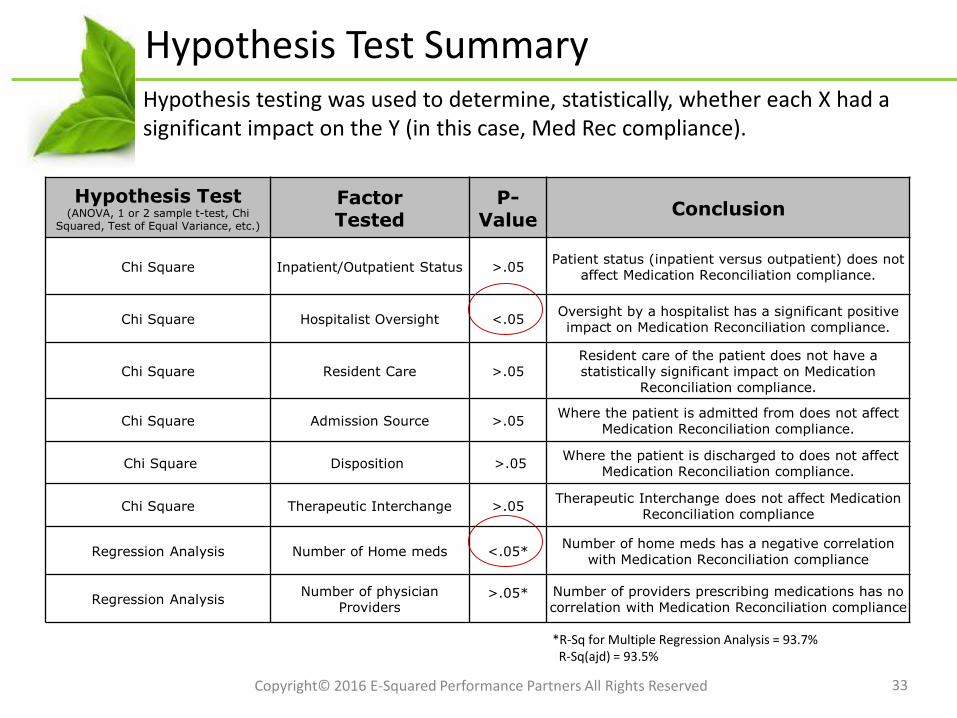
Hypothesis Test Summary
Hypothesis Test (ANOVA, 1 or 2 sample t-test, Chi
Squared, Test of Equal Variance, etc.)
FactorTested
P-Value
Conclusion
Chi Square Inpatient/Outpatient Status >.05Patient status (inpatient versus outpatient) does not
affect Medication Reconciliation compliance.
Chi Square Hospitalist Oversight <.05Oversight by a hospitalist has a significant positive impact on Medication Reconciliation compliance.
Chi Square Resident Care >.05Resident care of the patient does not have a statistically significant impact on Medication
Reconciliation compliance.
Chi Square Admission Source >.05Where the patient is admitted from does not affect
Medication Reconciliation compliance.
Chi Square Disposition >.05Where the patient is discharged to does not affect
Medication Reconciliation compliance.
Chi Square Therapeutic Interchange >.05Therapeutic Interchange does not affect Medication
Reconciliation compliance
Regression Analysis Number of Home meds <.05*Number of home meds has a negative correlation
with Medication Reconciliation compliance
Regression AnalysisNumber of physician
Providers>.05* Number of providers prescribing medications has no
correlation with Medication Reconciliation compliance
33
*R-Sq for Multiple Regression Analysis = 93.7%R-Sq(ajd) = 93.5%
Hypothesis testing was used to determine, statistically, whether each X had a significant impact on the Y (in this case, Med Rec compliance).
Copyright© 2016 E-Squared Performance Partners All Rights Reserved
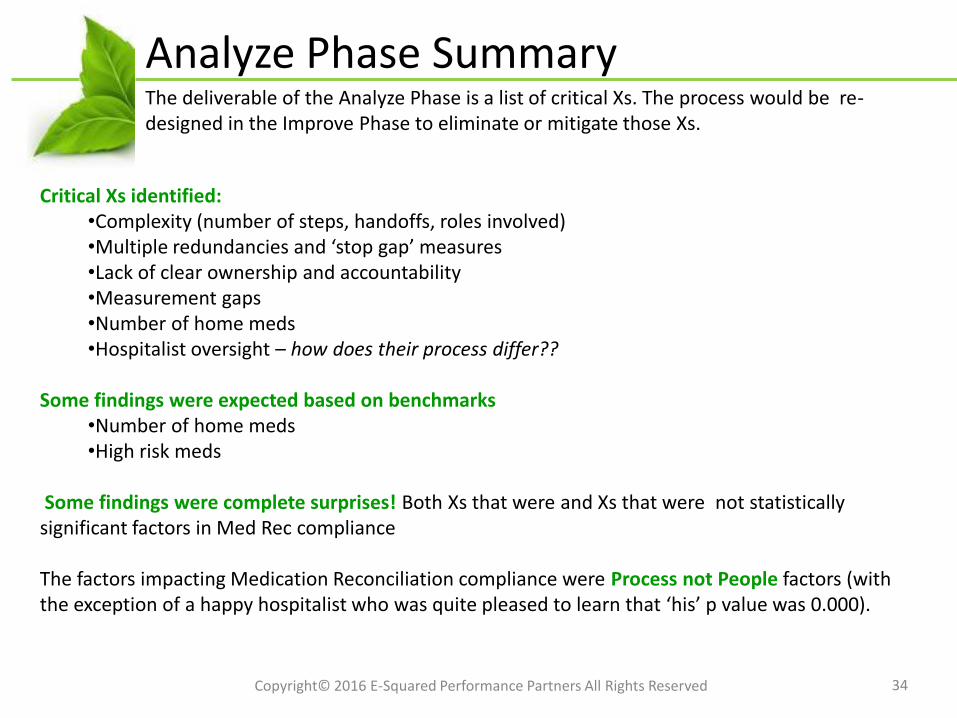
Analyze Phase Summary
34
Critical Xs identified:•Complexity (number of steps, handoffs, roles involved)•Multiple redundancies and ‘stop gap’ measures•Lack of clear ownership and accountability•Measurement gaps•Number of home meds•Hospitalist oversight – how does their process differ??
Some findings were expected based on benchmarks•Number of home meds•High risk meds
Some findings were complete surprises! Both Xs that were and Xs that were not statistically significant factors in Med Rec compliance
The factors impacting Medication Reconciliation compliance were Process not People factors (with the exception of a happy hospitalist who was quite pleased to learn that ‘his’ p value was 0.000).
The deliverable of the Analyze Phase is a list of critical Xs. The process would be re-designed in the Improve Phase to eliminate or mitigate those Xs.
Copyright© 2016 E-Squared Performance Partners All Rights Reserved
Medication Reconciliation: Improve
35
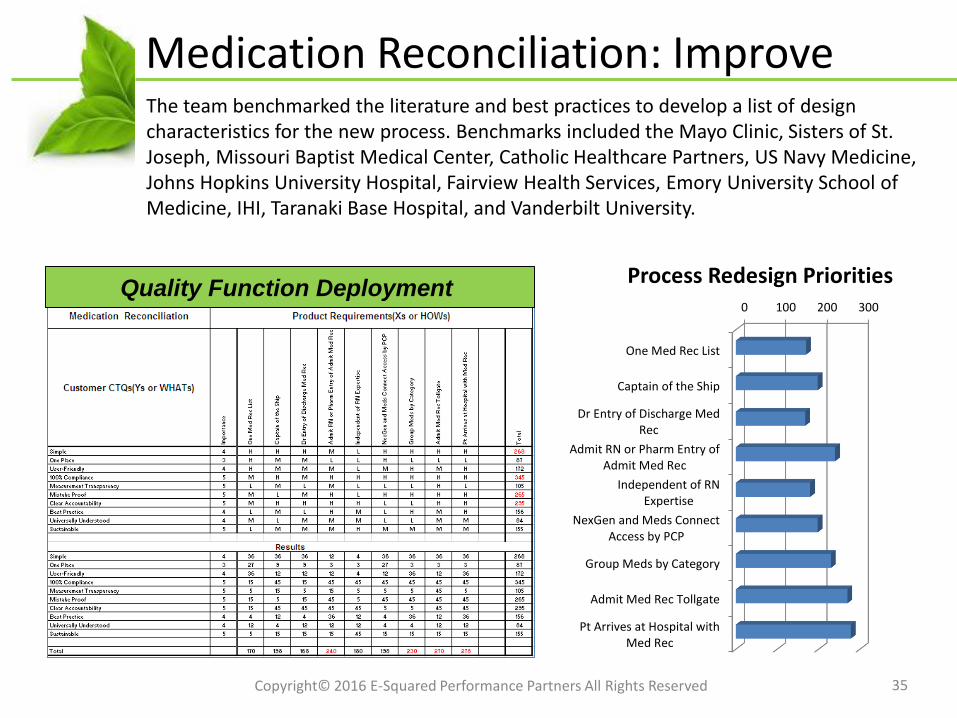
The team benchmarked the literature and best practices to develop a list of design characteristics for the new process. Benchmarks included the Mayo Clinic, Sisters of St. Joseph, Missouri Baptist Medical Center, Catholic Healthcare Partners, US Navy Medicine, Johns Hopkins University Hospital, Fairview Health Services, Emory University School of Medicine, IHI, Taranaki Base Hospital, and Vanderbilt University.
0 100 200 300
One Med Rec List
Captain of the Ship
Dr Entry of Discharge MedRec
Admit RN or Pharm Entry ofAdmit Med Rec
Independent of RNExpertise
NexGen and Meds ConnectAccess by PCP
Group Meds by Category
Admit Med Rec Tollgate
Pt Arrives at Hospital withMed Rec
Process Redesign PrioritiesQuality Function Deployment
Copyright© 2016 E-Squared Performance Partners All Rights Reserved
Hospitalist?
36
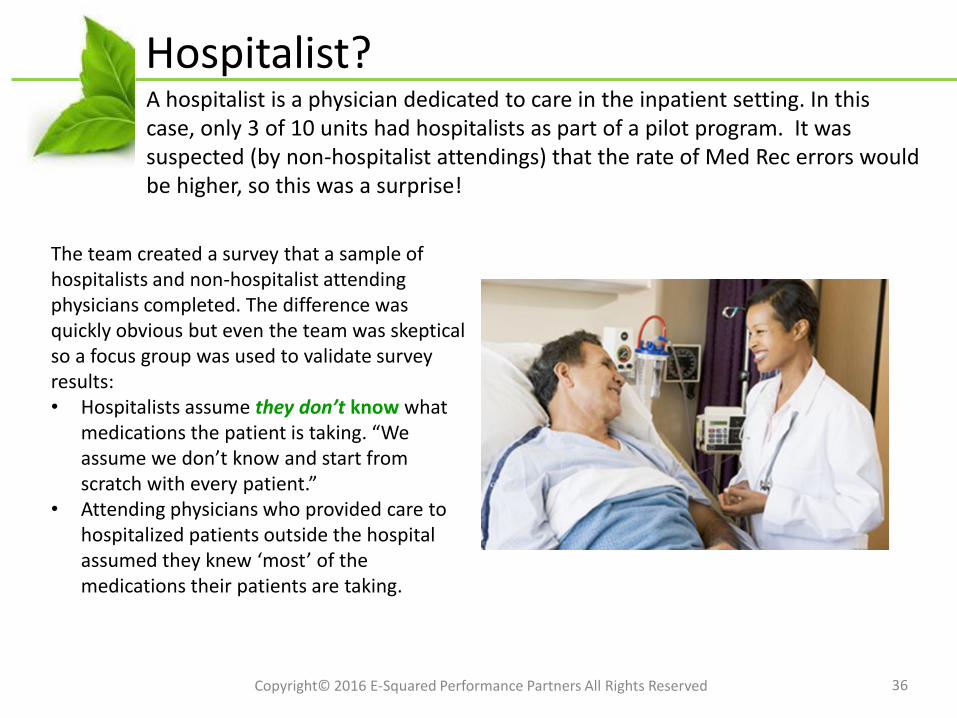
A hospitalist is a physician dedicated to care in the inpatient setting. In this case, only 3 of 10 units had hospitalists as part of a pilot program. It was suspected (by non-hospitalist attendings) that the rate of Med Rec errors would be higher, so this was a surprise!
Copyright© 2016 E-Squared Performance Partners All Rights Reserved
The team created a survey that a sample of hospitalists and non-hospitalist attending physicians completed. The difference was quickly obvious but even the team was skeptical so a focus group was used to validate survey results:• Hospitalists assume they don’t know what
medications the patient is taking. “We assume we don’t know and start from scratch with every patient.”
• Attending physicians who provided care to hospitalized patients outside the hospital assumed they knew ‘most’ of the medications their patients are taking.
Development of the Future State
37
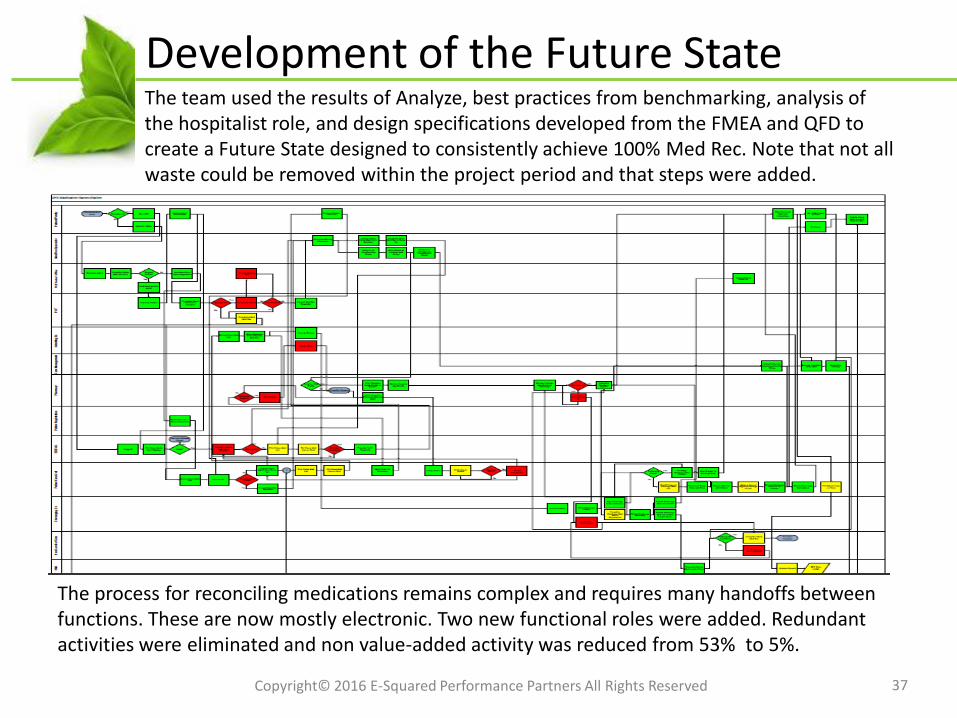
The process for reconciling medications remains complex and requires many handoffs between functions. These are now mostly electronic. Two new functional roles were added. Redundant activities were eliminated and non value-added activity was reduced from 53% to 5%.
The team used the results of Analyze, best practices from benchmarking, analysis of the hospitalist role, and design specifications developed from the FMEA and QFD to create a Future State designed to consistently achieve 100% Med Rec. Note that not all waste could be removed within the project period and that steps were added.
Copyright© 2016 E-Squared Performance Partners All Rights Reserved
Plan of Action
38
•Pre-Admit•Clarifications•System Improvements/Enhancements•Discharge
Quick Hit Improvements that required no further analysis were completed immediately.
More complex improvements required additional work (and time) to design and develop:1. Create, with patients, EMS and clinic partners, a home medication list 2. Define the competencies of the Admission Med Rec Specialist3. Develop the criteria for a Complex Medication Profile4. Develop ONE electronic and paper form for Medication Reconciliation5. Define the role of Discharge Pharmacist6. Define the specifications for necessary systems changes/enhancements
To achieve the Future State, an Action Plan was developed. A Solution Selection Matrix was used to prioritize solutions. It was divided into four categories:
Copyright© 2016 E-Squared Performance Partners All Rights Reserved
Quick Hit Improvements
39
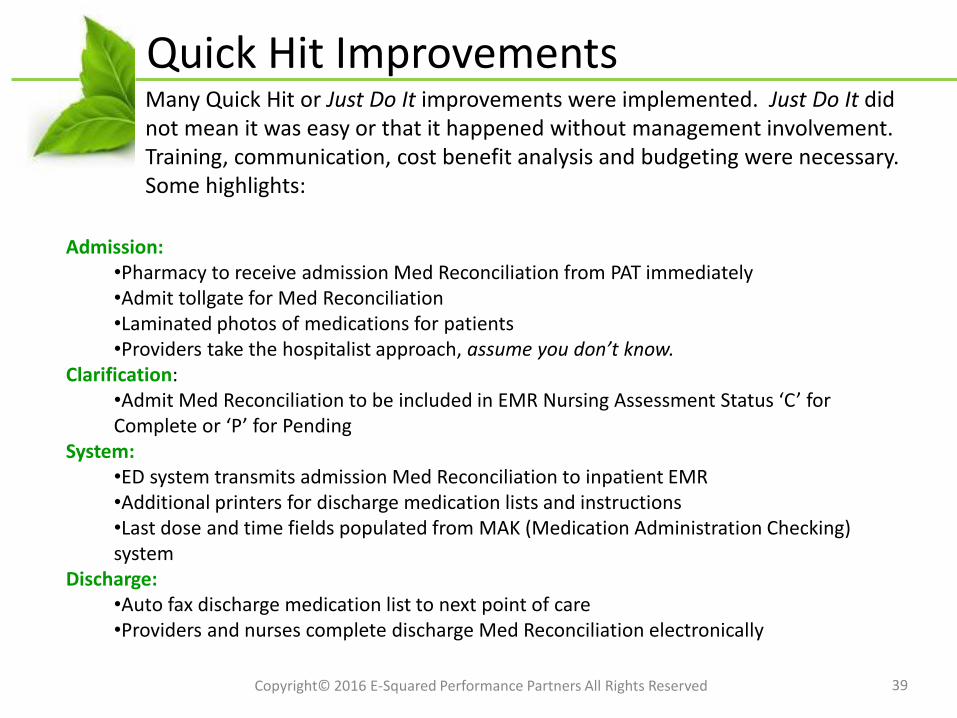
Admission:•Pharmacy to receive admission Med Reconciliation from PAT immediately•Admit tollgate for Med Reconciliation•Laminated photos of medications for patients•Providers take the hospitalist approach, assume you don’t know.
Clarification:•Admit Med Reconciliation to be included in EMR Nursing Assessment Status ‘C’ for Complete or ‘P’ for Pending
System:•ED system transmits admission Med Reconciliation to inpatient EMR•Additional printers for discharge medication lists and instructions•Last dose and time fields populated from MAK (Medication Administration Checking) system
Discharge: •Auto fax discharge medication list to next point of care•Providers and nurses complete discharge Med Reconciliation electronically
Copyright© 2016 E-Squared Performance Partners All Rights Reserved
Many Quick Hit or Just Do It improvements were implemented. Just Do It did not mean it was easy or that it happened without management involvement. Training, communication, cost benefit analysis and budgeting were necessary. Some highlights:
Failure Modes and Effects Analysis
40Copyright© 2016 E-Squared Performance Partners All Rights Reserved
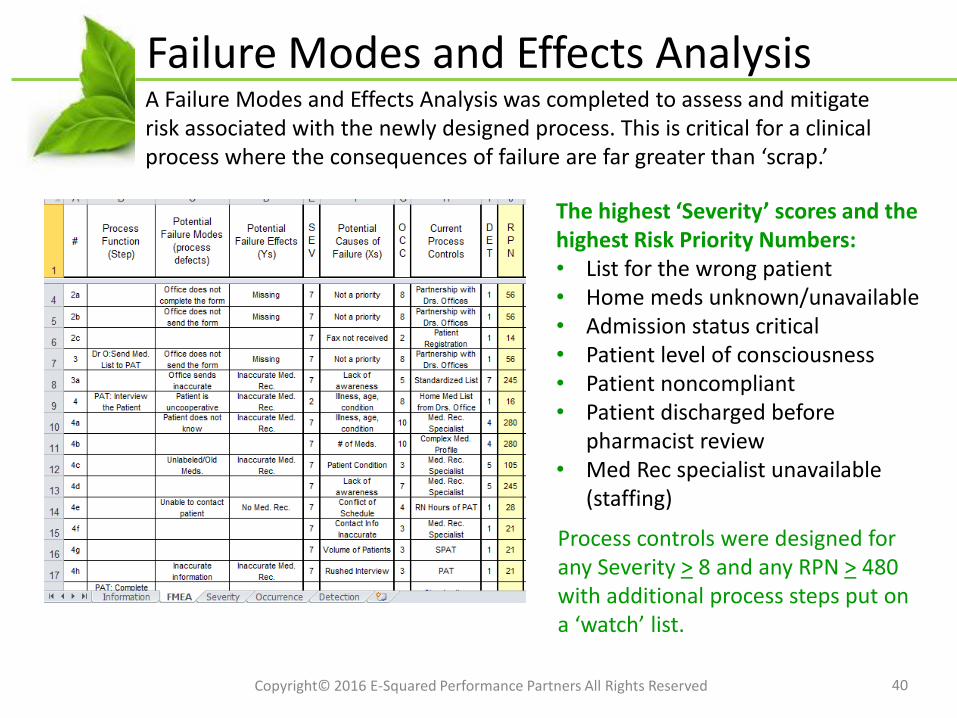
A Failure Modes and Effects Analysis was completed to assess and mitigate risk associated with the newly designed process. This is critical for a clinical process where the consequences of failure are far greater than ‘scrap.’
The highest ‘Severity’ scores and the highest Risk Priority Numbers:• List for the wrong patient• Home meds unknown/unavailable• Admission status critical• Patient level of consciousness• Patient noncompliant• Patient discharged before
pharmacist review• Med Rec specialist unavailable
(staffing)
Process controls were designed for any Severity > 8 and any RPN > 480 with additional process steps put on a ‘watch’ list.
Test of Change #1
41
Test of Change #1:Only 14 patients meeting the criteria for Complex Medication Profile were admitted to the care of a hospitalist on the Test unit. The Med Rec Specialist was able to closely monitor all applicable patients and there were no discrepancies noted in the test population but many lessons learned:
•System issues created some delays. •Access was a problem.•One patient was transferred in and the Med Rec Specialist was not notified.•Nurses report that it takes time to assist Physicians with the new form.•Residents want to be involved.
Positive feedback from the staff:
“It’s the first time a committee has ever done anything that actually makes it easier for the nurse to take care of patients.”
“OK…so this is easier than the old way. I didn’t expect that!”
A Test of Change was designed to pilot the new process. Due to the involvement of multiple physicians and the risk involved in medication administration, the initial Test of Change was limited to one Patient Care Unit and was closely monitored by the team to ensure patient safety.
Copyright© 2016 E-Squared Performance Partners All Rights Reserved
Test of Change #2
42
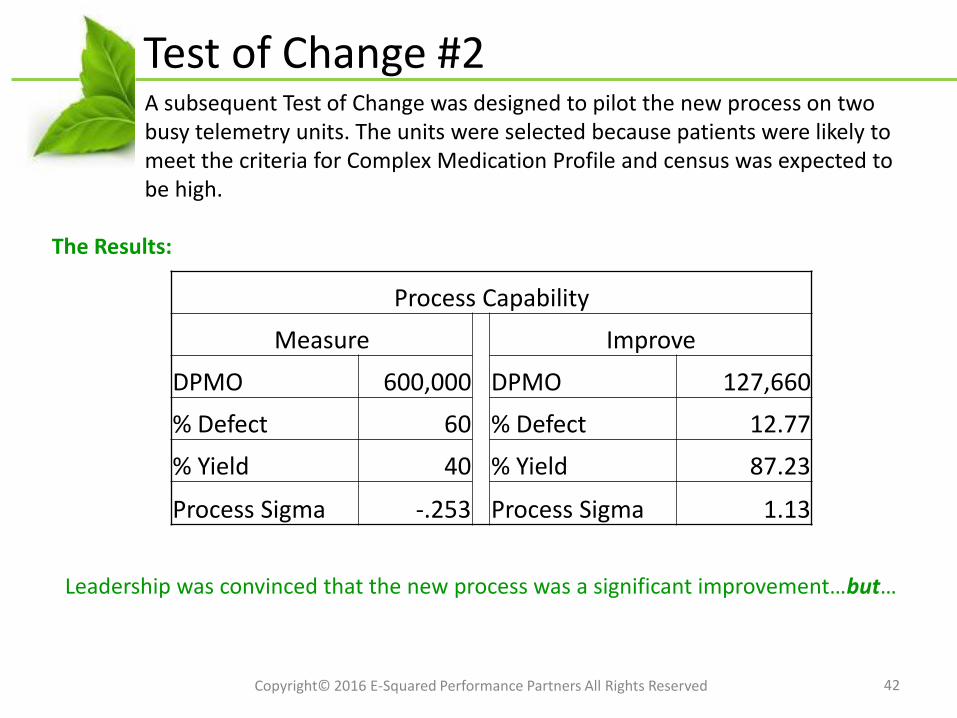
A subsequent Test of Change was designed to pilot the new process on two busy telemetry units. The units were selected because patients were likely to meet the criteria for Complex Medication Profile and census was expected to be high.
The Results:
Leadership was convinced that the new process was a significant improvement…but…
Process Capability
Measure Improve
DPMO 600,000 DPMO 127,660
% Defect 60 % Defect 12.77
% Yield 40 % Yield 87.23
Process Sigma -.253 Process Sigma 1.13
Copyright© 2016 E-Squared Performance Partners All Rights Reserved
A New Challenge
43
The team was directed to find a low-cost (a.k.a. no cost) solution that did not require any additional resources, especially additional staff .
The team was determined that the best solution had been developed and refusing to give up, they struggled to come up with a way to ensure that the cost of implementing the changes necessary to improve Medication Reconciliation would be less than the project was projected to save. It worked!! More details on how later…
Hospital Leadership agreed to move forward with a Phased Implementation beginning in early 2011 and completed in 2012.
Copyright© 2016 E-Squared Performance Partners All Rights Reserved
Improve Phase Summary
44
• Some improvements were easy. Others took time and effort to develop.
• Tests of Change were critical to pilot process improvements and reduce resistance to change. Lessons learned were incorporated into the Future State.
• Even the best solution risks failure to implement in this time of cost consciousness and near-sighted resource constraints
• Keys to Success:• A dedicated physician Champion• An energized and enthusiastic team• Rock-solid data and analysis• Persistence in the face of opposition and delays• Support and involvement of key stakeholders (Hospitalist, Director of Pharmacy)• Thinking outside the box
In the Improve Phase, process improvements were developed, tested and refined. This project was further delayed when leadership decided that a low-cost alternative to the team’s Future State design was needed.
Copyright© 2016 E-Squared Performance Partners All Rights Reserved
Medication Reconciliation: Control
45
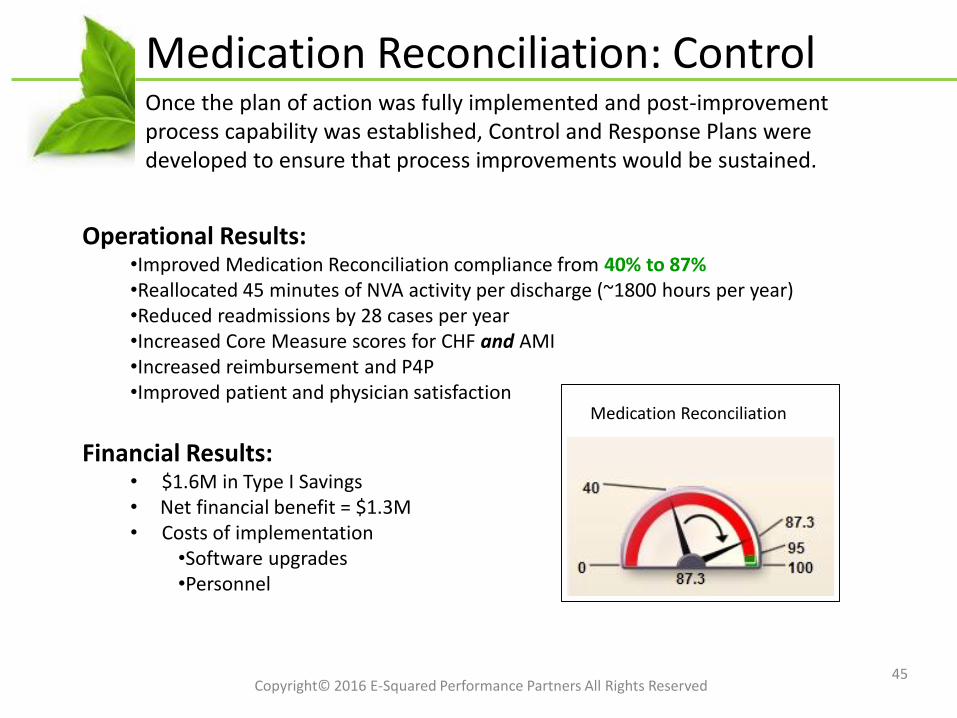
Operational Results:•Improved Medication Reconciliation compliance from 40% to 87%•Reallocated 45 minutes of NVA activity per discharge (~1800 hours per year)•Reduced readmissions by 28 cases per year•Increased Core Measure scores for CHF and AMI•Increased reimbursement and P4P•Improved patient and physician satisfaction
Financial Results:• $1.6M in Type I Savings• Net financial benefit = $1.3M• Costs of implementation
•Software upgrades•Personnel
Medication Reconciliation
Once the plan of action was fully implemented and post-improvement process capability was established, Control and Response Plans were developed to ensure that process improvements would be sustained.
Copyright© 2016 E-Squared Performance Partners All Rights Reserved
Statistical Process Control
46
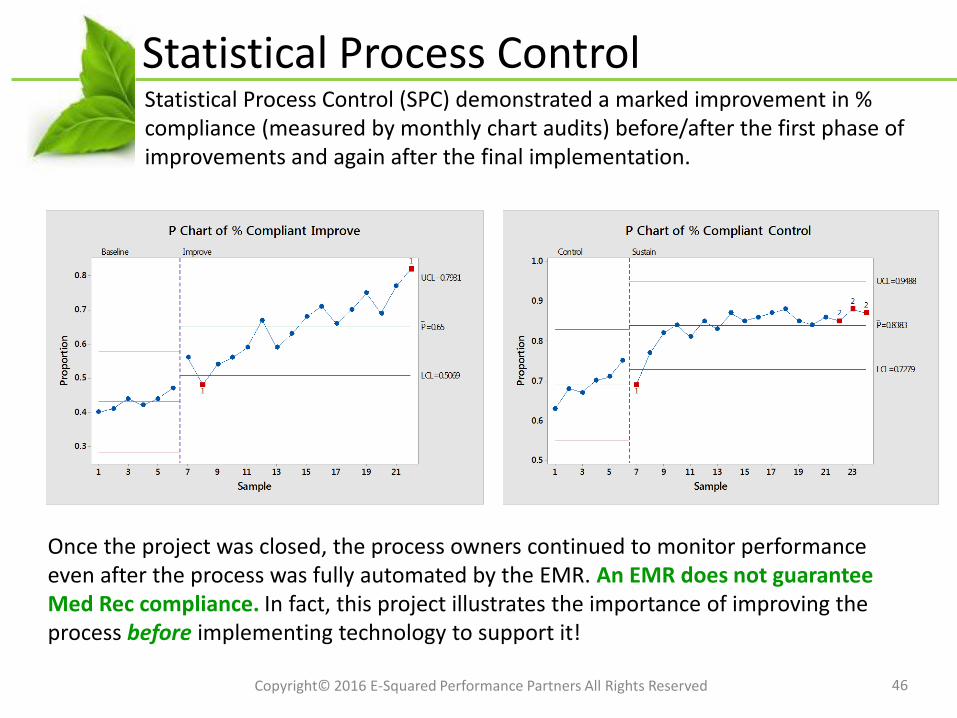
Statistical Process Control (SPC) demonstrated a marked improvement in % compliance (measured by monthly chart audits) before/after the first phase of improvements and again after the final implementation.
Once the project was closed, the process owners continued to monitor performance even after the process was fully automated by the EMR. An EMR does not guarantee Med Rec compliance. In fact, this project illustrates the importance of improving the process before implementing technology to support it!
Copyright© 2016 E-Squared Performance Partners All Rights Reserved
Control Phase Summary
47
Control Plan Elements:• Compare compliance across units (implementing versus not yet implementing)• Data collection and reporting identical to Test of Change 2• Utilize Statistical Process Control for each unit implementing• Report process capability to executive leadership monthly• Link Medication Reconciliation to the developing Balanced Scorecard
Next Steps:• Replicate improvements at county hospitals and extend to other physician
practices and clinics in the network• Re-visit process when the EMR is fully functional, incorporating lessons-
learned into roll-out specifications
Deliverables of the Control Phase include a hand-off of the project to the process owner. This large-scale project took more than a year to complete and was monitored for an additional year as process improvements were rolled out across the system.
Copyright© 2016 E-Squared Performance Partners All Rights Reserved

Copyright© 2016 E-Squared Performance Partners All Rights Reserved
Departures From the Roadmap
Copyright© 2016 E-Squared Performance Partners All Rights Reserved
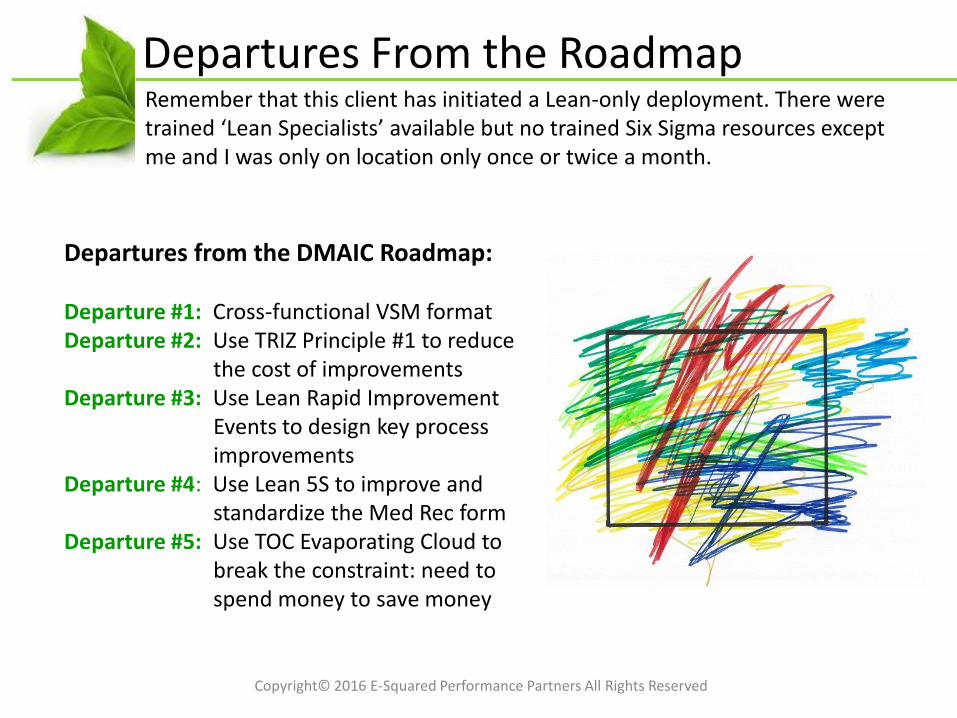
Remember that this client has initiated a Lean-only deployment. There were trained ‘Lean Specialists’ available but no trained Six Sigma resources except me and I was only on location only once or twice a month.
Departures From the Roadmap
Departures from the DMAIC Roadmap:
Departure #1: Cross-functional VSM formatDeparture #2: Use TRIZ Principle #1 to reduce
the cost of improvementsDeparture #3: Use Lean Rapid Improvement
Events to design key process improvements
Departure #4: Use Lean 5S to improve and standardize the Med Rec form
Departure #5: Use TOC Evaporating Cloud to break the constraint: need to spend money to save money
Copyright© 2016 E-Squared Performance Partners All Rights Reserved
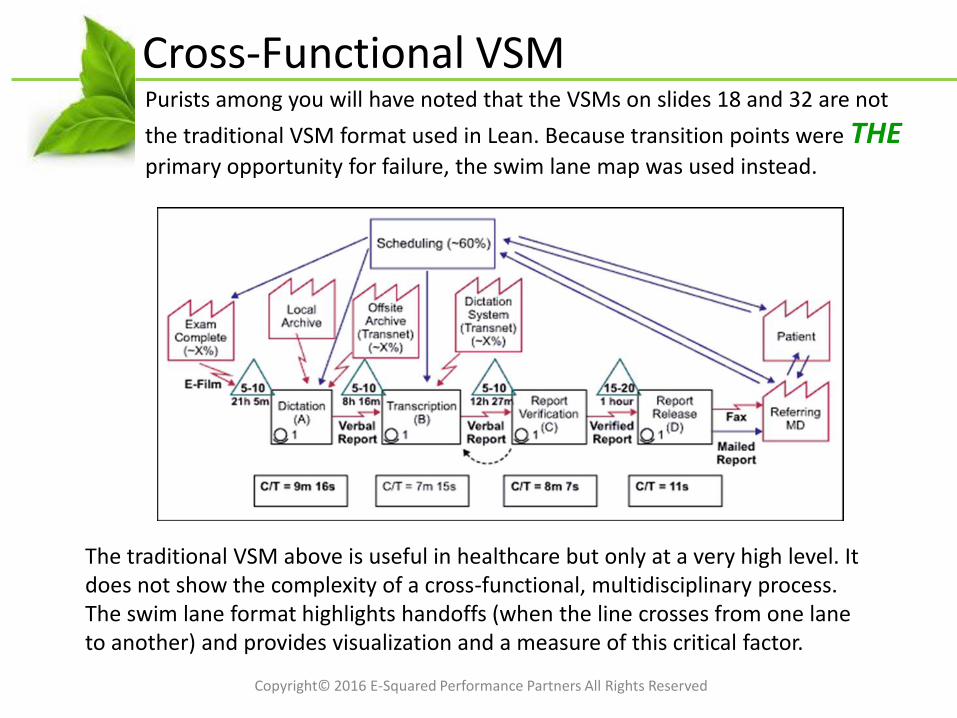
Purists among you will have noted that the VSMs on slides 18 and 32 are not
the traditional VSM format used in Lean. Because transition points were THEprimary opportunity for failure, the swim lane map was used instead.
Cross-Functional VSM
The traditional VSM above is useful in healthcare but only at a very high level. It does not show the complexity of a cross-functional, multidisciplinary process. The swim lane format highlights handoffs (when the line crosses from one lane to another) and provides visualization and a measure of this critical factor.
Copyright© 2016 E-Squared Performance Partners All Rights Reserved
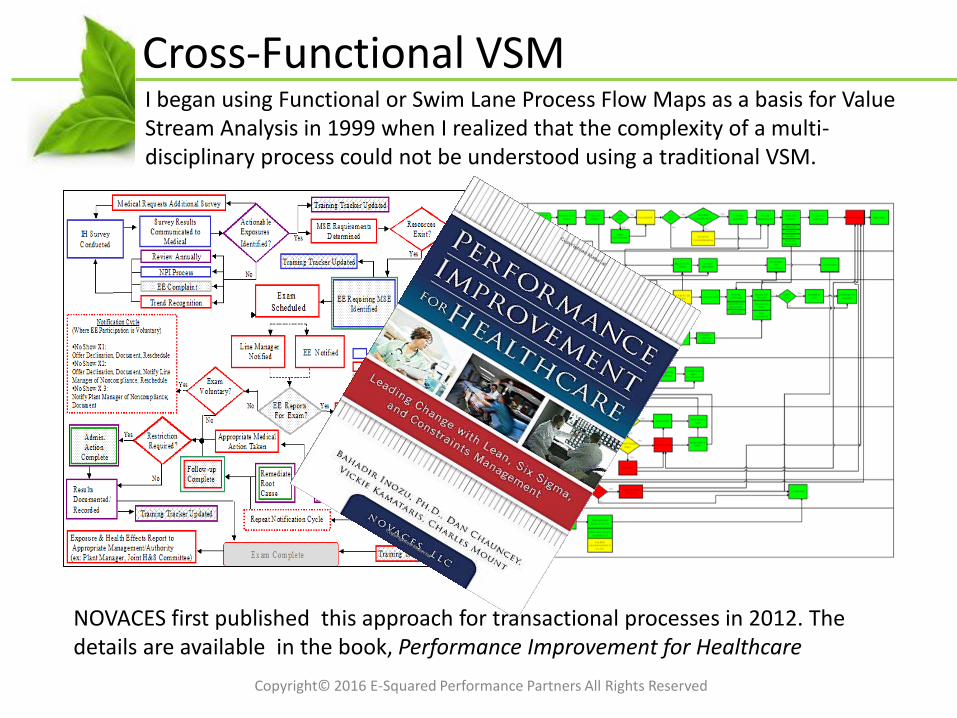
I began using Functional or Swim Lane Process Flow Maps as a basis for Value Stream Analysis in 1999 when I realized that the complexity of a multi-disciplinary process could not be understood using a traditional VSM.
Cross-Functional VSM
NOVACES first published this approach for transactional processes in 2012. The details are available in the book, Performance Improvement for Healthcare
Copyright© 2016 E-Squared Performance Partners All Rights Reserved
The cost of applying all the process improvements to every admission, transfer, and discharge (25,000 admissions in 2009) would have exceeded $5M per year. Some means of segregating the most at-risk patients was needed.
TRIZ: Complex Med Profile
TRIZ, теория решения изобретательских задач, the Theory of Inventive Problem-Solving, is derived from generalizable patterns of invention in the global patent literature and was developed by the Soviet inventor, Genrich Altshuller.
TRIZ Fundamentals:• Somebody, sometime, somewhere has
already solved your problem or one similar to it. Creativity means finding that solution and adapting it to your current problem.
• Don’t accept contradictions, resolve them!
The team used TRIZ Principle #1: Segmentation to narrow the scope of the most costly improvements to 21.8% of admitted patients. Only those patients with a Complex Medication Profile would receive the highest level of intervention.
TRIZ Tools:• 40 Principles of Invention• Contradiction Matrix• Ideality/Ideal Final Result/Ideality• Smart Little People• Functional Analysis and Trimming• 76 Standard Solutions
Copyright© 2016 E-Squared Performance Partners All Rights Reserved
I was discouraged to find that very little was accomplished in the intervals between site visits. Newly trained Lean Experts did not see an alternative to hand-holding in a Six Sigma DMAIC project of this scope.
Lean RIW: Several Key Improvements
A Rapid Improvement Workshop (RIW), Event (RIE) or Kaizen is used to create and implement solutions when the cause(s) are known. In this case, the solutions were known but the how was not known…a perfect opportunity!
RIWs Chartered:• Home Med List Refrigerator Magnet• Complex Med Profile• Role of the Med Rec Specialist• Role of the Discharge Pharmacist• Design Specs for EMR enhancements• Simplified pharmacy process
Why RIWs worked:• Chartering the events created structure and
accountability (Workplan and Champion)• SMEs not on the DMAIC team were needed• Scope, goals, objectives, and timelines were
clear; the RIW structure was familiar
Copyright© 2016 E-Squared Performance Partners All Rights Reserved
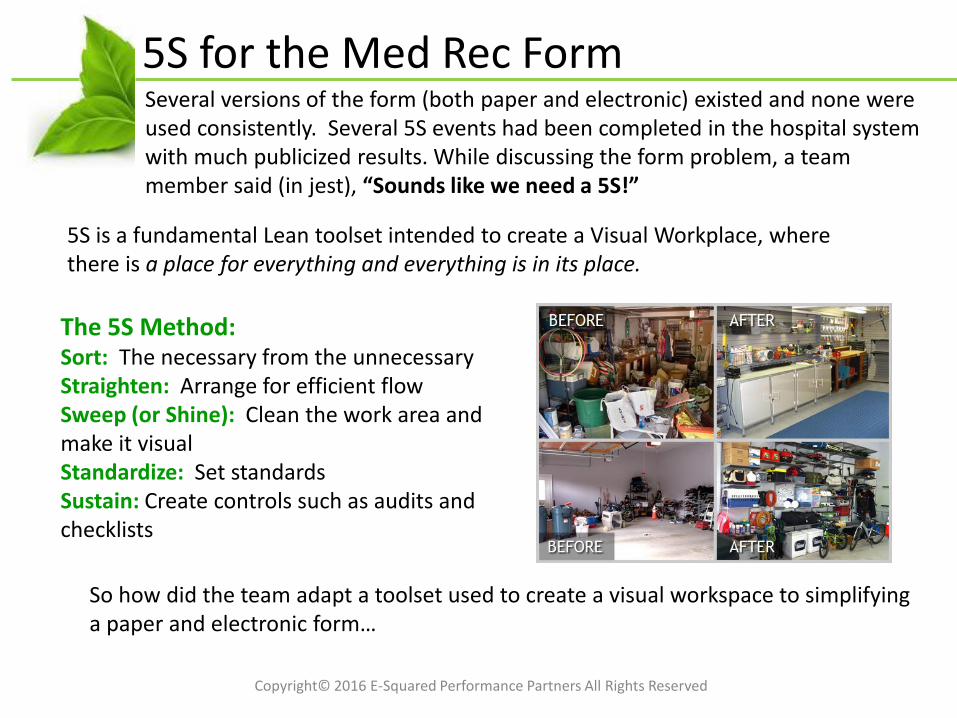
Several versions of the form (both paper and electronic) existed and none were used consistently. Several 5S events had been completed in the hospital system with much publicized results. While discussing the form problem, a team member said (in jest), “Sounds like we need a 5S!”
5S for the Med Rec Form
5S is a fundamental Lean toolset intended to create a Visual Workplace, where there is a place for everything and everything is in its place.
So how did the team adapt a toolset used to create a visual workspace to simplifying a paper and electronic form…
The 5S Method:Sort: The necessary from the unnecessaryStraighten: Arrange for efficient flowSweep (or Shine): Clean the work area and make it visualStandardize: Set standardsSustain: Create controls such as audits and checklists
Copyright© 2016 E-Squared Performance Partners All Rights Reserved
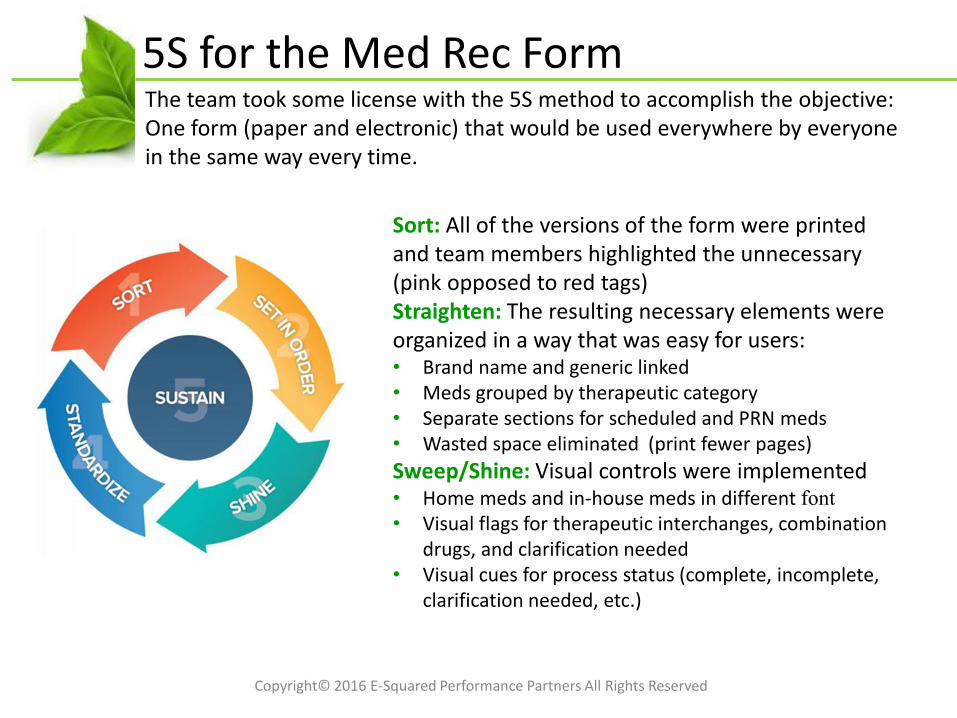
The team took some license with the 5S method to accomplish the objective: One form (paper and electronic) that would be used everywhere by everyone in the same way every time.
5S for the Med Rec Form
Sort: All of the versions of the form were printed and team members highlighted the unnecessary (pink opposed to red tags)Straighten: The resulting necessary elements were organized in a way that was easy for users:• Brand name and generic linked• Meds grouped by therapeutic category• Separate sections for scheduled and PRN meds• Wasted space eliminated (print fewer pages)
Sweep/Shine: Visual controls were implemented• Home meds and in-house meds in different font• Visual flags for therapeutic interchanges, combination
drugs, and clarification needed• Visual cues for process status (complete, incomplete,
clarification needed, etc.)
Copyright© 2016 E-Squared Performance Partners All Rights Reserved
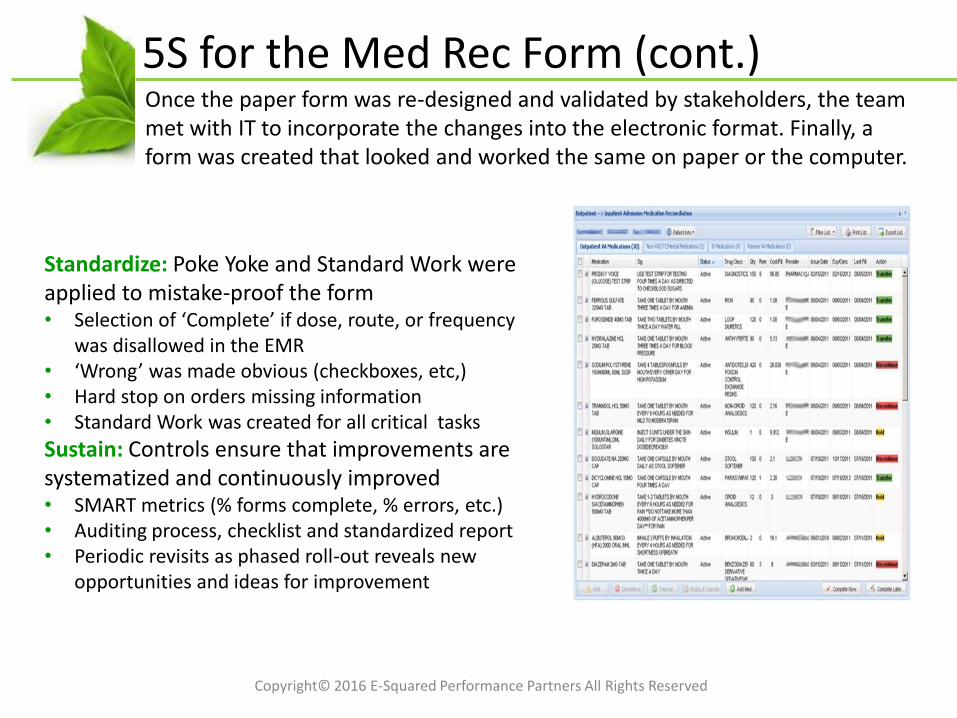
Once the paper form was re-designed and validated by stakeholders, the team met with IT to incorporate the changes into the electronic format. Finally, a form was created that looked and worked the same on paper or the computer.
5S for the Med Rec Form (cont.)
Standardize: Poke Yoke and Standard Work were applied to mistake-proof the form • Selection of ‘Complete’ if dose, route, or frequency
was disallowed in the EMR• ‘Wrong’ was made obvious (checkboxes, etc,)• Hard stop on orders missing information• Standard Work was created for all critical tasks
Sustain: Controls ensure that improvements are systematized and continuously improved• SMART metrics (% forms complete, % errors, etc.)• Auditing process, checklist and standardized report• Periodic revisits as phased roll-out reveals new
opportunities and ideas for improvement
Copyright© 2016 E-Squared Performance Partners All Rights Reserved
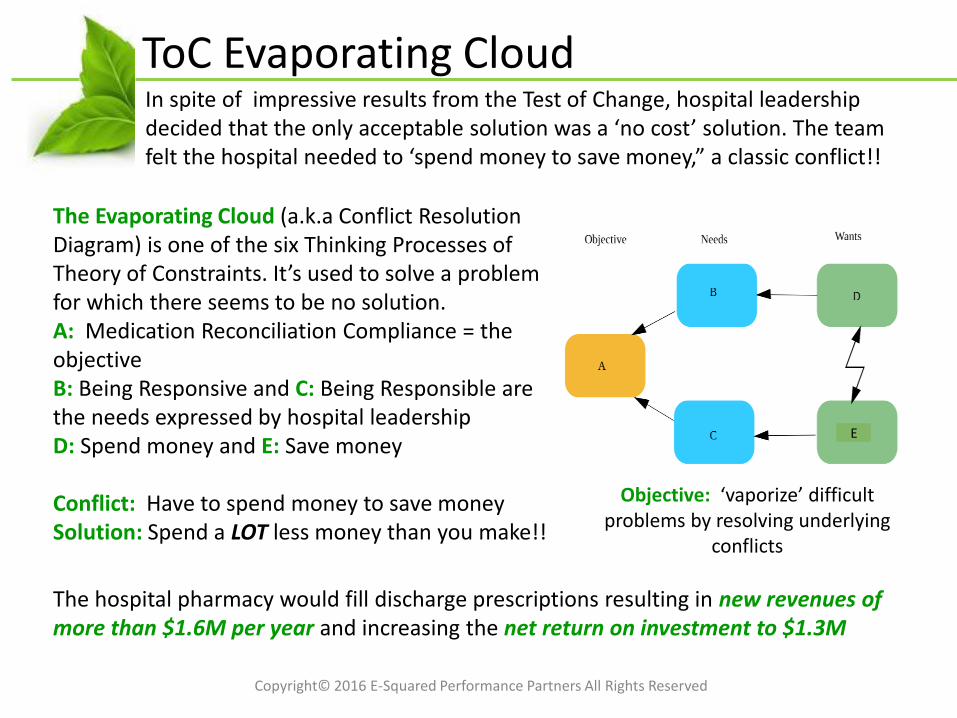
ToC Evaporating CloudIn spite of impressive results from the Test of Change, hospital leadership decided that the only acceptable solution was a ‘no cost’ solution. The team felt the hospital needed to ‘spend money to save money,” a classic conflict!!
The Evaporating Cloud (a.k.a Conflict Resolution Diagram) is one of the six Thinking Processes of Theory of Constraints. It’s used to solve a problem for which there seems to be no solution. A: Medication Reconciliation Compliance = the objectiveB: Being Responsive and C: Being Responsible are the needs expressed by hospital leadershipD: Spend money and E: Save money
Conflict: Have to spend money to save moneySolution: Spend a LOT less money than you make!!
Objective: ‘vaporize’ difficult problems by resolving underlying
conflicts
The hospital pharmacy would fill discharge prescriptions resulting in new revenues of more than $1.6M per year and increasing the net return on investment to $1.3M
E
Copyright© 2016 E-Squared Performance Partners All Rights Reserved
Some CaveatsThis project was highly successful. Compliance was further improved when the EMR was fully implemented in 2012. Paper forms (for network patients) were virtually eliminated. The processes created were used to provide design specifications to the EMR implementation team. Remember…don’t do it in vapor til you can do it on paper!!
But…• The improvements made in this hospital can not
be applied as a template in any other. Each organization is unique. This is why ‘tactics’ don’t work.
• This project took more than a year to complete and another to fully implement. Perseverance (team) and patience (leadership) was necessary.
• Discrepancies continue to be found. The purpose of the process is to reconcile discrepancies, not totally eliminate them. People will be people and thus Clinicians need to be clinicians.
Copyright© 2016 E-Squared Performance Partners All Rights Reserved
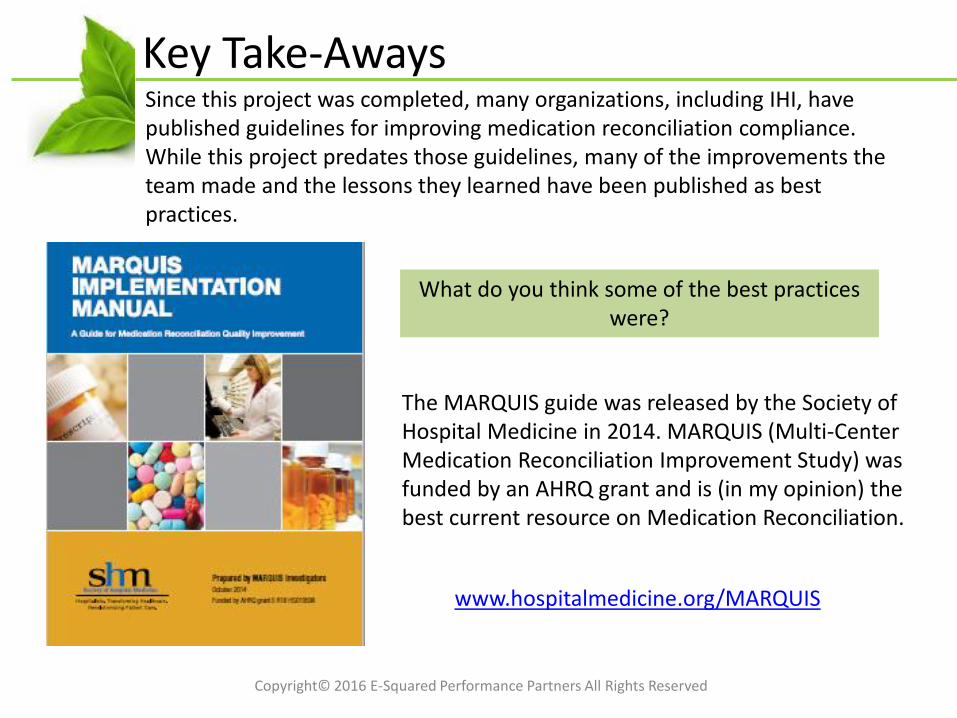
Key Take-AwaysSince this project was completed, many organizations, including IHI, have published guidelines for improving medication reconciliation compliance. While this project predates those guidelines, many of the improvements the team made and the lessons they learned have been published as best practices.
The MARQUIS guide was released by the Society of Hospital Medicine in 2014. MARQUIS (Multi-Center Medication Reconciliation Improvement Study) was funded by an AHRQ grant and is (in my opinion) the best current resource on Medication Reconciliation.
www.hospitalmedicine.org/MARQUIS
What do you think some of the best practices were?
Conclusion
Questions?
60Copyright© 2016 E-Squared Performance Partners All Rights Reserved