Embed Size (px)
Citation preview

A Lean Six Sigma Approach to Traditional IT Call Center Staffing
MIT LFM/SDM WebinarSeptember 7, 2007
Habs M. MoyDirector, Business Re-Engineering and Quality
Originally presented atWCBF 3rd Annual Six Sigma in Service & Transactional Environments Conference
Scottsdale, AZOctober 27, 2006

October 27, 2006 2
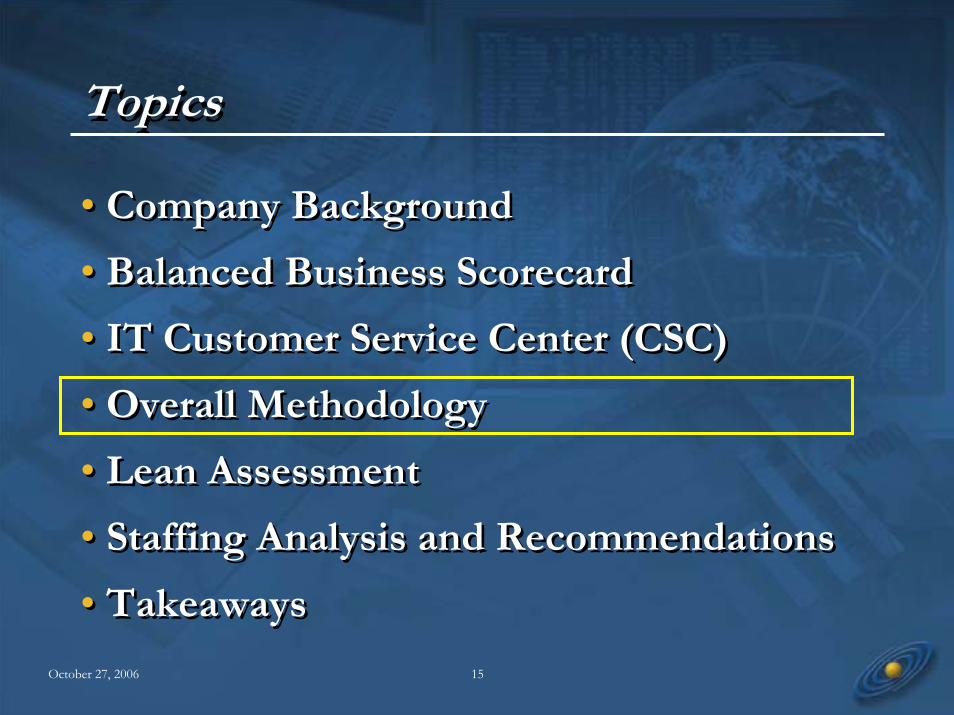
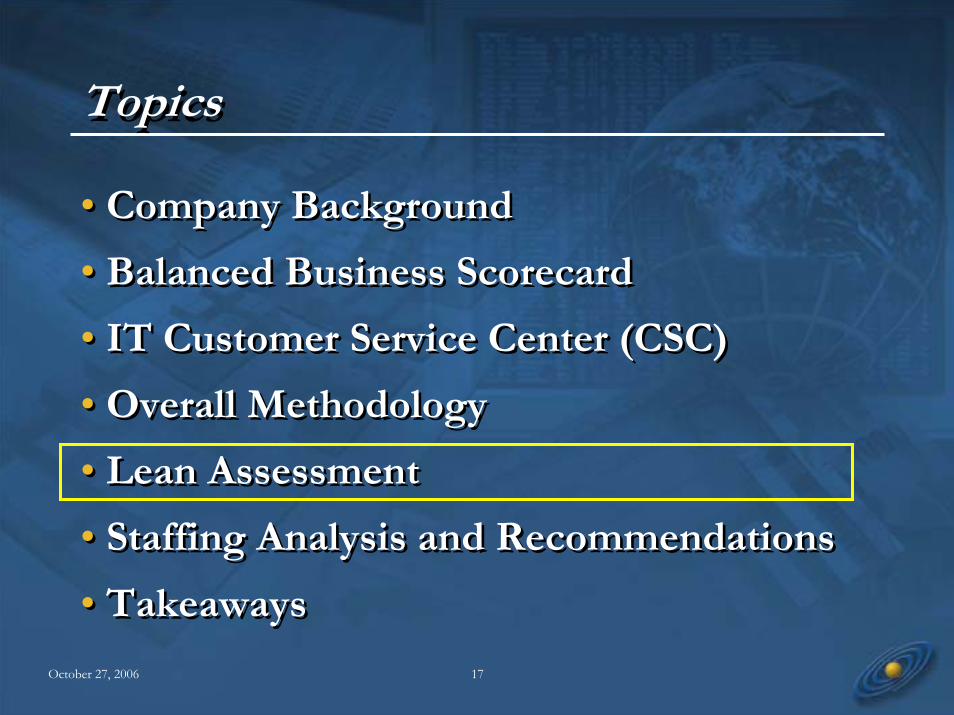
TopicsTopics
• Company Background
• Balanced Business Scorecard
• IT Customer Service Center (CSC)
• Overall Methodology
• Lean Assessment
• Staffing Analysis and Recommendations
• Takeaways
• Company Background
• Balanced Business Scorecard
• IT Customer Service Center (CSC)
• Overall Methodology
• Lean Assessment
• Staffing Analysis and Recommendations
• Takeaways

October 27, 2006 3
Depository Trust & Clearing Corp.Depository Trust & Clearing Corp.
• Largest post-trade financial services infrastructure organization in the world
• “Cradle-to-Grave”management of securities
• Primary business focus on clearance, settlement and asset servicing for equity and fixed income securities
• Industry owned
• Largest post-trade financial services infrastructure organization in the world
• “Cradle-to-Grave”management of securities
• Primary business focus on clearance, settlement and asset servicing for equity and fixed income securities
• Industry owned

October 27, 2006 4
NYSE / NASD
Mutual Funds
Insurance Companies
Trust Companies
NYSE / NASD
Mutual Funds
Insurance Companies
Trust Companies
Banks
Broker / Dealers
Investment Managers
Securities Firms
Banks
Broker / Dealers
Investment Managers
Securities Firms
DTCC CustomersDTCC Customers
More than 11,000 companies withinthe global financial services industry

October 27, 2006 5
2005 Performance Highlights2005 Performance Highlights
Total number of shares traded: 853 billion
6.8 billion: Total number of transactions processed
$127.5 trillion: Financial obligations eliminated through netting
Value of securities on deposit: $31.2 trillion
Rebates, discounts and interest given back to customers: $528 million
Value of securities settled through DTCC: $1.4 quadrillion
$1.7 trillion: Value of mutual fund transactions processed

October 27, 2006 6
TopicsTopics
• Company Background
• Balanced Business Scorecard
• IT Customer Service Center (CSC)
• Overall Methodology
• Lean Assessment
• Staffing Analysis and Recommendations
• Takeaways
• Company Background
• Balanced Business Scorecard
• IT Customer Service Center (CSC)
• Overall Methodology
• Lean Assessment
• Staffing Analysis and Recommendations
• Takeaways

October 27, 2006 7
Balanced Business ScorecardBalanced Business Scorecard
Stakeholder / Financial Customer / Service Delivery
Strategic Positioning Employee / Learning and Growth

October 27, 2006 8
Customer / Service DeliveryCustomer / Service Delivery
• Meet and Exceed Customer Service Level Expectations
• Improve Customer Cost-Effectiveness
• Maintain Operational Excellence in Customer Critical Processes
• Ensure System/Service Reliability
• Meet and Exceed Customer Service Level Expectations
• Improve Customer Cost-Effectiveness
• Maintain Operational Excellence in Customer Critical Processes
• Ensure System/Service Reliability

October 27, 2006 9
TopicsTopics
• Company Background
• Balanced Business Scorecard
• IT Customer Service Center (CSC)
• Overall Methodology
• Lean Assessment
• Staffing Analysis and Recommendations
• Takeaways
• Company Background
• Balanced Business Scorecard
• IT Customer Service Center (CSC)
• Overall Methodology
• Lean Assessment
• Staffing Analysis and Recommendations
• Takeaways

October 27, 2006 10
Customer Service Center (CSC)Customer Service Center (CSC)
IT Service Centers• New York, NY
• Tampa, FL
Current Staffing• ~ 20 agents
• Fully staffed during core business hours, 0800-1700
• Skeleton staff off hours, weekends and holidays
IT Service Centers• New York, NY
• Tampa, FL
Current Staffing• ~ 20 agents
• Fully staffed during core business hours, 0800-1700
• Skeleton staff off hours, weekends and holidays
Inquiry Demographics• 10,000 inquiries per month
• Phone• Email
• Internal and external inquiries
CSC Customer Satisfaction• 2005 = 60%
• 2006 = 87%
Inquiry Demographics• 10,000 inquiries per month
• Phone• Email
• Internal and external inquiries
CSC Customer Satisfaction• 2005 = 60%
• 2006 = 87%

October 27, 2006 11
Anatomy of a Phone InquiryAnatomy of a Phone Inquiry
Talk Time Wrap-up
Handle Time
Speed to Answer
Abandon Rate
Service Factor
Call initiated Caller selectsfrom menu(s)
Availableagent greets
caller
Agent promptscaller forcontact
information
Discussproblem
Trouble-shootingreq’d?
Troubleshoot
Resolveinquiry?
Agent providesticket number
to caller
End call
End call Completeticket
Y
YN
N
Close ticketCompleteticket

October 27, 2006 12
Effectiveness & Efficiency MetricsEffectiveness & Efficiency MetricsAssessments Factors of Measurement Efficiency or
EffectivenessAverage abandonment rate EffectivenessFirst call resolution EffectivenessAverage speed of answer EfficiencyAverage time in queue EffectivenessService level - center's ability to achieve its call answer goal EffectivenessAverage calls per agent shift EfficiencyAverage time before abandonment n/aAverage talk time Efficiency
Other Operational Metrics Efficiency or Effectiveness
After-call work time EfficiencyAnnual turnover EfficiencyComplaints percentage Effectiveness
Efficiency Metrics Agent-centric measurements that deliver interaction optimization by measuring agents' productivity Productivity
Effectiveness MetricsCustomer-centric measurements that deliver business optimization by providing a view of the quality of the customer's experience
Quality
Source: (1) Operations Council, Primary Research Brief: Call Center Capacity Planning , Corporate Executive Board, June, 2005
Direct Causal Agents - accurately predict caller satisfactionCorrelative but non-causal agents - do not necessarily represent direct causal relationships to customer satisfactionNot statistically significant - exhibit no statistically significant correlation to customer satisfaction

October 27, 2006 13
CSC PerformanceCSC Performance
Jan-
05
Feb-
05
Mar
-05
Apr
-05
May
-05
Jun-
05
Jul-0
5
Aug-
05
Sep-
05
Oct
-05
Nov
-05
Dec
-05
Jan-
06
Feb-
06
Mar
-06
Apr
-06
May
-06
Jun-
06
Total Calls / 100 Service Factor 20s * 100 Average Handle Time / 10
Days Unavailable Abandon Rate * 1000 Average Speed of Answer
2005 2006

October 27, 2006 14
Benchmarking*Benchmarking*
• Length of Time for First Level Calls• Mean: 5.4 min• Median: 4 min
• Abandonment Rate• Target
• Mean: 3.5%• Median: 3.0%
• Actual• Mean: 5.2%• Median: 4.0%
• Average Speed to Answer• Target: 21.1% between 21-30 sec, 23.3% between 10-20 sec• Actual: 58% 20 seconds or less (Financial Services)
• Availability (% of time on phone + call wrap-up + email)• 77%
* HDI 2005 Practices & Salary Survey, Help Desk * HDI 2005 Practices & Salary Survey, Help Desk Institute, 2006.Institute, 2006.
October 27, 2006 15
TopicsTopics
• Company Background
• Balanced Business Scorecard
• IT Customer Service Center (CSC)
• Overall Methodology
• Lean Assessment
• Staffing Analysis and Recommendations
• Takeaways
• Company Background
• Balanced Business Scorecard
• IT Customer Service Center (CSC)
• Overall Methodology
• Lean Assessment
• Staffing Analysis and Recommendations
• Takeaways

October 27, 2006 16
Overall MethodologyOverall Methodology
Lean Assessment
• Observed two supervisors and 7 agents randomly selected by
Lean Assessment
• Observed two supervisors and 7 agents randomly selected by
Site: NY and FL Shift: First/Second
Experience: High/Low Performance: Variable
Days of Week: MTWThF
Staffing Analysis
• Reviewed overall trends from Jan05 –Jun06
• Analysis based on Jan06-Jun06 volumes & metrics
Staffing Analysis
• Reviewed overall trends from Jan05 –Jun06
• Analysis based on Jan06-Jun06 volumes & metrics
October 27, 2006 17
TopicsTopics
• Company Background
• Balanced Business Scorecard
• IT Customer Service Center (CSC)
• Overall Methodology
• Lean Assessment
• Staffing Analysis and Recommendations
• Takeaways
• Company Background
• Balanced Business Scorecard
• IT Customer Service Center (CSC)
• Overall Methodology
• Lean Assessment
• Staffing Analysis and Recommendations
• Takeaways

October 27, 2006 18
Opportunities to Eliminate WasteOpportunities to Eliminate Waste
Overproduction
Waiting
Defects
Extra Processing
Transportation
Inventory
• Mismatch between ticket and call workflow
• Multiple blank tickets open
• System response lag • Variability in second level support
• Retyping• Legacy fields• Follow-up on open tickets
Motion
7 Types
of Waste
• Ticket workflow
October 27, 2006 19
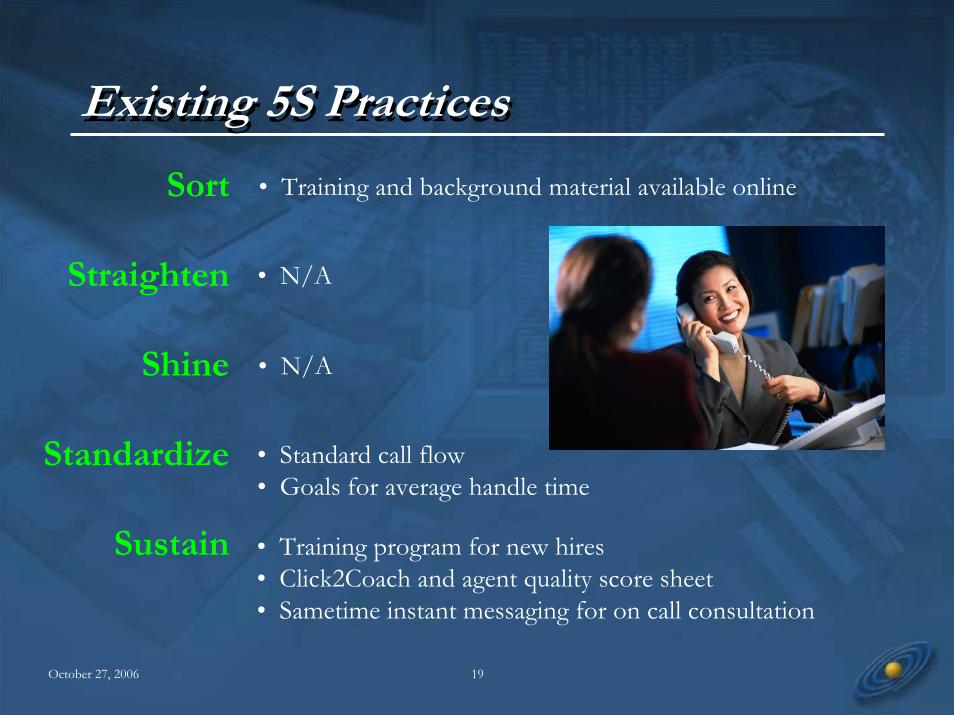
Existing 5S PracticesExisting 5S Practices
Sort
Straighten
Shine
Standardize
Sustain
• Standard call flow• Goals for average handle time
• Training and background material available online
• Training program for new hires• Click2Coach and agent quality score sheet• Sametime instant messaging for on call consultation
• N/A
• N/A

October 27, 2006 20
Total Productive Maintenance in PlaceTotal Productive Maintenance in Place
Overall Equipment Effectiveness (OEE)• Availability (1 - Shrinkage)
• Performance Efficiency (Average Handle Time)
• Quality Rate (eSurvey)
Preventative MaintenanceClick2Coach• Supervisor reviews 10 calls per month per agent
• Agents rated using quality scorecard
Overall Equipment Effectiveness (OEE)• Availability (1 - Shrinkage)
• Performance Efficiency (Average Handle Time)
• Quality Rate (eSurvey)
Preventative MaintenanceClick2Coach• Supervisor reviews 10 calls per month per agent
• Agents rated using quality scorecard

October 27, 2006 21
TopicsTopics
• Company Background
• Balanced Business Scorecard
• IT Customer Service Center (CSC)
• Overall Methodology
• Lean Assessment
• Staffing Analysis and Recommendations
• Takeaways
• Company Background
• Balanced Business Scorecard
• IT Customer Service Center (CSC)
• Overall Methodology
• Lean Assessment
• Staffing Analysis and Recommendations
• Takeaways

October 27, 2006 22
Is CSC Staffed Appropriately ?
Staffing Analysis FrameworkStaffing Analysis Framework
Erlang C Staffing
Calculator
Calls Offered per HourAverage Handle Time (AHT)*
Wait Time
Agents Required (1 – Shrinkage)÷ =
Shrinkage Adjusted Agents
Required* Average Handle Time = Talk Time + Wrap* Average Handle Time = Talk Time + Wrap--upup

October 27, 2006 23
Shrinkage FactorsShrinkage Factors
• Vacation, Personal Days, Holidays• Sick• FMLA• Meetings• Coaching and Mentoring• Project Work• Training• Breaks• Administrative Non-Phone Activity
• Vacation, Personal Days, Holidays• Sick• FMLA• Meetings• Coaching and Mentoring• Project Work• Training• Breaks• Administrative Non-Phone Activity
2727--30%30%

October 27, 2006 24
020
040
060
080
010
0012
0014
0016
0018
0020
0022
00
Call Arrival PatternCall Arrival Pattern
9:30 – 11:00 AM
2:00 – 4:00 PM
Core Hours8:00 – 5:00 PM
Peak Hours
Voice of the Business
Heavier call volumes on Mondays
What does the data say ?

October 27, 2006 25
Average Calls Per DayAverage Calls Per Day
700600500400300
Median
Mean
600580560540520500
A nderson-Darling Normality Test
V ariance 3530.93Skewness -0.10410Kurtosis -1.15719N 21
Minimum 445.00
A -Squared
1st Q uartile 505.00Median 555.003rd Q uartile 603.00Maximum 651.00
95% C onfidence Interv al for Mean
530.09
0.51
584.19
95% C onfidence Interv al for Median
511.37 602.00
95% C onfidence Interv al for S tDev
45.46 85.81
P-V alue 0.176
Mean 557.14StDev 59.42
95% Confidence Intervals
Summary for Total Calls OfferedDay of Week = Mon
Worksheet: Calls Per Day
700600500400300
Median
Mean
540520500480460
A nderson-Darling Normality Test
V ariance 6874.88Skew ness 0.815974Kurtosis 0.462522N 26
Minimum 386.00
A -Squared
1st Q uartile 453.50Median 482.503rd Q uartile 547.75Maximum 712.00
95% C onfidence Interv al for Mean
470.70
0.47
537.68
95% C onfidence Interv al for Median
465.55 526.45
95% C onfidence Interv al for S tDev
65.03 114.46
P-V alue 0.224
Mean 504.19StDev 82.91
95% Confidence Intervals
Summary for Total Calls OfferedDay of Week = Tue
Worksheet: Calls Per Day
700600500400300
Median
Mean
480470460450440
A nderson-Darling Normality Test
V ariance 2277.52Skew ness 1.19749Kurtosis 3.28034N 26
Minimum 374.00
A -Squared
1st Q uartile 433.25Median 456.003rd Q uartile 484.75Maximum 616.00
95% C onfidence Interv al for Mean
442.92
0.48
481.47
95% C onfidence Interv al for Median
437.90 477.45
95% C onfidence Interv al for S tDev
37.43 65.88
P-V alue 0.212
Mean 462.19StDev 47.72
95% Confidence Intervals
Summary for Total Calls OfferedDay of Week = Wed
Worksheet: Calls Per Day
700600500400300
Median
Mean
540520500480460
A nderson-Darling Normality Test
V ariance 6874.88Skewness 0.815974Kurtosis 0.462522N 26
Minimum 386.00
A -Squared
1st Q uartile 453.50Median 482.503rd Q uartile 547.75Maximum 712.00
95% C onfidence Interv al for Mean
470.70
0.47
537.68
95% C onfidence Interv al for Median
465.55 526.45
95% C onfidence Interv al for StDev
65.03 114.46
P-V alue 0.224
Mean 504.19StDev 82.91
95% Confidence Intervals
Summary for Total Calls OfferedDay of Week = Tue
Worksheet: Calls Per Day
700600500400300
Median
Mean
460440420400
A nderson-Darling Normality Test
V ariance 5447.94Skew ness 0.399457Kurtosis -0.230159N 26
Minimum 301.00
A -Squared
1st Q uartile 375.75Median 426.003rd Q uartile 464.75Maximum 582.00
95% C onfidence Interv al for Mean
399.65
0.39
459.27
95% C onfidence Interv al for Median
388.45 445.70
95% C onfidence Interv al for S tDev
57.89 101.89
P-V alue 0.360
Mean 429.46StDev 73.81
95% Confidence Intervals
Summary for Total Calls OfferedDay of Week = Fri
Worksheet: Calls Per Day
557
504
451429
462
Mon Tue Wed Thu Fri
* Day of week variances and means of half hourly * Day of week variances and means of half hourly call volumes between 0800call volumes between 0800--1230 are not statistically 1230 are not statistically different.different.
Higher call volume on Mondays
What is the impact of higher call volumes ?

October 27, 2006 26
Average Abandonment RateAverage Abandonment Rate80
0
830
900
930
1000
1030
1100
1130
1200
1230
1300
1330
1400
1430
1500
1530
1600
1630
1700
Mon Tue Wed Thu Fri
* Variances of daily half hourly abandon rates are equal * Variances of daily half hourly abandon rates are equal between 0800between 0800--1230, but the Monday mean is statistically 1230, but the Monday mean is statistically different from the remaining days of the week.different from the remaining days of the week.
Higher Abandonment Rates on Monday Mornings

October 27, 2006 27
Average Speed to Answer (ASA)Average Speed to Answer (ASA)80
0
830
900
930
1000
1030
1100
1130
1200
1230
1300
1330
1400
1430
1500
1530
1600
1630
1700
Mon Tue Wed Thu Fri
* Day of week variances of half hourly ASA are equal * Day of week variances of half hourly ASA are equal between 0800between 0800--1230, but the Monday mean is statistically 1230, but the Monday mean is statistically different from the remaining days of the week.different from the remaining days of the week.
Longer Speed to Answer on Monday Mornings

October 27, 2006 28
800
830
900
930
1000
1030
1100
1130
1200
1230
1300
1330
1400
1430
1500
1530
1600
1630
1700
Mon Tue Wed Thu Fri
Average Handle Time (AHT)Average Handle Time (AHT)
* Average Handle Time = Talk Time + Wrap* Average Handle Time = Talk Time + Wrap--upup
Handle Time Does Not Vary with Day of Week

October 27, 2006 29
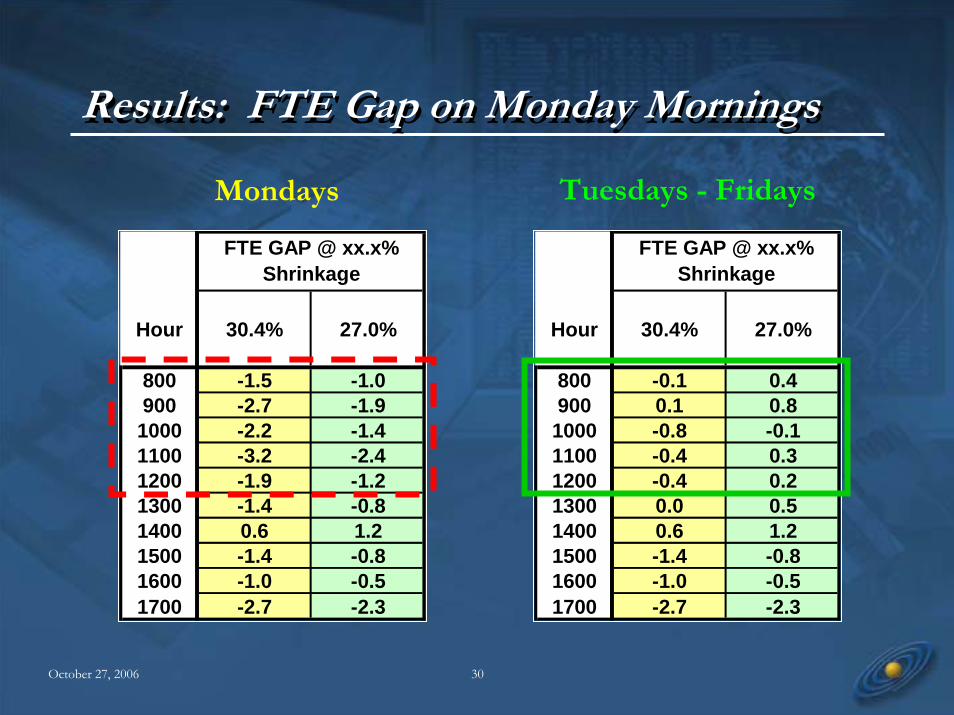
Impact on Staffing Analysis ?Impact on Staffing Analysis ?
• Statistically significant difference between Mondays vs. Tuesdays – Fridays• Average abandonment rate• Average speed to answer
• Perform staffing analysis with appropriate average call volumes• Mondays• Tuesdays – Fridays
• Statistically significant difference between Mondays vs. Tuesdays – Fridays• Average abandonment rate• Average speed to answer
• Perform staffing analysis with appropriate average call volumes• Mondays• Tuesdays – Fridays
October 27, 2006 30
Results: FTE Gap on Monday MorningsResults: FTE Gap on Monday Mornings
Hour 30.4% 27.0%
800 -1.5 -1.0900 -2.7 -1.91000 -2.2 -1.41100 -3.2 -2.41200 -1.9 -1.21300 -1.4 -0.81400 0.6 1.21500 -1.4 -0.81600 -1.0 -0.51700 -2.7 -2.3
FTE GAP @ xx.x% Shrinkage
Hour 30.4% 27.0%
800 -0.1 0.4900 0.1 0.81000 -0.8 -0.11100 -0.4 0.31200 -0.4 0.21300 0.0 0.51400 0.6 1.21500 -1.4 -0.81600 -1.0 -0.51700 -2.7 -2.3
FTE GAP @ xx.x% Shrinkage
Mondays Tuesdays - Fridays

October 27, 2006 31
RecommendationsRecommendations
• Maintain current staffing level• Part time solution may not be viable for one day a week• Statistical significance <> business significance
• Leverage opportunities identified in lean assessment as requirements for• 2007 upgrade of call tracking system• ITIL implementation, e.g. operating level agreements
• Revisit staffing analysis

October 27, 2006 32
TopicsTopics
• Company Background
• Balanced Business Scorecard
• IT Customer Service Center (CSC)
• Overall Methodology
• Lean Assessment
• Staffing Analysis and Recommendations
• Takeaways
• Company Background
• Balanced Business Scorecard
• IT Customer Service Center (CSC)
• Overall Methodology
• Lean Assessment
• Staffing Analysis and Recommendations
• Takeaways

October 27, 2006 33
TakeawaysTakeaways
• Lean assessment is integral to• Process analysis• Process excellence
• Numbers alone do not tell the entire story
• Project success depends on• Sponsor and management support• Setting expectations• Open and honest feedback from the line
• Lean assessment is integral to• Process analysis• Process excellence
• Numbers alone do not tell the entire story
• Project success depends on• Sponsor and management support• Setting expectations• Open and honest feedback from the line

October 27, 2006 34
Questions ?Questions ?
Habs Moy
Phone: 212.855.1000
Email: [email protected]
Habs Moy
Phone: 212.855.1000
Email: [email protected]