Embed Size (px)
Citation preview
0,105,82
153,204,0
132,255,159
219,254,188
255,245,173
255,230,110
255,213,57
250,161,0
173,207,198
Charts follow this
colour scheme
DRAFT No.1
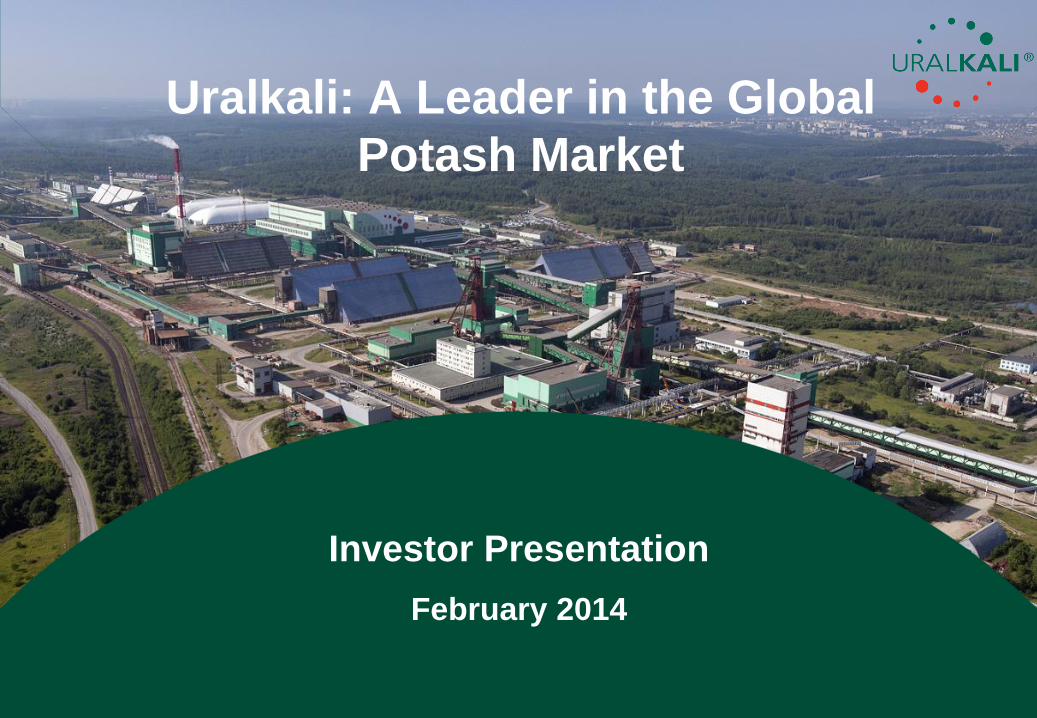
Uralkali: A Leader in the Global
Potash Market
• Analyst Presentation 20 August 2007
Moscow Investor Presentation
February 2014
0,105,82
153,204,0
132,255,159
219,254,188
255,245,173
255,230,110
255,213,57
250,161,0
173,207,198
Charts follow this
colour scheme
Disclaimer
This presentation has been prepared by JSC Uralkali (the «Company»). By attending the meeting where the presentation is made, or by reading the presentation slides, you agree to the
following limitations and notifications.
With respect to any information communicated by the Company, its agents or its representatives (including its directors, officers, employees, members, attorneys, advisors and any affiliates) to
you or your agents or representatives (including any directors, officers, employees, members, attorneys, advisors and affiliates), directly or indirectly, whether in written, oral, visual, electronic or
any other form, during or constituting the whole or part of this presentation or any presentation meeting or any conversation or discussion relating to or held in connection with this presentation,
or any opinion expressed in respect of such information (the “Information”), such Information may not be reproduced, redistributed, passed on or otherwise disseminated to any other person,
directly or indirectly, whether in written, oral, visual, electronic or any other form, for any purpose.
The Information communicated does not constitute or form part of, and should not be construed as, an offer, solicitation or invitation to subscribe for, underwrite or otherwise acquire, any
securities of the Company or any member of its group nor should it or any part of it form the basis of, or be relied on in connection with, any contract to purchase or subscribe for any securities
of the Company or any member of its group, nor shall it or any part of it form the basis of or be relied on in connection with any contract or commitment whatsoever. Any person considering the
purchase of any securities of the Company or any member of its group must inform himself or herself independently before taking any investment decision. The Information communicated has
been provided to you solely for your information and background and is subject to amendment. Further, the Information communicated has been compiled on the basis of information from a
number of sources and reflects prevailing conditions as of its date, which are subject to change. The medium through which the Information is communicated constitutes neither an
advertisement nor a prospectus. The Information communicated has not been independently verified. The Information communicated is subject to verification and amendment without notice and
the Company is not under any obligation to update or keep current the Information.
Accordingly, no representation or warranty, express or implied, is made or given by or on behalf of the Company or any of its directors, officers, employees, members, attorneys, advisors,
affiliates or any other person as to the correctness, accuracy, currency, completeness, adequacy, usefulness, reliability, fairness or otherwise of the Information communicated, and any reliance
you place on such Information will be at your sole risk. Neither the Company nor any of its directors, officers, employees, members, attorneys, advisors, affiliates or any other person accepts any
liability whatsoever for any loss howsoever arising from any use of the Information communicated.
To the fullest extent permitted by applicable law, the Company shall not be liable for any compensatory, punitive, special, consequential or other damages, any loss of income or revenue, any
loss of business, any loss of anticipated savings, any loss of goodwill, or any other losses, liabilities, expenses or costs of whatever nature arising from or attributable to your access to, or
inability to access, or reliance on Information even if the Company has been advised of the possibility of such damages, losses, liabilities, expenses or costs.
Some of the Information may constitute projections or other forward-looking statements regarding future events or the future financial performance of the Company. These statements involve
numerous assumptions regarding the present and future strategies of the Company and the environment in which it operates and will operate in the future and involve a number of known and
unknown risks and other factors that could cause the Company‟s or its industry‟s actual results, levels of activity, performance or achievements to be materially different from any future results,
levels of activity, performance or achievements expressed or implied by such forward-looking statements. Accordingly, the Company provides no assurance whatsoever that its or its industry‟s
actual results, levels of activity, performance or achievements will be consistent with the future results, levels of activity, performance or achievements expressed or implied by such forward
looking statements. Neither the Company nor any of its directors, officers, employees, members, attorneys, advisors, affiliates or any other person intends or has any duty or obligation to
supplement, amend, update or revise any of the forward-looking statements contained herein to reflect any change in the Company‟s expectations with regard thereto or any change in events,
conditions or circumstances on which any such statements are based.
Multiple factors could cause the actual results to differ materially from those contained in any projections or forward-looking statements, including, among others, potential fluctuations in
quarterly or other results, dependence on new product development, rapid technological and market change, acquisition strategy, manufacturing risks, volatility of stock price, financial risk
management, future growth subject to risks of political instability, economic growth and natural disasters, wars and acts of terrorism.
1
0,105,82
153,204,0
132,255,159
219,254,188
255,245,173
255,230,110
255,213,57
250,161,0
173,207,198
Charts follow this
colour scheme
2
1. A Leader in the Global Potash Market
2. Strategic Review
3. Financial Highlights
4. Potash Market Outlook
5. Key Takeaways
Agenda
0,105,82
153,204,0
132,255,159
219,254,188
255,245,173
255,230,110
255,213,57
250,161,0
173,207,198
Charts follow this
colour scheme
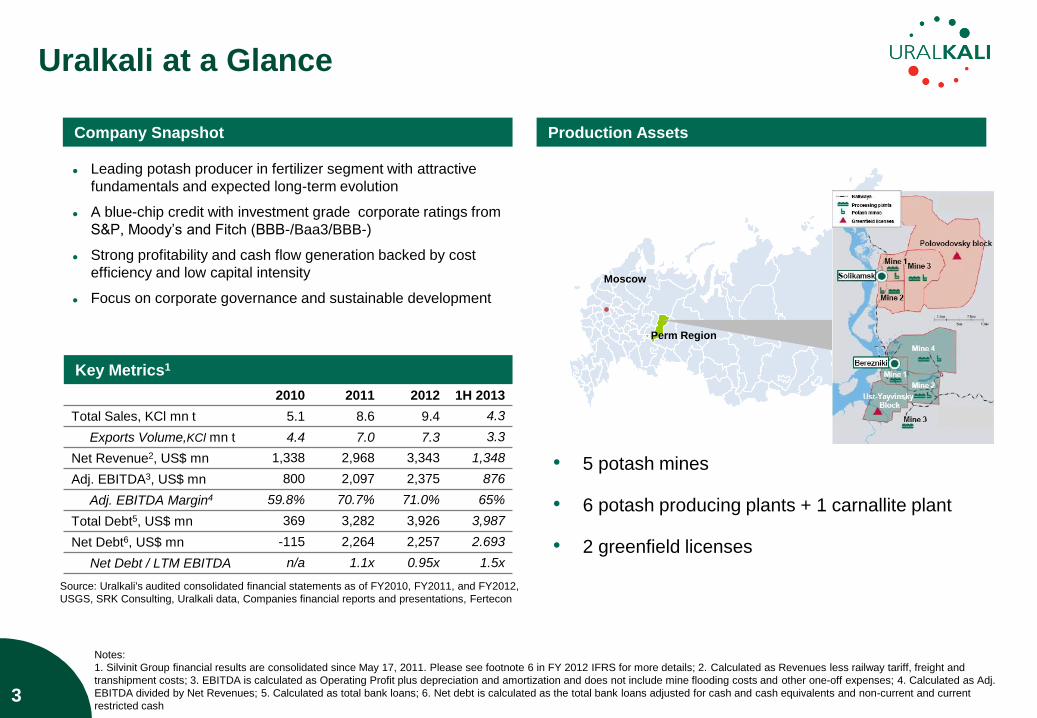
Uralkali at a Glance
2010 2011 2012 1H 2013
Total Sales, KCl mn t 5.1 8.6 9.4 4.3
Exports Volume,KCl mn t 4.4 7.0 7.3 3.3
Net Revenue2, US$ mn 1,338 2,968 3,343 1,348
Adj. EBITDA3, US$ mn 800 2,097 2,375 876
Adj. EBITDA Margin4 59.8% 70.7% 71.0% 65%
Total Debt5, US$ mn 369 3,282 3,926 3,987
Net Debt6, US$ mn -115 2,264 2,257 2.693
Net Debt / LTM EBITDA n/a 1.1x 0.95x 1.5x
Key Metrics1
Notes:
1. Silvinit Group financial results are consolidated since May 17, 2011. Please see footnote 6 in FY 2012 IFRS for more details; 2. Calculated as Revenues less railway tariff, freight and
transhipment costs; 3. EBITDA is calculated as Operating Profit plus depreciation and amortization and does not include mine flooding costs and other one-off expenses; 4. Calculated as Adj.
EBITDA divided by Net Revenues; 5. Calculated as total bank loans; 6. Net debt is calculated as the total bank loans adjusted for cash and cash equivalents and non-current and current
restricted cash
Leading potash producer in fertilizer segment with attractive
fundamentals and expected long-term evolution
A blue-chip credit with investment grade corporate ratings from
S&P, Moody‟s and Fitch (BBB-/Baa3/BBB-)
Strong profitability and cash flow generation backed by cost
efficiency and low capital intensity
Focus on corporate governance and sustainable development
Company Snapshot
Moscow
Perm Region
• 5 potash mines
• 6 potash producing plants + 1 carnallite plant
• 2 greenfield licenses
Production Assets
3
Source: Uralkali's audited consolidated financial statements as of FY2010, FY2011, and FY2012,
USGS, SRK Consulting, Uralkali data, Companies financial reports and presentations, Fertecon
0,105,82
153,204,0
132,255,159
219,254,188
255,245,173
255,230,110
255,213,57
250,161,0
173,207,198
Charts follow this
colour scheme
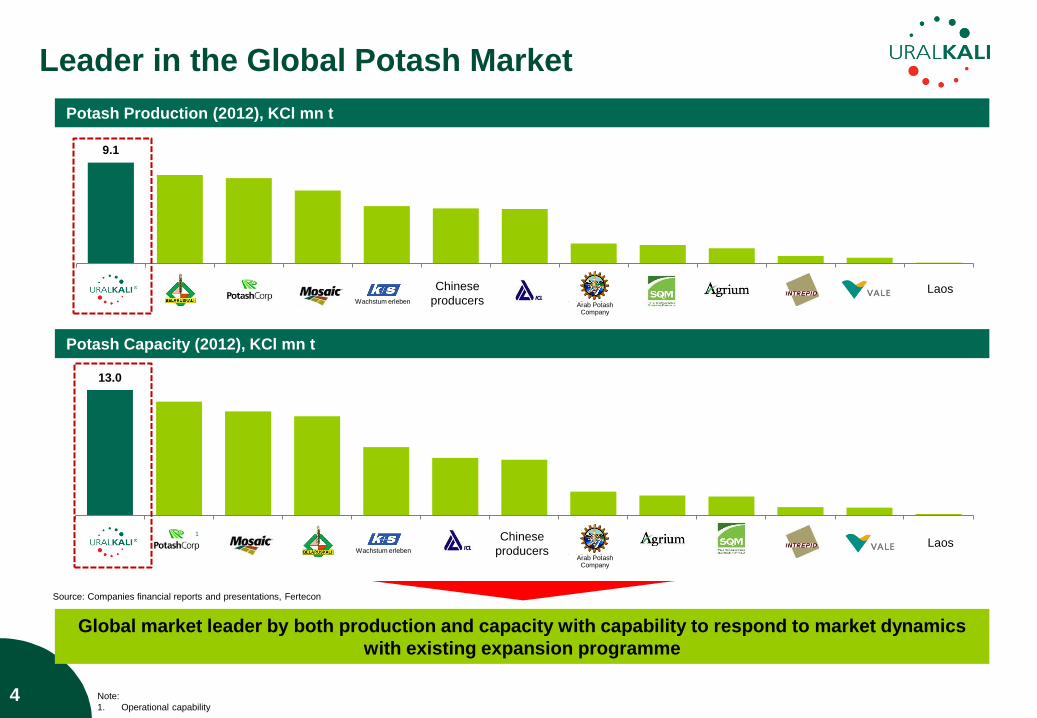
Global market leader by both production and capacity with capability to respond to market dynamics
with existing expansion programme
Note:
1. Operational capability
Leader in the Global Potash Market
9.1
Laos
Source: Companies financial reports and presentations, Fertecon
Potash Production (2012), KCl mn t
Potash Capacity (2012), KCl mn t
Chinese
producers Arab Potash Company
Wachstum erleben
4
13.0
Laos Chinese
producers Arab Potash
Company
Wachstum erleben
1
0,105,82
153,204,0
132,255,159
219,254,188
255,245,173
255,230,110
255,213,57
250,161,0
173,207,198
Charts follow this
colour scheme
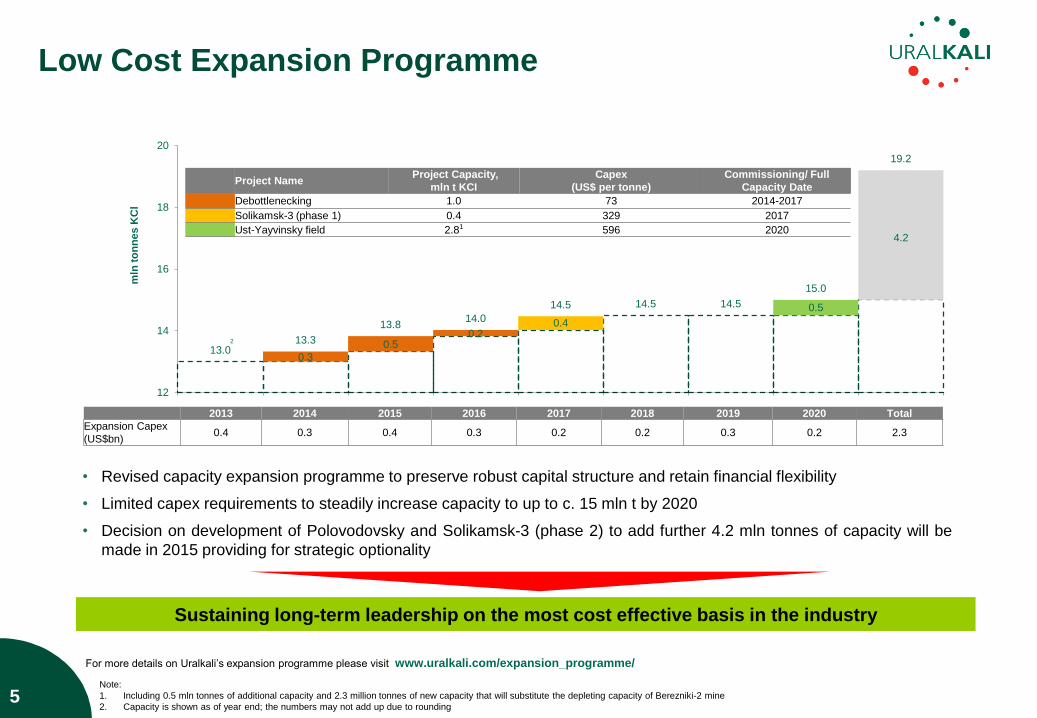
Low Cost Expansion Programme
5 Note:
1. Including 0.5 mln tonnes of additional capacity and 2.3 million tonnes of new capacity that will substitute the depleting capacity of Berezniki-2 mine
2. Capacity is shown as of year end; the numbers may not add up due to rounding
For more details on Uralkali‟s expansion programme please visit www.uralkali.com/expansion_programme/
2013 2014 2015 2016 2017 2018 2019 2020 Total
Expansion Capex
(US$bn) 0.4 0.3 0.4 0.3 0.2 0.2 0.3 0.2 2.3
Project Name Project Capacity,
mln t KCI
Capex
(US$ per tonne)
Commissioning/ Full
Capacity Date
Debottlenecking 1.0 73 2014-2017
Solikamsk-3 (phase 1) 0.4 329 2017
Ust-Yayvinsky field 2.81 596 2020
• Revised capacity expansion programme to preserve robust capital structure and retain financial flexibility
• Limited capex requirements to steadily increase capacity to up to c. 15 mln t by 2020
• Decision on development of Polovodovsky and Solikamsk-3 (phase 2) to add further 4.2 mln tonnes of capacity will be
made in 2015 providing for strategic optionality
Sustaining long-term leadership on the most cost effective basis in the industry
Optionality
from
additional
projects
0.3
0.5 0.2
0.4
0.5
4.2
13.0 13.3
13.8 14.0
14.5 14.5 14.5
15.0
19.2
12
14
16
18
20m
ln t
on
ne
s K
Cl
2
0,105,82
153,204,0
132,255,159
219,254,188
255,245,173
255,230,110
255,213,57
250,161,0
173,207,198
Charts follow this
colour scheme
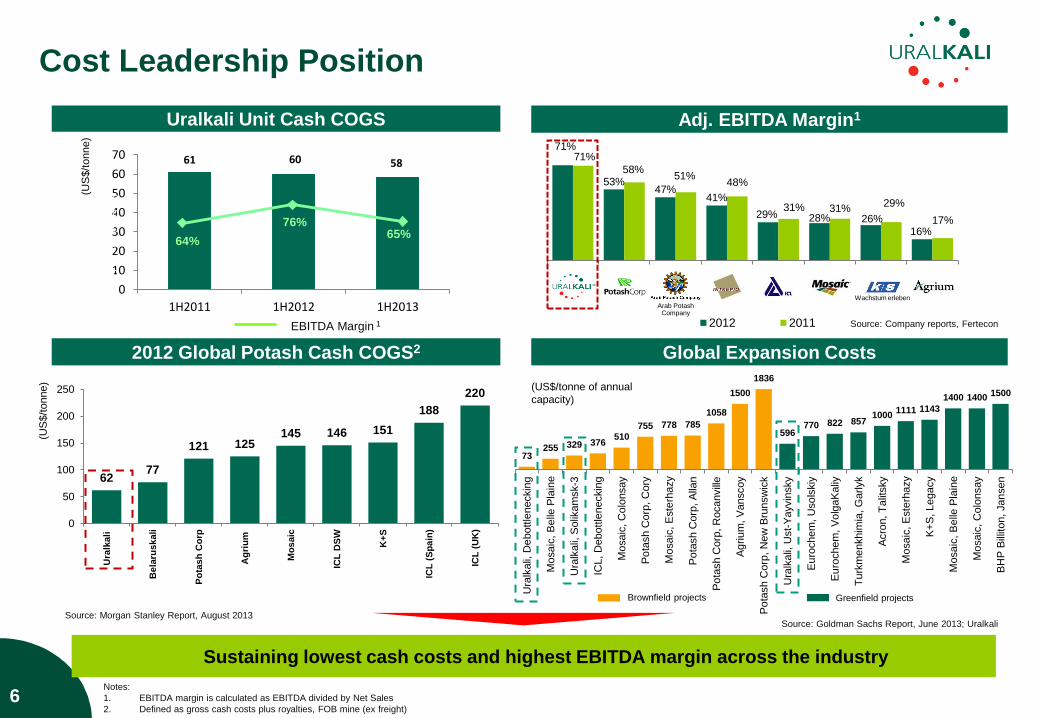
73 255 329 376
510 755 778 785
1058
1500
1836
596 770 822 857
1000 1111 1143
1400 1400 1500
Ura
lkali,
De
bottle
neckin
g
Mo
sa
ic,
Be
lle P
lain
e
Ura
lkali,
Solik
am
sk-3
ICL, D
ebottle
neckin
g
Mo
saic
, C
olo
nsay
Po
tash C
orp
, C
ory
Mo
sa
ic,
Este
rha
zy
Po
tash C
orp
, A
llan
Po
tash C
orp
, R
ocanvill
e
Ag
riu
m, V
anscoy
Po
tash C
orp
, N
ew
Bru
nsw
ick
Ura
lkali,
Ust-
Yayvin
sky
Eu
rochem
, U
so
lskiy
Eu
rochem
, V
olg
aK
aliy
Tu
rkm
enkhim
ia, G
arlyk
Acro
n, T
alit
sky
Mo
sa
ic,
Este
rha
zy
K+
S, Legacy
Mo
sa
ic,
Be
lle P
lain
e
Mo
saic
, C
olo
nsay
BH
P B
illiton, Jan
sen
Brownfield projects Greenfield projects
1
1 1
6
2012 Global Potash Cash COGS2
Adj. EBITDA Margin1
Cost Leadership Position
Uralkali Unit Cash COGS
Source: Morgan Stanley Report, August 2013
1 1
(US
$/t
onne)
61 60 58
0
10
20
30
40
50
60
70
1H2011 1H2012 1H2013
EBITDA Margin 1
64%
76% 65%
0
10
20
30
40
50
60
70
80
Notes:
1. EBITDA margin is calculated as EBITDA divided by Net Sales
2. Defined as gross cash costs plus royalties, FOB mine (ex freight)
62 77
121 125 145 146 151
188
220
0
50
100
150
200
250
Ura
lkali
Be
laru
sk
ali
Po
tas
h C
orp
Ag
riu
m
Mo
saic
ICL
DS
W
K+
S
ICL
(S
pa
in)
ICL
(U
K)
(US
$/t
onne)
• Sustaining lowest cash costs and highest EBITDA margin across the industry
Global Expansion Costs
71%
53% 47%
41%
29% 28% 26%
16%
71%
58% 51%
48%
31% 31% 29%
17%
2012 2011
Arab Potash Company
Wachstum erleben
Source: Goldman Sachs Report, June 2013; Uralkali
Source: Company reports, Fertecon
(US$/tonne of annual
capacity)
0,105,82
153,204,0
132,255,159
219,254,188
255,245,173
255,230,110
255,213,57
250,161,0
173,207,198
Charts follow this
colour scheme
Notes:
Equity structure is given as of December 20, 2013
1. Includes shares acquired by subsidiaries of Uralkali which are accounted for as treasury shares for the purposes of the Group‟s consolidated financial statements prepared in accordance with
IFRS.
0,105,82
153,204,0
132,255,159
219,254,188
255,245,173
255,230,110
255,213,57
250,161,0
173,207,198
Charts follow this
colour scheme
7
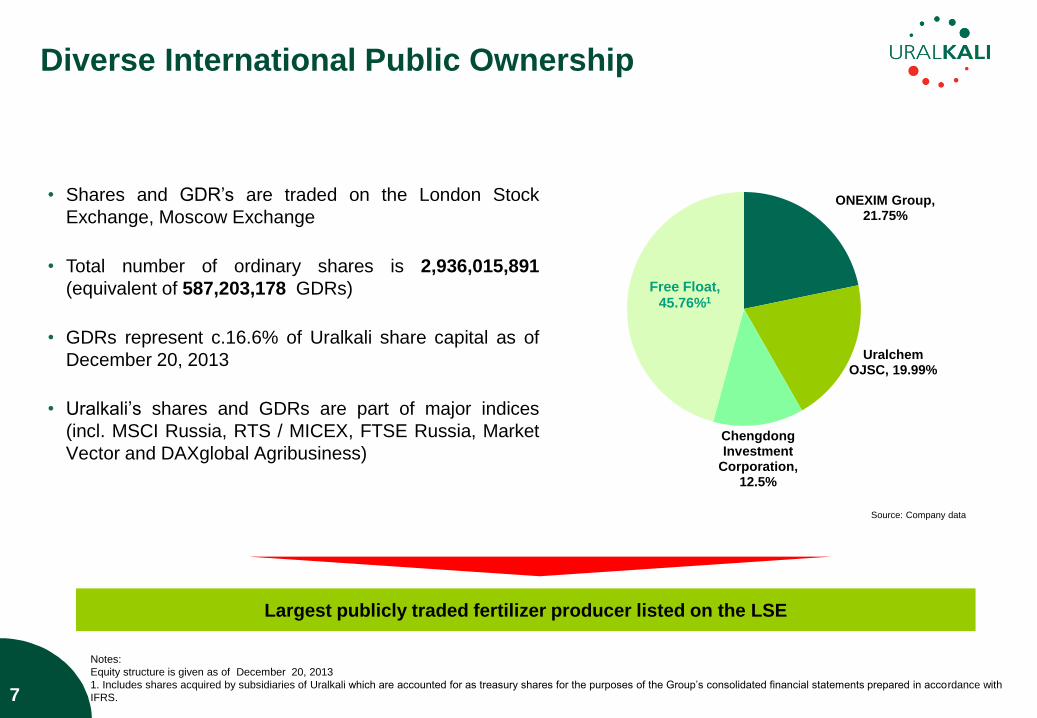
Diverse International Public Ownership
Source: Company data
• Shares and GDR‟s are traded on the London Stock
Exchange, Moscow Exchange
• Total number of ordinary shares is 2,936,015,891
(equivalent of 587,203,178 GDRs)
• GDRs represent c.16.6% of Uralkali share capital as of
December 20, 2013
• Uralkali‟s shares and GDRs are part of major indices
(incl. MSCI Russia, RTS / MICEX, FTSE Russia, Market
Vector and DAXglobal Agribusiness)
Largest publicly traded fertilizer producer listed on the LSE
ONEXIM Group, 21.75%
Uralchem OJSC, 19.99%
Chengdong Investment
Corporation, 12.5%
Free Float, 45.76%1
0,105,82
153,204,0
132,255,159
219,254,188
255,245,173
255,230,110
255,213,57
250,161,0
173,207,198
Charts follow this
colour scheme
8
1. A Leader in the Global Potash Market
2. Strategic Review
3. Financial Highlights
4. Potash Market Outlook
5. Key Takeaways
Agenda
0,105,82
153,204,0
132,255,159
219,254,188
255,245,173
255,230,110
255,213,57
250,161,0
173,207,198
Charts follow this
colour scheme
9
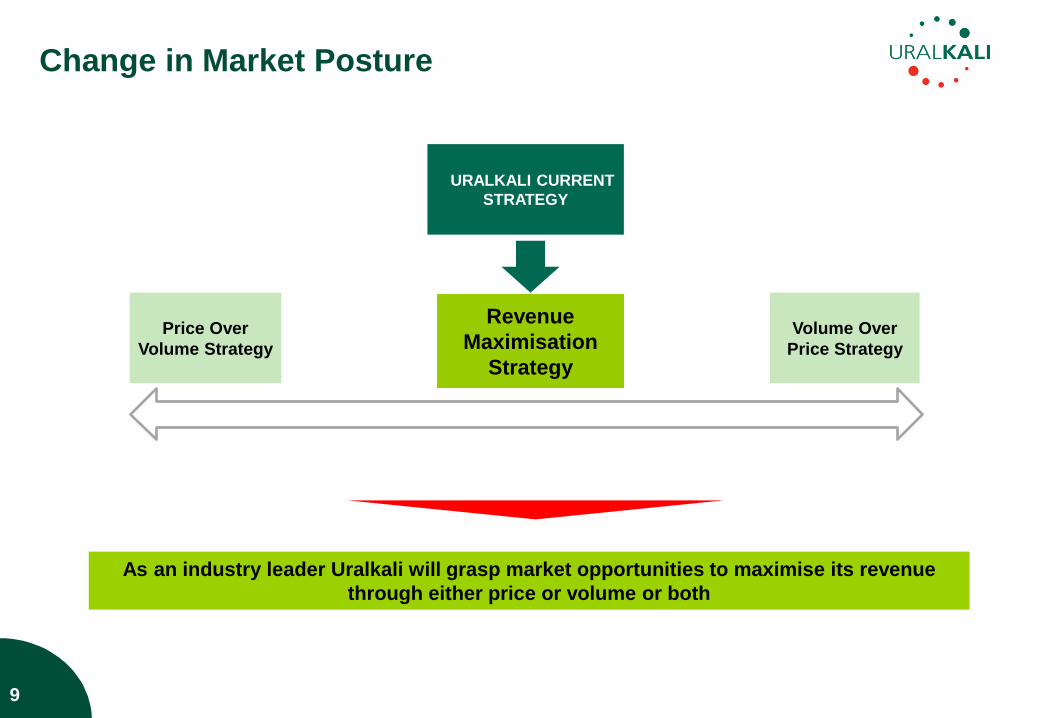
Change in Market Posture
Revenue
Maximisation
Strategy
Price Over
Volume Strategy
Volume Over
Price Strategy
URALKALI CURRENT
STRATEGY
As an industry leader Uralkali will grasp market opportunities to maximise its revenue
through either price or volume or both
0,105,82
153,204,0
132,255,159
219,254,188
255,245,173
255,230,110
255,213,57
250,161,0
173,207,198
Charts follow this
colour scheme
10
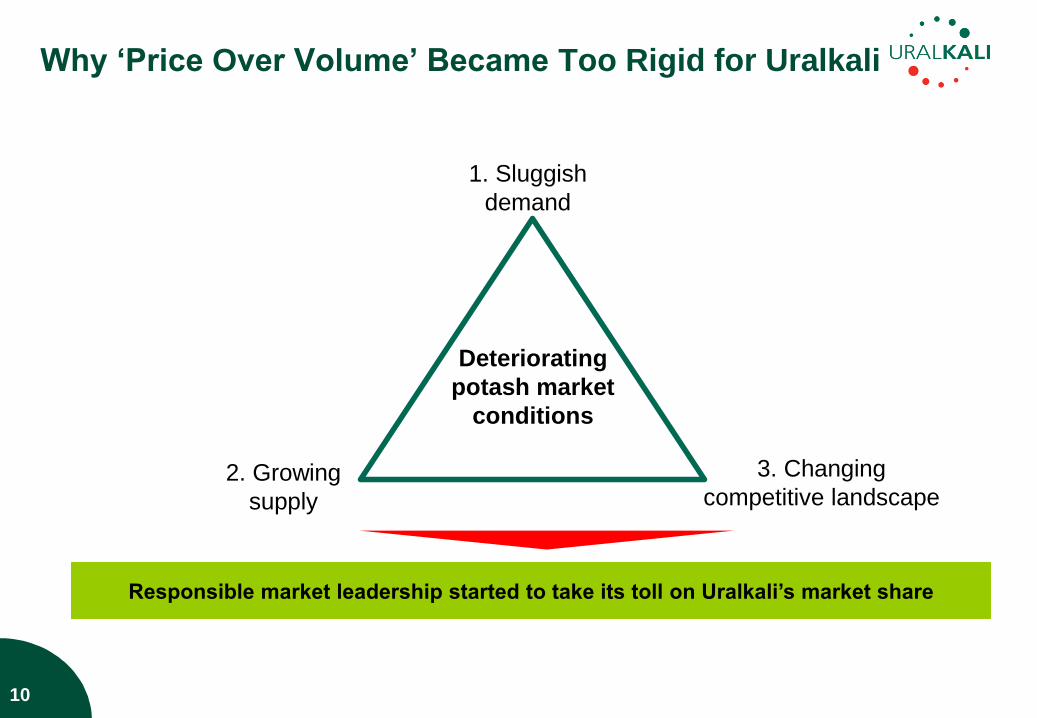
Why „Price Over Volume‟ Became Too Rigid for Uralkali
Deteriorating
potash market
conditions
Responsible market leadership started to take its toll on Uralkali‟s market share
1. Sluggish
demand
2. Growing
supply
3. Changing
competitive landscape
0,105,82
153,204,0
132,255,159
219,254,188
255,245,173
255,230,110
255,213,57
250,161,0
173,207,198
Charts follow this
colour scheme
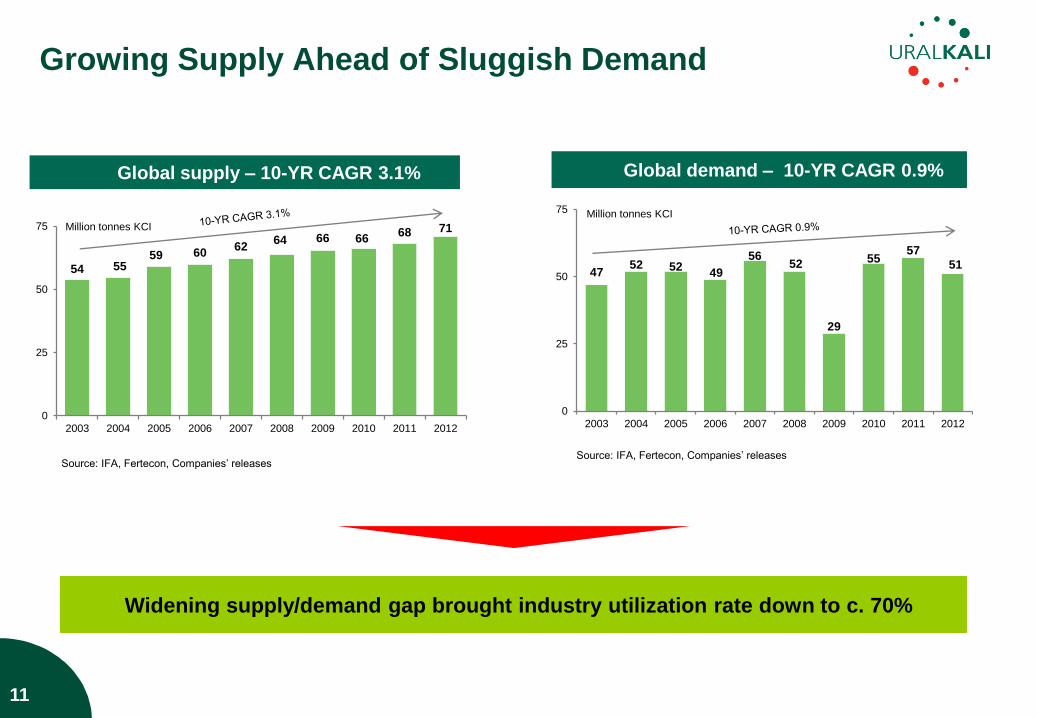
Growing Supply Ahead of Sluggish Demand
153,204,0
219,254,188
255,245,173
255,230,110
255,213,57
173,207,198
11
Global demand – 10-YR CAGR 0.9%
47 52 52
49
56 52
29
55 57
51
0
25
50
75
2003 2004 2005 2006 2007 2008 2009 2010 2011 2012
Million tonnes KCI
Source: IFA, Fertecon, Companies‟ releases
54 55 59 60
62 64 66 66
68 71
0
25
50
75
2003 2004 2005 2006 2007 2008 2009 2010 2011 2012
Million tonnes KCI
Global supply – 10-YR CAGR 3.1%
Source: IFA, Fertecon, Companies‟ releases
Widening supply/demand gap brought industry utilization rate down to c. 70%
0,105,82
153,204,0
132,255,159
219,254,188
255,245,173
255,230,110
255,213,57
250,161,0
173,207,198
Charts follow this
colour scheme
12
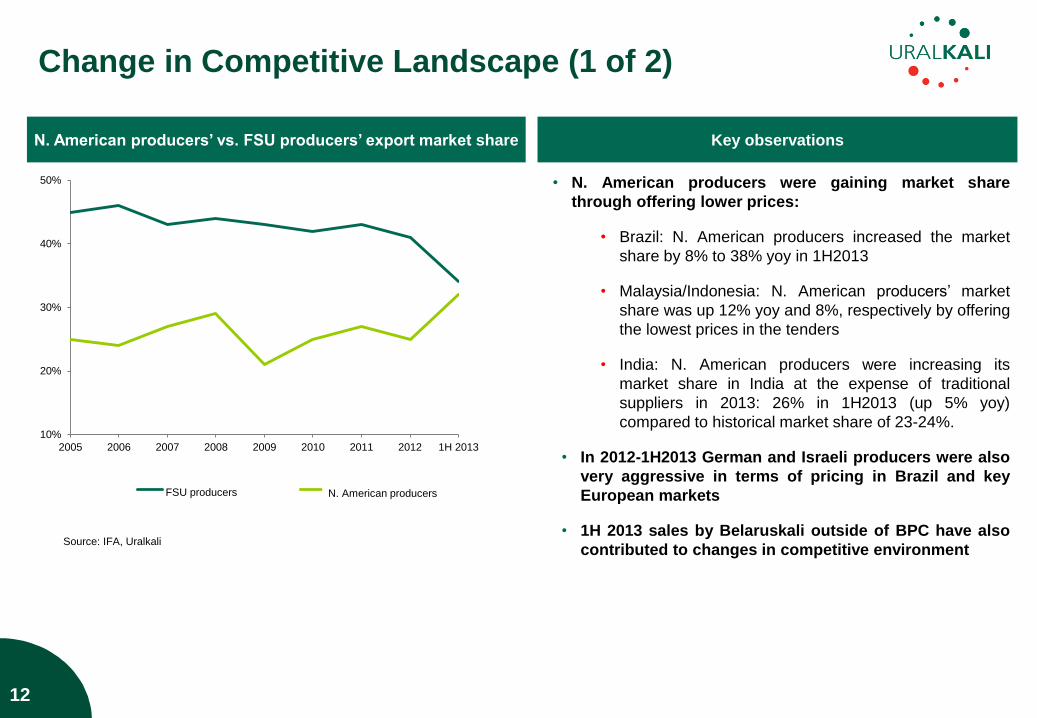
Change in Competitive Landscape (1 of 2)
Source: IFA, Uralkali
N. American producers‟ vs. FSU producers‟ export market share
10%
20%
30%
40%
50%
2005 2006 2007 2008 2009 2010 2011 2012 1H 2013
BPC/UKT¹ PCS/CanpotexFSU producers
• N. American producers were gaining market share
through offering lower prices:
• Brazil: N. American producers increased the market
share by 8% to 38% yoy in 1H2013
• Malaysia/Indonesia: N. American producers‟ market
share was up 12% yoy and 8%, respectively by offering
the lowest prices in the tenders
• India: N. American producers were increasing its
market share in India at the expense of traditional
suppliers in 2013: 26% in 1H2013 (up 5% yoy)
compared to historical market share of 23-24%.
• In 2012-1H2013 German and Israeli producers were also
very aggressive in terms of pricing in Brazil and key
European markets
• 1H 2013 sales by Belaruskali outside of BPC have also
contributed to changes in competitive environment
Key observations
N. American producers
0,105,82
153,204,0
132,255,159
219,254,188
255,245,173
255,230,110
255,213,57
250,161,0
173,207,198
Charts follow this
colour scheme
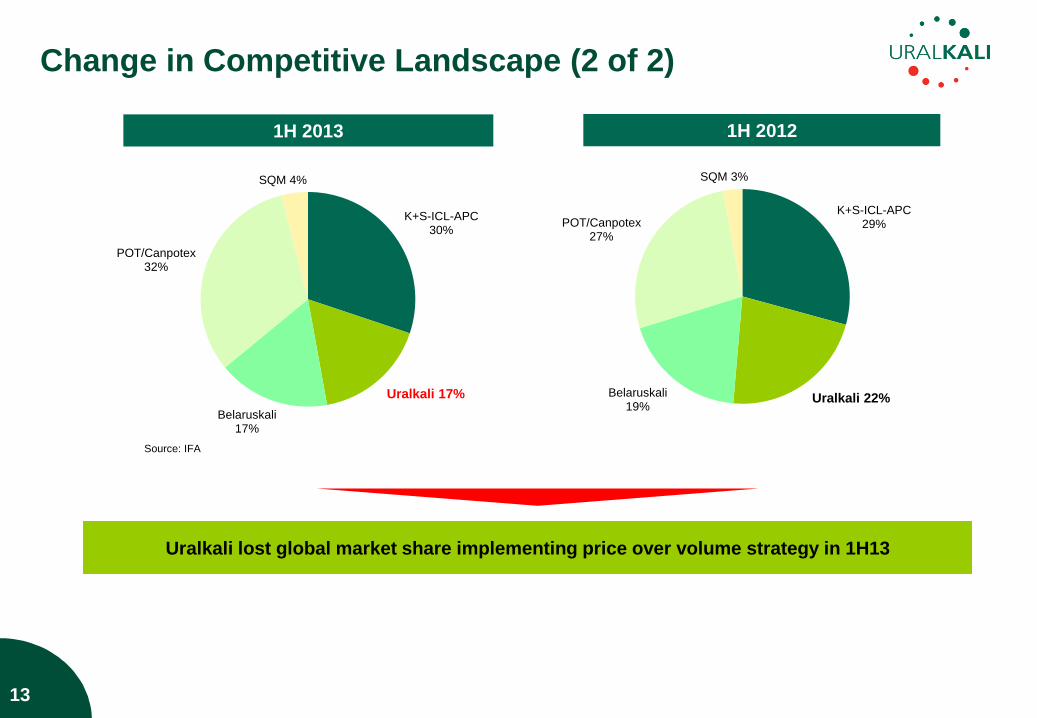
Change in Competitive Landscape (2 of 2)
Source: IFA
K+S-ICL-APC 30%
Uralkali 17%
Belaruskali 17%
POT/Canpotex 32%
SQM 4%
K+S-ICL-APC 29%
Uralkali 22% Belaruskali 19%
POT/Canpotex 27%
SQM 3%
1H 2013 1H 2012
13
Uralkali lost global market share implementing price over volume strategy in 1H13
0,105,82
153,204,0
132,255,159
219,254,188
255,245,173
255,230,110
255,213,57
250,161,0
173,207,198
Charts follow this
colour scheme
330
380
430
480
530
Jul-1
1
Au
g-1
1
Se
p-1
1
Oct-
11
Nov-1
1
Dec-1
1
Jan
-12
Fe
b-1
2
Ma
r-12
Ap
r-12
Ma
y-1
2
Jun
-12
Jul-1
2
Au
g-1
2
Se
p-1
2
Oct-
12
Nov-1
2
Dec-1
2
Jan
-13
Fe
b-1
3
Ma
r-13
Ap
r-13
Ma
y-1
3
Jun
-13
Jul-1
3
Au
g-1
3
Se
p-1
3
Oct-
13
Nov-1
3
US
$/t
Potash standard FOB Vancouver, US$/t
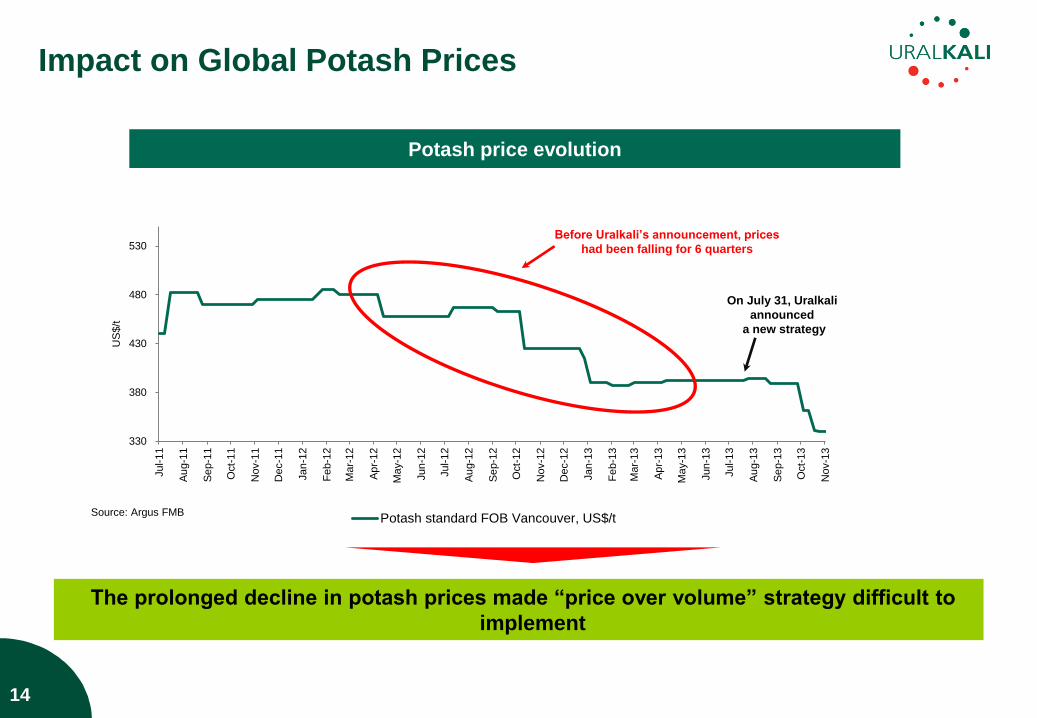
Impact on Global Potash Prices
153,204,0
219,254,188
255,245,173
255,230,110
255,213,57
173,207,198
14
The prolonged decline in potash prices made “price over volume” strategy difficult to
implement
Source: Argus FMB
Potash price evolution
On July 31, Uralkali
announced
a new strategy
Before Uralkali‟s announcement, prices
had been falling for 6 quarters
0,105,82
153,204,0
132,255,159
219,254,188
255,245,173
255,230,110
255,213,57
250,161,0
173,207,198
Charts follow this
colour scheme
15
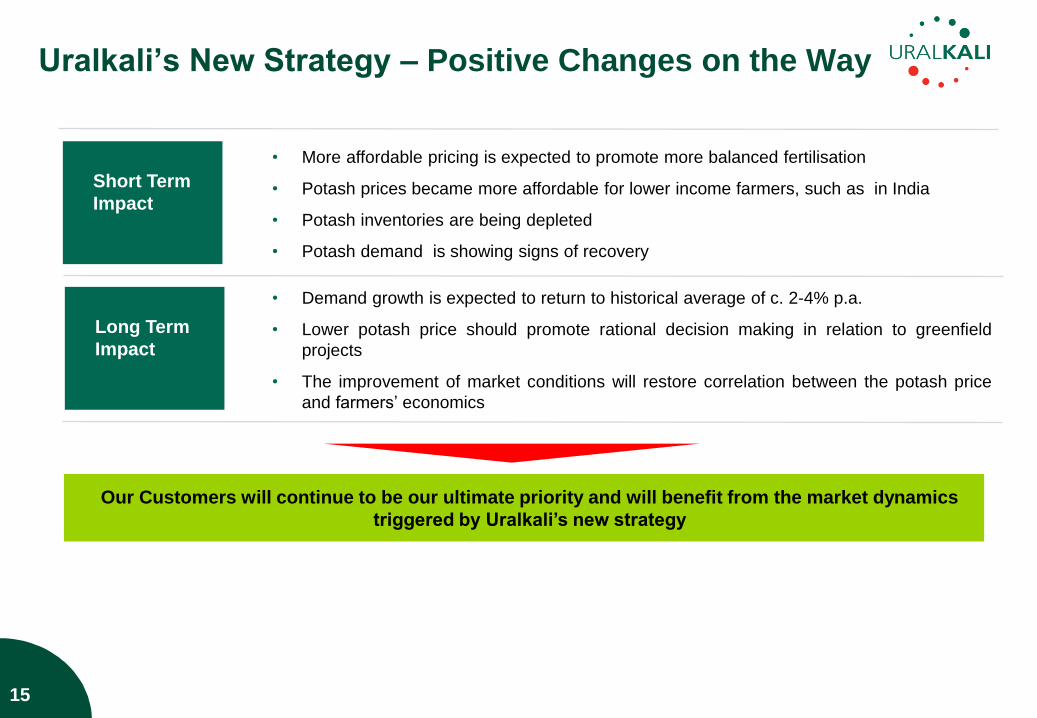
Short Term
Impact
• More affordable pricing is expected to promote more balanced fertilisation
• Potash prices became more affordable for lower income farmers, such as in India
• Potash inventories are being depleted
• Potash demand is showing signs of recovery
Long Term
Impact
• Demand growth is expected to return to historical average of c. 2-4% p.a.
• Lower potash price should promote rational decision making in relation to greenfield
projects
• The improvement of market conditions will restore correlation between the potash price
and farmers‟ economics
Our Customers will continue to be our ultimate priority and will benefit from the market dynamics
triggered by Uralkali‟s new strategy
Uralkali‟s New Strategy – Positive Changes on the Way
0,105,82
153,204,0
132,255,159
219,254,188
255,245,173
255,230,110
255,213,57
250,161,0
173,207,198
Charts follow this
colour scheme
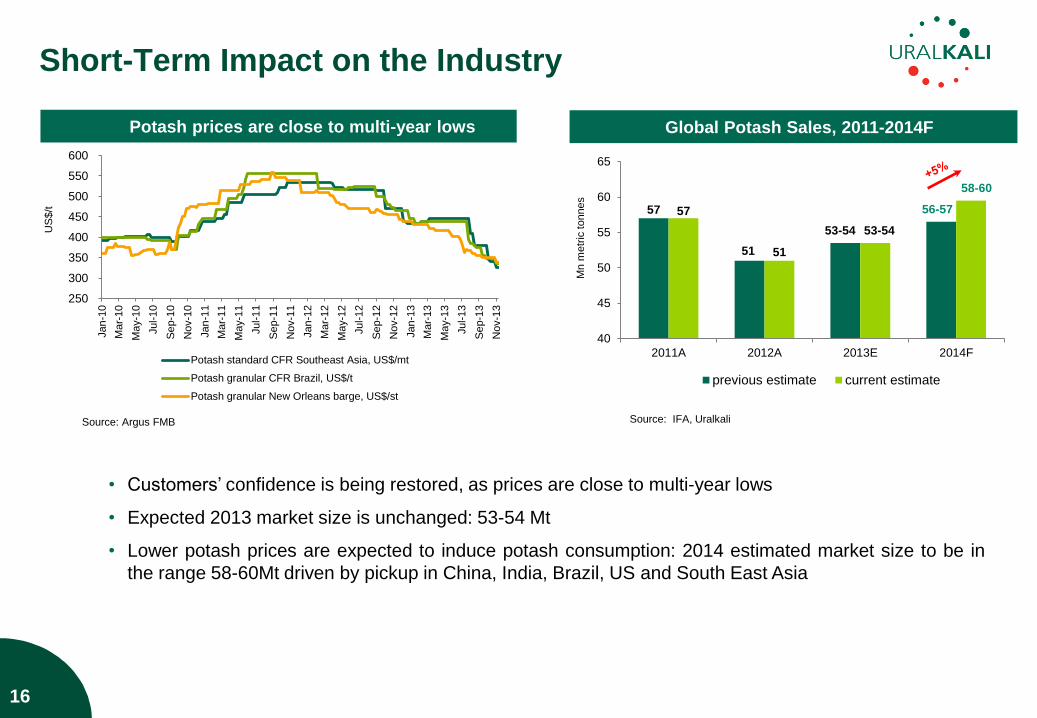
Short-Term Impact on the Industry
16
• Customers‟ confidence is being restored, as prices are close to multi-year lows
• Expected 2013 market size is unchanged: 53-54 Mt
• Lower potash prices are expected to induce potash consumption: 2014 estimated market size to be in
the range 58-60Mt driven by pickup in China, India, Brazil, US and South East Asia
Global Potash Sales, 2011-2014F
57
51
53-54
56-57 57
51
53-54
58-60
40
45
50
55
60
65
2011A 2012A 2013E 2014F
Mn m
etr
ic tonnes
previous estimate current estimate
Source: Argus FMB Source: IFA, Uralkali
Potash prices are close to multi-year lows
250
300
350
400
450
500
550
600
Jan
-10
Ma
r-10
Ma
y-1
0
Jul-1
0
Se
p-1
0
Nov-1
0
Jan
-11
Ma
r-11
Ma
y-1
1
Jul-1
1
Se
p-1
1
Nov-1
1
Jan
-12
Ma
r-12
Ma
y-1
2
Jul-1
2
Se
p-1
2
Nov-1
2
Jan
-13
Ma
r-13
Ma
y-1
3
Jul-1
3
Se
p-1
3
Nov-1
3
US
$/t
Potash standard CFR Southeast Asia, US$/mt
Potash granular CFR Brazil, US$/t
Potash granular New Orleans barge, US$/st
0,105,82
153,204,0
132,255,159
219,254,188
255,245,173
255,230,110
255,213,57
250,161,0
173,207,198
Charts follow this
colour scheme
45
55
65
75
85
95
105
115
2013 2014 2015 2016 2017 2018 2019 2020
Mn m
etr
ic tonnes
Capacity additions based on 2013 forecast
Capacity additions based on 2012 forecast
17
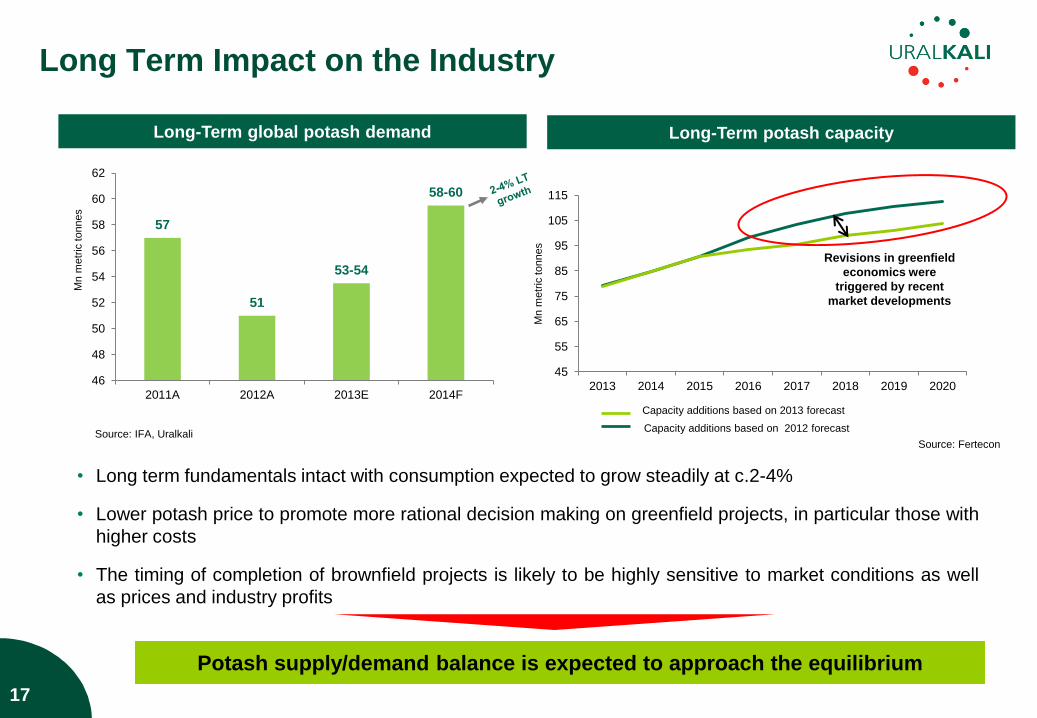
Long Term Impact on the Industry
• Long term fundamentals intact with consumption expected to grow steadily at c.2-4%
• Lower potash price to promote more rational decision making on greenfield projects, in particular those with
higher costs
• The timing of completion of brownfield projects is likely to be highly sensitive to market conditions as well
as prices and industry profits
Long-Term global potash demand
Source: IFA, Uralkali
57
51
53-54
58-60
46
48
50
52
54
56
58
60
62
2011A 2012A 2013E 2014F
Mn m
etr
ic tonnes
Long-Term potash capacity
Potash supply/demand balance is expected to approach the equilibrium
Source: Fertecon
Revisions in greenfield
economics were
triggered by recent
market developments
0,105,82
153,204,0
132,255,159
219,254,188
255,245,173
255,230,110
255,213,57
250,161,0
173,207,198
Charts follow this
colour scheme
10.6
9.4
0
3
6
9
12
15
2011A 2012A 2013E 2014E
Mn
to
nn
es o
f K
Cl 10-10.5
12.0-13.0
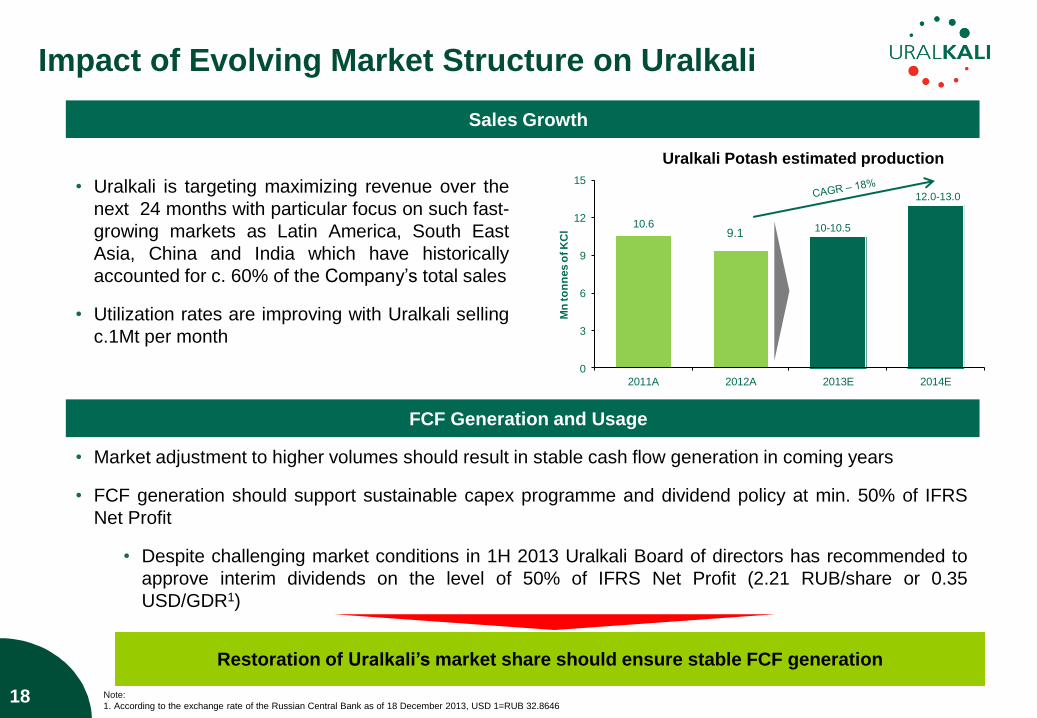
Impact of Evolving Market Structure on Uralkali
18
Sales Growth
Uralkali Potash estimated production
• Uralkali is targeting maximizing revenue over the
next 24 months with particular focus on such fast-
growing markets as Latin America, South East
Asia, China and India which have historically
accounted for c. 60% of the Company‟s total sales
• Utilization rates are improving with Uralkali selling
c.1Mt per month
FCF Generation and Usage
• Market adjustment to higher volumes should result in stable cash flow generation in coming years
• FCF generation should support sustainable capex programme and dividend policy at min. 50% of IFRS
Net Profit
• Despite challenging market conditions in 1H 2013 Uralkali Board of directors has recommended to
approve interim dividends on the level of 50% of IFRS Net Profit (2.21 RUB/share or 0.35
USD/GDR1)
9.1
Note:
1. According to the exchange rate of the Russian Central Bank as of 18 December 2013, USD 1=RUB 32.8646
Restoration of Uralkali‟s market share should ensure stable FCF generation
0,105,82
153,204,0
132,255,159
219,254,188
255,245,173
255,230,110
255,213,57
250,161,0
173,207,198
Charts follow this
colour scheme
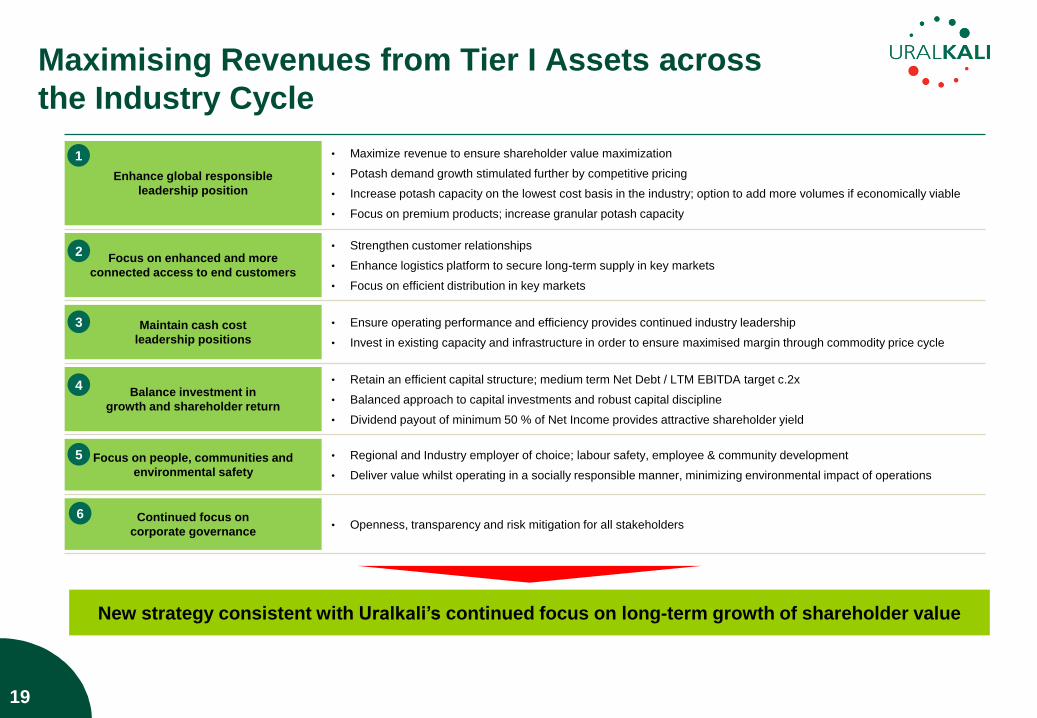
Enhance global responsible
leadership position
• Maximize revenue to ensure shareholder value maximization
• Potash demand growth stimulated further by competitive pricing
• Increase potash capacity on the lowest cost basis in the industry; option to add more volumes if economically viable
• Focus on premium products; increase granular potash capacity
Focus on enhanced and more
connected access to end customers
• Strengthen customer relationships
• Enhance logistics platform to secure long-term supply in key markets
• Focus on efficient distribution in key markets
Maintain cash cost
leadership positions
• Ensure operating performance and efficiency provides continued industry leadership
• Invest in existing capacity and infrastructure in order to ensure maximised margin through commodity price cycle
Balance investment in
growth and shareholder return
• Retain an efficient capital structure; medium term Net Debt / LTM EBITDA target c.2x
• Balanced approach to capital investments and robust capital discipline
• Dividend payout of minimum 50 % of Net Income provides attractive shareholder yield
Focus on people, communities and
environmental safety
• Regional and Industry employer of choice; labour safety, employee & community development
• Deliver value whilst operating in a socially responsible manner, minimizing environmental impact of operations
Continued focus on
corporate governance • Openness, transparency and risk mitigation for all stakeholders
New strategy consistent with Uralkali‟s continued focus on long-term growth of shareholder value
Maximising Revenues from Tier I Assets across
the Industry Cycle
19
1
2
3
4
5
6
0,105,82
153,204,0
132,255,159
219,254,188
255,245,173
255,230,110
255,213,57
250,161,0
173,207,198
Charts follow this
colour scheme
20
1. A Leader in the Global Potash Market
2. Strategic Review
3. Financial Highlights
4. Potash Market Outlook
5. Key Takeaways
Agenda
0,105,82
153,204,0
132,255,159
219,254,188
255,245,173
255,230,110
255,213,57
250,161,0
173,207,198
Charts follow this
colour scheme
21
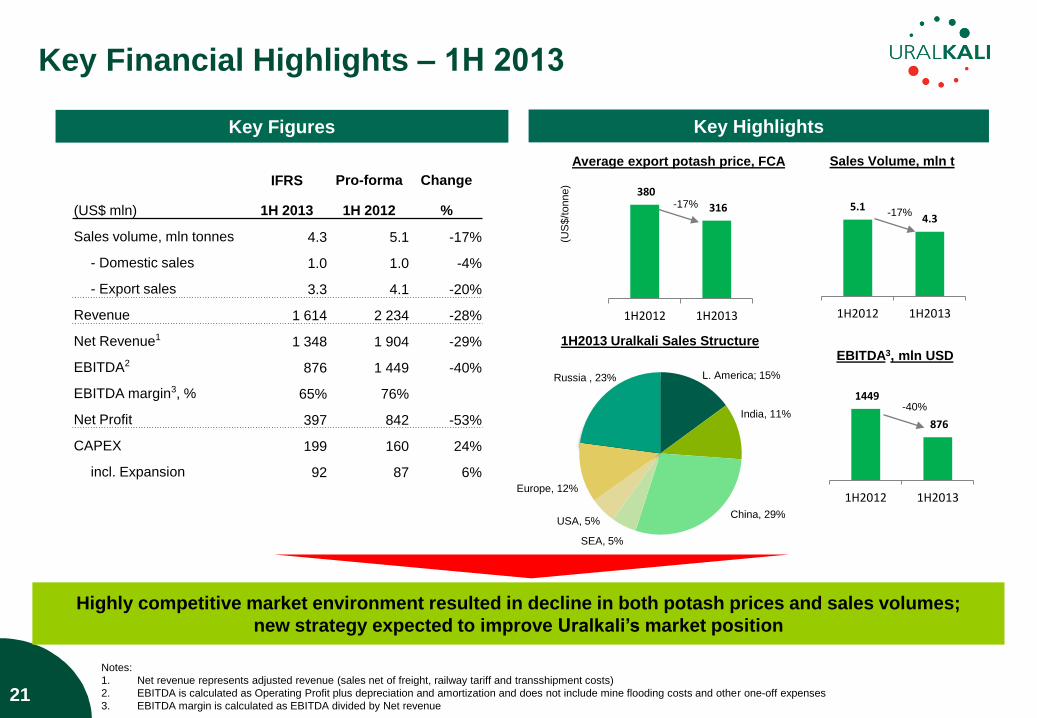
Key Financial Highlights – 1Н 2013
Highly competitive market environment resulted in decline in both potash prices and sales volumes;
new strategy expected to improve Uralkali‟s market position
Notes:
1. Net revenue represents adjusted revenue (sales net of freight, railway tariff and transshipment costs)
2. EBITDA is calculated as Operating Profit plus depreciation and amortization and does not include mine flooding costs and other one-off expenses
3. EBITDA margin is calculated as EBITDA divided by Net revenue
Key Figures Key Highlights
1H2013 Uralkali Sales Structure EBITDA3, mln USD
Average export potash price, FCA
IFRS Pro-forma Change
(US$ mln) 1H 2013 1H 2012 %
Sales volume, mln tonnes 4.3 5.1 -17%
- Domestic sales 1.0 1.0 -4%
- Export sales 3.3 4.1 -20%
Revenue 1 614 2 234 -28%
Net Revenue1 1 348 1 904 -29%
EBITDA2 876 1 449 -40%
EBITDA margin3, % 65% 76%
Net Profit 397 842 -53%
CAPEX 199 160 24%
incl. Expansion 92 87 6%
(US
$/t
onne)
380
316
1H2012 1H2013
-17%
1449
876
1H2012 1H2013
-40%
L. America; 15%
India, 11%
China, 29%
SEA, 5%
USA, 5%
Europe, 12%
Russia , 23%
Sales Volume, mln t
5.1 4.3
1H2012 1H2013
-17%
0,105,82
153,204,0
132,255,159
219,254,188
255,245,173
255,230,110
255,213,57
250,161,0
173,207,198
Charts follow this
colour scheme
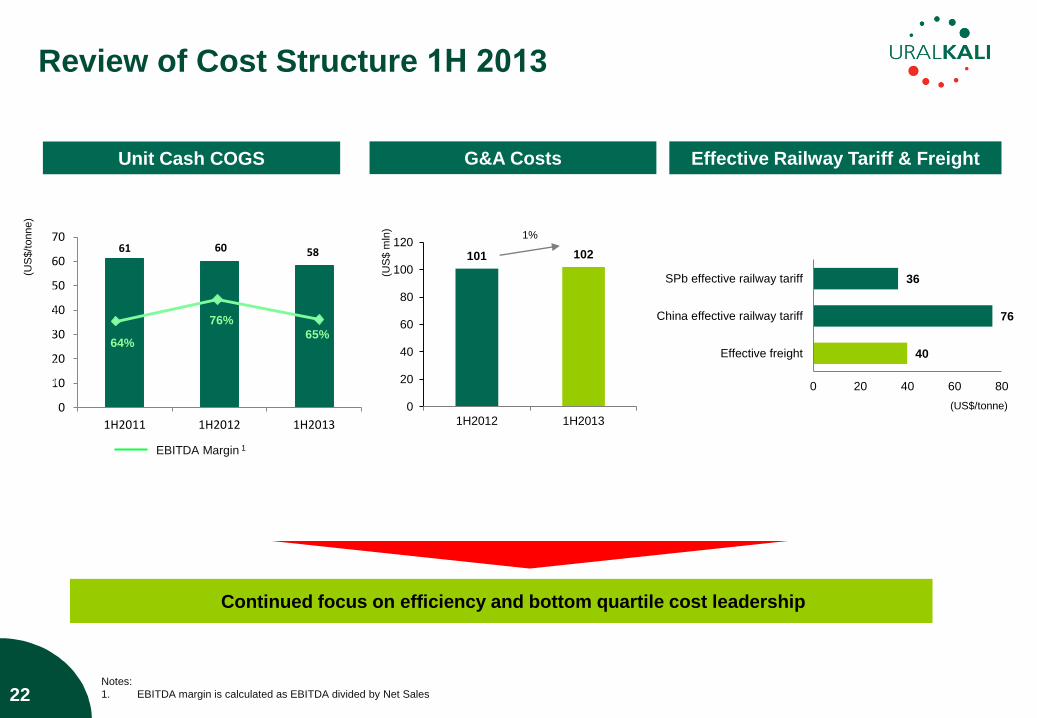
Review of Cost Structure 1Н 2013
Notes:
1. EBITDA margin is calculated as EBITDA divided by Net Sales
Unit Cash COGS
(US
$/t
onne)
61 60 58
0
10
20
30
40
50
60
70
1H2011 1H2012 1H2013
EBITDA Margin 1
64%
76%
65%
0
10
20
30
40
50
60
70
80
G&A Costs
101 102
0
20
40
60
80
100
120
1H2012 1H2013
G&A Costs 1%
(US
$ m
ln)
Effective Railway Tariff & Freight
(US$/tonne)
• Continued focus on efficiency and bottom quartile cost leadership
22
40
76
36
0 20 40 60 80
Effective freight
China effective railway tariff
SPb effective railway tariff
0,105,82
153,204,0
132,255,159
219,254,188
255,245,173
255,230,110
255,213,57
250,161,0
173,207,198
Charts follow this
colour scheme
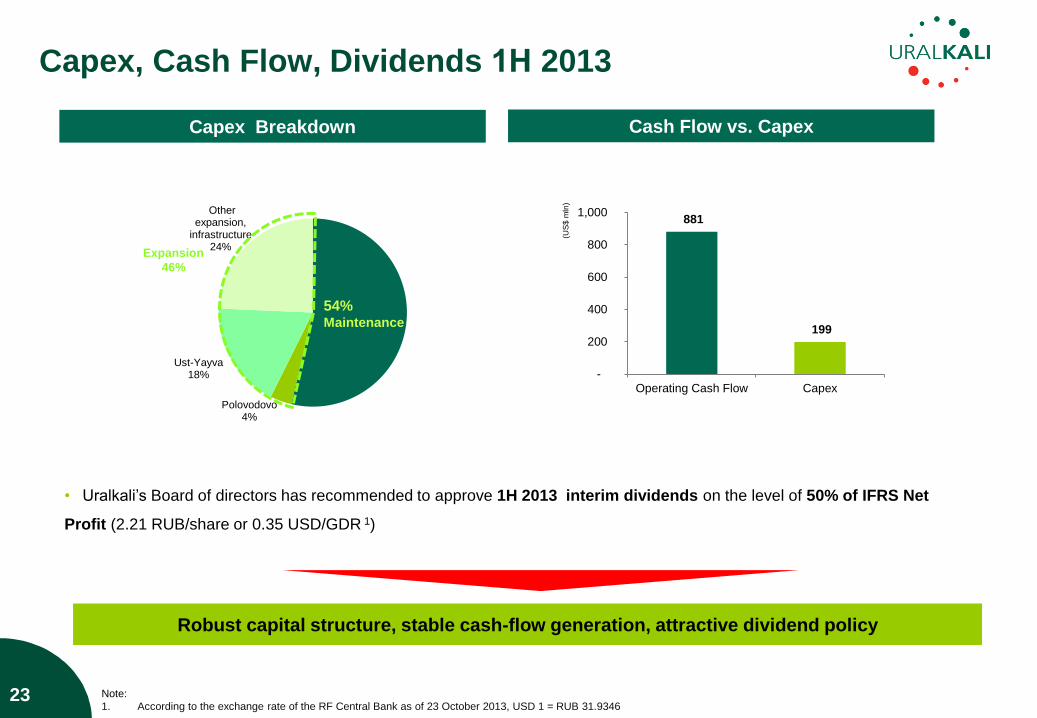
Capex, Cash Flow, Dividends 1Н 2013
Maintenance
Polovodovo 4%
Ust-Yayva 18%
Other expansion,
infrastructure 24%
54% Maintenance
Expansion
46%
(US
$ m
ln)
881
199
-
200
400
600
800
1,000
Operating Cash Flow Capex
Capex Breakdown
Robust capital structure, stable cash-flow generation, attractive dividend policy
Note:
1. According to the exchange rate of the RF Central Bank as of 23 October 2013, USD 1 = RUB 31.9346 23
• Uralkali‟s Board of directors has recommended to approve 1H 2013 interim dividends on the level of 50% of IFRS Net
Profit (2.21 RUB/share or 0.35 USD/GDR 1)
Cash Flow vs. Capex
0,105,82
153,204,0
132,255,159
219,254,188
255,245,173
255,230,110
255,213,57
250,161,0
173,207,198
Charts follow this
colour scheme
1,274
1,055
0
500
1,000
1,500
2,000
2,500
Liquidity as of 1Jul'2013
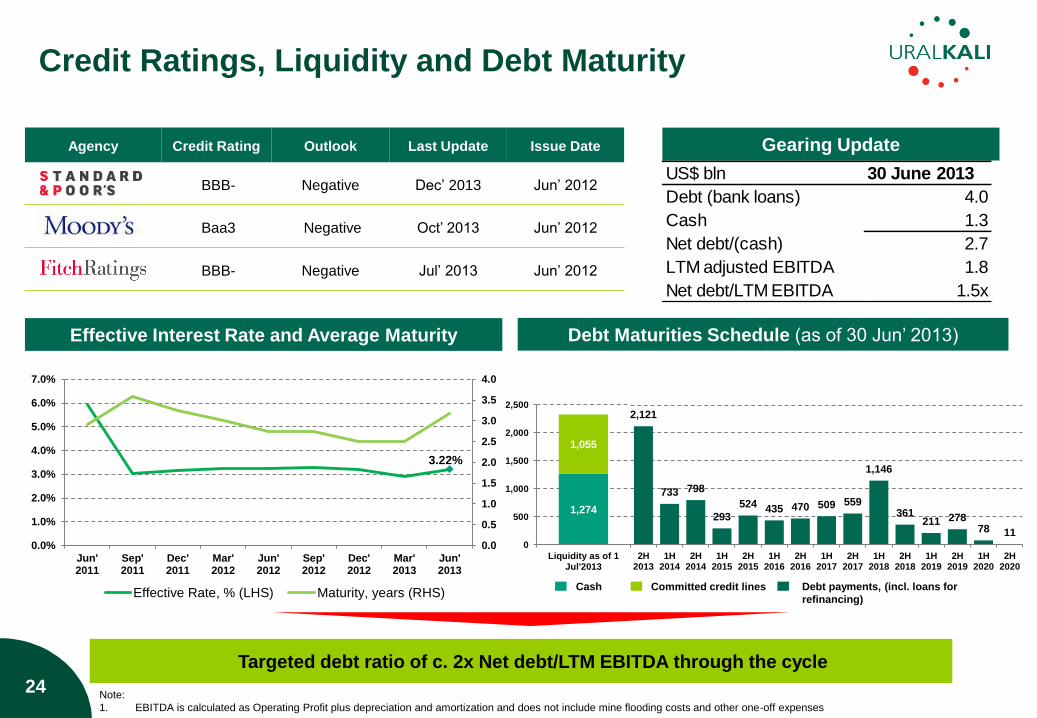
Credit Ratings, Liquidity and Debt Maturity
24
Agency Credit Rating Outlook Last Update Issue Date
BBB- Negative Dec‟ 2013 Jun‟ 2012
Baa3 Negative Oct‟ 2013 Jun‟ 2012
BBB- Negative Jul‟ 2013 Jun‟ 2012
Effective Interest Rate and Average Maturity Debt Maturities Schedule (as of 30 Jun‟ 2013)
US$ bln 30 June 2013
Debt (bank loans) 4.0
Cash 1.3
Net debt/(cash) 2.7
LTM adjusted EBITDA 1.8
Net debt/LTM EBITDA 1.5x
Note:
1. EBITDA is calculated as Operating Profit plus depreciation and amortization and does not include mine flooding costs and other one-off expenses
3.22%
0.0
0.5
1.0
1.5
2.0
2.5
3.0
3.5
4.0
0.0%
1.0%
2.0%
3.0%
4.0%
5.0%
6.0%
7.0%
Jun'2011
Sep'2011
Dec'2011
Mar'2012
Jun'2012
Sep'2012
Dec'2012
Mar'2013
Jun'2013
Effective Rate, % (LHS) Maturity, years (RHS)
2,121
733 798
293
524 435 470 509 559
1,146
361 211 278
78 11
2H2013
1H2014
2H2014
1H2015
2H2015
1H2016
2H2016
1H2017
2H2017
1H2018
2H2018
1H2019
2H2019
1H2020
2H2020
• Targeted debt ratio of c. 2x Net debt/LTM EBITDA through the cycle
Cash Committed credit lines Debt payments, (incl. loans for
refinancing)
Gearing Update
0,105,82
153,204,0
132,255,159
219,254,188
255,245,173
255,230,110
255,213,57
250,161,0
173,207,198
Charts follow this
colour scheme
25
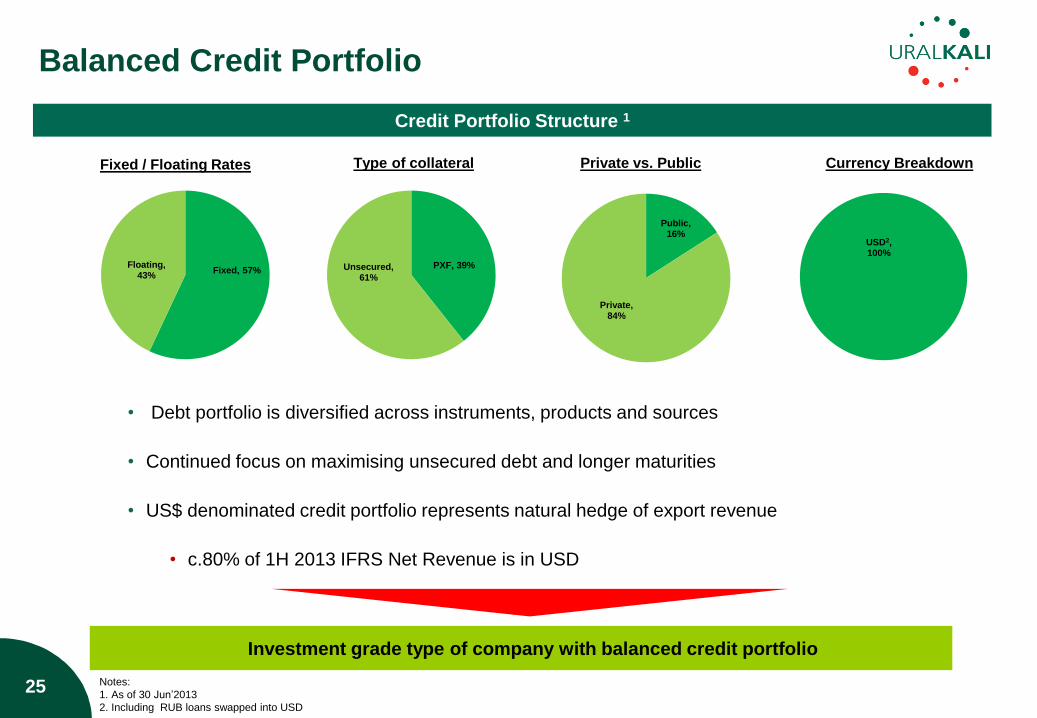
Balanced Credit Portfolio
• Debt portfolio is diversified across instruments, products and sources
• Continued focus on maximising unsecured debt and longer maturities
• US$ denominated credit portfolio represents natural hedge of export revenue
• c.80% of 1H 2013 IFRS Net Revenue is in USD
Fixed, 57% Floating,
43% PXF, 39% Unsecured,
61%
Public, 16%
Private, 84%
USD2, 100%
Fixed / Floating Rates Type of collateral Currency Breakdown Private vs. Public
• Investment grade type of company with balanced credit portfolio
Notes:
1. As of 30 Jun‟2013
2. Including RUB loans swapped into USD
Credit Portfolio Structure 1
0,105,82
153,204,0
132,255,159
219,254,188
255,245,173
255,230,110
255,213,57
250,161,0
173,207,198
Charts follow this
colour scheme
26
1. A Leader in the Global Potash Market
2. Strategic Review
3. Financial Highlights
4. Potash Market Outlook
5. Key Takeaways
Agenda
0,105,82
153,204,0
132,255,159
219,254,188
255,245,173
255,230,110
255,213,57
250,161,0
173,207,198
Charts follow this
colour scheme
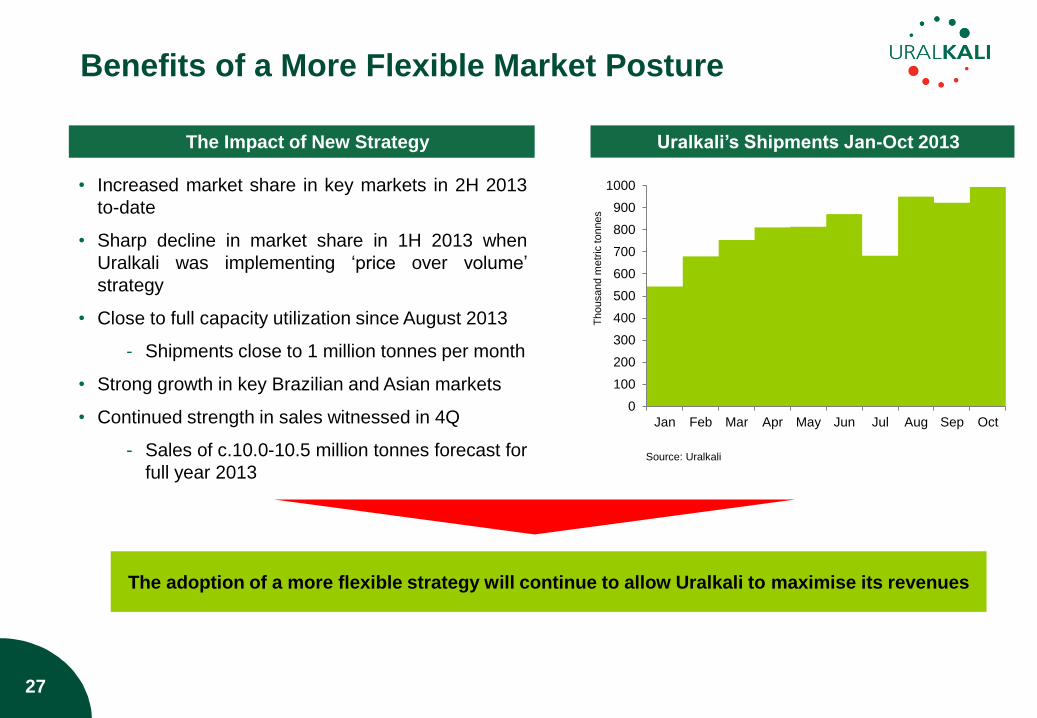
The adoption of a more flexible strategy will continue to allow Uralkali to maximise its revenues
27
Source: Uralkali
• Increased market share in key markets in 2H 2013
to-date
• Sharp decline in market share in 1H 2013 when
Uralkali was implementing „price over volume‟
strategy
• Close to full capacity utilization since August 2013
- Shipments close to 1 million tonnes per month
• Strong growth in key Brazilian and Asian markets
• Continued strength in sales witnessed in 4Q
- Sales of c.10.0-10.5 million tonnes forecast for
full year 2013
0
100
200
300
400
500
600
700
800
900
1000
Jan Feb Mar Apr May Jun Jul Aug Sep Oct
Th
ousand m
etr
ic tonnes
Uralkali‟s Shipments Jan-Oct 2013 The Impact of New Strategy
Benefits of a More Flexible Market Posture
0,105,82
153,204,0
132,255,159
219,254,188
255,245,173
255,230,110
255,213,57
250,161,0
173,207,198
Charts follow this
colour scheme
4 Notes:
1. Inventory doesn‟t include domestic potash producers‟ stocks, excl. China
2. Including domestic producers‟ stocks, port stocks, pile channels stock, NPK warehouse stocks
28
Источник: оценка БКК
Source: Uralkali‟s estimations
2.0 1.9
1.2 0.7
4.9
0.6
1.7 1.6
1.0 1.0
3.5
0.5 0.0
1.0
2.0
3.0
4.0
5.0
N.America SEA Brazil India China² EMEA
Mill
ion m
etr
ic tonnes
end of 2012 end of December 2013E
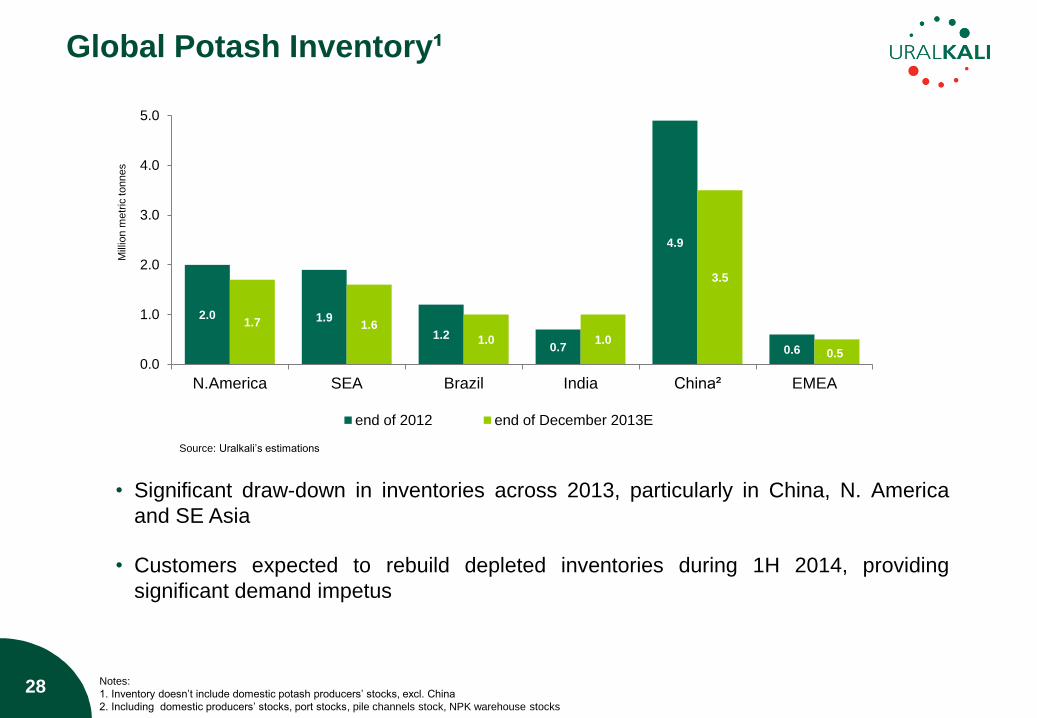
Global Potash Inventory¹
• Significant draw-down in inventories across 2013, particularly in China, N. America
and SE Asia
• Customers expected to rebuild depleted inventories during 1H 2014, providing
significant demand impetus
0,105,82
153,204,0
132,255,159
219,254,188
255,245,173
255,230,110
255,213,57
250,161,0
173,207,198
Charts follow this
colour scheme
29
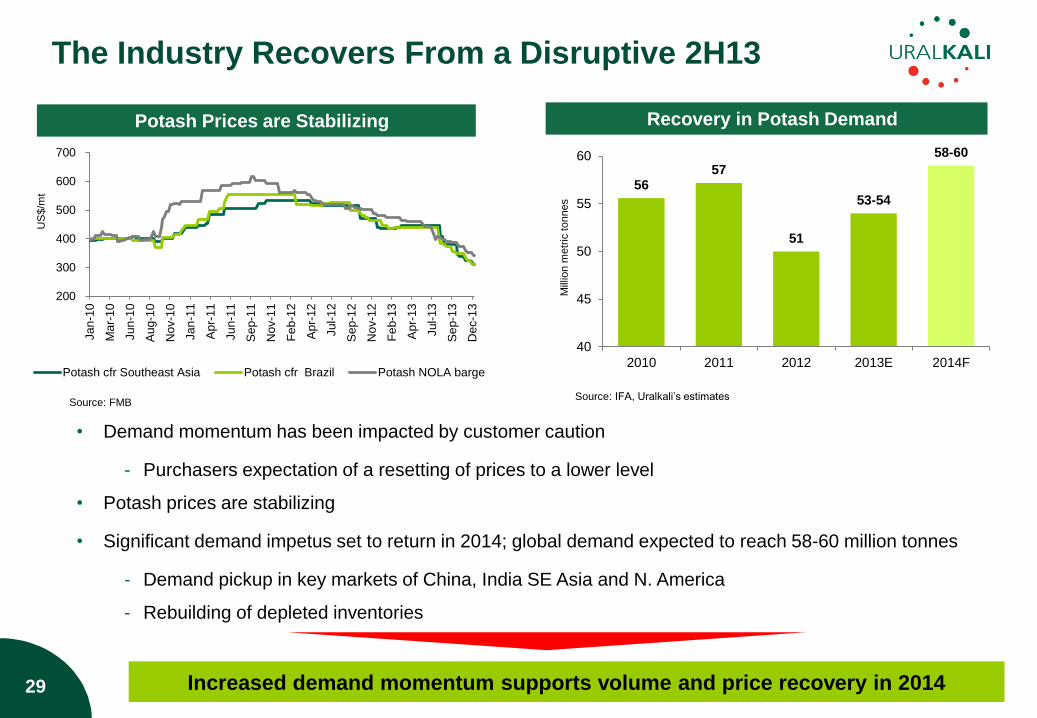
The Industry Recovers From a Disruptive 2H13
• Demand momentum has been impacted by customer caution
- Purchasers expectation of a resetting of prices to a lower level
• Potash prices are stabilizing
• Significant demand impetus set to return in 2014; global demand expected to reach 58-60 million tonnes
- Demand pickup in key markets of China, India SE Asia and N. America
- Rebuilding of depleted inventories
56 57
51
53-54
58-60
40
45
50
55
60
2010 2011 2012 2013E 2014F
Mill
ion m
etr
ic tonnes
Recovery in Potash Demand M
tpa
200
300
400
500
600
700
Jan
-10
Ma
r-1
0
Jun
-10
Au
g-1
0
Nov-1
0
Jan
-11
Ap
r-11
Jun
-11
Se
p-1
1
Nov-1
1
Fe
b-1
2
Ap
r-12
Jul-
12
Se
p-1
2
Nov-1
2
Fe
b-1
3
Ap
r-13
Jul-
13
Se
p-1
3
Dec-1
3
US
$/m
t
Potash cfr Southeast Asia Potash cfr Brazil Potash NOLA barge
Potash Prices are Stabilizing
Source: FMB Source: IFA, Uralkali‟s estimates
Increased demand momentum supports volume and price recovery in 2014
0,105,82
153,204,0
132,255,159
219,254,188
255,245,173
255,230,110
255,213,57
250,161,0
173,207,198
Charts follow this
colour scheme
30
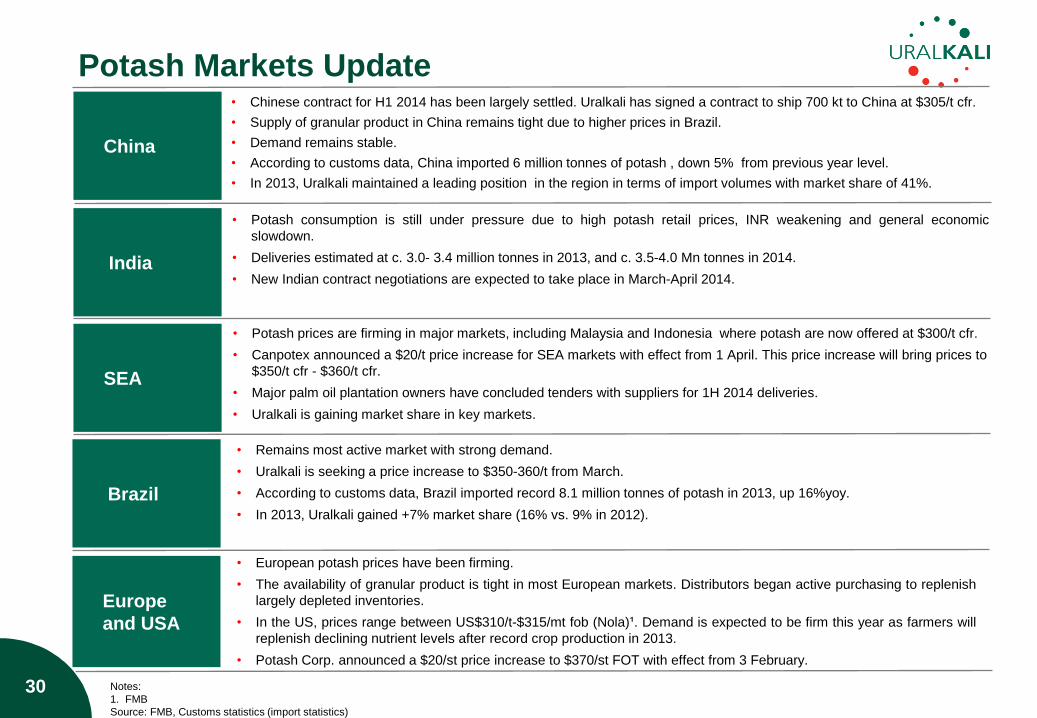
Potash Markets Update
China
• Chinese contract for H1 2014 has been largely settled. Uralkali has signed a contract to ship 700 kt to China at $305/t cfr.
• Supply of granular product in China remains tight due to higher prices in Brazil.
• Demand remains stable.
• According to customs data, China imported 6 million tonnes of potash , down 5% from previous year level.
• In 2013, Uralkali maintained a leading position in the region in terms of import volumes with market share of 41%.
India
• Potash consumption is still under pressure due to high potash retail prices, INR weakening and general economic
slowdown.
• Deliveries estimated at c. 3.0- 3.4 million tonnes in 2013, and c. 3.5-4.0 Mn tonnes in 2014.
• New Indian contract negotiations are expected to take place in March-April 2014.
SEA
• Potash prices are firming in major markets, including Malaysia and Indonesia where potash are now offered at $300/t cfr.
• Canpotex announced a $20/t price increase for SEA markets with effect from 1 April. This price increase will bring prices to
$350/t cfr - $360/t cfr.
• Major palm oil plantation owners have concluded tenders with suppliers for 1H 2014 deliveries.
• Uralkali is gaining market share in key markets.
Brazil
• Remains most active market with strong demand.
• Uralkali is seeking a price increase to $350-360/t from March.
• According to customs data, Brazil imported record 8.1 million tonnes of potash in 2013, up 16%yoy.
• In 2013, Uralkali gained +7% market share (16% vs. 9% in 2012).
Europe
and USA
• European potash prices have been firming.
• The availability of granular product is tight in most European markets. Distributors began active purchasing to replenish
largely depleted inventories.
• In the US, prices range between US$310/t-$315/mt fob (Nola)¹. Demand is expected to be firm this year as farmers will
replenish declining nutrient levels after record crop production in 2013.
• Potash Corp. announced a $20/st price increase to $370/st FOT with effect from 3 February.
Notes:
1. FMB
Source: FMB, Customs statistics (import statistics)
0,105,82
153,204,0
132,255,159
219,254,188
255,245,173
255,230,110
255,213,57
250,161,0
173,207,198
Charts follow this
colour scheme
4
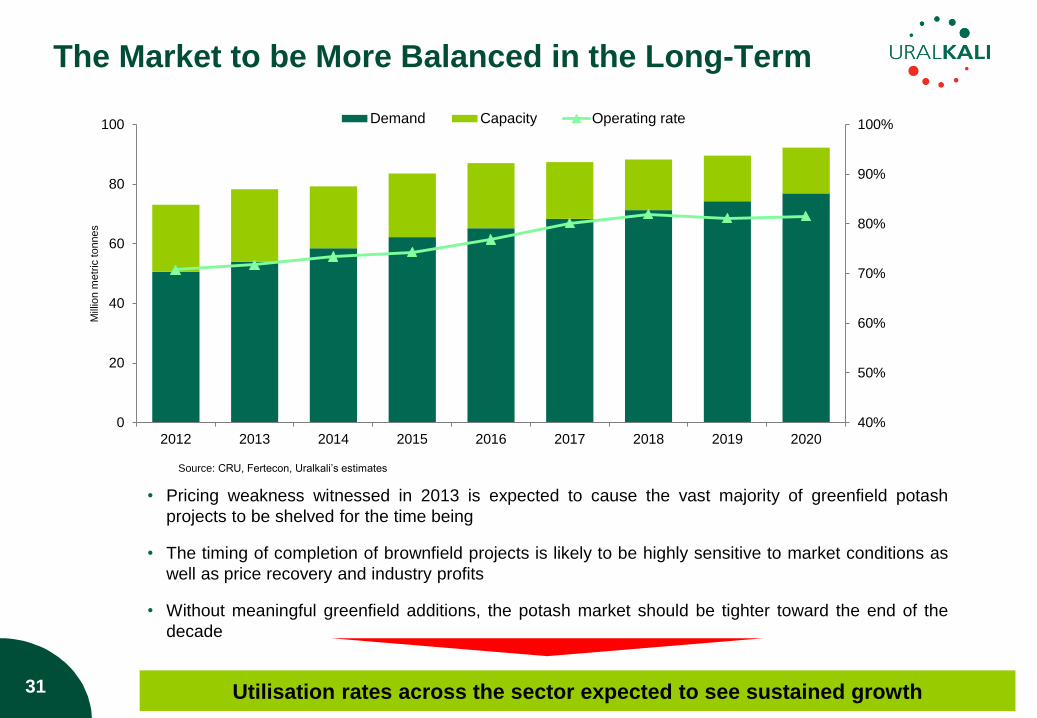
• Pricing weakness witnessed in 2013 is expected to cause the vast majority of greenfield potash
projects to be shelved for the time being
• The timing of completion of brownfield projects is likely to be highly sensitive to market conditions as
well as price recovery and industry profits
• Without meaningful greenfield additions, the potash market should be tighter toward the end of the
decade
31
Источник: оценка БКК
The Market to be More Balanced in the Long-Term
Source: CRU, Fertecon, Uralkali‟s estimates
40%
50%
60%
70%
80%
90%
100%
0
20
40
60
80
100
2012 2013 2014 2015 2016 2017 2018 2019 2020
Mill
ion m
etr
ic tonnes
Demand Capacity Operating rate
Utilisation rates across the sector expected to see sustained growth
0,105,82
153,204,0
132,255,159
219,254,188
255,245,173
255,230,110
255,213,57
250,161,0
173,207,198
Charts follow this
colour scheme
32
1. A Leader in the Global Potash Market
2. Strategic Review
3. Financial Highlights
4. Potash Market Outlook
5. Key Takeaways
Agenda
0,105,82
153,204,0
132,255,159
219,254,188
255,245,173
255,230,110
255,213,57
250,161,0
173,207,198
Charts follow this
colour scheme
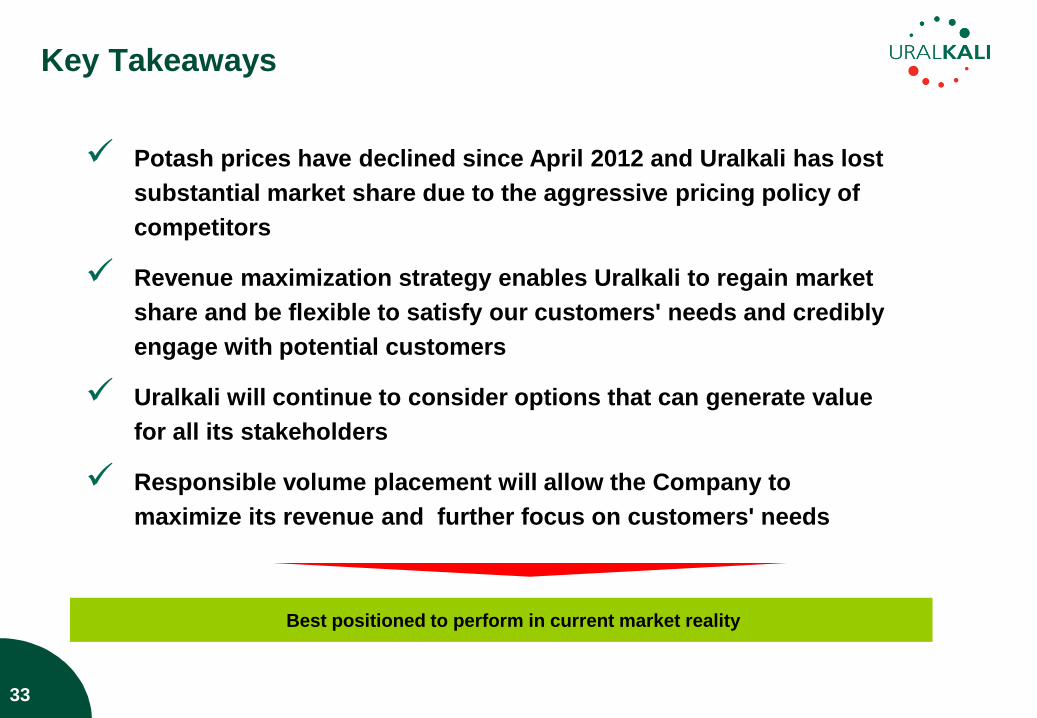
Key Takeaways
33
Potash prices have declined since April 2012 and Uralkali has lost
substantial market share due to the aggressive pricing policy of
competitors
Revenue maximization strategy enables Uralkali to regain market
share and be flexible to satisfy our customers' needs and credibly
engage with potential customers
Uralkali will continue to consider options that can generate value
for all its stakeholders
Responsible volume placement will allow the Company to
maximize its revenue and further focus on customers' needs
• Best positioned to perform in current market reality
0,105,82
153,204,0
132,255,159
219,254,188
255,245,173
255,230,110
255,213,57
250,161,0
173,207,198
Charts follow this
colour scheme
34
Appendices
0,105,82
153,204,0
132,255,159
219,254,188
255,245,173
255,230,110
255,213,57
250,161,0
173,207,198
Charts follow this
colour scheme
35
Business Model
Governance and Management Team
Potash Market Fundamentals
Operating Process
Awards and Achievements
Appendices
0,105,82
153,204,0
132,255,159
219,254,188
255,245,173
255,230,110
255,213,57
250,161,0
173,207,198
Charts follow this
colour scheme
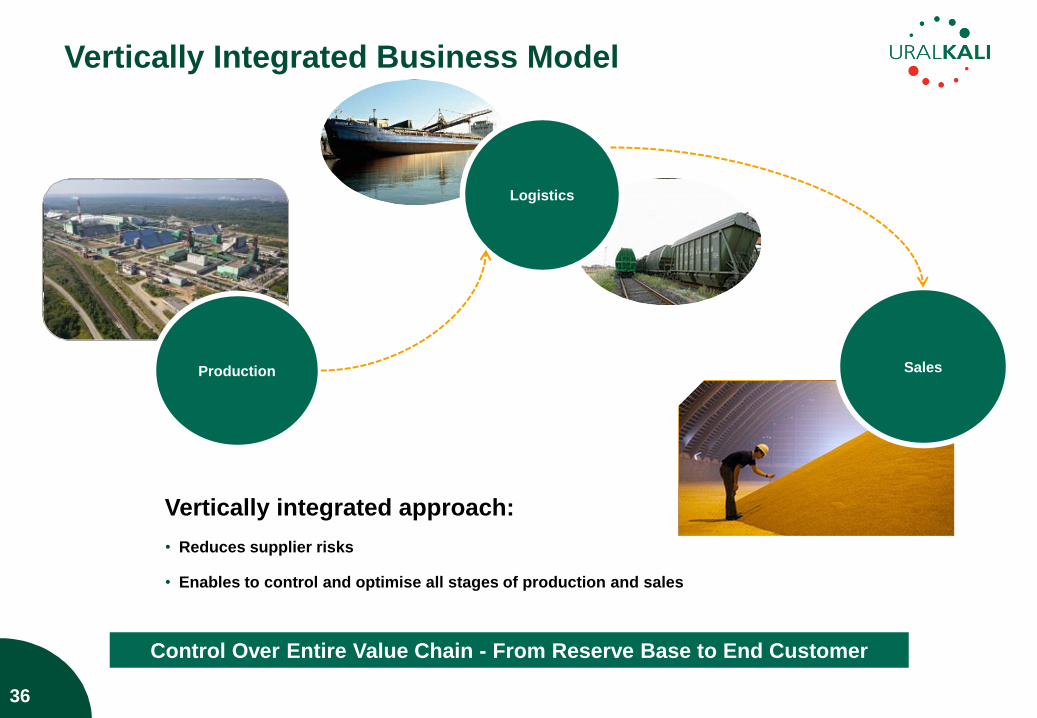
Vertically integrated approach:
• Reduces supplier risks
• Enables to control and optimise all stages of production and sales
36
Vertically Integrated Business Model
Production
Logistics
Sales
Control Over Entire Value Chain - From Reserve Base to End Customer
0,105,82
153,204,0
132,255,159
219,254,188
255,245,173
255,230,110
255,213,57
250,161,0
173,207,198
Charts follow this
colour scheme
37
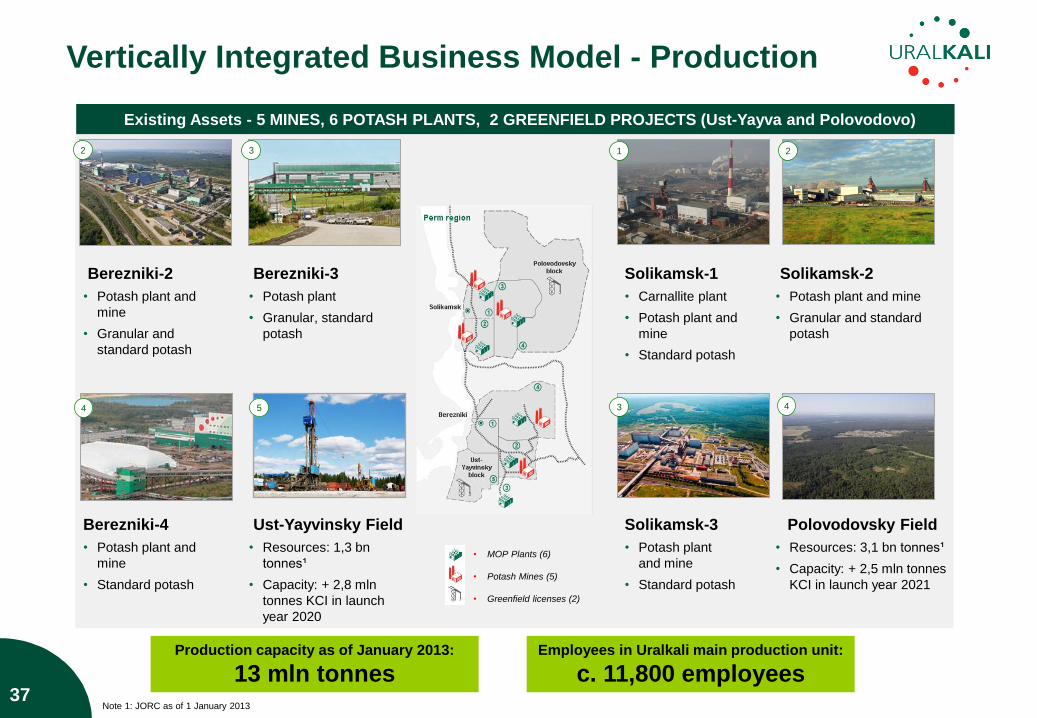
Vertically Integrated Business Model - Production
Berezniki-2
• Potash plant and
mine
• Granular and
standard potash
Berezniki-4
• Potash plant and
mine
• Standard potash
Ust-Yayvinsky Field
• Resources: 1,3 bn
tonnes¹
• Capacity: + 2,8 mln
tonnes KCI in launch
year 2020
Existing Assets - 5 MINES, 6 POTASH PLANTS, 2 GREENFIELD PROJECTS (Ust-Yayva and Polovodovo)
4
3
3
Solikamsk-2
• Potash plant and mine
• Granular and standard
potash
Solikamsk-1
• Carnallite plant
• Potash plant and
mine
• Standard potash
Polovodovsky Field
• Resources: 3,1 bn tonnes¹
• Capacity: + 2,5 mln tonnes
KCI in launch year 2021
Solikamsk-3
• Potash plant
and mine
• Standard potash
2 1 2
4 5
Berezniki-3
• Potash plant
• Granular, standard
potash
• MOP Plants (6)
• Potash Mines (5)
• Greenfield licenses (2)
Production capacity as of January 2013:
13 mln tonnes Employees in Uralkali main production unit:
c. 11,800 employees Note 1: JORC as of 1 January 2013
0,105,82
153,204,0
132,255,159
219,254,188
255,245,173
255,230,110
255,213,57
250,161,0
173,207,198
Charts follow this
colour scheme
38
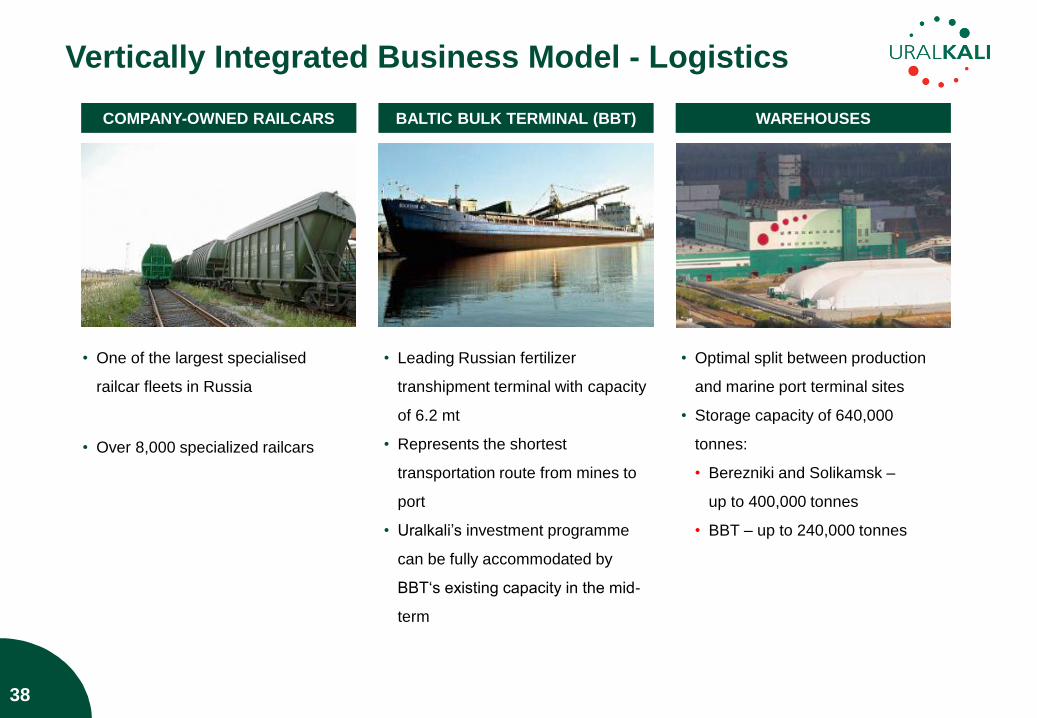
Vertically Integrated Business Model - Logistics
COMPANY-OWNED RAILCARS BALTIC BULK TERMINAL (BBT) WAREHOUSES
• Leading Russian fertilizer
transhipment terminal with capacity
of 6.2 mt
• Represents the shortest
transportation route from mines to
port
• Uralkali‟s investment programme
can be fully accommodated by
BBT„s existing capacity in the mid-
term
• Optimal split between production
and marine port terminal sites
• Storage capacity of 640,000
tonnes:
• Berezniki and Solikamsk –
up to 400,000 tonnes
• BBT – up to 240,000 tonnes
• One of the largest specialised
railcar fleets in Russia
• Over 8,000 specialized railcars
0,105,82
153,204,0
132,255,159
219,254,188
255,245,173
255,230,110
255,213,57
250,161,0
173,207,198
Charts follow this
colour scheme
39
Appendices
Business Model
Governance and Management Team
Potash Market Fundamentals
Operating Process
Awards and Achievements
0,105,82
153,204,0
132,255,159
219,254,188
255,245,173
255,230,110
255,213,57
250,161,0
173,207,198
Charts follow this
colour scheme
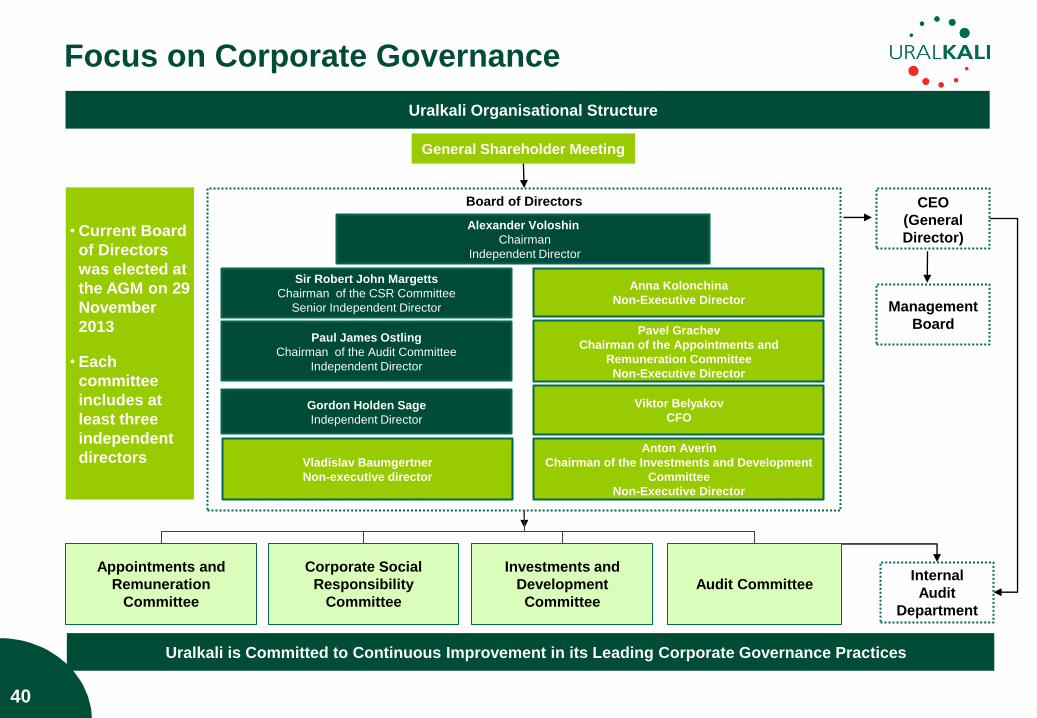
Uralkali is Committed to Continuous Improvement in its Leading Corporate Governance Practices
40
Focus on Corporate Governance
Uralkali Organisational Structure
General Shareholder Meeting
CEO
(General
Director)
Management
Board
• Current Board
of Directors
was elected at
the AGM on 29
November
2013
• Each
committee
includes at
least three
independent
directors
Alexander Voloshin
Chairman
Independent Director
Sir Robert John Margetts
Chairman of the CSR Committee
Senior Independent Director
Anna Kolonchina
Non-Executive Director
Paul James Ostling
Chairman of the Audit Committee
Independent Director
Vladislav Baumgertner
Non-executive director
Pavel Grachev
Chairman of the Appointments and
Remuneration Committee
Non-Executive Director
Viktor Belyakov
CFO
Anton Averin
Chairman of the Investments and Development
Committee
Non-Executive Director
Gordon Holden Sage
Independent Director
Board of Directors
Internal
Audit
Department
Appointments and
Remuneration
Committee
Investments and
Development
Committee
Audit Committee
Corporate Social
Responsibility
Committee
0,105,82
153,204,0
132,255,159
219,254,188
255,245,173
255,230,110
255,213,57
250,161,0
173,207,198
Charts follow this
colour scheme
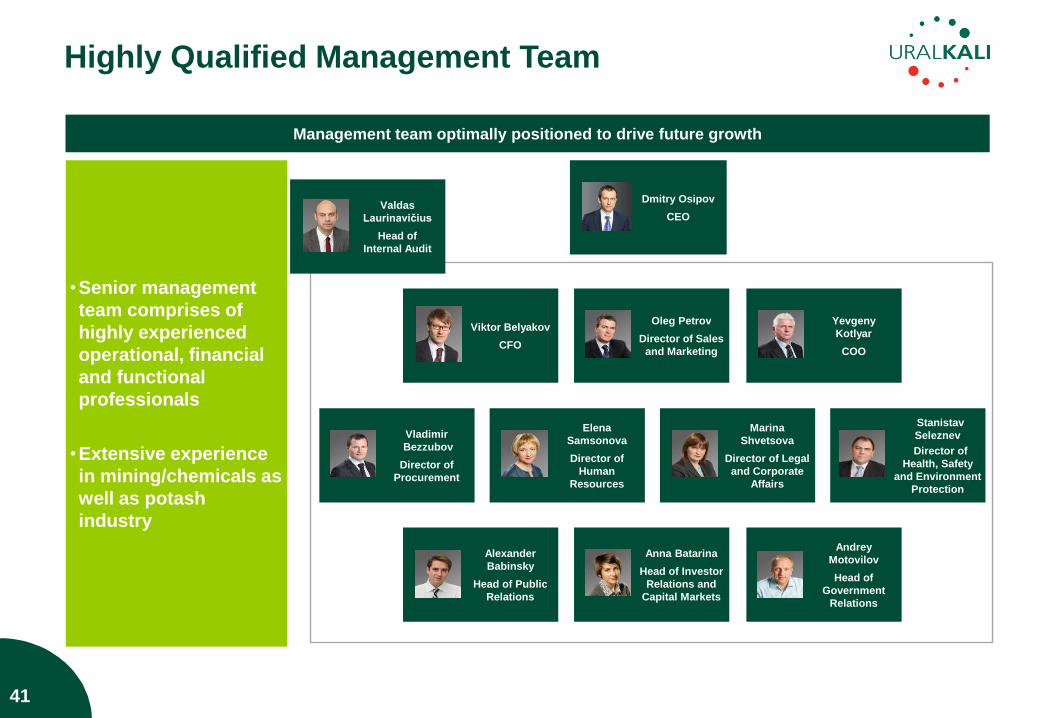
Dmitry Osipov
CEO
Viktor Belyakov
CFO
•Senior management
team comprises of
highly experienced
operational, financial
and functional
professionals
•Extensive experience
in mining/chemicals as
well as potash
industry
Management team optimally positioned to drive future growth
41
Highly Qualified Management Team
Elena
Samsonova
Director of
Human
Resources
Marina
Shvetsova
Director of Legal
and Corporate
Affairs
Yevgeny
Kotlyar
COO
Stanistav
Seleznev
Director of
Health, Safety
and Environment
Protection
Anna Batarina
Head of Investor
Relations and
Capital Markets
Alexander
Babinsky
Head of Public
Relations
Vladimir
Bezzubov
Director of
Procurement
Oleg Petrov
Director of Sales
and Marketing
Andrey
Motovilov
Head of
Government
Relations
Valdas
Laurinavičius
Head of
Internal Audit
0,105,82
153,204,0
132,255,159
219,254,188
255,245,173
255,230,110
255,213,57
250,161,0
173,207,198
Charts follow this
colour scheme
42
Appendices
Business Model
Governance and Management Team
Potash Market Fundamentals
Operating Process
Awards and Achievements
0,105,82
153,204,0
132,255,159
219,254,188
255,245,173
255,230,110
255,213,57
250,161,0
173,207,198
Charts follow this
colour scheme
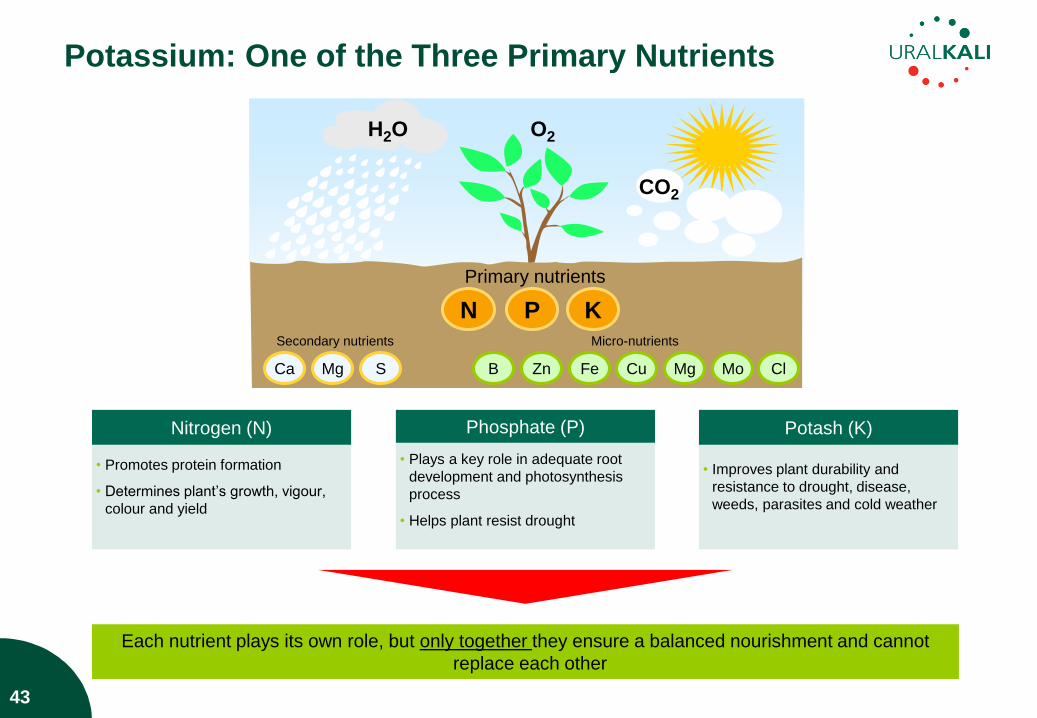
Primary nutrients
Secondary nutrients Micro-nutrients
Ca Mg S B Zn Fe Cu Mg Mo Cl
N P K
H2O
CO2
O2
• Promotes protein formation
• Determines plant‟s growth, vigour,
colour and yield
Nitrogen (N)
• Plays a key role in adequate root
development and photosynthesis
process
• Helps plant resist drought
Phosphate (P)
• Improves plant durability and
resistance to drought, disease,
weeds, parasites and cold weather
Potash (K)
Each nutrient plays its own role, but only together they ensure a balanced nourishment and cannot
replace each other
43
Potassium: One of the Three Primary Nutrients
0,105,82
153,204,0
132,255,159
219,254,188
255,245,173
255,230,110
255,213,57
250,161,0
173,207,198
Charts follow this
colour scheme
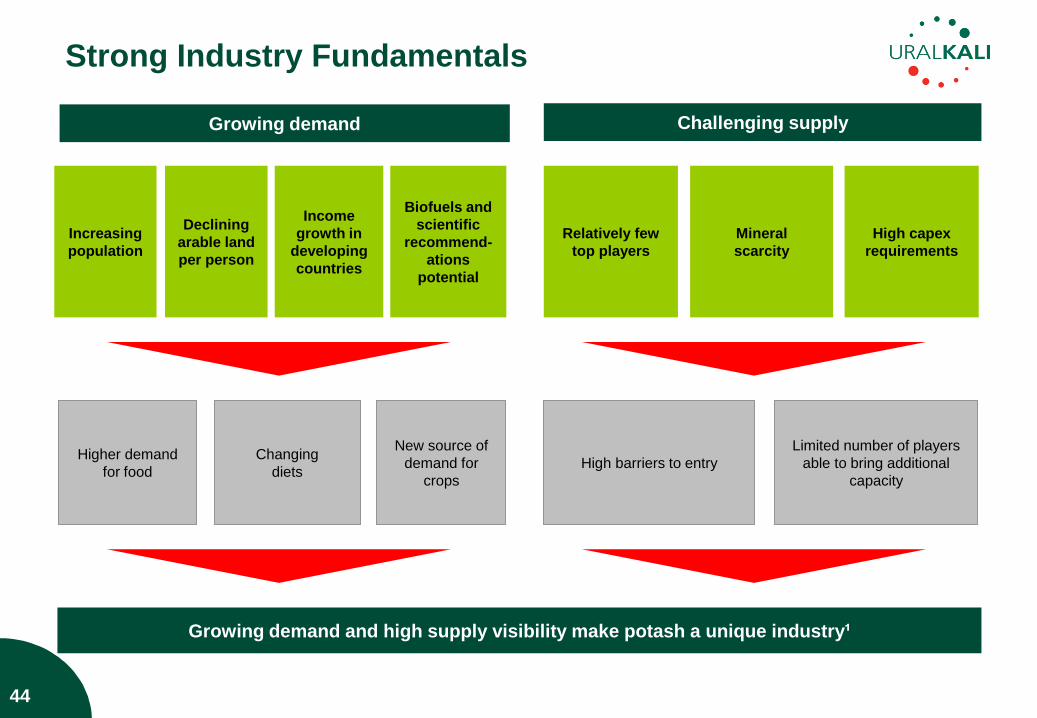
Growing demand Challenging supply
Growing demand and high supply visibility make potash a unique industry¹
Income
growth in
developing
countries
Biofuels and
scientific
recommend-
ations
potential
Increasing
population
Mineral
scarcity
High capex
requirements
Declining
arable land
per person
Relatively few
top players
Changing
diets
Higher demand
for food
Limited number of players
able to bring additional
capacity
High barriers to entry
New source of
demand for
crops
44
Strong Industry Fundamentals
0,105,82
153,204,0
132,255,159
219,254,188
255,245,173
255,230,110
255,213,57
250,161,0
173,207,198
Charts follow this
colour scheme
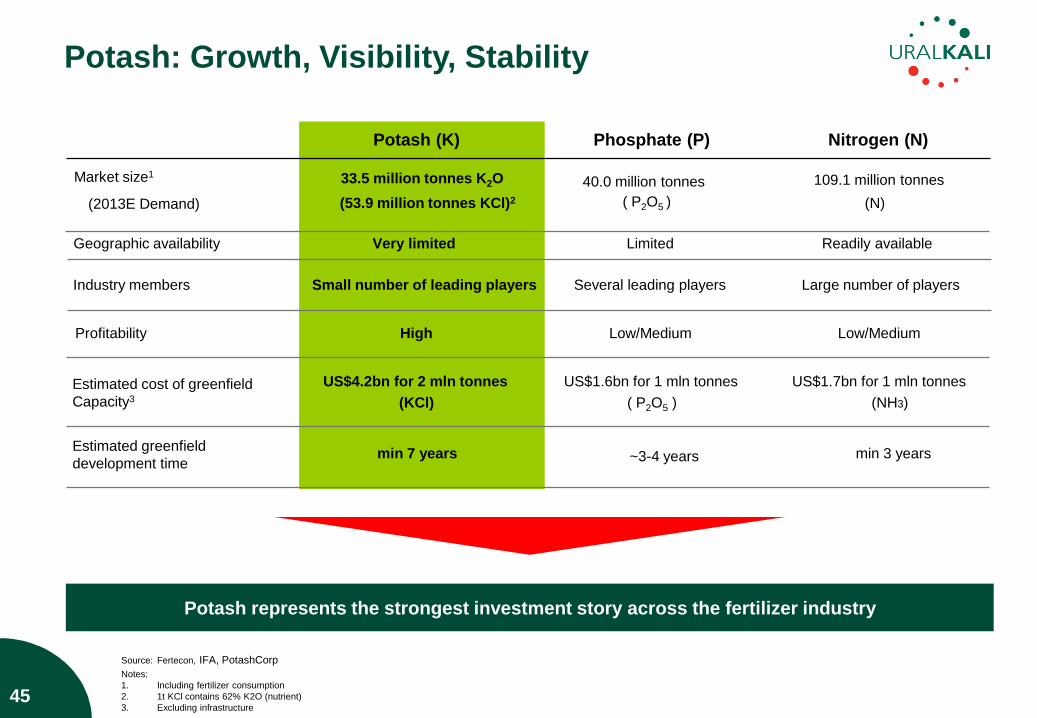
Source: Fertecon, IFA, PotashCorp
Notes:
1. Including fertilizer consumption
2. 1t KCl contains 62% K2O (nutrient)
3. Excluding infrastructure
Potash represents the strongest investment story across the fertilizer industry
Very limited
33.5 million tonnes K2O
Profitability
Estimated cost of greenfield
Capacity3 (NH3)
Potash (K) Phosphate (P) Nitrogen (N)
Market size1
(2013E Demand) (53.9 million tonnes KCl)2
40.0 million tonnes 109.1 million tonnes
(N)
Geographic availability Limited Readily available
Industry members
High Low/Medium Low/Medium
US$4.2bn for 2 mln tonnes
(KCl)
US$1.6bn for 1 mln tonnes US$1.7bn for 1 mln tonnes
Small number of leading players Several leading players Large number of players
( P2O5 )
( P2O5 )
Estimated greenfield
development time min 7 years ~3-4 years min 3 years
45
Potash: Growth, Visibility, Stability
0,105,82
153,204,0
132,255,159
219,254,188
255,245,173
255,230,110
255,213,57
250,161,0
173,207,198
Charts follow this
colour scheme
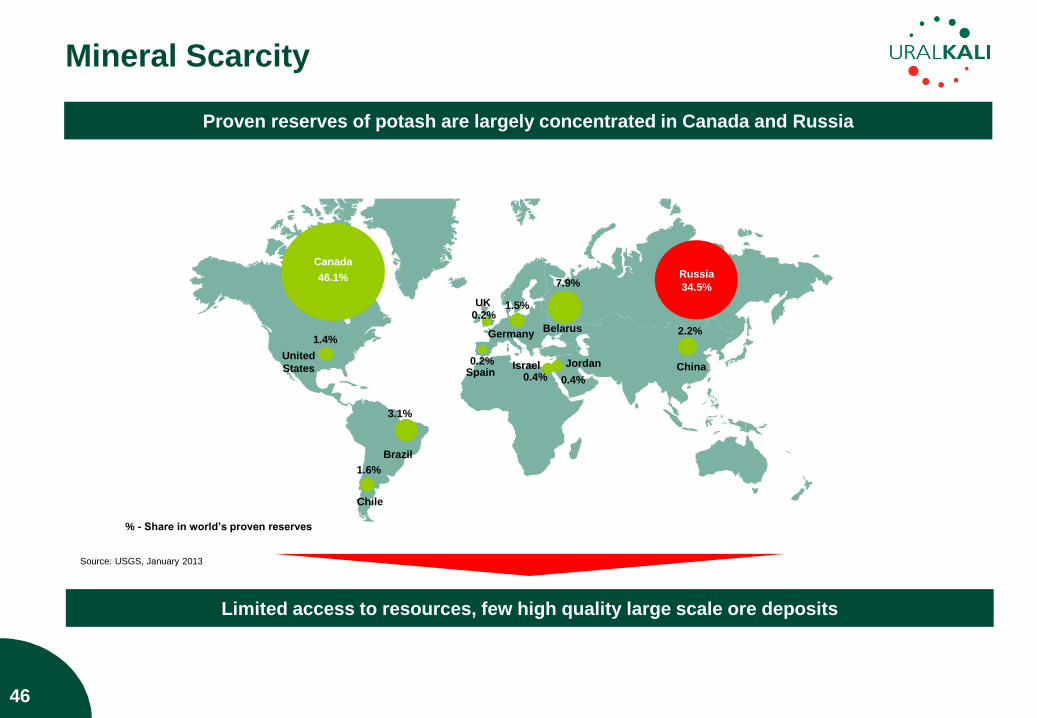
46
0.4% Israel
1.4%
United
States
2.2%
China
1.5%
Germany
7.9%
Belarus
46.3%
Canada
Proven reserves of potash are largely concentrated in Canada and Russia
Limited access to resources, few high quality large scale ore deposits
Source: USGS, January 2013
Jordan
0.4%
Chile
1.6%
Spain 0.2%
3.1%
Brazil
% - Share in world‟s proven reserves
34.5%
Russia Canada 46.1%
UK 0.2%
Mineral Scarcity
0,105,82
153,204,0
132,255,159
219,254,188
255,245,173
255,230,110
255,213,57
250,161,0
173,207,198
Charts follow this
colour scheme
Emerging & developing economies
World Output
Advanced Economies
0
2
4
6
8
2010 2011 2012F 2013F
0
200
400
600
800
1,000
1,200
19
61
19
65
19
69
19
73
19
77
19
81
19
85
19
89
19
93
19
97
20
01
20
05
20
09
20
20
F
mln
tonnes
Meat Dairy
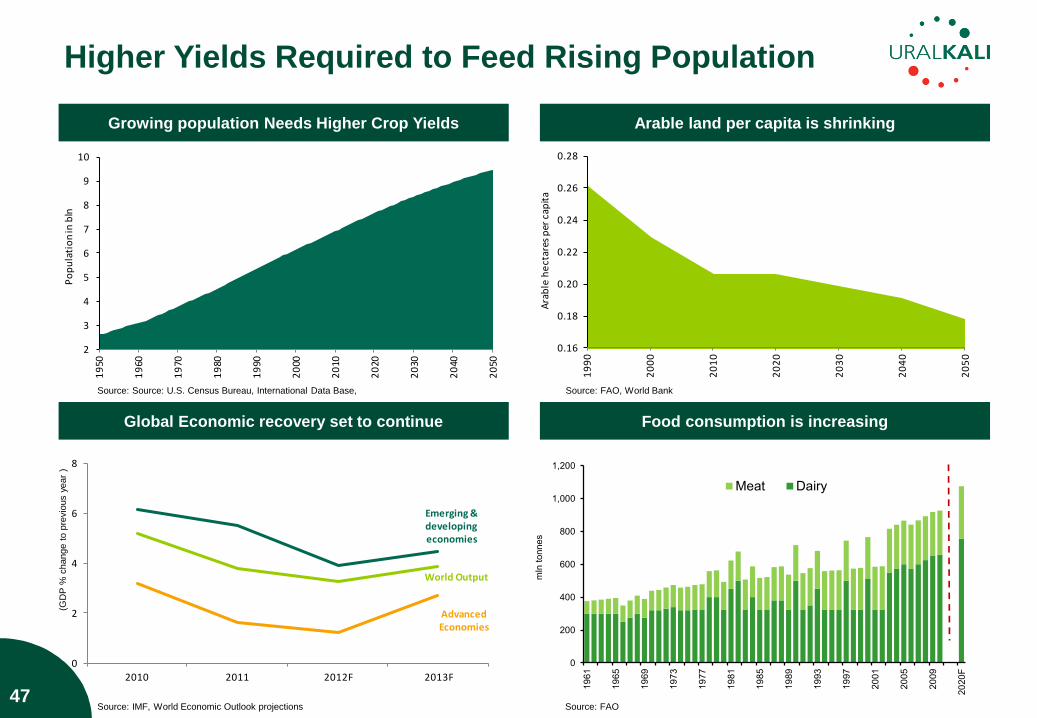
Growing population Needs Higher Crop Yields Arable land per capita is shrinking
Global Economic recovery set to continue Food consumption is increasing
Source: Source: U.S. Census Bureau, International Data Base,
Source: FAO Source: IMF, World Economic Outlook projections
Source: FAO, World Bank
(GD
P %
change t
o p
revio
us y
ear
)
2
3
4
5
6
7
8
9
10
19
50
19
60
19
70
19
80
19
90
20
00
20
10
20
20
20
30
20
40
20
50
Po
pu
lati
on
in b
ln
0.16
0.18
0.20
0.22
0.24
0.26
0.28
19
90
20
00
20
10
20
20
20
30
20
40
20
50
Ara
ble
he
ctar
es p
er c
apit
a
Higher Yields Required to Feed Rising Population
47
0,105,82
153,204,0
132,255,159
219,254,188
255,245,173
255,230,110
255,213,57
250,161,0
173,207,198
Charts follow this
colour scheme
0%
5%
10%
15%
20%
25%
30%
35% Название диаграммы Total Wheat Coarse Grains Rice
1,800
1,900
2,000
2,100
2,200
2,300
2,400
19
96
19
97
19
98
19
99
20
00
20
01
20
02
20
03
20
04
20
05
20
06
20
07
20
08
20
09
20
10
20
11
Production Utilization
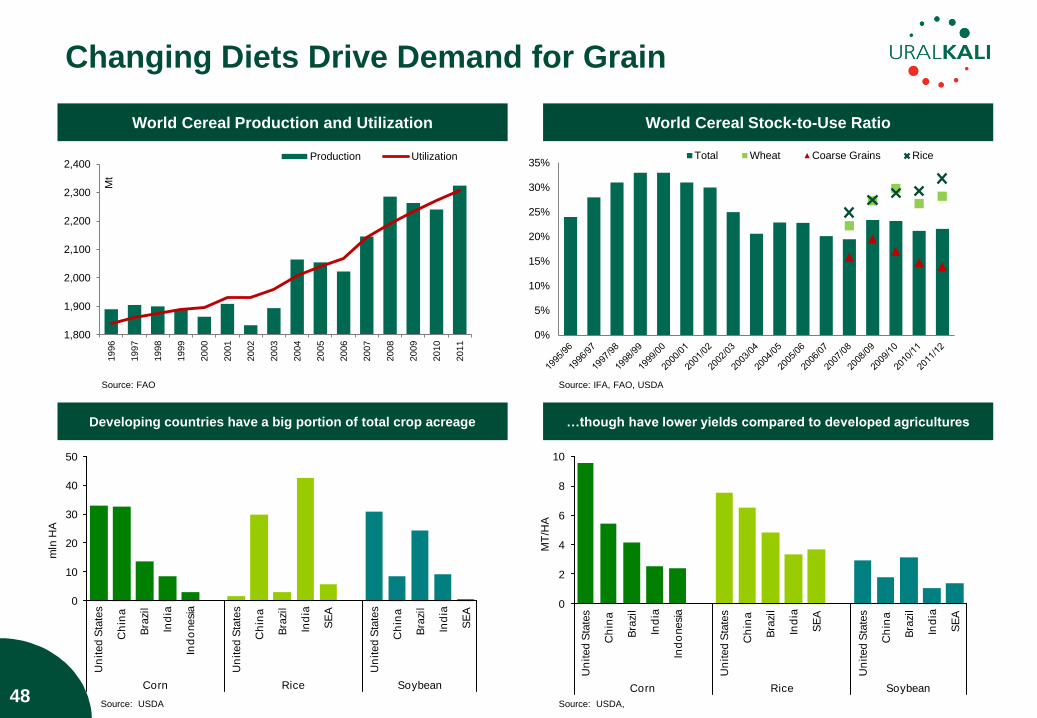
48
World Cereal Production and Utilization World Cereal Stock-to-Use Ratio
Developing countries have a big portion of total crop acreage …though have lower yields compared to developed agricultures
Source: FAO
Source: USDA,
Source: IFA, FAO, USDA
Mt
Source: USDA
Changing Diets Drive Demand for Grain
0
10
20
30
40
50
Un
ited
Sta
tes
Ch
ina
Bra
zil
Ind
ia
Ind
onesi
a
Un
ited
Sta
tes
Ch
ina
Bra
zil
Ind
ia
SE
A
Un
ited
Sta
tes
Ch
ina
Bra
zil
Ind
ia
SE
A
Corn Rice Soybean
mln
HA
0
2
4
6
8
10
Un
ited
Sta
tes
Ch
ina
Bra
zil
Ind
ia
Ind
onesi
a
Un
ited
Sta
tes
Ch
ina
Bra
zil
Ind
ia
SE
A
Un
ited
Sta
tes
Ch
ina
Bra
zil
Ind
ia
SE
A
Corn Rice Soybean
MT
/HA
0,105,82
153,204,0
132,255,159
219,254,188
255,245,173
255,230,110
255,213,57
250,161,0
173,207,198
Charts follow this
colour scheme
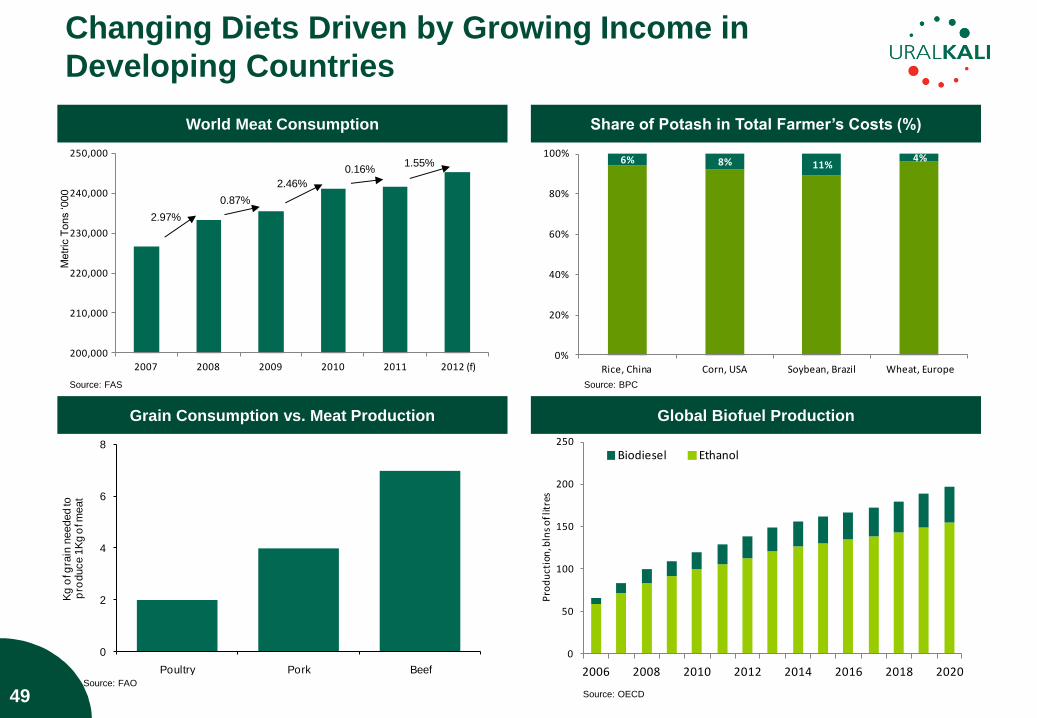
World Meat Consumption
Source: FAO
Source: OECD
Share of Potash in Total Farmer‟s Costs (%)
Grain Consumption vs. Meat Production
Source: BPC
49
Global Biofuel Production
0
2
4
6
8
Poultry Pork Beef
Kg
of g
rain
needed to
p
roduce 1
Kg o
f meat
Source: FAS
0
50
100
150
200
250
2006 2008 2010 2012 2014 2016 2018 2020
Biodiesel Ethanol
Pro
du
ctio
n, b
lns
of l
itre
s
200,000
210,000
220,000
230,000
240,000
250,000
2007 2008 2009 2010 2011 2012 (f)
2.97%
0.87%
2.46%
0.16%1.55%
Metr
ic T
ons „000
6% 8% 11%4%
0%
20%
40%
60%
80%
100%
Rice, China Corn, USA Soybean, Brazil Wheat, Europe
Changing Diets Driven by Growing Income in
Developing Countries
0,105,82
153,204,0
132,255,159
219,254,188
255,245,173
255,230,110
255,213,57
250,161,0
173,207,198
Charts follow this
colour scheme
50
Appendices
Business Model
Governance and Management Team
Potash Market Fundamentals
Operating Process
Awards and Achievements
0,105,82
153,204,0
132,255,159
219,254,188
255,245,173
255,230,110
255,213,57
250,161,0
173,207,198
Charts follow this
colour scheme
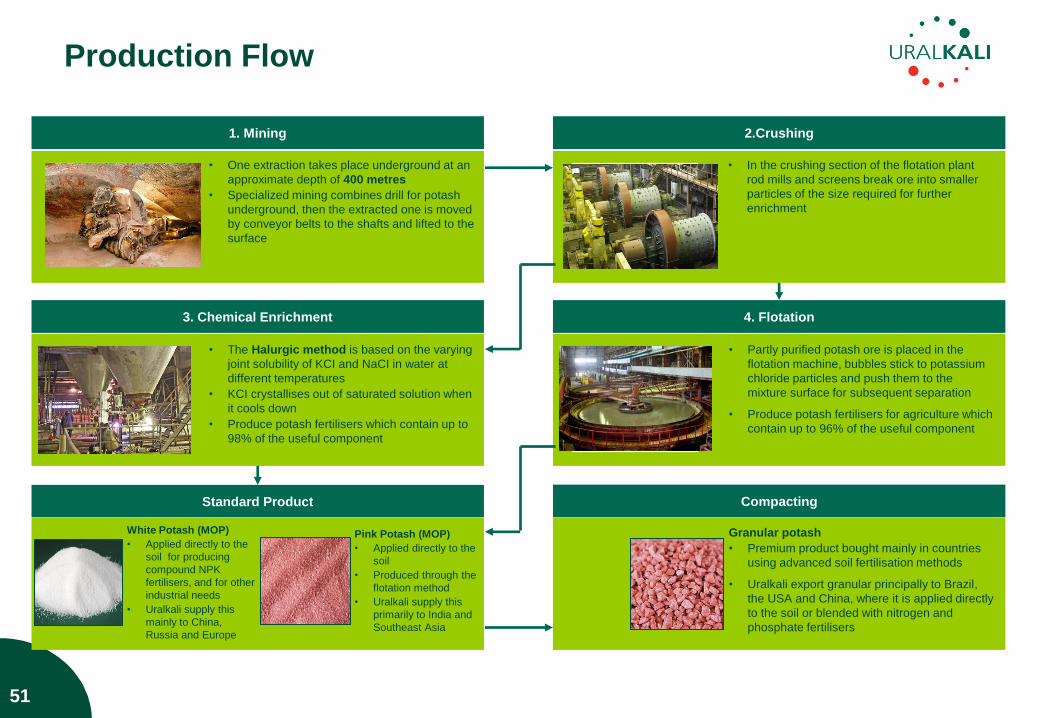
1. Mining 2.Crushing
3. Chemical Enrichment 4. Flotation
Standard Product Compacting
• One extraction takes place underground at an
approximate depth of 400 metres
• Specialized mining combines drill for potash
underground, then the extracted one is moved
by conveyor belts to the shafts and lifted to the
surface
• In the crushing section of the flotation plant
rod mills and screens break ore into smaller
particles of the size required for further
enrichment
• Partly purified potash ore is placed in the
flotation machine, bubbles stick to potassium
chloride particles and push them to the
mixture surface for subsequent separation
• Produce potash fertilisers for agriculture which
contain up to 96% of the useful component
Granular potash
• Premium product bought mainly in countries
using advanced soil fertilisation methods
• Uralkali export granular principally to Brazil,
the USA and China, where it is applied directly
to the soil or blended with nitrogen and
phosphate fertilisers
• The Halurgic method is based on the varying
joint solubility of KCI and NaCI in water at
different temperatures
• KCI crystallises out of saturated solution when
it cools down
• Produce potash fertilisers which contain up to
98% of the useful component
Pink Potash (MOP)
• Applied directly to the
soil
• Produced through the
flotation method
• Uralkali supply this
primarily to India and
Southeast Asia
White Potash (MOP)
• Applied directly to the
soil for producing
compound NPK
fertilisers, and for other
industrial needs
• Uralkali supply this
mainly to China,
Russia and Europe
51
Production Flow
0,105,82
153,204,0
132,255,159
219,254,188
255,245,173
255,230,110
255,213,57
250,161,0
173,207,198
Charts follow this
colour scheme
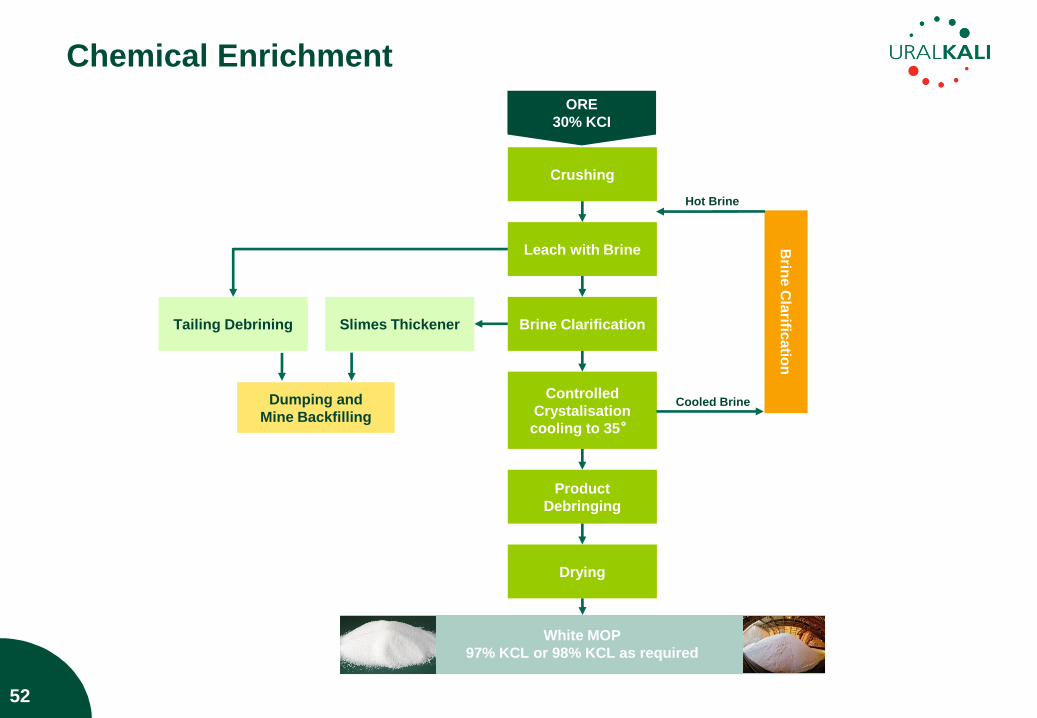
Crushing
ORE
30% KCI
Leach with Brine
Brine Clarification
Controlled
Crystalisation
cooling to 35〫
Product
Debringing
Drying
Slimes Thickener Tailing Debrining
Dumping and
Mine Backfilling
Brin
e C
larific
atio
n
White MOP
97% KCL or 98% KCL as required
Hot Brine
Cooled Brine
52
Chemical Enrichment
0,105,82
153,204,0
132,255,159
219,254,188
255,245,173
255,230,110
255,213,57
250,161,0
173,207,198
Charts follow this
colour scheme
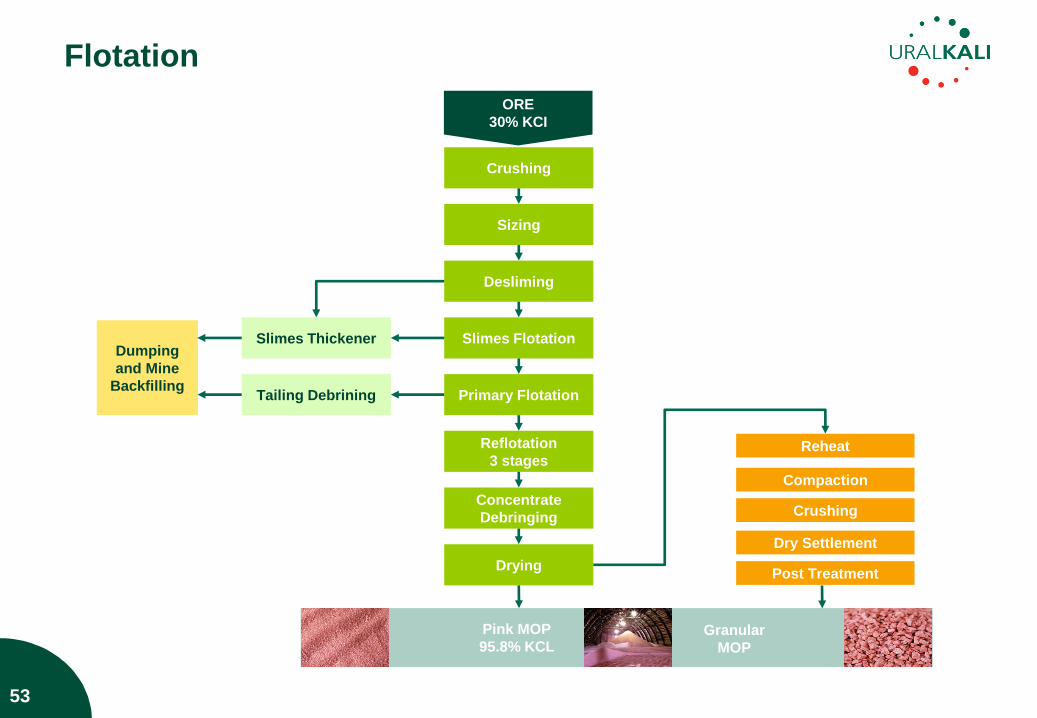
Crushing
ORE
30% KCI
Sizing
Desliming
Slimes Flotation
Primary Flotation
Reflotation
3 stages
Concentrate
Debringing
Drying
Slimes Thickener
Tailing Debrining
Dumping
and Mine
Backfilling
Compaction
Crushing
Dry Settlement
Post Treatment
Reheat
Pink MOP
95.8% KCL Granular
MOP
53
Flotation
0,105,82
153,204,0
132,255,159
219,254,188
255,245,173
255,230,110
255,213,57
250,161,0
173,207,198
Charts follow this
colour scheme
54
Appendices
Business Model
Governance and Management Team
Potash Market Fundamentals
Operating Process
Awards and Achievements
0,105,82
153,204,0
132,255,159
219,254,188
255,245,173
255,230,110
255,213,57
250,161,0
173,207,198
Charts follow this
colour scheme
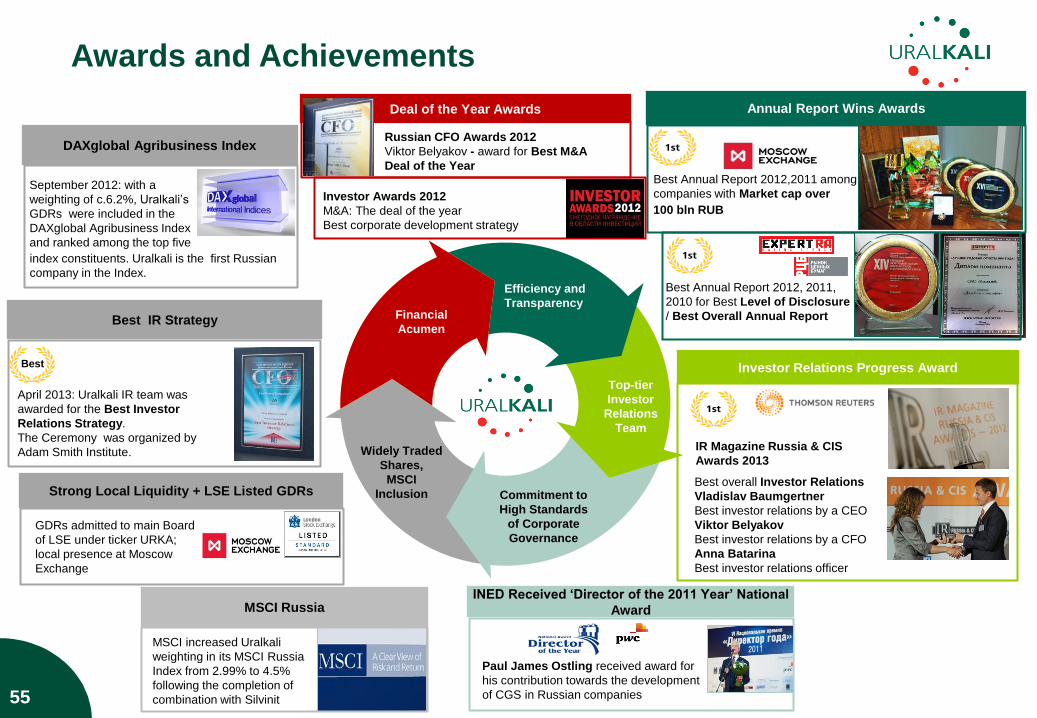
DAXglobal Agribusiness Index
Best Annual Report 2012, 2011,
2010 for Best Level of Disclosure
/ Best Overall Annual Report
Efficiency and
Transparency
Top-tier
Investor
Relations
Team
Widely Traded
Shares,
MSCI
Inclusion Commitment to
High Standards
of Corporate
Governance
Financial
Acumen
Investor Relations Progress Award
Strong Local Liquidity + LSE Listed GDRs
GDRs admitted to main Board
of LSE under ticker URKA;
local presence at Moscow
Exchange
Best IR Strategy
April 2013: Uralkali IR team was
awarded for the Best Investor
Relations Strategy.
The Ceremony was organized by
Adam Smith Institute.
Best
55
Annual Report Wins Awards
Best Annual Report 2012,2011 among
companies with Market cap over
100 bln RUB
MSCI Russia
MSCI increased Uralkali
weighting in its MSCI Russia
Index from 2.99% to 4.5%
following the completion of
combination with Silvinit
INED Received „Director of the 2011 Year‟ National
Award
Paul James Ostling received award for
his contribution towards the development
of CGS in Russian companies
Deal of the Year Awards
Russian CFO Awards 2012
Viktor Belyakov - award for Best M&A
Deal of the Year
Investor Awards 2012
M&A: The deal of the year
Best corporate development strategy
IR Magazine Russia & CIS
Awards 2013
Best overall Investor Relations
Vladislav Baumgertner
Best investor relations by a CEO
Viktor Belyakov
Best investor relations by a CFO
Anna Batarina
Best investor relations officer
Awards and Achievements
September 2012: with a
weighting of c.6.2%, Uralkali‟s
GDRs were included in the
DAXglobal Agribusiness Index
and ranked among the top five
index constituents. Uralkali is the first Russian
company in the Index.
0,105,82
153,204,0
132,255,159
219,254,188
255,245,173
255,230,110
255,213,57
250,161,0
173,207,198
Charts follow this
colour scheme
Thank you!
56
Anna Batarina, CFA, Head of Investor Relations and Capital Markets
Daria Fadeeva, Senior Investor Relations Manager
Uralkali
119034, Russia,
Moscow, Butikovsky lane, 7
Tel.: +7 (495) 730-2371
Fax: +7 (495) 730-2393
Web: www.uralkali.com
E-mail: [email protected]
For more information please contact Investor Relations Department: