Embed Size (px)
Citation preview
ISPRS Journal of Photogrammetry and Remote Sensing 79 (2013) 185–198
Contents lists available at SciVerse ScienceDirect
ISPRS Journal of Photogrammetry and Remote Sensing
journal homepage: www.elsevier .com/ locate/ isprs jprs
A laser scanning-based method for fast estimation of seismic-inducedbuilding deformations
Arianna Pesci a,⇑, Giordano Teza b, Elena Bonali c, Giuseppe Casula a, Enzo Boschi d
a Istituto Nazionale di Geofisica e Vulcanologia, Sezione di Bologna, via Donato Creti 12, I-40128 Bologna, Italyb Università di Padova, Dipartimento di Geoscienze, via Gradenigo 6, I-35131 Padova, Italyc Università di Bologna, Dipartimento di Architettura e Pianificazione Territoriale, viale Risorgimento 2, I-40136 Bologna, Italyd Università di Bologna, Dipartimento di Fisica, viale Pichat 8, I-40127 Bologna, Italy
a r t i c l e i n f o
Article history:Received 22 October 2012Received in revised form 27 February 2013Accepted 28 February 2013Available online xxxx
Keywords:ArchitectureChange detectionLaser scanningModelPerformance
0924-2716/$ - see front matter � 2013 Internationalhttp://dx.doi.org/10.1016/j.isprsjprs.2013.02.021
⇑ Corresponding author. Tel.: +39 0514151416; faxE-mail address: [email protected] (A. Pesci).
a b s t r a c t
Monitoring damaged buildings in an area where an earthquake has occurred requires the use of tech-niques which provide rapid and safe measurements even in emergency conditions. In particular, remotesensing techniques like terrestrial laser scanning (TLS) can satisfy these requirements, since they producevery dense point clouds in little time and also allow an accurate geometric modeling of observed build-ings. Nevertheless, strong constraints on TLS data acquisition geometry, such as acquisition distance andincidence angles, typically characterize an area in seismic emergency conditions. In order to correctlyinterpret the data, it is necessary to estimate errors affecting TLS measurements in these critical condi-tions. A reliable estimation can be achieved by means of experiments and numerical simulations aimedat quantifying a realistic noise level, with emphasis on reduction of artifacts due to data acquisition, reg-istration and modeling. This paper proposes a data analysis strategy in which TLS-based morphologicalmaps computed as point-to-primitive differences are created. The method can be easily used for accuratesurveying in emergency conditions. In order to demonstrate the proposed method in very diversesituations, it was applied to rapidly detect deformation traces in the San Giacomo Roncole Campanile(Modena), the Asinelli tower (Bologna) and the Cantalovo Church (Verona), three buildings damagedby the Mw 5.9 Emilia Romagna 2012 earthquake (Italy).� 2013 International Society for Photogrammetry and Remote Sensing, Inc. (ISPRS) Published by Elsevier
B.V. All rights reserved.
1. Introduction
A complete evaluation of the earthquake-induced damages to abuilding requires the integrated use of several techniques to assessthe geometric changes, as well as the material and structural dete-rioration. For example, laser scanning and digital photogrammetrycan be used to evaluate deformations and/or geometric changes(Pesci et al., 2011a; Yastikly, 2007); flat jack testing provides datarelative to material strength (Miranda et al., 2008); infrared ther-mography can detect moisture percolation or shallow materialdamage (Clark et al., 2003); experimental modal analysis (EMA)provides information about the structural health (Catbas et al.,2006). In some cases, numerical modeling provides the most valu-able description of a structure’s health (Gentile and Saisi, 2007).
Three principal difficulties often affect the evaluation ofearthquake-induced building damage. First of all, the number ofdamaged structures may be so high that the available human,financial and technical resources are insufficient for evaluating
Society for Photogrammetry and R
: +39 0514151498.
each building’s damage in detail. Secondly, access to the areaswhere the earthquake occurred can be very difficult and the mon-itoring of the buildings can be constrained by high hazard condi-tions, presence of rubble piles or other factors. For example,EMA, despite its importance, could be impossible to carry out.The third difficulty arises from the unavailability of reliable datarelated to the structure before the earthquake. These facts suggestthat remote sensing methodologies should be used instead.
Digital photogrammetry is a remote sensing technique cur-rently used in architectural surveying to illustrate the overallgeometry of a building and, in case of multitemporal observations,to describe potential changes (Grussenmeyer et al., 2002). Groundbased Interferometric Synthetic Aperture Radar (SAR) is anothertechnique used in architectural surveying. It allows the multitem-poral monitoring of a whole village affected by ground movement(see e.g. Pieraccini et al., 2006a). Moreover, it can be used to per-form a contactless EMA, leading to detection and estimation of atleast the lower order vibration modes of a building (Pieracciniet al., 2006b). This paper focuses on terrestrial laser scanning(TLS), which is currently used in architectural surveying thanksto its high accuracy and the considerable amount of information
emote Sensing, Inc. (ISPRS) Published by Elsevier B.V. All rights reserved.
186 A. Pesci et al. / ISPRS Journal of Photogrammetry and Remote Sensing 79 (2013) 185–198
it provides. This information allows the geometric characterizationof a structure (Pesci et al., 2011a), deformation evaluation frommulti-temporal analysis (Van Genechten et al., 2009), detectionof features related to restoration work and/or layout changeswhich have occurred over time (Murphy et al., 2009), modelingfor the object’s representation (Núñez Andrés and Buill Pozuelo,2009) and also generation of a reference geometry for numericalmodeling, in some cases with integration of multisensor data(Lubowiecka et al., 2009). An important advantage of this remotesensing technique is that contact with the investigated surface isunnecessary, since the targets for the data georeferencing can beplaced in convenient positions and not necessarily on the observedobject. If multi-temporal data are available, the correspondingmodels can be compared in order to detect changes.
This study proposes a TLS-based procedure aimed at solving,where possible, the above described difficulties. The proceduremaps the point cloud with respect to the expected shape and alsoproduces a corresponding significance map of the results, and thefinal outcome is a deformation map for each external wall of thebuilding. The procedure, from observation session planning to dataacquisition and processing, is conceived for rapid and practical useby personnel with basic competence in TLS-based measurements.In this way, several measurement teams can provide structuralengineers with reliable geometric data for result interpretation.
2. TLS experiments and validation
In this section some experiments based on real data acquisitionand synthetic data simulations are described in order to estimatethe modeling distortions related to TLS observations at high inci-dence angle and the detectable deformation magnitude as a func-tion of instrumental noise. The results of this study, in terms ofdata reliability and analysis, provide an insight into the resolution,precision and performance of TLS when studying buildings in a de-formed/damaged state.
2.1. High incidence observations and corresponding modelingdistortions
2.1.1. IssuesA typical issue related to TLS measurements in an area struck by
an earthquake is the existence of strong constraints in possibleviewpoints, which often prevent good acquisition protocol, in par-ticular affecting the normal incidence. In some cases, data of poten-tially damaged buildings must be gathered from a relatively fardistance (some hundreds of meters). In other cases, it is necessaryto perform measurements very close to the D/cos a building ofinterest, in areas closed in by debris for example, or to avoid haz-ardous nearby structures. In general, possible TLS viewpoints canbe relatively far from optimal conditions both in terms of acquisi-tion distance and incidence angle.
Continuous wave (CW) TLS instruments, which measure thephase difference between the transmitted and received signal inorder to calculate the target distance, are currently used in archi-tectural surveys thanks to their accuracy (5 mm at a 50 m distance)and acquisition rate (200–1000 kHz). Nevertheless, these instru-ments have a maximum range capacity of 100–120 m and some-times are unable to provide accurate results if the incidenceangle is very high, particularly in the case of relatively tall build-ings. Time-of-flight (TOF) instruments are slightly less accurateand have a much lower acquisition rate (2–20 kHz), but theirlonger range capacity (several hundred meters) makes them moresuitable for surveys in seismic emergency areas. In particular,signal strength allows the observation of physical surfaces evenin conditions of high incidence angles. The spot size linearly
increases with distance and the rangefinder unit (i.e. the unitwhich measures the distance) has a quasi-constant noise level, typ-ically 4–7 mm. All these facts suggest the use of a long range TLS insurveys aimed at evaluating the effects of an earthquake or otherdisruptive events. In addition, a high incidence angle leads to astrong spreading of the laser spot, since a circular spot with diam-eter D in normal incidence becomes an ellipse whose axes are Dand D/cos a, where a is the incidence angle. For example, a = 80�implies D/cos a � 6D.
Experiments were carried out in order to evaluate the actualspatial resolution of a TLS as a function of the sampling step inoptimal observation conditions (in particular, normal incidence).Pesci et al. (2011b), in particular, proposed a method intended toassess TLS spatial resolution. The method, which was tested on aspecific instrument (Optech ILRIS 3-D), may however be easily ex-tended to other TOF TLS instruments. A relevant problem isextending the results to general observation conditions, wherethe incidence angle a can reach high values. If the target materialis characterized by natural roughness and a long range instrumentis used, a quasi-Lambertian behavior is expected, leading to a rea-sonable fraction of backscattered signal even for a � 80
�(Pesci and
Teza, 2008; Franceschi et al., 2009). This may be the case of a his-torical masonry structure, where bricks typically have irregularsurfaces, due to weathering processes over time. On the contrary,a target characterized by strong forward scattering cannot be ob-served under a high incidence angle. Examples of structures thatcannot be acquired in these conditions are a steel–glass skyscraper,a façade covered by smooth marble, etc. An interesting fact is thatthe stability of radiometric data directly indicates that the acquiredsurface has enough roughness and macroscopic irregularity to al-low a fairly acceptable modeling for high incidence angles. In orderto have a reasonable accuracy and a good probability of backscat-tering, a 75� limit incidence angle is generally used in TLS practice.
The TLS data parsing software currently available corrects theintensity I with respect to distance, considering that I / d�2 for awide range of distance values d. If a quasi-Lambertian target is ob-served, the intensity decay can be easily modeled as a function of dand a, leading to a good parsing. If the target behavior is far fromthe Lambertian one, intensity depends on material roughness andthe target may appear to be darker than it actually is if an adequatecorrection is not performed (Kaasalainen et al., 2011). Reduction inthe backscattered power increases the probability that the return-ing pulse be below the detection threshold; in general, a targetcharacterized by low intensity is also subsampled with respect tothe remaining part of the observed object.
2.1.2. Solution by modeling of distortions due to incidence angleIn order to quantify and model possible distortions induced by
high incidence angles, an experiment was carried out near Ferrara(Italy). The 25-m high Tieni medieval tower was measured fromseveral viewpoints at different distances from the tower base.The instrument used was an Optech ILRIS 3D, characterized by2.5 kHz acquisition rate and 1.7 km maximum range, making it avery long range instrument (Optech, 2012). Let di be the distanceof the TLS viewpoint from the tower base for the ith scan. The val-ues chosen for di were 80 m, 60 m, 40 m, 20 m, 10 m and 5 m(Fig. 1). Six range-based point clouds were thus obtained. The sam-pling step on the target surface at the mean acquisition distancewas almost the same for each scan while the geometrical condi-tions in terms of incidence angle strongly varied.
All scans were aligned to the reference point cloud, i.e. the oneacquired from d1 = 80 m distance, by means of the standard proce-dure available in IMAlign module of PolyWorks software packagev. 10 (PolyWorks Surveyor in the latter versions, see Innovmetric(2012)). In order to assure that the alignments are free from possi-ble errors due to spot spreading, only points belonging to the lower
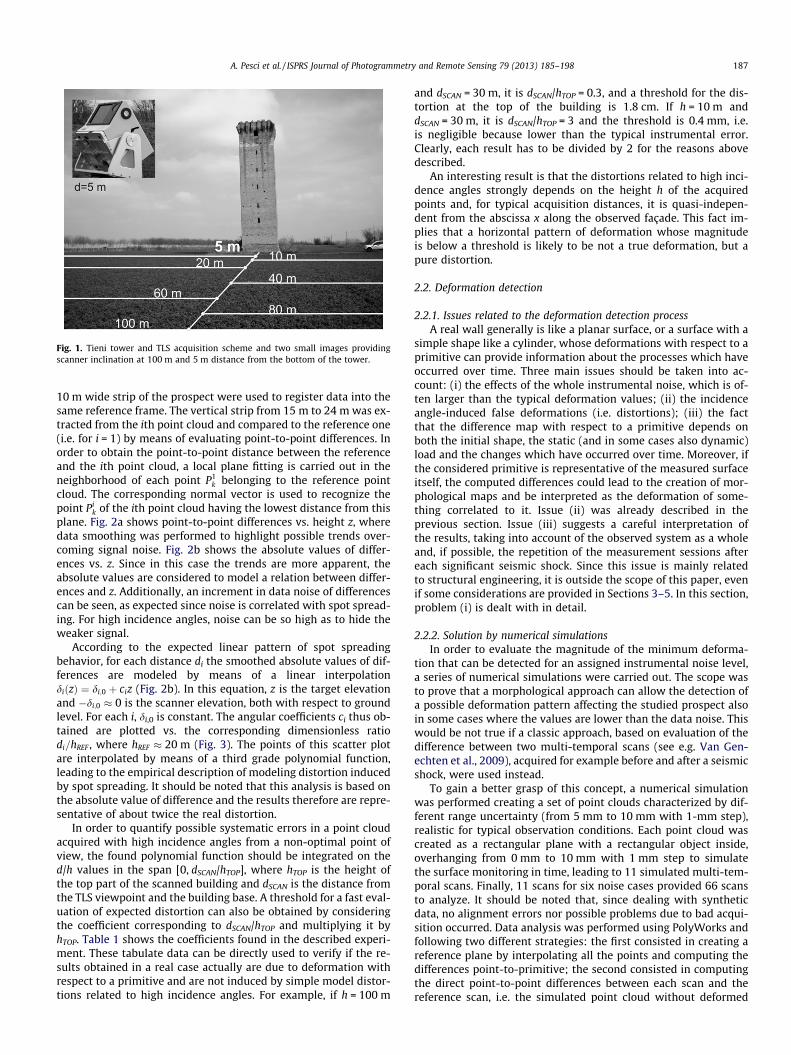
Fig. 1. Tieni tower and TLS acquisition scheme and two small images providingscanner inclination at 100 m and 5 m distance from the bottom of the tower.
A. Pesci et al. / ISPRS Journal of Photogrammetry and Remote Sensing 79 (2013) 185–198 187
10 m wide strip of the prospect were used to register data into thesame reference frame. The vertical strip from 15 m to 24 m was ex-tracted from the ith point cloud and compared to the reference one(i.e. for i = 1) by means of evaluating point-to-point differences. Inorder to obtain the point-to-point distance between the referenceand the ith point cloud, a local plane fitting is carried out in theneighborhood of each point P1
k belonging to the reference pointcloud. The corresponding normal vector is used to recognize thepoint Pi
k of the ith point cloud having the lowest distance from thisplane. Fig. 2a shows point-to-point differences vs. height z, wheredata smoothing was performed to highlight possible trends over-coming signal noise. Fig. 2b shows the absolute values of differ-ences vs. z. Since in this case the trends are more apparent, theabsolute values are considered to model a relation between differ-ences and z. Additionally, an increment in data noise of differencescan be seen, as expected since noise is correlated with spot spread-ing. For high incidence angles, noise can be so high as to hide theweaker signal.
According to the expected linear pattern of spot spreadingbehavior, for each distance di the smoothed absolute values of dif-ferences are modeled by means of a linear interpolationdiðzÞ ¼ di;0 þ ciz (Fig. 2b). In this equation, z is the target elevationand �di;0 � 0 is the scanner elevation, both with respect to groundlevel. For each i, di,0 is constant. The angular coefficients ci thus ob-tained are plotted vs. the corresponding dimensionless ratiodi=hREF , where hREF � 20 m (Fig. 3). The points of this scatter plotare interpolated by means of a third grade polynomial function,leading to the empirical description of modeling distortion inducedby spot spreading. It should be noted that this analysis is based onthe absolute value of difference and the results therefore are repre-sentative of about twice the real distortion.
In order to quantify possible systematic errors in a point cloudacquired with high incidence angles from a non-optimal point ofview, the found polynomial function should be integrated on thed/h values in the span [0, dSCAN/hTOP], where hTOP is the height ofthe top part of the scanned building and dSCAN is the distance fromthe TLS viewpoint and the building base. A threshold for a fast eval-uation of expected distortion can also be obtained by consideringthe coefficient corresponding to dSCAN/hTOP and multiplying it byhTOP. Table 1 shows the coefficients found in the described experi-ment. These tabulate data can be directly used to verify if the re-sults obtained in a real case actually are due to deformation withrespect to a primitive and are not induced by simple model distor-tions related to high incidence angles. For example, if h = 100 m
and dSCAN = 30 m, it is dSCAN/hTOP = 0.3, and a threshold for the dis-tortion at the top of the building is 1.8 cm. If h = 10 m anddSCAN = 30 m, it is dSCAN/hTOP = 3 and the threshold is 0.4 mm, i.e.is negligible because lower than the typical instrumental error.Clearly, each result has to be divided by 2 for the reasons abovedescribed.
An interesting result is that the distortions related to high inci-dence angles strongly depends on the height h of the acquiredpoints and, for typical acquisition distances, it is quasi-indepen-dent from the abscissa x along the observed façade. This fact im-plies that a horizontal pattern of deformation whose magnitudeis below a threshold is likely to be not a true deformation, but apure distortion.
2.2. Deformation detection
2.2.1. Issues related to the deformation detection processA real wall generally is like a planar surface, or a surface with a
simple shape like a cylinder, whose deformations with respect to aprimitive can provide information about the processes which haveoccurred over time. Three main issues should be taken into ac-count: (i) the effects of the whole instrumental noise, which is of-ten larger than the typical deformation values; (ii) the incidenceangle-induced false deformations (i.e. distortions); (iii) the factthat the difference map with respect to a primitive depends onboth the initial shape, the static (and in some cases also dynamic)load and the changes which have occurred over time. Moreover, ifthe considered primitive is representative of the measured surfaceitself, the computed differences could lead to the creation of mor-phological maps and be interpreted as the deformation of some-thing correlated to it. Issue (ii) was already described in theprevious section. Issue (iii) suggests a careful interpretation ofthe results, taking into account of the observed system as a wholeand, if possible, the repetition of the measurement sessions aftereach significant seismic shock. Since this issue is mainly relatedto structural engineering, it is outside the scope of this paper, evenif some considerations are provided in Sections 3–5. In this section,problem (i) is dealt with in detail.
2.2.2. Solution by numerical simulationsIn order to evaluate the magnitude of the minimum deforma-
tion that can be detected for an assigned instrumental noise level,a series of numerical simulations were carried out. The scope wasto prove that a morphological approach can allow the detection ofa possible deformation pattern affecting the studied prospect alsoin some cases where the values are lower than the data noise. Thiswould be not true if a classic approach, based on evaluation of thedifference between two multi-temporal scans (see e.g. Van Gen-echten et al., 2009), acquired for example before and after a seismicshock, were used instead.
To gain a better grasp of this concept, a numerical simulationwas performed creating a set of point clouds characterized by dif-ferent range uncertainty (from 5 mm to 10 mm with 1-mm step),realistic for typical observation conditions. Each point cloud wascreated as a rectangular plane with a rectangular object inside,overhanging from 0 mm to 10 mm with 1 mm step to simulatethe surface monitoring in time, leading to 11 simulated multi-tem-poral scans. Finally, 11 scans for six noise cases provided 66 scansto analyze. It should be noted that, since dealing with syntheticdata, no alignment errors nor possible problems due to bad acqui-sition occurred. Data analysis was performed using PolyWorks andfollowing two different strategies: the first consisted in creating areference plane by interpolating all the points and computing thedifferences point-to-primitive; the second consisted in computingthe direct point-to-point differences between each scan and thereference scan, i.e. the simulated point cloud without deformed
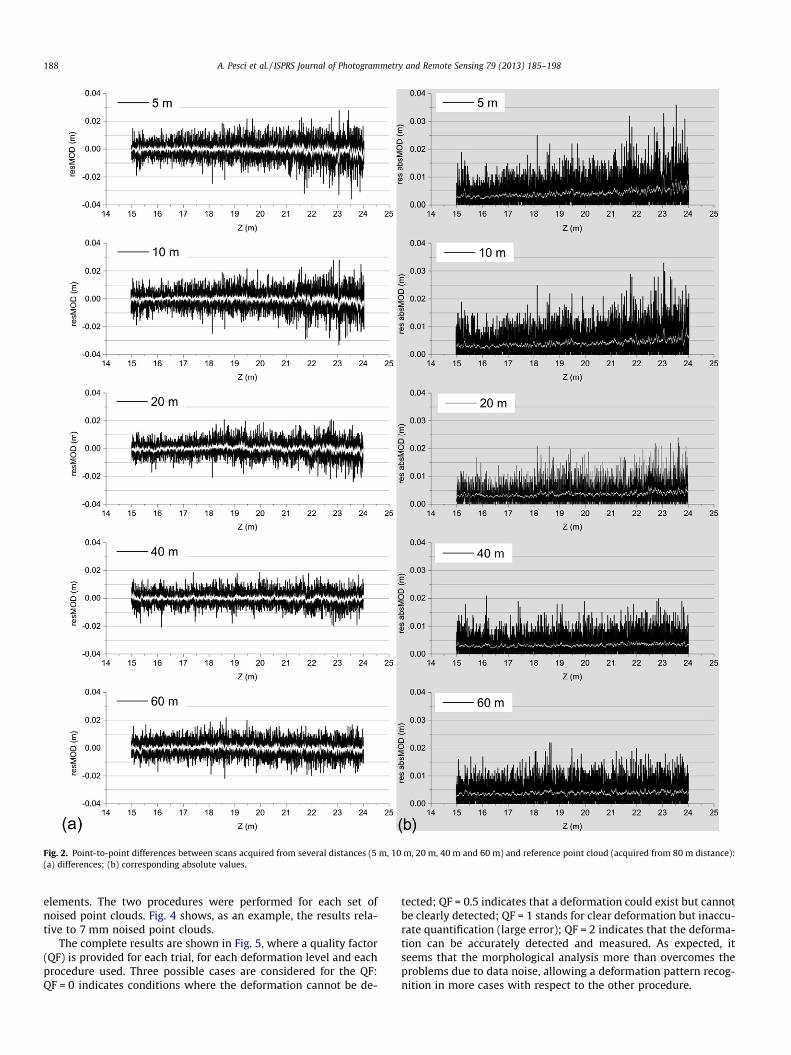
Fig. 2. Point-to-point differences between scans acquired from several distances (5 m, 10 m, 20 m, 40 m and 60 m) and reference point cloud (acquired from 80 m distance):(a) differences; (b) corresponding absolute values.
188 A. Pesci et al. / ISPRS Journal of Photogrammetry and Remote Sensing 79 (2013) 185–198
elements. The two procedures were performed for each set ofnoised point clouds. Fig. 4 shows, as an example, the results rela-tive to 7 mm noised point clouds.
The complete results are shown in Fig. 5, where a quality factor(QF) is provided for each trial, for each deformation level and eachprocedure used. Three possible cases are considered for the QF:QF = 0 indicates conditions where the deformation cannot be de-
tected; QF = 0.5 indicates that a deformation could exist but cannotbe clearly detected; QF = 1 stands for clear deformation but inaccu-rate quantification (large error); QF = 2 indicates that the deforma-tion can be accurately detected and measured. As expected, itseems that the morphological analysis more than overcomes theproblems due to data noise, allowing a deformation pattern recog-nition in more cases with respect to the other procedure.
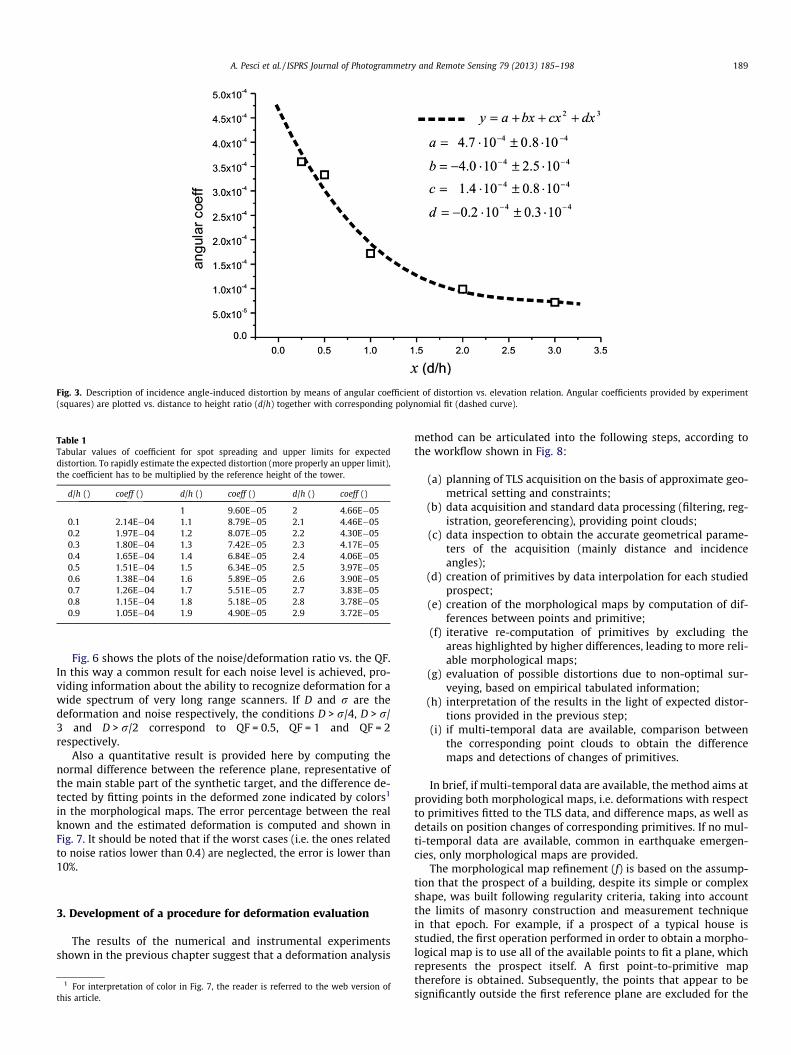
Fig. 3. Description of incidence angle-induced distortion by means of angular coefficient of distortion vs. elevation relation. Angular coefficients provided by experiment(squares) are plotted vs. distance to height ratio (d/h) together with corresponding polynomial fit (dashed curve).
Table 1Tabular values of coefficient for spot spreading and upper limits for expecteddistortion. To rapidly estimate the expected distortion (more properly an upper limit),the coefficient has to be multiplied by the reference height of the tower.
d/h () coeff () d/h () coeff () d/h () coeff ()
1 9.60E�05 2 4.66E�050.1 2.14E�04 1.1 8.79E�05 2.1 4.46E�050.2 1.97E�04 1.2 8.07E�05 2.2 4.30E�050.3 1.80E�04 1.3 7.42E�05 2.3 4.17E�050.4 1.65E�04 1.4 6.84E�05 2.4 4.06E�050.5 1.51E�04 1.5 6.34E�05 2.5 3.97E�050.6 1.38E�04 1.6 5.89E�05 2.6 3.90E�050.7 1.26E�04 1.7 5.51E�05 2.7 3.83E�050.8 1.15E�04 1.8 5.18E�05 2.8 3.78E�050.9 1.05E�04 1.9 4.90E�05 2.9 3.72E�05
A. Pesci et al. / ISPRS Journal of Photogrammetry and Remote Sensing 79 (2013) 185–198 189
Fig. 6 shows the plots of the noise/deformation ratio vs. the QF.In this way a common result for each noise level is achieved, pro-viding information about the ability to recognize deformation for awide spectrum of very long range scanners. If D and r are thedeformation and noise respectively, the conditions D > r/4, D > r/3 and D > r/2 correspond to QF = 0.5, QF = 1 and QF = 2respectively.
Also a quantitative result is provided here by computing thenormal difference between the reference plane, representative ofthe main stable part of the synthetic target, and the difference de-tected by fitting points in the deformed zone indicated by colors1
in the morphological maps. The error percentage between the realknown and the estimated deformation is computed and shown inFig. 7. It should be noted that if the worst cases (i.e. the ones relatedto noise ratios lower than 0.4) are neglected, the error is lower than10%.
3. Development of a procedure for deformation evaluation
The results of the numerical and instrumental experimentsshown in the previous chapter suggest that a deformation analysis
1 For interpretation of color in Fig. 7, the reader is referred to the web version ofthis article.
method can be articulated into the following steps, according tothe workflow shown in Fig. 8:
(a) planning of TLS acquisition on the basis of approximate geo-metrical setting and constraints;
(b) data acquisition and standard data processing (filtering, reg-istration, georeferencing), providing point clouds;
(c) data inspection to obtain the accurate geometrical parame-ters of the acquisition (mainly distance and incidenceangles);
(d) creation of primitives by data interpolation for each studiedprospect;
(e) creation of the morphological maps by computation of dif-ferences between points and primitive;
(f) iterative re-computation of primitives by excluding theareas highlighted by higher differences, leading to more reli-able morphological maps;
(g) evaluation of possible distortions due to non-optimal sur-veying, based on empirical tabulated information;
(h) interpretation of the results in the light of expected distor-tions provided in the previous step;
(i) if multi-temporal data are available, comparison betweenthe corresponding point clouds to obtain the differencemaps and detections of changes of primitives.
In brief, if multi-temporal data are available, the method aims atproviding both morphological maps, i.e. deformations with respectto primitives fitted to the TLS data, and difference maps, as well asdetails on position changes of corresponding primitives. If no mul-ti-temporal data are available, common in earthquake emergen-cies, only morphological maps are provided.
The morphological map refinement (f) is based on the assump-tion that the prospect of a building, despite its simple or complexshape, was built following regularity criteria, taking into accountthe limits of masonry construction and measurement techniquein that epoch. For example, if a prospect of a typical house isstudied, the first operation performed in order to obtain a morpho-logical map is to use all of the available points to fit a plane, whichrepresents the prospect itself. A first point-to-primitive maptherefore is obtained. Subsequently, the points that appear to besignificantly outside the first reference plane are excluded for the
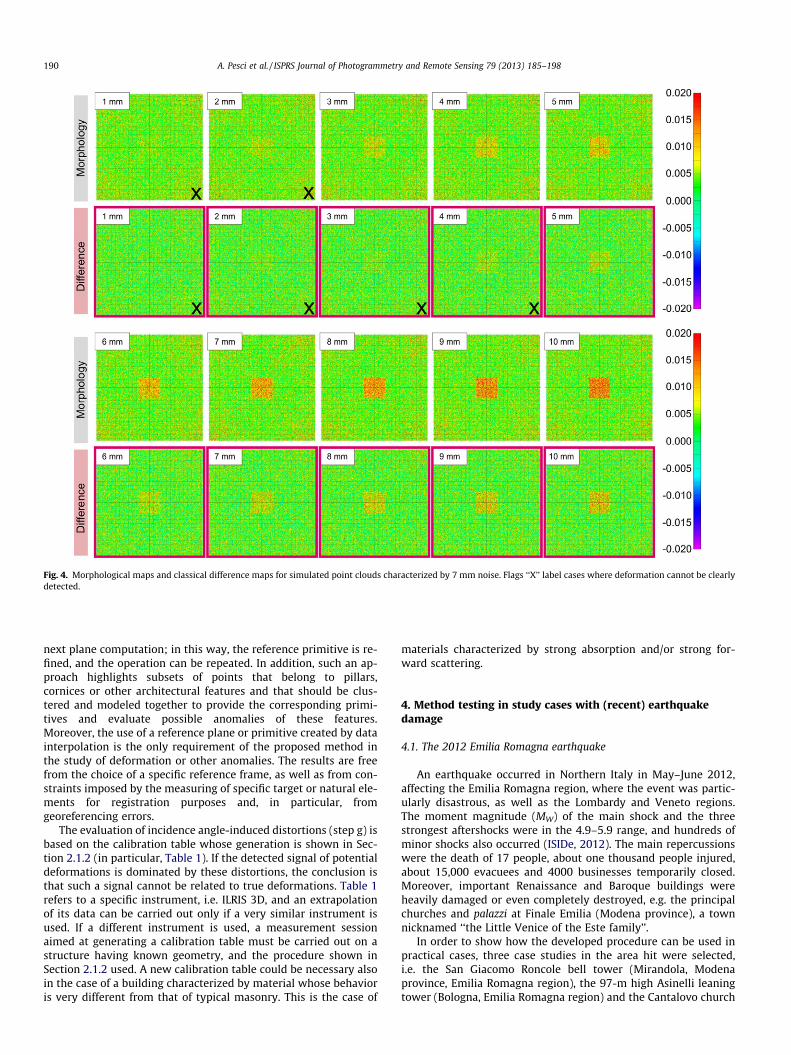
Fig. 4. Morphological maps and classical difference maps for simulated point clouds characterized by 7 mm noise. Flags ‘‘X’’ label cases where deformation cannot be clearlydetected.
190 A. Pesci et al. / ISPRS Journal of Photogrammetry and Remote Sensing 79 (2013) 185–198
next plane computation; in this way, the reference primitive is re-fined, and the operation can be repeated. In addition, such an ap-proach highlights subsets of points that belong to pillars,cornices or other architectural features and that should be clus-tered and modeled together to provide the corresponding primi-tives and evaluate possible anomalies of these features.Moreover, the use of a reference plane or primitive created by datainterpolation is the only requirement of the proposed method inthe study of deformation or other anomalies. The results are freefrom the choice of a specific reference frame, as well as from con-straints imposed by the measuring of specific target or natural ele-ments for registration purposes and, in particular, fromgeoreferencing errors.
The evaluation of incidence angle-induced distortions (step g) isbased on the calibration table whose generation is shown in Sec-tion 2.1.2 (in particular, Table 1). If the detected signal of potentialdeformations is dominated by these distortions, the conclusion isthat such a signal cannot be related to true deformations. Table 1refers to a specific instrument, i.e. ILRIS 3D, and an extrapolationof its data can be carried out only if a very similar instrument isused. If a different instrument is used, a measurement sessionaimed at generating a calibration table must be carried out on astructure having known geometry, and the procedure shown inSection 2.1.2 used. A new calibration table could be necessary alsoin the case of a building characterized by material whose behavioris very different from that of typical masonry. This is the case of
materials characterized by strong absorption and/or strong for-ward scattering.
4. Method testing in study cases with (recent) earthquakedamage
4.1. The 2012 Emilia Romagna earthquake
An earthquake occurred in Northern Italy in May–June 2012,affecting the Emilia Romagna region, where the event was partic-ularly disastrous, as well as the Lombardy and Veneto regions.The moment magnitude (MW) of the main shock and the threestrongest aftershocks were in the 4.9–5.9 range, and hundreds ofminor shocks also occurred (ISIDe, 2012). The main repercussionswere the death of 17 people, about one thousand people injured,about 15,000 evacuees and 4000 businesses temporarily closed.Moreover, important Renaissance and Baroque buildings wereheavily damaged or even completely destroyed, e.g. the principalchurches and palazzi at Finale Emilia (Modena province), a townnicknamed ‘‘the Little Venice of the Este family’’.
In order to show how the developed procedure can be used inpractical cases, three case studies in the area hit were selected,i.e. the San Giacomo Roncole bell tower (Mirandola, Modenaprovince, Emilia Romagna region), the 97-m high Asinelli leaningtower (Bologna, Emilia Romagna region) and the Cantalovo church
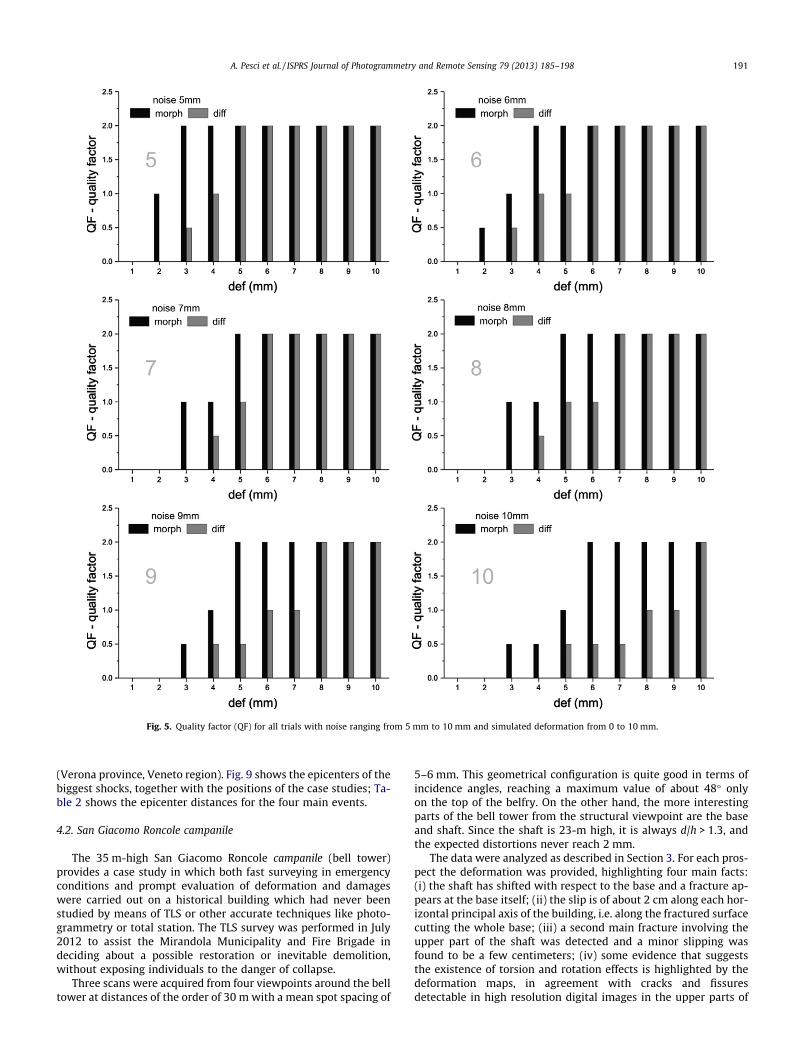
Fig. 5. Quality factor (QF) for all trials with noise ranging from 5 mm to 10 mm and simulated deformation from 0 to 10 mm.
A. Pesci et al. / ISPRS Journal of Photogrammetry and Remote Sensing 79 (2013) 185–198 191
(Verona province, Veneto region). Fig. 9 shows the epicenters of thebiggest shocks, together with the positions of the case studies; Ta-ble 2 shows the epicenter distances for the four main events.
4.2. San Giacomo Roncole campanile
The 35 m-high San Giacomo Roncole campanile (bell tower)provides a case study in which both fast surveying in emergencyconditions and prompt evaluation of deformation and damageswere carried out on a historical building which had never beenstudied by means of TLS or other accurate techniques like photo-grammetry or total station. The TLS survey was performed in July2012 to assist the Mirandola Municipality and Fire Brigade indeciding about a possible restoration or inevitable demolition,without exposing individuals to the danger of collapse.
Three scans were acquired from four viewpoints around the belltower at distances of the order of 30 m with a mean spot spacing of
5–6 mm. This geometrical configuration is quite good in terms ofincidence angles, reaching a maximum value of about 48� onlyon the top of the belfry. On the other hand, the more interestingparts of the bell tower from the structural viewpoint are the baseand shaft. Since the shaft is 23-m high, it is always d/h > 1.3, andthe expected distortions never reach 2 mm.
The data were analyzed as described in Section 3. For each pros-pect the deformation was provided, highlighting four main facts:(i) the shaft has shifted with respect to the base and a fracture ap-pears at the base itself; (ii) the slip is of about 2 cm along each hor-izontal principal axis of the building, i.e. along the fractured surfacecutting the whole base; (iii) a second main fracture involving theupper part of the shaft was detected and a minor slipping wasfound to be a few centimeters; (iv) some evidence that suggeststhe existence of torsion and rotation effects is highlighted by thedeformation maps, in agreement with cracks and fissuresdetectable in high resolution digital images in the upper parts of
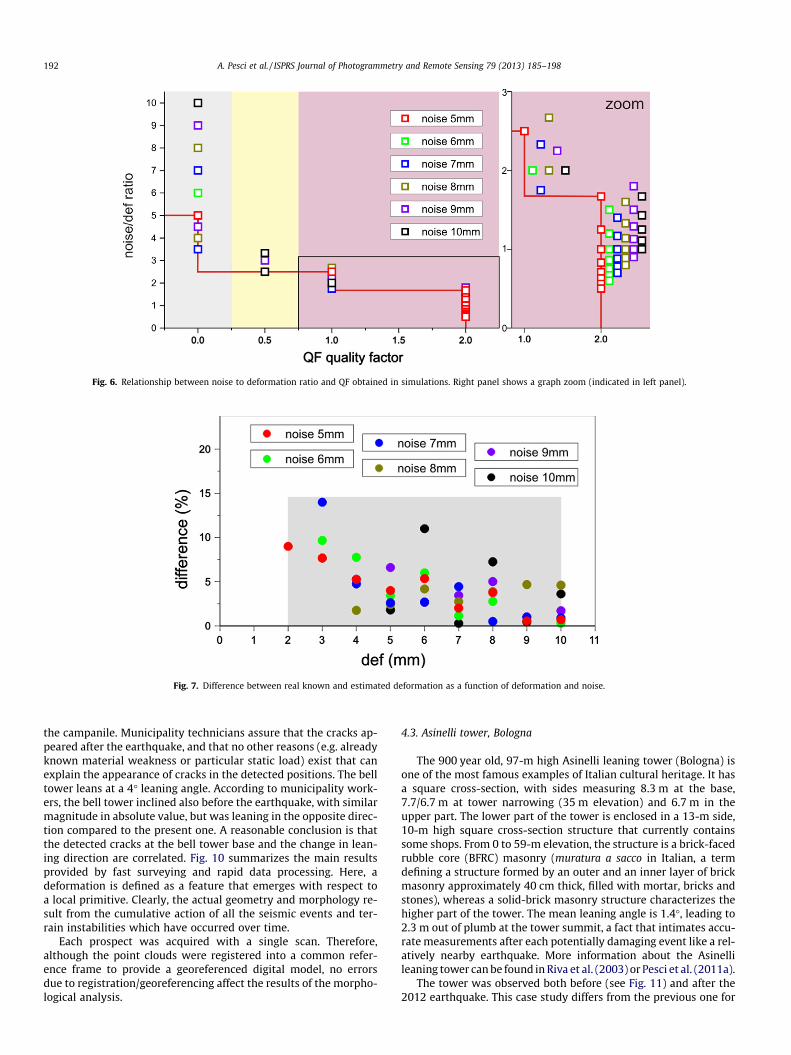
Fig. 6. Relationship between noise to deformation ratio and QF obtained in simulations. Right panel shows a graph zoom (indicated in left panel).
Fig. 7. Difference between real known and estimated deformation as a function of deformation and noise.
192 A. Pesci et al. / ISPRS Journal of Photogrammetry and Remote Sensing 79 (2013) 185–198
the campanile. Municipality technicians assure that the cracks ap-peared after the earthquake, and that no other reasons (e.g. alreadyknown material weakness or particular static load) exist that canexplain the appearance of cracks in the detected positions. The belltower leans at a 4� leaning angle. According to municipality work-ers, the bell tower inclined also before the earthquake, with similarmagnitude in absolute value, but was leaning in the opposite direc-tion compared to the present one. A reasonable conclusion is thatthe detected cracks at the bell tower base and the change in lean-ing direction are correlated. Fig. 10 summarizes the main resultsprovided by fast surveying and rapid data processing. Here, adeformation is defined as a feature that emerges with respect toa local primitive. Clearly, the actual geometry and morphology re-sult from the cumulative action of all the seismic events and ter-rain instabilities which have occurred over time.
Each prospect was acquired with a single scan. Therefore,although the point clouds were registered into a common refer-ence frame to provide a georeferenced digital model, no errorsdue to registration/georeferencing affect the results of the morpho-logical analysis.
4.3. Asinelli tower, Bologna
The 900 year old, 97-m high Asinelli leaning tower (Bologna) isone of the most famous examples of Italian cultural heritage. It hasa square cross-section, with sides measuring 8.3 m at the base,7.7/6.7 m at tower narrowing (35 m elevation) and 6.7 m in theupper part. The lower part of the tower is enclosed in a 13-m side,10-m high square cross-section structure that currently containssome shops. From 0 to 59-m elevation, the structure is a brick-facedrubble core (BFRC) masonry (muratura a sacco in Italian, a termdefining a structure formed by an outer and an inner layer of brickmasonry approximately 40 cm thick, filled with mortar, bricks andstones), whereas a solid-brick masonry structure characterizes thehigher part of the tower. The mean leaning angle is 1.4�, leading to2.3 m out of plumb at the tower summit, a fact that intimates accu-rate measurements after each potentially damaging event like a rel-atively nearby earthquake. More information about the Asinellileaning tower can be found in Riva et al. (2003) or Pesci et al. (2011a).
The tower was observed both before (see Fig. 11) and after the2012 earthquake. This case study differs from the previous one for
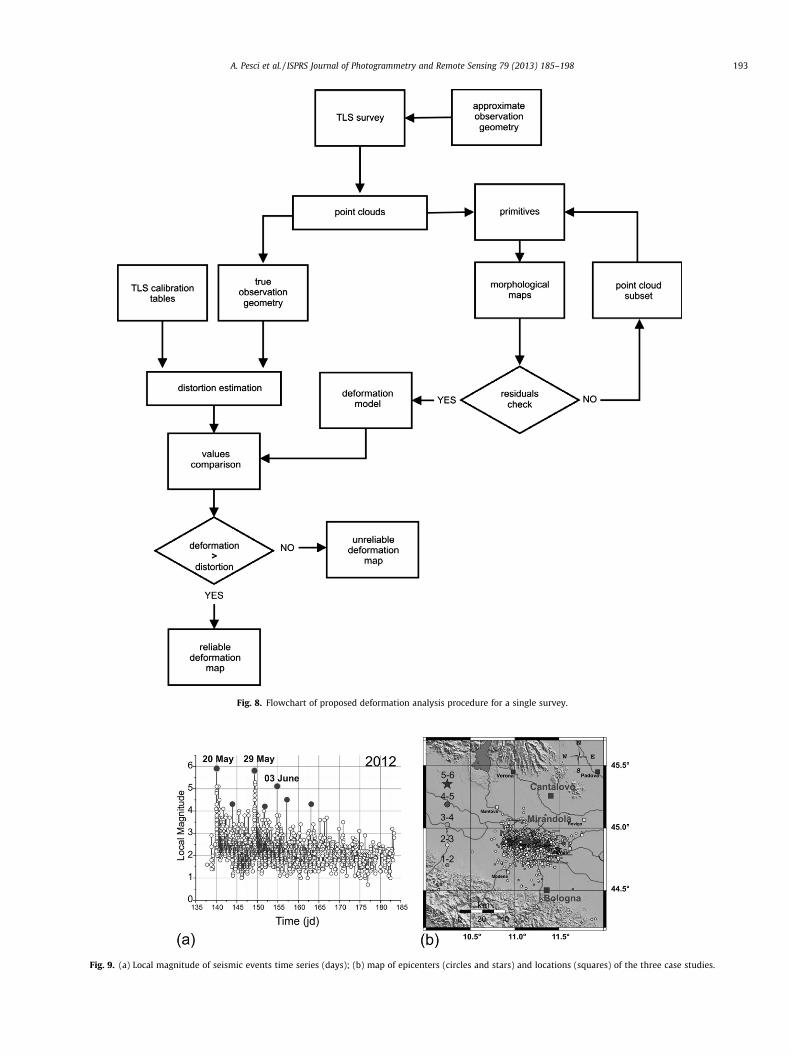
Fig. 8. Flowchart of proposed deformation analysis procedure for a single survey.
Fig. 9. (a) Local magnitude of seismic events time series (days); (b) map of epicenters (circles and stars) and locations (squares) of the three case studies.
A. Pesci et al. / ISPRS Journal of Photogrammetry and Remote Sensing 79 (2013) 185–198 193
Table 2Epicenter distance (in km) from the case studies for the four main shocks.
Date (CESTa) Earthquake shock
Bondeno (Modena) Vigarano Mainarda (Ferrara) San Felice sul Panaro (Modena), Novi di Modena (Modena)May 20, 2012 04.03 May 20, 2012 15.18 May 29, 2012 09.00 June 3, 2012 21.21
Mw, depth (km) 5.9, 6.3 5.0, 4.7 5.8, 6.3 4.9, 4.9
San Giacomo Roncole 30 37 30 8Bologna 47 43 43 58Cantalovo 53 60 60 60
a CEST states for Central European Summer Time, i.e. GMT + 2 h, where GMT is the Greenwich Mean Time, or Coordinated Universal Time (UTC).
194 A. Pesci et al. / ISPRS Journal of Photogrammetry and Remote Sensing 79 (2013) 185–198
two reasons: both pre- and post-earthquake data exist, and the high-er part of the tower was acquired with very high incidence angles.
In 2012 the tower was measured after each of the three mainseismic shocks. The measurement campaigns were performedabout 12–24 h after the corresponding event. Data were acquiredfrom the same points assuring the same geometrical conditionsof repeated scans in terms of acquisition distances, incidence an-gles and sampling steps. The mean scanner-tower base (30 m, with7–8 mm mean sampling step) led to an induced distortion for highincidence angles (upper limit) of about 1.6 cm, with respect to theground, at the tower top (90 m).
Fig. 12 shows two series of results for the tower south prospect.The first one consists of three independent deformation maps,computed as point-to-fit plane distance and after each seismicevent (morphological approach, see Sections 2.2.2 and 3). In eachcase the primitive plane was obtained by interpolating the pointcloud in the elevation range from 35 m to 60 m to reduce the effectof points affected by distortion. Each plane was used as referenceprimitive for the whole tower (the part of the tower below 35-melevation was not acquired because of scaffoldings related to resto-ration works). Like in the case of San Giacomo Roncole bell tower,each prospect was acquired by means of a single scan. No registra-tion/georeferencing errors therefore affect the results. Moreover,the information provided by previous studies suggested that theupper part of the tower was mainly characterized by deformationrelated to seismicity (Riva et al., 2003). The second series of results(Fig. 12b) is the point-to-point maps which result from the com-parison of each scan to the previous one (classic approach). Theavailability of TLS measurements before the seismic sequence pro-vided detailed knowledge of the tower’s shape and its deformedstate, useful whichever approach is used.
The multi-temporal deformation maps show that the highestpart (i.e. for elevation greater than 75 m) of the south face of thetower, characterized by a curved shape only (Pesci et al., 2011a),was flexed during the seismic sequence and returned to about itsoriginal setting after the last strong event. In particular, it can benoted that each deformation map shows significant values (5–10 cm range) if compared to the upper limit of the expected inci-dence angle-related distortion, i.e. 1.6 cm.
Similar results are still visible if the point clouds are analyzedby means of point cloud alignment and point-to-point comparison.Nevertheless, a weak signal of occurred differences exists and canbe seen as positive or negative differences, but the nose is high andthe quantitative analysis of difference is difficult, preventing a cleardata interpretation. The main results of the difference-based ap-proach are the confirmation that the signals detected by morpho-logical approach truly are deformations and not distortions dueto data acquisition geometry, and that no change in the globalleaning angle occurred (Fig. 12b).
4.4. Cantalovo church
The Cantalovo church (Verona province) is a very interestingPaleo-Christian church already existing in 950 AD, as an ancient
document in the Ecclesiastic Archive reveals. An earthquake oc-curred on 3 January 1117, causing extensive damage in a large por-tion of the Adige valley (i.e. Lombardy, Veneto and other regions).The church was also damaged and, after restoration, was a place ofworship with a large congregation. In the XVIII century the churchhad some structural problems that required the demolition of itsbell tower, and in 1919 extensive restoration work was carried out.
Since each wall, as well as the apse, shows some cracks, thehealth state of the church must be monitored. For this reason,the church was surveyed by means of TLS in 2011, before the Emil-ia Romagna earthquake. A second observation was carried out inJune 2012, after the main seismic events with MW P 5:0. The meandistance between the instrument and the acquired target was 20–30 m, with a 6–7 mm sampling step. The correction of incidence-angle induced distortions therefore was unnecessary.
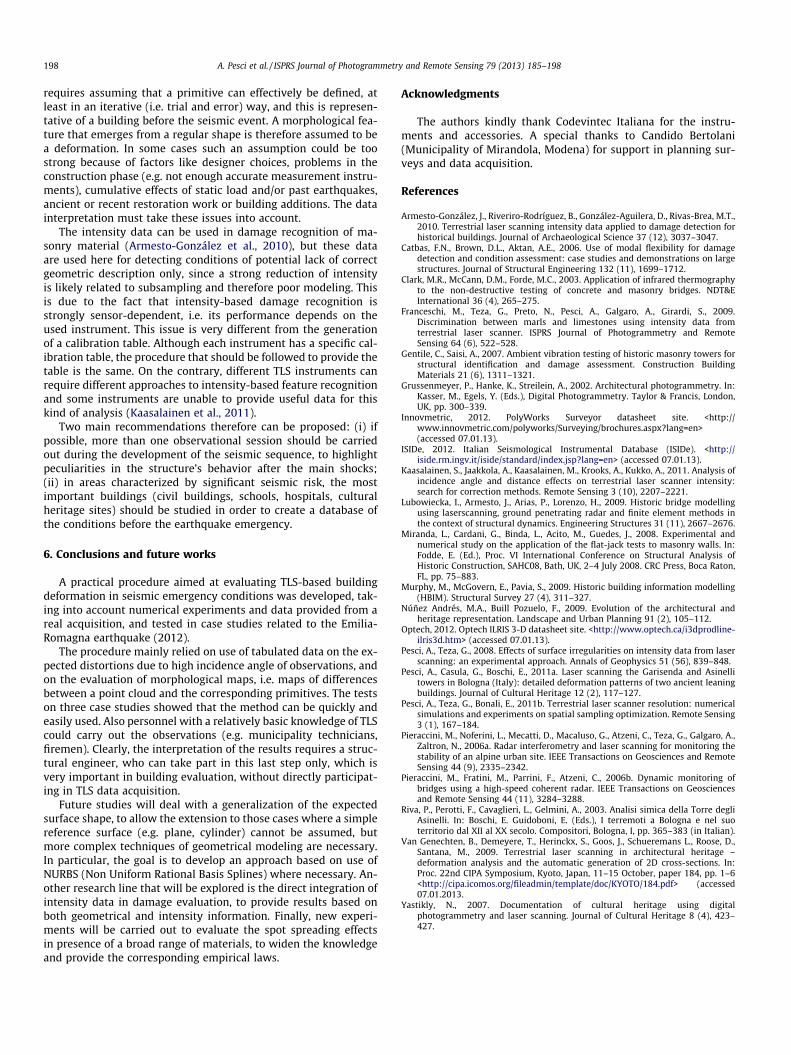
The apse point cloud was obtained by registration into the samereference frame of the partial point clouds taken from three differ-ent viewpoints chosen in order to have low enough incidence an-gles. Thanks to the large overlap areas between adjacent partialscans, the registration error is smaller (�1 mm) than observationaldata precision (�1 cm) and therefore is negligible. Data analyseswere performed with the two already seen procedures. A cylin-der-shaped primitive was fitted to the observational data to de-scribe the apse morphology (Fig. 13). The maps obtained from2011 and 2012 data are similar, but the latter shows a more accen-tuated deformation, as highlighted by the contour lines shown inFig. 13d. These contour lines indicate the borders between areasof positive and negative difference with respect to the primitive.The cylinder parameters (radius and axis position) did not signifi-cantly change before and after the earthquake. On the contrary, noclear results are achievable from the direct comparison of (aligned)point clouds.
5. Discussion
Although real cases of buildings damaged by the Emilia Romag-na earthquake were studied by means of the developed analysismethod, the discussion only deals with the validity of this method,regardless the kind and size of the detected damages. In otherwords, the potentialities and limits of the evaluation of differencesbetween the observed surface and the expected, regular surface asa damage descriptor are discussed. Moreover, the typical con-straints that can occur in an area struck by an earthquake are takeninto account. The structural implications of the results, and in par-ticular the decisions that must be made to solve possible high haz-ard conditions, are outside the scope of this paper and therefore arenot discussed here.
The experiments described in Section 2 show that the observa-tion of an object at high incidence angles leads to distortions thatmust be quantified and taken into account before evaluating anydeformations and/or displacements. In particular, an empiricalcorrection table can be obtained (Table 1) and used to processand analyze the data. The Asinelli tower is a typical case of astructure whose higher part must be observed at a high incidence
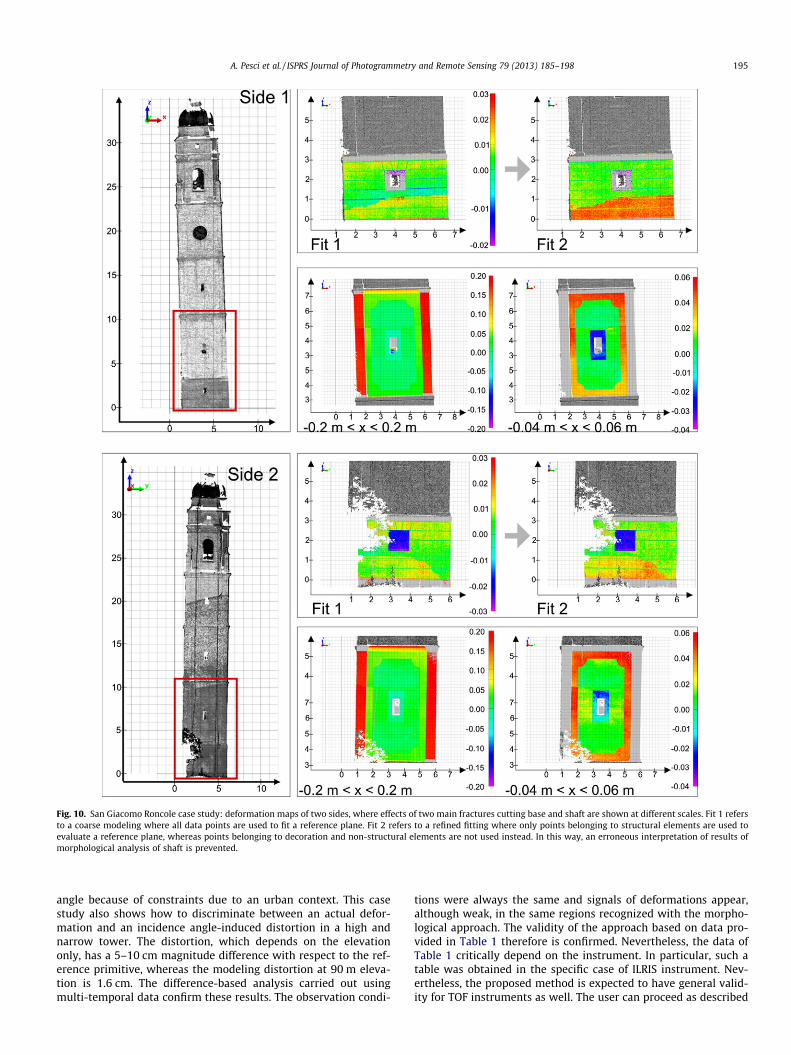
Fig. 10. San Giacomo Roncole case study: deformation maps of two sides, where effects of two main fractures cutting base and shaft are shown at different scales. Fit 1 refersto a coarse modeling where all data points are used to fit a reference plane. Fit 2 refers to a refined fitting where only points belonging to structural elements are used toevaluate a reference plane, whereas points belonging to decoration and non-structural elements are not used instead. In this way, an erroneous interpretation of results ofmorphological analysis of shaft is prevented.
A. Pesci et al. / ISPRS Journal of Photogrammetry and Remote Sensing 79 (2013) 185–198 195
angle because of constraints due to an urban context. This casestudy also shows how to discriminate between an actual defor-mation and an incidence angle-induced distortion in a high andnarrow tower. The distortion, which depends on the elevationonly, has a 5–10 cm magnitude difference with respect to the ref-erence primitive, whereas the modeling distortion at 90 m eleva-tion is 1.6 cm. The difference-based analysis carried out usingmulti-temporal data confirm these results. The observation condi-
tions were always the same and signals of deformations appear,although weak, in the same regions recognized with the morpho-logical approach. The validity of the approach based on data pro-vided in Table 1 therefore is confirmed. Nevertheless, the data ofTable 1 critically depend on the instrument. In particular, such atable was obtained in the specific case of ILRIS instrument. Nev-ertheless, the proposed method is expected to have general valid-ity for TOF instruments as well. The user can proceed as described
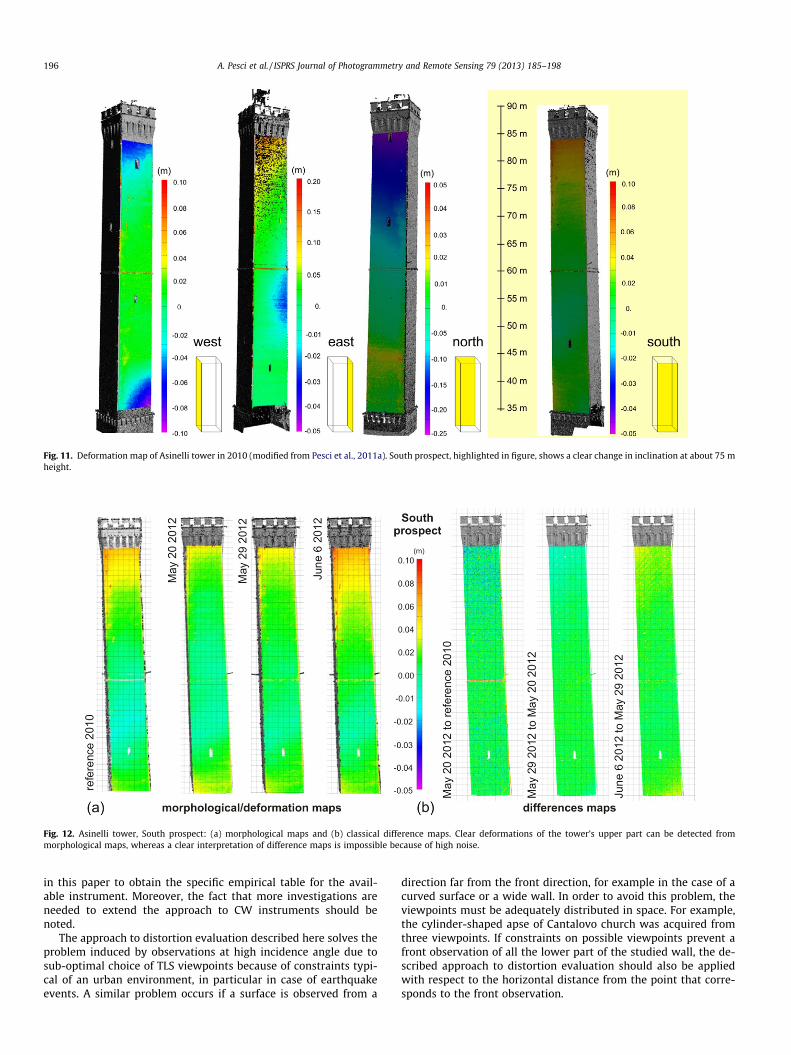
Fig. 11. Deformation map of Asinelli tower in 2010 (modified from Pesci et al., 2011a). South prospect, highlighted in figure, shows a clear change in inclination at about 75 mheight.
Fig. 12. Asinelli tower, South prospect: (a) morphological maps and (b) classical difference maps. Clear deformations of the tower’s upper part can be detected frommorphological maps, whereas a clear interpretation of difference maps is impossible because of high noise.
196 A. Pesci et al. / ISPRS Journal of Photogrammetry and Remote Sensing 79 (2013) 185–198
in this paper to obtain the specific empirical table for the avail-able instrument. Moreover, the fact that more investigations areneeded to extend the approach to CW instruments should benoted.
The approach to distortion evaluation described here solves theproblem induced by observations at high incidence angle due tosub-optimal choice of TLS viewpoints because of constraints typi-cal of an urban environment, in particular in case of earthquakeevents. A similar problem occurs if a surface is observed from a
direction far from the front direction, for example in the case of acurved surface or a wide wall. In order to avoid this problem, theviewpoints must be adequately distributed in space. For example,the cylinder-shaped apse of Cantalovo church was acquired fromthree viewpoints. If constraints on possible viewpoints prevent afront observation of all the lower part of the studied wall, the de-scribed approach to distortion evaluation should also be appliedwith respect to the horizontal distance from the point that corre-sponds to the front observation.
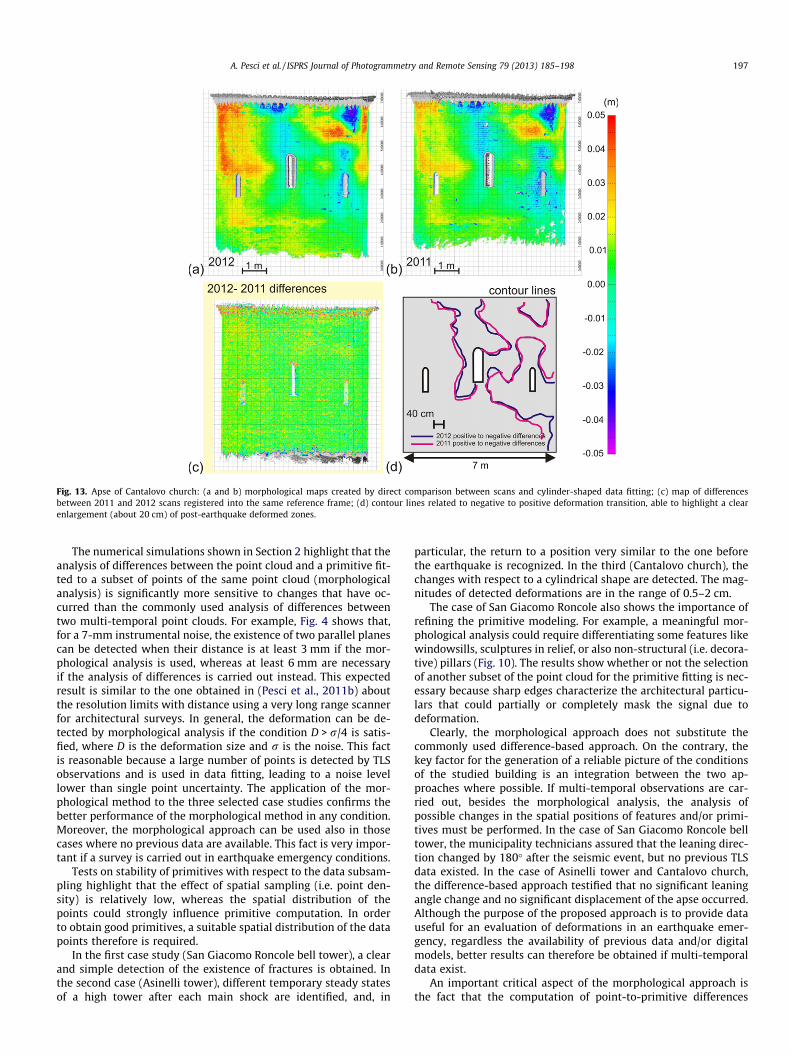
Fig. 13. Apse of Cantalovo church: (a and b) morphological maps created by direct comparison between scans and cylinder-shaped data fitting; (c) map of differencesbetween 2011 and 2012 scans registered into the same reference frame; (d) contour lines related to negative to positive deformation transition, able to highlight a clearenlargement (about 20 cm) of post-earthquake deformed zones.
A. Pesci et al. / ISPRS Journal of Photogrammetry and Remote Sensing 79 (2013) 185–198 197
The numerical simulations shown in Section 2 highlight that theanalysis of differences between the point cloud and a primitive fit-ted to a subset of points of the same point cloud (morphologicalanalysis) is significantly more sensitive to changes that have oc-curred than the commonly used analysis of differences betweentwo multi-temporal point clouds. For example, Fig. 4 shows that,for a 7-mm instrumental noise, the existence of two parallel planescan be detected when their distance is at least 3 mm if the mor-phological analysis is used, whereas at least 6 mm are necessaryif the analysis of differences is carried out instead. This expectedresult is similar to the one obtained in (Pesci et al., 2011b) aboutthe resolution limits with distance using a very long range scannerfor architectural surveys. In general, the deformation can be de-tected by morphological analysis if the condition D > r/4 is satis-fied, where D is the deformation size and r is the noise. This factis reasonable because a large number of points is detected by TLSobservations and is used in data fitting, leading to a noise levellower than single point uncertainty. The application of the mor-phological method to the three selected case studies confirms thebetter performance of the morphological method in any condition.Moreover, the morphological approach can be used also in thosecases where no previous data are available. This fact is very impor-tant if a survey is carried out in earthquake emergency conditions.
Tests on stability of primitives with respect to the data subsam-pling highlight that the effect of spatial sampling (i.e. point den-sity) is relatively low, whereas the spatial distribution of thepoints could strongly influence primitive computation. In orderto obtain good primitives, a suitable spatial distribution of the datapoints therefore is required.
In the first case study (San Giacomo Roncole bell tower), a clearand simple detection of the existence of fractures is obtained. Inthe second case (Asinelli tower), different temporary steady statesof a high tower after each main shock are identified, and, in
particular, the return to a position very similar to the one beforethe earthquake is recognized. In the third (Cantalovo church), thechanges with respect to a cylindrical shape are detected. The mag-nitudes of detected deformations are in the range of 0.5–2 cm.
The case of San Giacomo Roncole also shows the importance ofrefining the primitive modeling. For example, a meaningful mor-phological analysis could require differentiating some features likewindowsills, sculptures in relief, or also non-structural (i.e. decora-tive) pillars (Fig. 10). The results show whether or not the selectionof another subset of the point cloud for the primitive fitting is nec-essary because sharp edges characterize the architectural particu-lars that could partially or completely mask the signal due todeformation.
Clearly, the morphological approach does not substitute thecommonly used difference-based approach. On the contrary, thekey factor for the generation of a reliable picture of the conditionsof the studied building is an integration between the two ap-proaches where possible. If multi-temporal observations are car-ried out, besides the morphological analysis, the analysis ofpossible changes in the spatial positions of features and/or primi-tives must be performed. In the case of San Giacomo Roncole belltower, the municipality technicians assured that the leaning direc-tion changed by 180� after the seismic event, but no previous TLSdata existed. In the case of Asinelli tower and Cantalovo church,the difference-based approach testified that no significant leaningangle change and no significant displacement of the apse occurred.Although the purpose of the proposed approach is to provide datauseful for an evaluation of deformations in an earthquake emer-gency, regardless the availability of previous data and/or digitalmodels, better results can therefore be obtained if multi-temporaldata exist.
An important critical aspect of the morphological approach isthe fact that the computation of point-to-primitive differences
198 A. Pesci et al. / ISPRS Journal of Photogrammetry and Remote Sensing 79 (2013) 185–198
requires assuming that a primitive can effectively be defined, atleast in an iterative (i.e. trial and error) way, and this is represen-tative of a building before the seismic event. A morphological fea-ture that emerges from a regular shape is therefore assumed to bea deformation. In some cases such an assumption could be toostrong because of factors like designer choices, problems in theconstruction phase (e.g. not enough accurate measurement instru-ments), cumulative effects of static load and/or past earthquakes,ancient or recent restoration work or building additions. The datainterpretation must take these issues into account.
The intensity data can be used in damage recognition of ma-sonry material (Armesto-González et al., 2010), but these dataare used here for detecting conditions of potential lack of correctgeometric description only, since a strong reduction of intensityis likely related to subsampling and therefore poor modeling. Thisis due to the fact that intensity-based damage recognition isstrongly sensor-dependent, i.e. its performance depends on theused instrument. This issue is very different from the generationof a calibration table. Although each instrument has a specific cal-ibration table, the procedure that should be followed to provide thetable is the same. On the contrary, different TLS instruments canrequire different approaches to intensity-based feature recognitionand some instruments are unable to provide useful data for thiskind of analysis (Kaasalainen et al., 2011).
Two main recommendations therefore can be proposed: (i) ifpossible, more than one observational session should be carriedout during the development of the seismic sequence, to highlightpeculiarities in the structure’s behavior after the main shocks;(ii) in areas characterized by significant seismic risk, the mostimportant buildings (civil buildings, schools, hospitals, culturalheritage sites) should be studied in order to create a database ofthe conditions before the earthquake emergency.
6. Conclusions and future works
A practical procedure aimed at evaluating TLS-based buildingdeformation in seismic emergency conditions was developed, tak-ing into account numerical experiments and data provided from areal acquisition, and tested in case studies related to the Emilia-Romagna earthquake (2012).
The procedure mainly relied on use of tabulated data on the ex-pected distortions due to high incidence angle of observations, andon the evaluation of morphological maps, i.e. maps of differencesbetween a point cloud and the corresponding primitives. The testson three case studies showed that the method can be quickly andeasily used. Also personnel with a relatively basic knowledge of TLScould carry out the observations (e.g. municipality technicians,firemen). Clearly, the interpretation of the results requires a struc-tural engineer, who can take part in this last step only, which isvery important in building evaluation, without directly participat-ing in TLS data acquisition.
Future studies will deal with a generalization of the expectedsurface shape, to allow the extension to those cases where a simplereference surface (e.g. plane, cylinder) cannot be assumed, butmore complex techniques of geometrical modeling are necessary.In particular, the goal is to develop an approach based on use ofNURBS (Non Uniform Rational Basis Splines) where necessary. An-other research line that will be explored is the direct integration ofintensity data in damage evaluation, to provide results based onboth geometrical and intensity information. Finally, new experi-ments will be carried out to evaluate the spot spreading effectsin presence of a broad range of materials, to widen the knowledgeand provide the corresponding empirical laws.
Acknowledgments
The authors kindly thank Codevintec Italiana for the instru-ments and accessories. A special thanks to Candido Bertolani(Municipality of Mirandola, Modena) for support in planning sur-veys and data acquisition.
References
Armesto-González, J., Riveriro-Rodríguez, B., González-Aguilera, D., Rivas-Brea, M.T.,2010. Terrestrial laser scanning intensity data applied to damage detection forhistorical buildings. Journal of Archaeological Science 37 (12), 3037–3047.
Catbas, F.N., Brown, D.L., Aktan, A.E., 2006. Use of modal flexibility for damagedetection and condition assessment: case studies and demonstrations on largestructures. Journal of Structural Engineering 132 (11), 1699–1712.
Clark, M.R., McCann, D.M., Forde, M.C., 2003. Application of infrared thermographyto the non-destructive testing of concrete and masonry bridges. NDT&EInternational 36 (4), 265–275.
Franceschi, M., Teza, G., Preto, N., Pesci, A., Galgaro, A., Girardi, S., 2009.Discrimination between marls and limestones using intensity data fromterrestrial laser scanner. ISPRS Journal of Photogrammetry and RemoteSensing 64 (6), 522–528.
Gentile, C., Saisi, A., 2007. Ambient vibration testing of historic masonry towers forstructural identification and damage assessment. Construction BuildingMaterials 21 (6), 1311–1321.
Grussenmeyer, P., Hanke, K., Streilein, A., 2002. Architectural photogrammetry. In:Kasser, M., Egels, Y. (Eds.), Digital Photogrammetry. Taylor & Francis, London,UK, pp. 300–339.
Innovmetric, 2012. PolyWorks Surveyor datasheet site. <http://www.innovmetric.com/polyworks/Surveying/brochures.aspx?lang=en>(accessed 07.01.13).
ISIDe, 2012. Italian Seismological Instrumental Database (ISIDe). <http://iside.rm.ingv.it/iside/standard/index.jsp?lang=en> (accessed 07.01.13).
Kaasalainen, S., Jaakkola, A., Kaasalainen, M., Krooks, A., Kukko, A., 2011. Analysis ofincidence angle and distance effects on terrestrial laser scanner intensity:search for correction methods. Remote Sensing 3 (10), 2207–2221.
Lubowiecka, I., Armesto, J., Arias, P., Lorenzo, H., 2009. Historic bridge modellingusing laserscanning, ground penetrating radar and finite element methods inthe context of structural dynamics. Engineering Structures 31 (11), 2667–2676.
Miranda, L., Cardani, G., Binda, L., Acito, M., Guedes, J., 2008. Experimental andnumerical study on the application of the flat-jack tests to masonry walls. In:Fodde, E. (Ed.), Proc. VI International Conference on Structural Analysis ofHistoric Construction, SAHC08, Bath, UK, 2–4 July 2008. CRC Press, Boca Raton,FL, pp. 75–883.
Murphy, M., McGovern, E., Pavia, S., 2009. Historic building information modelling(HBIM). Structural Survey 27 (4), 311–327.
Núñez Andrés, M.A., Buill Pozuelo, F., 2009. Evolution of the architectural andheritage representation. Landscape and Urban Planning 91 (2), 105–112.
Optech, 2012. Optech ILRIS 3-D datasheet site. <http://www.optech.ca/i3dprodline-ilris3d.htm> (accessed 07.01.13).
Pesci, A., Teza, G., 2008. Effects of surface irregularities on intensity data from laserscanning: an experimental approach. Annals of Geophysics 51 (56), 839–848.
Pesci, A., Casula, G., Boschi, E., 2011a. Laser scanning the Garisenda and Asinellitowers in Bologna (Italy): detailed deformation patterns of two ancient leaningbuildings. Journal of Cultural Heritage 12 (2), 117–127.
Pesci, A., Teza, G., Bonali, E., 2011b. Terrestrial laser scanner resolution: numericalsimulations and experiments on spatial sampling optimization. Remote Sensing3 (1), 167–184.
Pieraccini, M., Noferini, L., Mecatti, D., Macaluso, G., Atzeni, C., Teza, G., Galgaro, A.,Zaltron, N., 2006a. Radar interferometry and laser scanning for monitoring thestability of an alpine urban site. IEEE Transactions on Geosciences and RemoteSensing 44 (9), 2335–2342.
Pieraccini, M., Fratini, M., Parrini, F., Atzeni, C., 2006b. Dynamic monitoring ofbridges using a high-speed coherent radar. IEEE Transactions on Geosciencesand Remote Sensing 44 (11), 3284–3288.
Riva, P., Perotti, F., Cavaglieri, L., Gelmini, A., 2003. Analisi simica della Torre degliAsinelli. In: Boschi, E. Guidoboni, E. (Eds.), I terremoti a Bologna e nel suoterritorio dal XII al XX secolo. Compositori, Bologna, I, pp. 365–383 (in Italian).
Van Genechten, B., Demeyere, T., Herinckx, S., Goos, J., Schueremans L., Roose, D.,Santana, M., 2009. Terrestrial laser scanning in architectural heritage –deformation analysis and the automatic generation of 2D cross-sections. In:Proc. 22nd CIPA Symposium, Kyoto, Japan, 11–15 October, paper 184, pp. 1–6<http://cipa.icomos.org/fileadmin/template/doc/KYOTO/184.pdf> (accessed07.01.2013.
Yastikly, N., 2007. Documentation of cultural heritage using digitalphotogrammetry and laser scanning. Journal of Cultural Heritage 8 (4), 423–427.