Embed Size (px)
Citation preview
WORKING PAPER 2019:26
A laptop for every child? The impact of ICT on educational outcomes Caroline Hall Martin Lundin Kristina Sibbmark

The Institute for Evaluation of Labour Market and Education Policy (IFAU) is a research institute under the Swedish Ministry of Employment, situated in Uppsala. IFAU’s objective is to promote, support and carry out scientific evaluations. The assignment includes: the effects of labour market and educational policies, studies of the functioning of the labour market and the labour market effects of social insurance policies. IFAU shall also disseminate its results so that they become accessible to different interested parties in Sweden and abroad. Papers published in the Working Paper Series should, according to the IFAU policy, have been discussed at seminars held at IFAU and at least one other academic forum, and have been read by one external and one internal referee. They need not, however, have undergone the standard scrutiny for publication in a scientific journal. The purpose of the Working Paper Series is to provide a factual basis for public policy and the public policy discussion.
More information about IFAU and the institute’s publications can be found on the website www.ifau.se
ISSN 1651-1166
IFAU – A laptop for every child? 1
A laptop for every child? The impact of ICT on
educational outcomesa
by
Caroline Hallb, Martin Lundinc and Kristina Sibbmarkd
October 28, 2019
Abstract
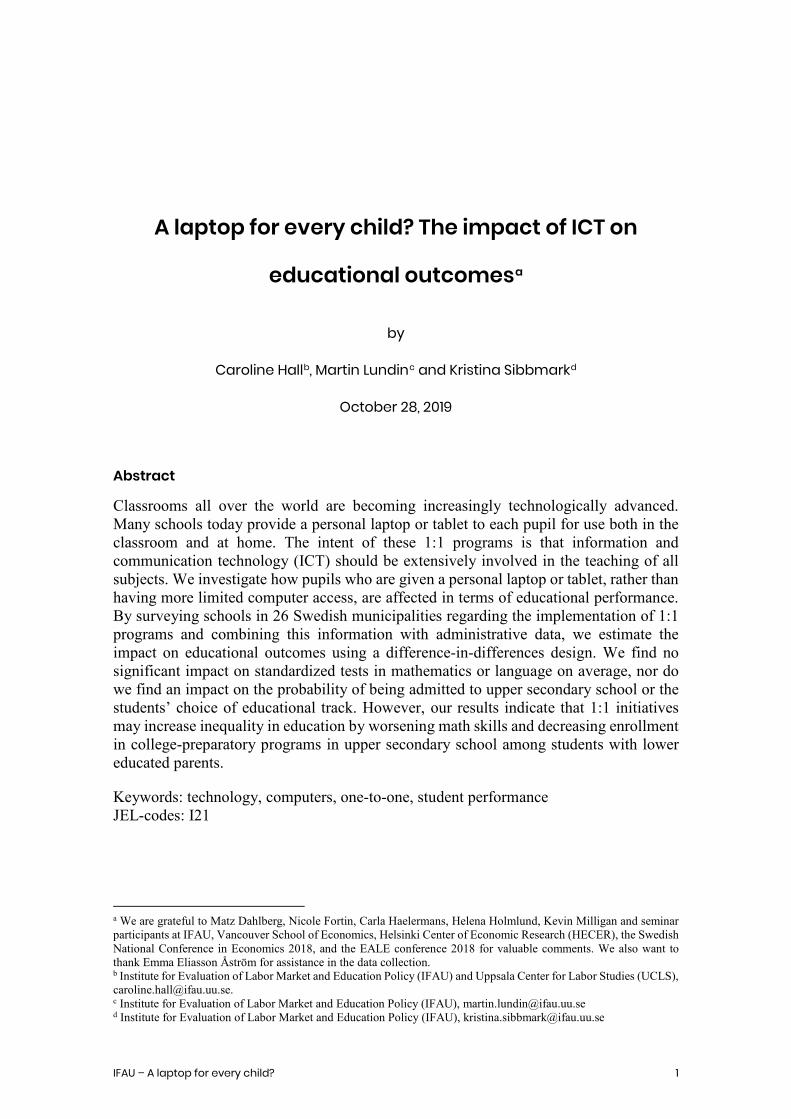
Classrooms all over the world are becoming increasingly technologically advanced. Many schools today provide a personal laptop or tablet to each pupil for use both in the classroom and at home. The intent of these 1:1 programs is that information and communication technology (ICT) should be extensively involved in the teaching of all subjects. We investigate how pupils who are given a personal laptop or tablet, rather than having more limited computer access, are affected in terms of educational performance. By surveying schools in 26 Swedish municipalities regarding the implementation of 1:1 programs and combining this information with administrative data, we estimate the impact on educational outcomes using a difference-in-differences design. We find no significant impact on standardized tests in mathematics or language on average, nor do we find an impact on the probability of being admitted to upper secondary school or the students’ choice of educational track. However, our results indicate that 1:1 initiatives may increase inequality in education by worsening math skills and decreasing enrollment in college-preparatory programs in upper secondary school among students with lower educated parents.
Keywords: technology, computers, one-to-one, student performance JEL-codes: I21
a We are grateful to Matz Dahlberg, Nicole Fortin, Carla Haelermans, Helena Holmlund, Kevin Milligan and seminar participants at IFAU, Vancouver School of Economics, Helsinki Center of Economic Research (HECER), the Swedish National Conference in Economics 2018, and the EALE conference 2018 for valuable comments. We also want to thank Emma Eliasson Åström for assistance in the data collection. b Institute for Evaluation of Labor Market and Education Policy (IFAU) and Uppsala Center for Labor Studies (UCLS), [email protected]. c Institute for Evaluation of Labor Market and Education Policy (IFAU), [email protected] d Institute for Evaluation of Labor Market and Education Policy (IFAU), [email protected]
2 IFAU – A laptop for every child?
Table of contents
1 Introduction ......................................................................................................... 3
2 Previous literature................................................................................................ 5
3 The Swedish education system and the role of ICT in schools ........................... 9
4 Data and descriptive statistics ........................................................................... 11 4.1 What kind of schools implement 1:1 programs? ............................................... 14
5 Estimating the impact of 1:1 programs ............................................................. 16
6 Results ............................................................................................................... 20 6.1 Main effects of 1:1 programs ............................................................................ 20 6.2 The digital divide – is the performance gap between low and high SES students
affected by 1:1 programs? ................................................................................. 25 6.3 Do effects vary depending on the type of technology used? ............................. 27 6.4 Are ICT strategies and teacher training important? .......................................... 29 6.5 Impact on class size ........................................................................................... 29 6.6 Impact on teacher sorting .................................................................................. 31
7 Conclusion ......................................................................................................... 32
References ....................................................................................................................... 34

IFAU – A laptop for every child? 3
1 Introduction
Classrooms around the world are becoming more and more technologically advanced. A
growing trend is for schools to provide a personal laptop or tablet to each pupil for use
both in the classroom and at home. The idea behind these one-to-one computer programs
(or 1:1 programs) is that information and communication technology (ICT) should be
extensively involved in the teaching of all subjects. The aim is partly to improve ICT
skills, but the ultimate goal is that these initiatives will enhance learning in general (Islam
and Grönlund 2016). Despite their increasing importance, there is little credible evidence
on the causal impact of these programs on students’ educational outcomes, especially
from high income countries.
We investigate how pupils who are given a personal laptop or tablet, rather than having
more limited computer access, are affected in terms of performance on standardized tests
in mathematics and language at the end of compulsory school. In addition, we examine
how 1:1 programs affect students’ progression to a higher level of education. By
surveying all lower secondary schools in 26 Swedish municipalities regarding the
implementation of 1:1 programs and combining this information with administrative data,
we estimate the impact on educational outcomes using a difference-in-differences design.
We compare how educational outcomes change across cohorts for schools that launch 1:1
programs, to changes for schools that have not yet introduced such programs.
The theoretical implications of schools’ investments in ICT on student performance
are ambiguous: The expenditure a school devotes to ICT will unavoidably come at the
expense of other inputs that are likely to affect learning (e.g. the number of teachers or
books), and which may be more or less efficient. Similarly, the time that students devote
to using technology may come at the expense of other educational activities, which again
may be more or less efficient for learning (Bulman and Fairlie 2016).
Several previous studies have estimated the effects of investments in ICT on student
achievement using credible empirical strategies (e.g. Angrist and Lavy 2002; Leuven et
al. 2007; Banerjee et al. 2007; Machin, McNally and Silva 2007), with very mixed
findings. We review the previous literature in Section 2. However, it is uncertain to what
extent the findings from this strand of the literature can be generalized to 1:1 programs,
as 1:1 initiatives most likely imply a much more intensive use of ICT in the classroom
4 IFAU – A laptop for every child?
(as well as at home) compared to the initiatives studied in these papers (Hull and Duch
2018).5
Some studies have attempted to estimate effects of 1:1 programs on student outcomes,
but the majority are plagued with methodological shortcomings (Hull and Duch 2018;
Islam and Grönlund 2016; Zheng et al. 2016). Hitherto, two papers provide more reliable
evidence on the impact of 1:1 initiatives. Cristia et al. (2012) study a randomized
experiment with a 1:1 program in poor regions of rural Peru and find positive effects on
students’ general cognitive skills, but no significant impact on test scores in mathematics
or language. It is hard to know whether the findings from this context are relevant for
schools in developed countries. For instance, very few of the schools in the sample had
access to the internet, which puts major constraints on how the technology could be used.
De Melo, Machado and Miranda (2014) provide evidence from a setting that bears
somewhat more similarities with ours. They study the national implementation of a 1:1
program in primary schools in Uruguay, exploiting the gradual introduction of the
program in order to identify its effects. They also do not find any effects on math or
reading scores. However, they also show that the computers were not used that frequently
in the classroom. In contrast, survey evidence from the National Agency for Education
shows that computers and tablets are highly involved in the teaching in Swedish 1:1
programs (see Section 3).
We contribute to the literature by providing one of the first pieces of evidence on the
impact of 1:1 programs from a high income country. Compared to De Melo, Machado
and Miranda (2014) we study outcomes at higher ages (lower secondary rather than
primary school). While earlier 1:1 studies have focused on short-term impacts (1−2 years)
on tests scores, we can follow the students somewhat longer and also examine impacts on
their progression to a higher level of education. Specifically, we investigate if exposure
to 1:1 programs affects whether students are admitted to upper secondary school and what
type of track they enroll in (academic or vocational). This allows us to also capture effects
on a broader set of skills compared to merely examining test scores.
Moreover, it is proposed in the literature that 1:1 programs may reduce social inequity
by providing computers to pupils with low socio-economic status (SES) (e.g. Zheng et al.
5 For instance, Banerjee et al. (2007) study a specific computer-assisted learning program offered to students two hours per week, and the targeted student-computer ratio in the intervention studied by Angrist and Lavy (2002) was 10:1.

IFAU – A laptop for every child? 5
2016). But, to our knowledge, there is no rigorous empirical support for this claim. Access
to data on parental background, allows us to directly examine whether 1:1 programs
reduce the gap in educational performance between students with different SES
backgrounds.
Furthermore, the rich data we have at hand allow us to perform a number of additional
analyses to shed light on some potential mechanisms behind our findings: We examine if
the costs associated with introducing 1:1 programs have led to larger classes (a proxy for
higher student-teacher ratios), and if these programs have affected the sorting of teachers
across schools. We also examine if the effects on student performance differ depending
on the type of technology used (laptops vs. tablets).
We find no evidence suggesting that 1:1 programs impact average student performance
on the standardized tests, the probability of being admitted to upper secondary school, or
the choice of educational track. We show that absence of positive impacts is unlikely to
be explained by lower teacher-student ratios or changes in the composition of teachers
employed. However, our analysis suggests that 1:1 initiatives may increase inequality in
education by worsening math skills and decreasing enrollment college-preparatory
programs in upper secondary school among students with lower educated parents. We
also find some indication that the impact of tablet programs is worse than the impact of
laptop programs.
The rest of the paper is outlined as follows. We start by reviewing the literature on the
effects of ICT in education in Section 2. In the subsequent section we describe the
Swedish education system and the role of ICT in Swedish schools. Section 4 presents the
data, and Section 5 discusses the empirical strategy. In Section 6 we present our results.
Section 7 concludes.
2 Previous literature
A good theoretical starting point for an analysis of how students are affected by 1:1
computer initiatives is a standard model of educational production (e.g. Hanushek 1986).
A student’s academic achievement is assumed to be a function of individual
characteristics, home environment and earlier achievement, as well as expenditures and
time allocated to different teaching methods. Within the limitations of the budget and
6 IFAU – A laptop for every child?
available instructional time, schools determine the scope for ICT investments (such as 1:1
programs) relative other uses of resources and methods of teaching.
Providing students with a personal laptop or tablet could be a strategy to improve
learning processes, and there are several mechanisms through which 1:1 programs may
enhance student achievement (e.g. Bulman and Ferlie 2016; Haelermans 2017; Islam and
Grönlund 2016; Zheng et al. 2016). First, learning may become more individualized to
suit the strengths and weaknesses of the individual pupil. For instance, computer software
can provide self-paced instruction that can be hard to achieve in traditional learning
environments. Second, use of ICT could increase student motivation. This can potentially
be achieved through interactive teaching methods, which are easier to use in a 1:1
environment. Third, computers and the internet provide an opportunity for students to
access more and better information which can stimulate learning. Lastly, the possibilities
for communication and coordination are likely to be improved, for example, among
students, between students and teachers, and between teachers and parents.
At the same time, investments in ICT will come at the expense of investments in other
key factors, such as the number of teachers hired6 and time devoted to traditional methods
of instruction (Bulman and Ferlie 2016). It is well-known that 1:1 programs require large
investments in infrastructure, support and training (Grönlund 2014). Studies have also
shown that there are implementation challenges associated with these initiatives (Chatterji
2018). For instance, it is difficult to change the educational paradigm and secure teachers’
commitment to the new technology (Haelermans 2017; Islam and Grönlund 2016).
Moreover, there are possible negative side effects associated with technology in the
classroom. Laptops and tablets might, for example, be used for other purposes than what
the teacher intended, such as for playing games or using social media. Empirical studies
demonstrate that computers in the classroom can imply an element of distraction
decreasing student performance (Beland and Murphy 2016; Carter, Greenberg and
Walker 2017; Sana, Tina and Cepeda 2013). In addition, experimental evidence suggests
that students using pen and paper for taking notes perform better than pupils using laptops.
A potential interpretation of these results is that writing by hand implies that students
have to process information and condense the content of the lecture rather than just
6 Research shows that larger classes decreases student performance and the impact tends to be largest among children with lower socioeconomic status (see e.g. Angrist and Lavy 1999; Krueger and Whitmore 2001; Fredriksson, Oosterbeck and Öckert 2013, 2016).

IFAU – A laptop for every child? 7
transcribing lectures verbatim. The pen and paper approach could therefore mean a
cognitive encoding of the content leading to enhanced learning (Mueller and
Oppenheimer 2014). To conclude, it is an empirical question whether 1:1 programs are
superior to other ways of using financial resources and time in school.
The trend towards more technology in education has generated quite a lot of empirical
research on the impact of ICT on student performance. The findings are mixed: For
instance, Goolsbee and Guryan (2006) and Beuremann et al. (2015) find no impact of
increased use of ICT on student achievement. Mainly negative effects are identified by
Angrist and Lavy (2002) and Leuven et al. (2007). On the other hand, Banerjee et al.
(2007), Machin, McNally and Silva (2007) find positive effects. Haelermans (2017)
summarizes the economic literature and concludes that general investments in ICT
without a distinct purpose and plan rarely provide positive results.7 If technology is used
with a clear aim, the findings can be more positive: there are examples of studies finding
positive effects of specific digital learning tools on test scores in mathematics and
language.8 It is important to point out that the literature often estimates effects of
supplemental resources earmarked for ICT and/or increased instructional time. Hence,
the estimates tend to reflect whether ICT can have a positive impact on student
performance in the absence of constraints in these dimensions (Bulman and Fairlie 2016).
The empirical literature specifically on effects of 1:1 programs is mainly dominated
by other scholars than economists. The methods used in order to isolate causal effects are
usually not that reliable.9 In fact, Islam and Grönlund (2016) argue in a recent overview
that “overall there is not much research into causal relations between interventions [in the
form of 1:1 programs] and effects” (p. 193–194).10 Many studies within this literature
indicate a positive correlation between 1:1 programs and student performance. But there
are also a number of studies showing mixed findings, no correlation or occasionally
negative associations.11
As discussed in the introduction, few studies provide credible evidence on the causal
effects of 1:1 programs using experimental or quasi-experimental designs. The two most
7 See also the overview in Bulman and Fairlie (2016). 8 The literature on computer-assisted-learning programs is also surveyed in Escueta et al. (2017). 9 Within this literature, there are attempts to construct comparison groups and control for selection by including covariates and/or by using some kind of basic difference-in-differences approach. It is fair to say that any causal statement based on these studies relies on strong assumptions. 10 For a similar way of reasoning, see Zheng et al. (2016, p. 25). 11 For overviews, see Islam and Grönlund (2016) and Zheng et al. (2016).
8 IFAU – A laptop for every child?
reliable studies so far are Crista et al. (2012) who study a randomized experiment with a
1:1 program in poor regions of rural Peru, and De Melo, Machado and Miranda (2014)
who study the implementation of a 1:1 program in primary schools in Uruguay. Neither
of these studies find any significant impact on test scores in mathematics or language.
However, Crista et al. find a positive and sizable effect on a test of students’ general
cognitive skills. Another recent study worth mentioning is Hull and Duch (2018)
examining a laptop program in one school district (only seven schools) in North Carolina
using a difference-in-differences strategy. The analysis suggests no short-term impact on
student achievement. In the medium term, however, there are indications of a positive
impact on math scores.
Our study is one of the first to provide credible evidence on the impact of 1:1 programs
from a high-income country. While the analysis by De Melo, Machado and Miranda
(2014) and Hull and Duch (2018) bear some similarities with ours, Crista et al. (2012)
study a very different context and it is hard to know to what extent their findings are
relevant for schools in developed countries. For instance, hardly any of the schools in
their sample had access to the internet, which severely limits how the technology could
be used but also the potential sources of distractions in the classroom. Our study also
extends the literature in various ways. For example, we investigate if progression to
higher levels of education is affected, and if effects differ depending on the type of
technology used.
An additional issue discussed in the literature is whether technology in education can
reduce educational and social inequity (e.g. Zheng et al. 2016). It is sometimes suggested
that 1:1 programs give low-SES students access to resources they do not have to the same
extent as high-SES students. Increased use of technology in teaching may also imply more
individualized learning and/or increase student motivation, which may be particularly
important for pupils with a more disadvantaged background. On the other hand, these
students may find it more difficult to take advantage of the technology due to less
experience and help from their parents. We contribute to this discussion by investigating
if the impact of 1:1 programs differ for low- and high-SES students.
IFAU – A laptop for every child? 9
3 The Swedish education system and the role of ICT in schools
Sweden has nine years of compulsory schooling, starting in the fall of the year the child
turns seven. Traditionally, compulsory schooling has been divided into three stages
(grades 1–3, 4–6 and 7–9), and schools were often organized as primary schools (grade
1–6) and lower secondary schools (grade 7–9). As a result of compulsory schooling being
decentralized to the municipal level, the organization of schools has become more flexible
in recent years, making also other grade configurations common. For instance, schools
today are sometimes organized as grade 1–5 and grade 6–9 schools, or as grade 1–3 and
grade 4–9 schools. A single school may also comprise all nine grades.
After nine years of schooling, almost all pupils move on to upper secondary education.
While compulsory education has a comprehensive curriculum, upper secondary school
consists of several different educational programs (both college preparatory and
vocational12) to which individuals apply based on their 9th grade GPA. Pupils that have
not attained eligibility for a regular upper secondary school program, have the possibility
of enrolling in an introductory program where they can qualify for a regular program.
Formally, Sweden has rather far-reaching school choice: Families may choose any
public or ’independent’ (but publicly funded) school for their children.13 However, since
the admission rules to public schools for grades 1–9 are based on proximity to the school,
it is still most common that pupils attend the nearest public school.14 Independent schools
may, on top of proximity, also base admission on a first-come-first-served basis, but they
are not allowed to select pupils based on ability or other personal characteristics. In order
to receive public funding, they are also not allowed to charge a tuition fee.15
The municipality is the responsible administrative body for organizing compulsory
education, and local income taxes as well as central government grants constitute the main
sources of finance. Each school has its own budget and the decision to invest in ICT, such
as providing each pupil with an individual laptop or tablet, is usually made by the
principal. However, general municipal initiatives, where financial resources are
12 Students who enroll in vocational programs can also attain college eligibility by choosing certain optional courses. 13 There are very few fully private schools in Sweden. 14 Böhlmark, Holmlund and Lindahl (2016) approximate that just above 30 percent of the pupils in 2009 opted out from their assigned public school to either an independent school or a public school outside their catchment area. 15 In the school year 2016/17, around 15 percent of the pupils in compulsory school attended an independent school (Swedish National Agency for Education 2017).

10 IFAU – A laptop for every child?
earmarked for 1:1 programs in some or all public schools in the municipality, exist as
well.
ICT has become an increasingly important part of teaching in Sweden. For example,
the number of students per computer decreased from 5.9 in 2008 to 1.8 in 2015 (Swedish
National Agency for Education 2016a). Small-scale 1:1 programs were introduced for the
first time around 2007/2008 (Tallvid 2015). In 2015, almost 30 percent of the students in
compulsory school had access to a personal laptop or tablet provided by the school. This
share was about the same in public and independent schools (Swedish National Agency
for Education 2016a).
There is a lively debate in Sweden regarding the increased use of computers in
education (see e.g. Lindgren 2011; Danielsson 2015; Thurfjell 2017). Some debaters refer
to ICT in very favorable terms: 1:1 is almost regarded as the ultimate solution to the key
challenges faced by the education system. Others have a much more skeptical view,
highly emphasizing the downsides of increased use of ICT in the classroom. However, it
is obvious that increased access to individual laptops or tablets is a rising trend in Swedish
schools. The Swedish National Agency for Education recommends that all pupils, from
first grade and upwards, be provided with a personal laptop or tablet (Swedish National
Agency for Education 2016b). Moreover, the Swedish government has in a recent strategy
declared the importance of securing good access to ICT for all pupils (Swedish
Government 2017).
There are no studies of the causal impact of 1:1 programs on student achievement from
Sweden. However, there are studies focusing on other questions. These studies are usually
based on questionnaires or interviews, and they tend to show that pupils and (for the most
time) teachers in 1:1 schools are positive toward the initiatives (Tallvid 2015). But there
are also studies suggesting that practices in the classrooms are not altered that much
(Molin and Lantz-Andersson 2016), that distraction increases (Hattaka, Andersson and
Grönlund 2013), and that the use of computers and tablets varies quite a lot from school
to school (Grönlund, Andersson and Wiklund 2014).
It is important to note that laptops and tablets are standard tools in essentially all
Swedish schools today. However, a study by the National Agency for Education (2016a)
shows that schools with 1:1 programs tend to incorporate ICT into their teaching to a
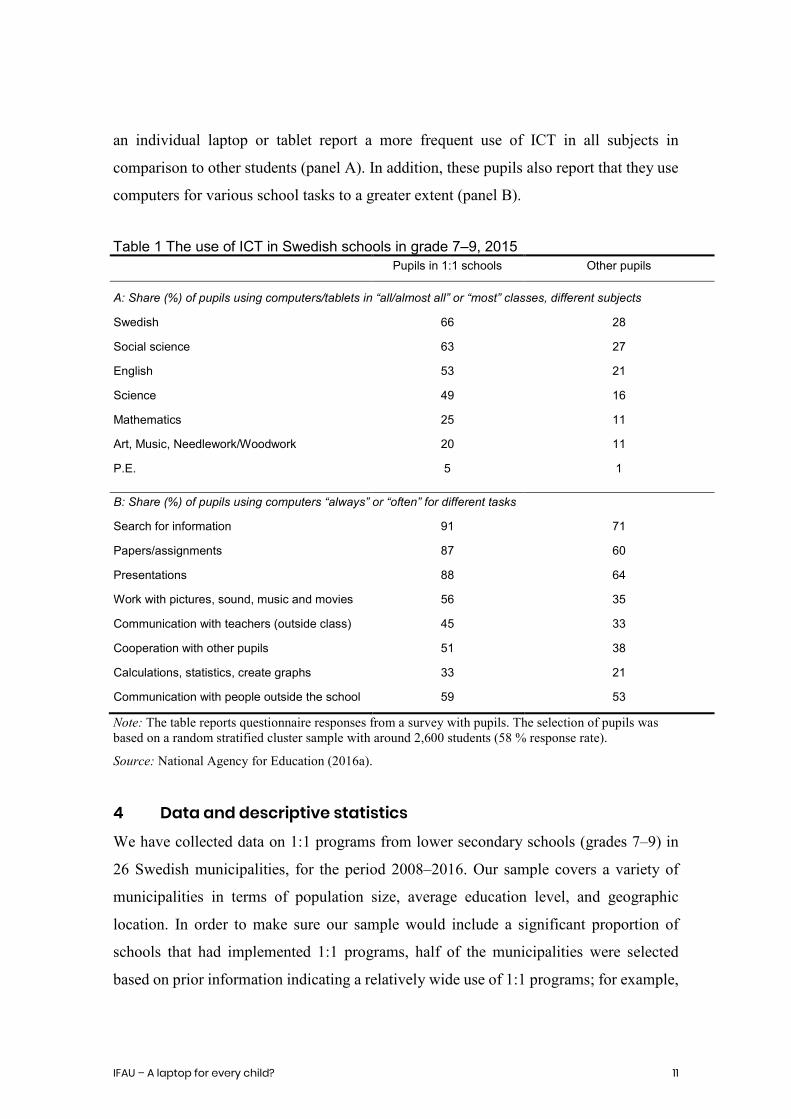
much greater extent than other schools. Table 1 demonstrates that students with access to
IFAU – A laptop for every child? 11
an individual laptop or tablet report a more frequent use of ICT in all subjects in
comparison to other students (panel A). In addition, these pupils also report that they use
computers for various school tasks to a greater extent (panel B).
Table 1 The use of ICT in Swedish schools in grade 7–9, 2015 Pupils in 1:1 schools Other pupils
A: Share (%) of pupils using computers/tablets in “all/almost all” or “most” classes, different subjects
Swedish 66 28
Social science 63 27
English 53 21
Science 49 16
Mathematics 25 11
Art, Music, Needlework/Woodwork 20 11
P.E. 5 1
B: Share (%) of pupils using computers “always” or “often” for different tasks
Search for information 91 71
Papers/assignments 87 60
Presentations 88 64
Work with pictures, sound, music and movies 56 35
Communication with teachers (outside class) 45 33
Cooperation with other pupils 51 38
Calculations, statistics, create graphs 33 21
Communication with people outside the school 59 53
Note: The table reports questionnaire responses from a survey with pupils. The selection of pupils was based on a random stratified cluster sample with around 2,600 students (58 % response rate).
Source: National Agency for Education (2016a).
4 Data and descriptive statistics
We have collected data on 1:1 programs from lower secondary schools (grades 7–9) in
26 Swedish municipalities, for the period 2008–2016. Our sample covers a variety of
municipalities in terms of population size, average education level, and geographic
location. In order to make sure our sample would include a significant proportion of
schools that had implemented 1:1 programs, half of the municipalities were selected
based on prior information indicating a relatively wide use of 1:1 programs; for example,
12 IFAU – A laptop for every child?
due to municipality-wide initiatives. We describe the selection of municipalities in greater
detail in Appendix A.
A short questionnaire was sent by email to all schools (299) with grades 7–9 in the
selected municipalities, followed by phone calls to non-respondents. About 73 percent of
the schools that were contacted responded to our questions, resulting in a sample of 219
schools.16
The schools were asked about the existence of a 1:1 program and, if present, when it
was implemented and which grades were included at different points in time. They were
also asked whether the pupils were provided with a laptop or a tablet, whether the school
had any documented strategy for how ICT should be incorporated into the teaching at the
school, and whether they had any documented strategy for teacher training in relation to
increased use of technology in teaching.
Figure 1 shows the presence of 1:1 programs in our sample of schools. These types of
programs were very unusual in 2008, but increase substantially in importance over the
sampling period. We see a particularly large shift between 2011 and 2012. In 2016, 151
of the schools had implemented a 1:1 program in grade 7. This corresponds to almost 70
percent of the schools (with grade 7) in our sample (see Table A2).17 Similar figures are
reported for grades 8 and 9.
It is more common to use laptops than tablets. The increase in 1:1 programs after 2012
is, however, largely driven by an increase in programs using tablets; see Figures A1 and
A2. Essentially no 1:1 tablet programs existed before 2012.
16 Grade 9 existed in 209 of these schools. 17 Note that this figure is not representative for all Swedish schools; half of the municipalities included in our study were selected because we knew in advance that 1:1 programs were especially common here. According to a survey by the National Agency for Education (2016a), around 50 percent of Swedish students in grade 7–9 participated in a 1:1 program in 2015.

IFAU – A laptop for every child? 13
Figure 1 Presence of 1:1 programs in different grades among the schools in the sample
We have linked the school level data on 1:1 programs to individual level register data
on school attendance in grade 7 (available since 2008), and students’ school performance,
measured by their performance on national standardized tests in Swedish, English and
mathematics which are given in grade 6 (or in some cases grade 5) and 9 (available since
2009 and 2005, respectively).18 We use the results from these tests as three separate
dependent variables in the analysis (rather than constructing an index). Studying
mathematics and language separately is standard in the literature on ICT and educational
outcomes. Technology is used in different ways, and to varying extents, in different
subjects (see e.g. Table 1) and there is thus no reason to believe that the effect would be
the same. We have also added information on whether the students enrolled in upper
secondary school and what type of track they enrolled in (college-preparatory, vocational,
or introductory program). This gives us the opportunity to capture effects on a broader set
of skills and on outcomes that potentially have more long-term relevance.
18 The registers that contain test scores from compulsory school also include information on which school the student attended in grade 9. Hence, we can observe which school the student attended in grade 9 (but not other grades) already from 2003.
0
20
40
60
80
100
120
140
160
Fall2008
Spring2009
Fall2009
Spring2010
Fall2010
Spring2011
Fall2011
Spring2012
Fall2012
Spring2013
Fall2013
Spring2014
Fall2014
Spring2015
Fall2015
Spring2016
Num
ber o
f sch
ools
Grade 7 Grade 8 Grade 9
14 IFAU – A laptop for every child?
Our dataset also includes several background variables for the students (e.g., age,
immigrant background and parents’ educational background19) and the schools (e.g. class
size and number of students) as well as information about the teachers and principals
employed (e.g. education and years of teaching experience).20 The register data come
from Statistics Sweden.
Municipality-wide 1:1 initiatives may come with additional funding for the schools.
To find out to what extent schools in municipalities with a wide use of 1:1 programs have
received additional funding for such programs, we have contacted the school
administration in these municipalities. Many of them did not respond, and others were
unable to provide reliable information. In the somewhat small group of municipalities
where we received trustworthy information, most replied that additional funding from the
municipality had been provided, to either fully or partially finance 1:1 programs, but there
are also cases where this was not the case. Due to the low response rate, we cannot use
the information from this mini-survey in the empirical analysis, but it to some extent helps
us to interpret the results (we will return to this question in Section 6 as well as in the
conclusions).
4.1 What kind of schools implement 1:1 programs? Before discussing how we go about to identify the impact of 1:1 programs, we look into
what type of schools in our sample that choose to implement these programs and whether
the selection of schools to these programs has changed over time. Table 2 shows how the
probability that a school has launched a 1:1 program in grade 7 is related to various
characteristics of the schools in the same municipality. We show these relationships for
the fall semester of 2009, 2011, 2013 and 2015, respectively. To circumvent the problem
that the introduction of a 1:1 program could influence what types of students (and
teachers) that are attracted to the school, as well as their performance, the school
characteristics are here measured during the academic year 2007/08 – that is, prior to the
introduction of 1:1 programs for the vast majority of schools.21
19 Students are linked to register data for their parents using the Multi Generation Register, which contains information on ties between children and parents for all residents. 20 Our dataset links teachers to schools but not to the specific students taught. Hence, average teacher characteristics refer to the whole school although our sample only consists of upper secondary school students. 21 Out of the 209 lower secondary schools (grades 7−9) in our sample, 162 can be linked back to the school year 2007/08. Among these schools, only 6 percent reported that they had implemented a 1:1 program during the first semester for which we have collected data, i.e. the fall semester of 2008.

IFAU – A laptop for every child? 15
Table 2 Relationship between the presence of a 1:1 program in grade 7 and earlier school characteristics (1) (2) (3) (4) Fall 2009 Fall 2011 Fall 2013 Fall 2015 Student characteristics Share female pupils -0.512* -0.731* -0.717 0.228 (0.308) (0.369) (0.532) (0.593) Average test resulta 0.108 -0.081 -0.023 -0.118 (0.118) (0.169) (0.178) (0.185) Share foreign born pupils 0.145 0.178 -0.776 -0.222 (0.339) (0.739) (0.580) (0.707) Share pupils with foreign born parents 0.026 0.029 0.183 0.393 (0.184) (0.404) (0.343) (0.396) Share mothers with post-sec educ 0.258 0.056 -0.215 -0.290 (0.308) (0.503) (0.487) (0.523) Share fathers with post-sec educ 0.063 -0.280 0.151 -0.064 (0.237) (0.376) (0.484) (0.546) Average wage earnings, father -0.001** -0.000 -0.001 -0.000 (0.001) (0.001) (0.001) (0.001) Average wage earnings, mother 0.001 0.002 0.003* 0.003** (0.001) (0.002) (0.001) (0.001) School, teacher and principal characteristics Public school 0.008 -0.098 -0.006 -0.058 (0.091) (0.128) (0.147) (0.156) No of students 0.001 0.000 0.000 -0.000 (0.001) (0.001) (0.001) (0.001) Average teacher experience (years)b -0.006 0.018* -0.007 -0.000 (0.006) (0.010) (0.012) (0.016) Share female teachers -0.534* 0.114 -0.069 -0.398 (0.321) (0.502) (0.454) (0.513) Share teachers with teaching degree 0.260 0.333 0.641* 0.506 (0.308) (0.375) (0.350) (0.380) Average principal experience (years)b -0.000 -0.003 -0.010** -0.011** (0.003) (0.004) (0.004) (0.005) Share female principals -0.046 -0.031 -0.094 -0.066 (0.040) (0.071) (0.074) (0.076) Share principals with teaching degree -0.031 -0.003 0.097 0.120 (0.077) (0.122) (0.127) (0.127) Observations 157 157 157 157 R-squared 0.536 0.555 0.657 0.607 Mean of outcome 0.074 0.210 0.426 0.506
Notes: School characteristics are measured among students who finished grade 9 in 2008, and among teachers and principals employed during the school year 2007/2008. aAverage test result refers to students' average grade on the standardized tests in Mathematics, English and Swedish. bTeacher and principal experience is defined as number of years employed at any school in Sweden. The regressions control for municipality fixed effects. Robust standard errors in parentheses. *** p<0.01, ** p<0.05, * p<0.1.
The results do not give the impression that schools that implement 1:1 programs are
largely different from schools that do not; very few estimates are statistically significant.22
There seems to be somewhat of a tendency for early implementers to have a larger share
of male students. The size of the estimates implies that an increase in the share of female
22 The high R-squared is mainly explained by the municipality fixed effects. If we estimate the models without municipality fixed effects, the R-squared decreases to 0.09–0.15.

16 IFAU – A laptop for every child?
students by one standard deviation (0.09) is associated with a 5˗7 percentage point
decrease in the probability that the school has launched a 1:1 program in 2009 and 2011.
There is also a tendency for fathers to have lower earnings in 1:1 schools in the beginning
of the time period, whereas the pattern is the reverse for mothers, especially towards the
end of the time period. It is noteworthy that there is no significant relationship between
the probability that a school has launched a 1:1 program and the students’ performance
on the standardized tests.
The table does not indicate that the likelihood of introducing 1:1 programs consistently
differs depending on teacher characteristics such as sex, education and experience. When
it comes to principal characteristics, we find a significant correlation with years of
experience (in teaching and/or school leadership) for the last two years.23 Hence, more
experienced principals seem less likely to introduce these programs at their schools.
5 Estimating the impact of 1:1 programs
To capture effects of 1:1 programs, we compare how educational outcomes change across
cohorts for schools that introduce 1:1 programs, to changes for schools that have not yet
introduced such programs, in a difference-in-differences design.
Our main sample consists of pupils that enrolled in grade 7 in any of the schools for
which we have obtained data during 2008−2013. This means that they graduated from
compulsory school during 2011−2016.24 Our empirical design requires at least one
untreated cohort per school in order for the school to contribute to identification; schools
that introduced 1:1 program early enough to also affect the 2008 cohort are therefore
excluded from the sample. This sampling procedure results in a sample of 168 schools,
out of which 78 schools (46 percent) launched 1:1 programs at some point before the
summer of 2016. A factor that will complicate the identification of causal effects of 1:1
is that a school’s decision to provide laptops (or tablets) to the students also may affect
the selection of students to the school. In order to mitigate this problem, we exclude all
pupils that were given a laptop or tablet already from the first semester of grade 7.25
23 Teacher and principal experience are defined as number of years employed at any school in Sweden and thus includes both experience in teaching and school leadership. 24 Grade repetition during compulsory school is rare in Sweden. 25 This restriction also alleviates the concern that children in treated schools may have had greater access to laptops/tablets already before grade 7 compared to children in untreated schools, since students sometimes attend the same school also in earlier grades.
IFAU – A laptop for every child? 17
Hence, all pupils that are included in the sample enrolled in schools without 1:1 programs
when they began lower secondary school.
Our final sample consists of 49,937 pupils. Table B1 in the appendix shows descriptive
statistics for their background characteristics as well as for their exposure to 1:1 programs.
Very few students in the sample were provided with a laptop/tablet already in the spring
semester of grade 7. A year later this share is about 8 percent, and by the spring of 9th
grade about 15 percent of the students had received either a laptop (13 percent) or a tablet
(2 percent) from their school. The pupils that were included in a 1:1 program during their
last semester of grade 9 had on average had their laptop or tablet for 2.9 semesters.
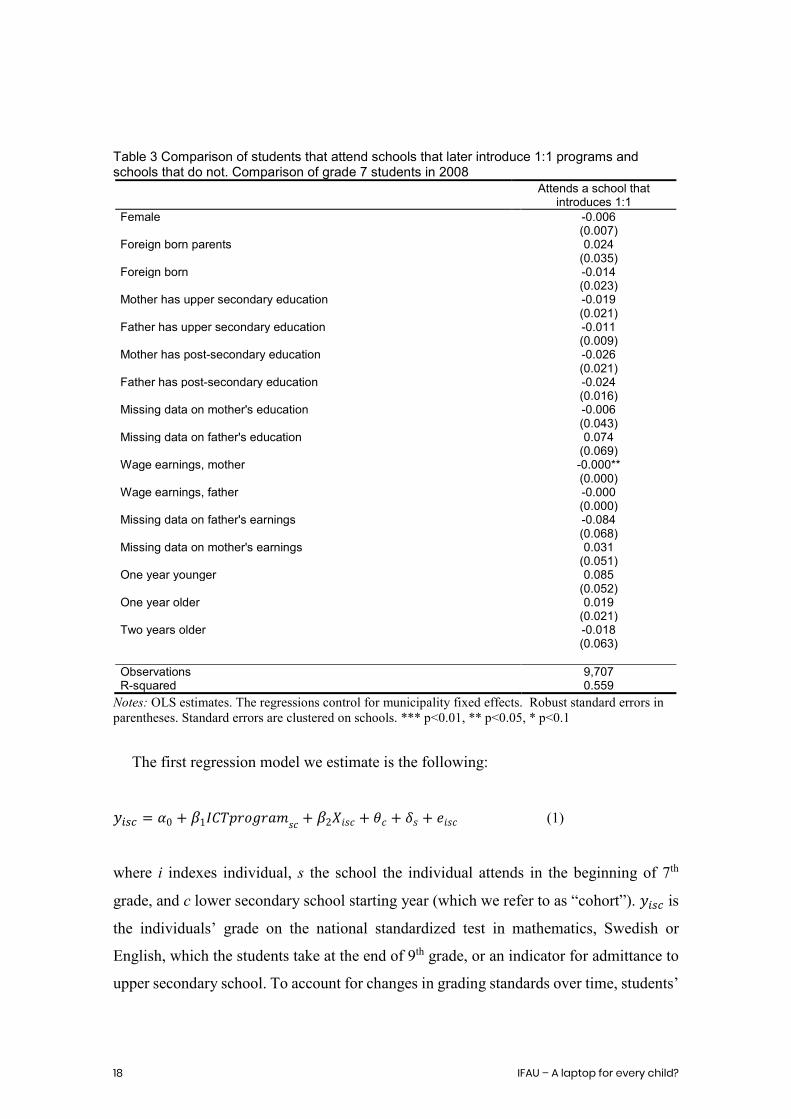
In the previous section, we saw that the schools that implement 1:1 programs are
generally rather similar to the rest of the schools in terms of observable characteristics. In
Table 3 we examine whether there are any differences in observables in the sample which
we will use for estimating the impact on students. The table compares the background
characteristics among students that in 2008 attended schools that later introduced 1:1
programs, and students that attended schools that did not launch such a program during
our sampling period. We can see that the two groups of students are balanced in terms of
observable background characteristics; the only statistically significant difference
between the groups is the mother’s earnings whose coefficient is very close to zero.26
Based on an F-test, we cannot reject the hypothesis that all the coefficients on the
individual covariates are jointly zero (p-value 0.259).
26 The size of the estimate (-0.00000495) implies that an increase in mother’s earnings by one standard deviation (1,879) is associated with a 0.9 percentage point decrease in the probability that the school launches a 1:1 program within the next eight years.
18 IFAU – A laptop for every child?
Table 3 Comparison of students that attend schools that later introduce 1:1 programs and schools that do not. Comparison of grade 7 students in 2008
Attends a school that introduces 1:1
Female -0.006 (0.007) Foreign born parents 0.024 (0.035) Foreign born -0.014 (0.023) Mother has upper secondary education -0.019 (0.021) Father has upper secondary education -0.011 (0.009) Mother has post-secondary education -0.026 (0.021) Father has post-secondary education -0.024 (0.016) Missing data on mother's education -0.006 (0.043) Missing data on father's education 0.074 (0.069) Wage earnings, mother -0.000** (0.000) Wage earnings, father -0.000 (0.000) Missing data on father's earnings -0.084 (0.068) Missing data on mother's earnings 0.031 (0.051) One year younger 0.085 (0.052) One year older 0.019 (0.021) Two years older -0.018 (0.063) Observations 9,707 R-squared 0.559
Notes: OLS estimates. The regressions control for municipality fixed effects. Robust standard errors in parentheses. Standard errors are clustered on schools. *** p<0.01, ** p<0.05, * p<0.1
The first regression model we estimate is the following:
𝑦𝑦𝑖𝑖𝑖𝑖𝑖𝑖 = 𝛼𝛼0 + 𝛽𝛽1𝐼𝐼𝐼𝐼𝐼𝐼𝐼𝐼𝐼𝐼𝐼𝐼𝐼𝐼𝐼𝐼𝐼𝐼𝐼𝐼𝑠𝑠𝑠𝑠 + 𝛽𝛽2𝑋𝑋𝑖𝑖𝑠𝑠𝑠𝑠 + 𝜃𝜃𝑠𝑠 + 𝛿𝛿𝑠𝑠 + 𝑒𝑒𝑖𝑖𝑠𝑠𝑠𝑠 (1)
where i indexes individual, s the school the individual attends in the beginning of 7th
grade, and c lower secondary school starting year (which we refer to as “cohort”). 𝑦𝑦𝑖𝑖𝑖𝑖𝑖𝑖 is
the individuals’ grade on the national standardized test in mathematics, Swedish or
English, which the students take at the end of 9th grade, or an indicator for admittance to
upper secondary school. To account for changes in grading standards over time, students’
IFAU – A laptop for every child? 19
test results are standardized within cohort to have mean zero and standard deviation one.27
𝐼𝐼𝐼𝐼𝐼𝐼𝐼𝐼𝐼𝐼𝐼𝐼𝐼𝐼𝐼𝐼𝐼𝐼𝐼𝐼𝑖𝑖𝑖𝑖 is an indicator that takes the value one if the individual, in the beginning
of grade 7, attends a school that (later) introduces a 1:1 program and belongs to a cohort
that will be treated by the program; otherwise it is zero. 𝑋𝑋𝑖𝑖𝑖𝑖𝑖𝑖 is a vector of individual
background characteristics (those listed in Table 3), and 𝜃𝜃𝑖𝑖 and 𝛿𝛿𝑝𝑝 represent cohort and
school fixed effects, respectively. 𝑒𝑒𝑖𝑖𝑖𝑖𝑖𝑖 is an error term. The parameter of interest, 𝛽𝛽1, is
the difference-in-differences estimate of exposure to a 1:1 program (of any length) during
lower secondary school. Since exposure to 1:1 is measured based on which school the
individual attends in the beginning of grade 7, 𝛽𝛽1 should be interpreted as an intention-
to-treat (ITT) estimate of 1:1 programs.
In order to account for the length of exposure to 1:1 programs, we also estimate a
regression model where the variable 𝐼𝐼𝐼𝐼𝐼𝐼𝐼𝐼𝐼𝐼𝐼𝐼𝐼𝐼𝐼𝐼𝐼𝐼𝐼𝐼𝑖𝑖𝑖𝑖 is replaced by 𝐼𝐼𝐼𝐼𝐼𝐼𝑠𝑠𝑒𝑒𝐼𝐼𝑒𝑒𝑠𝑠𝐼𝐼𝑒𝑒𝐼𝐼𝑠𝑠𝑖𝑖𝑖𝑖,
which counts the number of semesters the pupil would be exposed to 1:1 if staying
enrolled in the same school up until the end of grade 9. This is our preferred model
specification.
Table 3 showed that students in (later) treated and untreated schools were similar in
terms of the background characteristics we can observe in our data. By incorporating
school fixed effects, our models also account for unobserved differences between schools
that remain constant over time. However, a causal interpretation of 𝛽𝛽1 will rely on the
assumption that trends in student outcomes would not differ systematically between
schools that launched 1:1 programs at different points in time in the absence of these
programs. This assumption is fundamentally untestable, but by examining pre-treatment
trends we can make an assessment of whether it seems credible. To do this, we perform
placebo-test by estimating our preferred model specification but (artificially) define the
program to have been launched one as well as two years before the actual program start
(see Section 6.1.1).
27 An alternative way to standardize test scores is to percentile rank students (based on their test results) within cohort. Results from regression models based on percentile ranked test results are displayed in appendix in Tables B6–B8. All results are robust. If anything, the overall pattern becomes even clearer.

20 IFAU – A laptop for every child?
6 Results
This section presents the results from the empirical analysis. We first show results for the
full sample of lower secondary school students, followed by robustness checks (Section
6.1). Thereafter, we examine a number of extensions: We investigate if 1:1 programs
affect the achievement gap between low- and high-SES students (Section 6.2); if effects
vary depending on if laptops or tablets are used (Section 6.3); or depending on if the
schools have strategies for teacher training in relation to the new technology (Section
6.4). Last, we examine if the introduction of 1:1 programs have impacted class size
(Section 6.5) or the composition of teachers at the schools (Section 6.6).
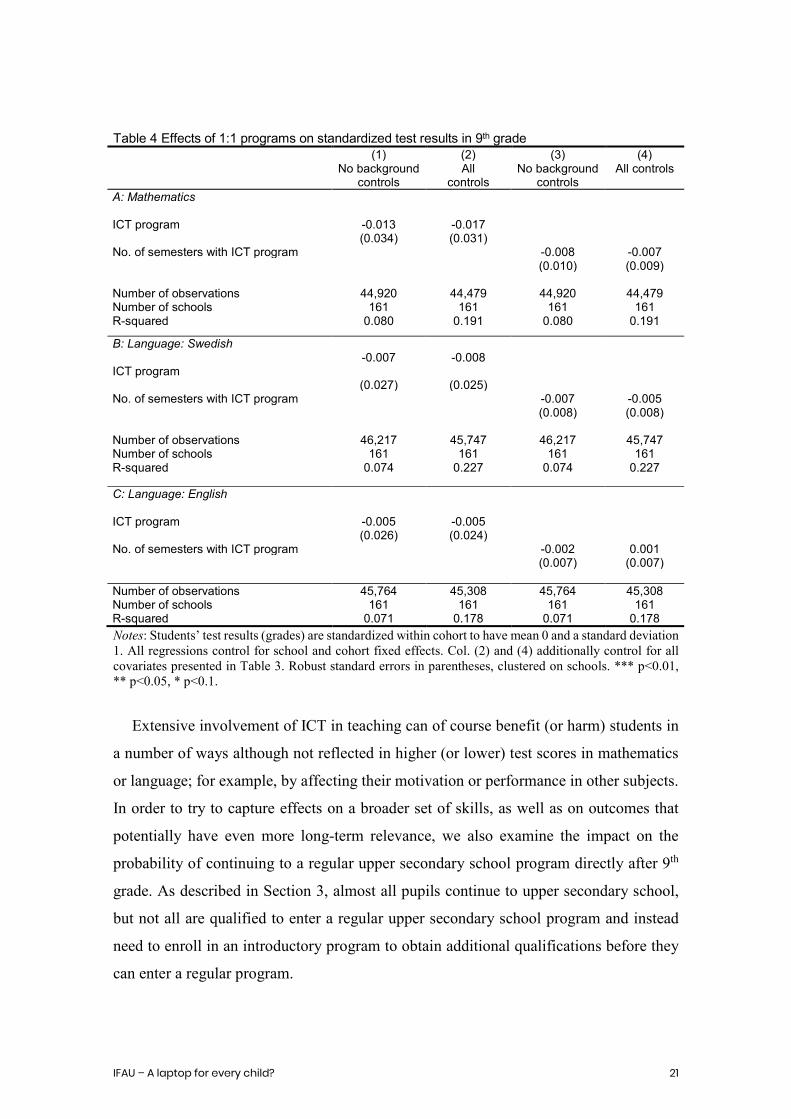
6.1 Main effects of 1:1 programs Table 4 displays estimates for the two regression models discussed in Section 5 for the
full sample of students. The first two columns show the estimated effects of being exposed
to a 1:1 program (of any length) during lower secondary school, while the last two show
estimates for our preferred model specification which also takes into account the number
of semesters of (potential) exposure to 1:1.
The results give no indication that 1:1 programs would enhance student performance
in neither language nor mathematics: The estimated coefficients for the 1:1 indicators are
negative, small and statistically insignificant for all three outcomes, independently of
which model we use and independently of whether the models include controls for student
background characteristics or not. One could also note that the point estimates stay very
similar when individual background controls are included in the model, which is
reassuring. In appendix, we present results from alternative regression models where we
instead have standardized the outcome variables using percentile ranked test results. The
results are very robust (see Table B6).
IFAU – A laptop for every child? 21
Table 4 Effects of 1:1 programs on standardized test results in 9th grade (1) (2) (3) (4) No background
controls All
controls No background
controls All controls
A: Mathematics
ICT program -0.013 -0.017 (0.034) (0.031) No. of semesters with ICT program -0.008 -0.007 (0.010) (0.009) Number of observations 44,920 44,479 44,920 44,479 Number of schools 161 161 161 161 R-squared 0.080 0.191 0.080 0.191
B: Language: Swedish ICT program
-0.007
-0.008
(0.027) (0.025) No. of semesters with ICT program -0.007 -0.005 (0.008) (0.008) Number of observations 46,217 45,747 46,217 45,747 Number of schools 161 161 161 161 R-squared 0.074 0.227 0.074 0.227
C: Language: English
ICT program -0.005 -0.005 (0.026) (0.024) No. of semesters with ICT program -0.002 0.001 (0.007) (0.007) Number of observations 45,764 45,308 45,764 45,308 Number of schools 161 161 161 161 R-squared 0.071 0.178 0.071 0.178 Notes: Students’ test results (grades) are standardized within cohort to have mean 0 and a standard deviation 1. All regressions control for school and cohort fixed effects. Col. (2) and (4) additionally control for all covariates presented in Table 3. Robust standard errors in parentheses, clustered on schools. *** p<0.01, ** p<0.05, * p<0.1.
Extensive involvement of ICT in teaching can of course benefit (or harm) students in
a number of ways although not reflected in higher (or lower) test scores in mathematics
or language; for example, by affecting their motivation or performance in other subjects.
In order to try to capture effects on a broader set of skills, as well as on outcomes that
potentially have even more long-term relevance, we also examine the impact on the
probability of continuing to a regular upper secondary school program directly after 9th
grade. As described in Section 3, almost all pupils continue to upper secondary school,
but not all are qualified to enter a regular upper secondary school program and instead
need to enroll in an introductory program to obtain additional qualifications before they
can enter a regular program.
22 IFAU – A laptop for every child?
Table 5 Effects of 1:1 programs on admittance to upper secondary education (1) (2) (3) (4) No background
controls All
controls No background
controls All controls
A: Admitted to a regular program (college-preparatory or vocational) ICT program -0.005 -0.006 (0.009) (0.009) No. of semesters with ICT program -0.002 -0.002 (0.003) (0.003) Number of observations 49,889 49,190 49,889 49,190 Number of schools 161 161 161 161 R-squared 0.055 0.122 0.055 0.122 Outcome mean 0.854 0.854 0.854 0.854
B: Admitted to a college-preparatory program ICT program -0.000 -0.003 (0.011) (0.010) No. of semesters with ICT program -0.000 -0.000 (0.003) (0.003) Number of observations 49,889 49,190 49,889 49,190 Number of schools 161 161 161 161 R-squared 0.076 0.184 0.076 0.184 Outcome mean 0.617 0.617 0.617 0.617
Notes: All regressions control for school and cohort fixed effects. Col. (2) and (4) additionally control for all covariates presented in Table 3. Robust standard errors in parentheses, clustered on schools. *** p<0.01, ** p<0.05, * p<0.1.
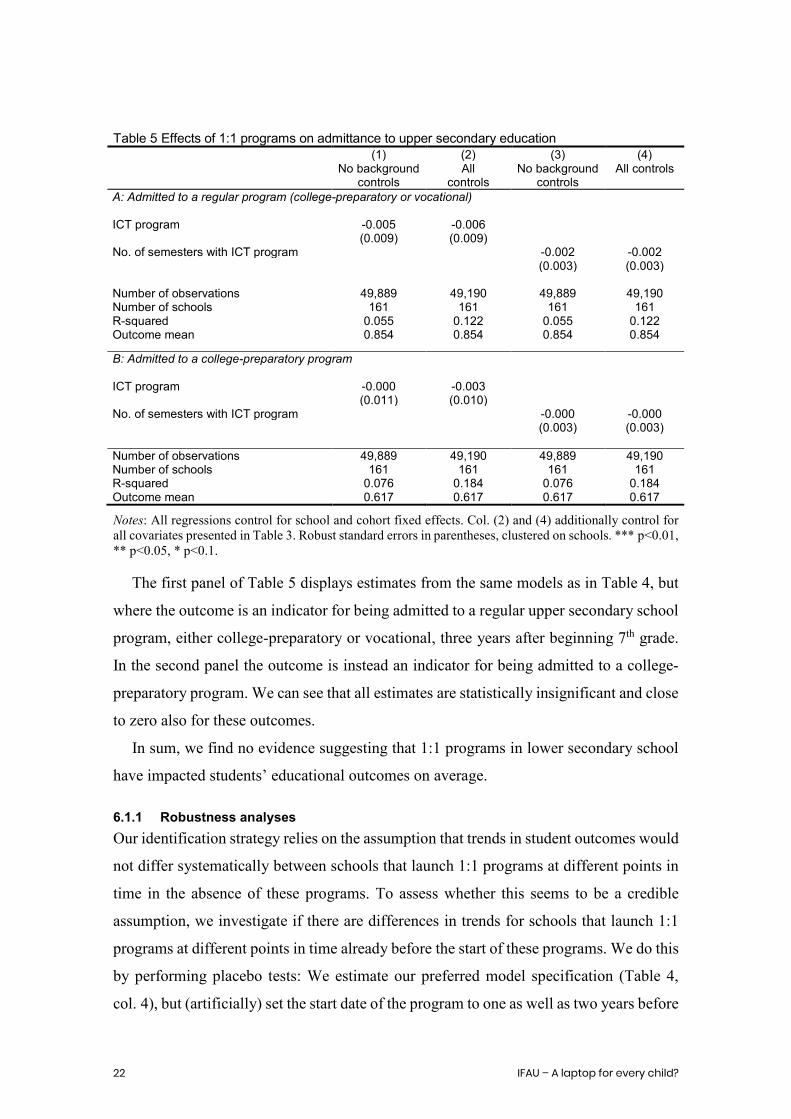
The first panel of Table 5 displays estimates from the same models as in Table 4, but
where the outcome is an indicator for being admitted to a regular upper secondary school
program, either college-preparatory or vocational, three years after beginning 7th grade.
In the second panel the outcome is instead an indicator for being admitted to a college-
preparatory program. We can see that all estimates are statistically insignificant and close
to zero also for these outcomes.
In sum, we find no evidence suggesting that 1:1 programs in lower secondary school
have impacted students’ educational outcomes on average.
6.1.1 Robustness analyses Our identification strategy relies on the assumption that trends in student outcomes would
not differ systematically between schools that launch 1:1 programs at different points in
time in the absence of these programs. To assess whether this seems to be a credible
assumption, we investigate if there are differences in trends for schools that launch 1:1
programs at different points in time already before the start of these programs. We do this
by performing placebo tests: We estimate our preferred model specification (Table 4,
col. 4), but (artificially) set the start date of the program to one as well as two years before
IFAU – A laptop for every child? 23
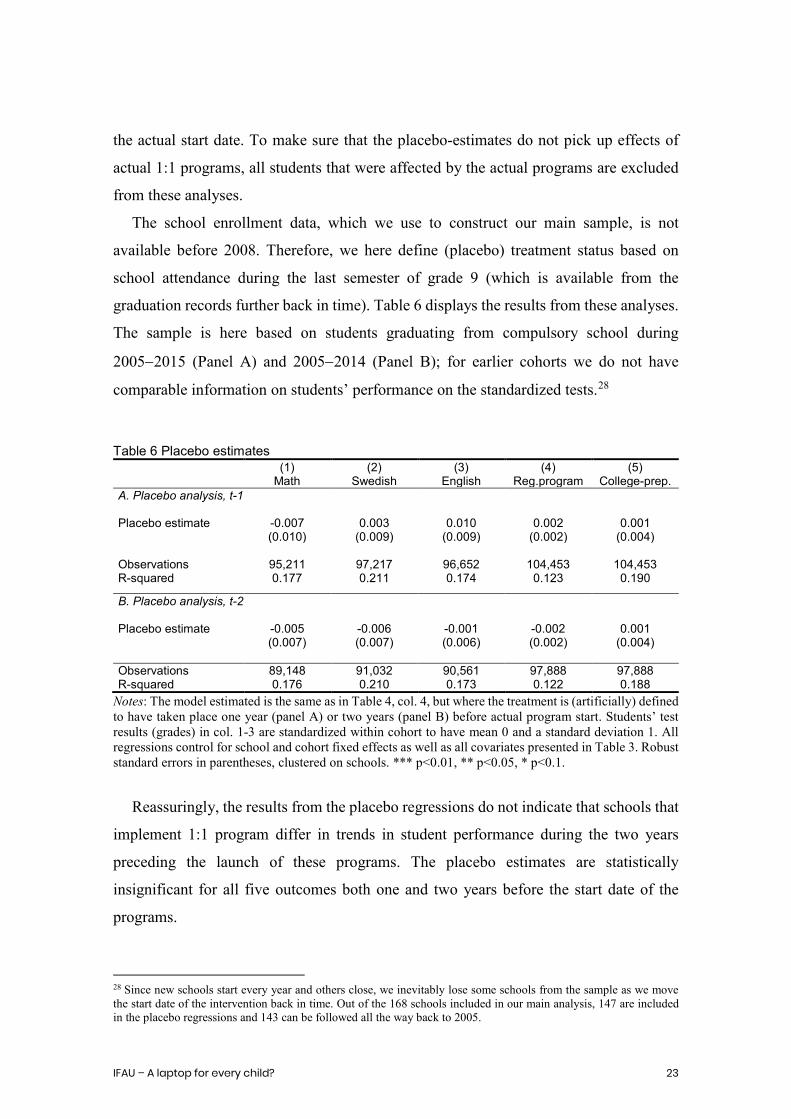
the actual start date. To make sure that the placebo-estimates do not pick up effects of
actual 1:1 programs, all students that were affected by the actual programs are excluded
from these analyses.
The school enrollment data, which we use to construct our main sample, is not
available before 2008. Therefore, we here define (placebo) treatment status based on
school attendance during the last semester of grade 9 (which is available from the
graduation records further back in time). Table 6 displays the results from these analyses.
The sample is here based on students graduating from compulsory school during
2005−2015 (Panel A) and 2005−2014 (Panel B); for earlier cohorts we do not have
comparable information on students’ performance on the standardized tests.28
Table 6 Placebo estimates (1) (2) (3) (4) (5) Math Swedish English Reg.program College-prep. A. Placebo analysis, t-1
Placebo estimate -0.007 0.003 0.010 0.002 0.001 (0.010) (0.009) (0.009) (0.002) (0.004) Observations 95,211 97,217 96,652 104,453 104,453 R-squared 0.177 0.211 0.174 0.123 0.190
B. Placebo analysis, t-2
Placebo estimate -0.005 -0.006 -0.001 -0.002 0.001 (0.007) (0.007) (0.006) (0.002) (0.004) Observations 89,148 91,032 90,561 97,888 97,888 R-squared 0.176 0.210 0.173 0.122 0.188
Notes: The model estimated is the same as in Table 4, col. 4, but where the treatment is (artificially) defined to have taken place one year (panel A) or two years (panel B) before actual program start. Students’ test results (grades) in col. 1-3 are standardized within cohort to have mean 0 and a standard deviation 1. All regressions control for school and cohort fixed effects as well as all covariates presented in Table 3. Robust standard errors in parentheses, clustered on schools. *** p<0.01, ** p<0.05, * p<0.1.
Reassuringly, the results from the placebo regressions do not indicate that schools that
implement 1:1 program differ in trends in student performance during the two years
preceding the launch of these programs. The placebo estimates are statistically
insignificant for all five outcomes both one and two years before the start date of the
programs.
28 Since new schools start every year and others close, we inevitably lose some schools from the sample as we move the start date of the intervention back in time. Out of the 168 schools included in our main analysis, 147 are included in the placebo regressions and 143 can be followed all the way back to 2005.

24 IFAU – A laptop for every child?
For the last four cohorts of the sample we have information on results on standardized
national tests (in the same subjects) from an earlier point in time – before the students
enrolled in 7th grade. Those who enrolled in 7th grade in 2010 and 2011 took standardized
tests in mathematics, Swedish and English at the end of 5th grade, and those who enrolled
in 2012 and 2013 took tests in the same subjects at the end of 6th grade. Adding controls
for previous performance to our baseline model can be seen as an additional check of
whether our results may be biased due to unobserved heterogeneity. However, our data
on prior test results only contain information on whether or not the student received a
passing grade on each of the sub-tests within each subject. Prior test results are also
lacking for a part of the sample (6−9 percent of the students). Together, the sample
restrictions imply that only around half of the original sample can be included in these
regressions. Nonetheless, it is reassuring that our conclusions hold if we replicate the
analysis for the sample with available prior test results and add controls for prior
performance. Table 7 displays regression results when we have added controls for
whether or not the student passed all sub-tests in math, Swedish and English, respectively,
to our baseline model.29
Table 7 Robustness: controlling for results on earlier standardized test (1) (2) (3) (4) (5) (6) Math Math Swedish Swedish English English No. of semesters with ICT program 0.004 -0.005 -0.030 -0.023 -0.010 -0.004 (0.019) (0.021) (0.018) (0.018) (0.014) (0.012) Pass on earlier math test 0.672*** (0.025) Pass on earlier Swedish test 0.685*** (0.021) Pass on earlier English test 1.147*** (0.025) Number of observations 25,617 25,617 25,312 25,312 25,542 25,542 R-squared 0.202 0.263 0.237 0.314 0.177 0.349 Notes: Students’ test results (grades) are standardized within cohort to have mean 0 and a standard deviation 1. All regressions control for school and cohort fixed effects as well as all covariates presented in Table 3. The sample consists of students who enrolled in grade 7 in 2010−2013 only. Robust standard errors in parentheses, clustered on schools. *** p<0.01, ** p<0.05, * p<0.1.
Our preferred specification assumes that the effect of 1:1 programs on student
performance is linear in the number of semesters of exposure. Given that previous studies
29 The standardized tests performed in grade 5 or 6 differ over time, also when it comes to the number of sub-tests included and how the tests are graded. The results are similar if we instead rank the students, among those taking the test the same year, based on the number of sub-tests they passed, and instead control for this rank.
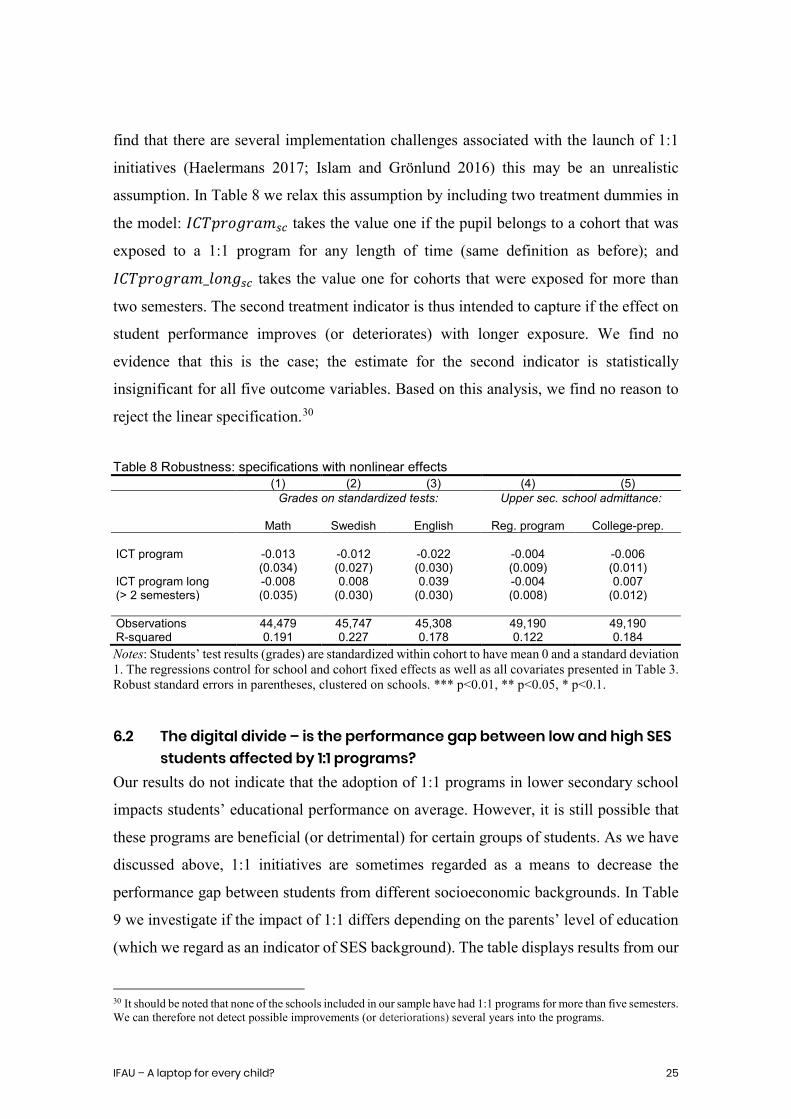
IFAU – A laptop for every child? 25
find that there are several implementation challenges associated with the launch of 1:1
initiatives (Haelermans 2017; Islam and Grönlund 2016) this may be an unrealistic
assumption. In Table 8 we relax this assumption by including two treatment dummies in
the model: 𝐼𝐼𝐼𝐼𝐼𝐼𝐼𝐼𝐼𝐼𝐼𝐼𝐼𝐼𝐼𝐼𝐼𝐼𝐼𝐼𝑖𝑖𝑖𝑖 takes the value one if the pupil belongs to a cohort that was
exposed to a 1:1 program for any length of time (same definition as before); and
𝐼𝐼𝐼𝐼𝐼𝐼𝐼𝐼𝐼𝐼𝐼𝐼𝐼𝐼𝐼𝐼𝐼𝐼𝐼𝐼_𝑙𝑙𝐼𝐼𝑙𝑙𝐼𝐼𝑖𝑖𝑖𝑖 takes the value one for cohorts that were exposed for more than
two semesters. The second treatment indicator is thus intended to capture if the effect on
student performance improves (or deteriorates) with longer exposure. We find no
evidence that this is the case; the estimate for the second indicator is statistically
insignificant for all five outcome variables. Based on this analysis, we find no reason to
reject the linear specification.30 Table 8 Robustness: specifications with nonlinear effects (1) (2) (3) (4) (5) Grades on standardized tests: Upper sec. school admittance: Math Swedish English Reg. program College-prep. ICT program -0.013 -0.012 -0.022 -0.004 -0.006 (0.034) (0.027) (0.030) (0.009) (0.011) ICT program long -0.008 0.008 0.039 -0.004 0.007 (> 2 semesters) (0.035) (0.030) (0.030) (0.008) (0.012) Observations 44,479 45,747 45,308 49,190 49,190 R-squared 0.191 0.227 0.178 0.122 0.184 Notes: Students’ test results (grades) are standardized within cohort to have mean 0 and a standard deviation 1. The regressions control for school and cohort fixed effects as well as all covariates presented in Table 3. Robust standard errors in parentheses, clustered on schools. *** p<0.01, ** p<0.05, * p<0.1.
6.2 The digital divide – is the performance gap between low and high SES students affected by 1:1 programs?
Our results do not indicate that the adoption of 1:1 programs in lower secondary school
impacts students’ educational performance on average. However, it is still possible that
these programs are beneficial (or detrimental) for certain groups of students. As we have
discussed above, 1:1 initiatives are sometimes regarded as a means to decrease the
performance gap between students from different socioeconomic backgrounds. In Table
9 we investigate if the impact of 1:1 differs depending on the parents’ level of education
(which we regard as an indicator of SES background). The table displays results from our
30 It should be noted that none of the schools included in our sample have had 1:1 programs for more than five semesters. We can therefore not detect possible improvements (or deteriorations) several years into the programs.

26 IFAU – A laptop for every child?
preferred model specification but where we have added an interaction term between the
ICT treatment indicator (𝐼𝐼𝐼𝐼𝐼𝐼𝑠𝑠𝑒𝑒𝐼𝐼𝑒𝑒𝑠𝑠𝐼𝐼𝑒𝑒𝐼𝐼𝑠𝑠𝑖𝑖𝑖𝑖) and an indicator for the parents having a low
level of education, defined as none one of the parents having post-secondary education.
Table 9 Effects of 1:1 programs by parental education (1) (2) (3) A: Grades on standardized test Math Swedish English No. of semesters with ICT program 0.000 0.002 0.004 (0.010) (0.008) (0.007) No. of semesters with ICT program* -0.016* -0.014 -0.005 low educated parents (0.009) (0.009) (0.009) Observations 44,479 45,747 45,308 R-squared 0.191 0.227 0.178
(4) (5) B: Admitted to upper secondary school Any regular program College-prep. program No. of semesters with ICT program 0.003 0.004 (0.003) (0.004) No. of semesters with ICT program* -0.010*** -0.008* low educated parents (0.003) (0.004) Observations 49,190 49,190 R-squared 0.123 0.185
Notes: Low level of parental education is defined as no parent with post-secondary education. Students’ test results (grades) are standardized within cohort to have mean 0 and a standard deviation 1. All regressions control for school and cohort fixed effects as well as all covariates presented in Table 3. Robust standard errors in parentheses, clustered on schools.*** p<0.01, ** p<0.05, * p<0.1.
The estimated impact of 1:1 consistently shows the opposite sign for students with
higher vs. lower educated parents, indicating that these programs may in fact increase
inequality in educational outcomes along the socio-economic dimension. When it comes
to results on the standardized tests, we get a statistically significant interaction term for
math, suggesting that the adoption of 1:1 computer programs increases the gap in math
performance between students with higher and lower educated parents by 0.016 of a
standard deviation per semester. This corresponds to 10 percent of a standard deviation
(1.6×6=9.6) if students are exposed to 1:1 during all semesters of lower secondary
school.31 In relation to the raw gap in test results between the groups (0.594), the estimate
corresponds to a 16 percent increase (0.096/0.594). We interpret this impact as quite
small, but not negligible.
31 In economics of education it is common to follow the rule of thumb that less than 10 percent of a standard deviation is a small effect, 10–25 percent represents an encouraging effect, and effects above 25 percent are large (e.g. Escueta et al. 2017).

IFAU – A laptop for every child? 27
The estimated effect is similar in size for Swedish language, but marginally
insignificant (p-value 0.105). If we instead use percentile ranked outcome variables, the
impact on both math and Swedish is more pronounced; see Table B7. For English, on the
other hand, there is no indication of a differential impact depending on parental
background.
The patterns for test results are very similar if we instead estimate separate regressions
for students whose parents have a low vs. high level of education, but splitting the sample
further reduces the precision of the estimates (see Table B2).
The results presented in panel B suggest that the increased inequality in school
performance also may be carried over to upper secondary school: The estimate for the
interaction term is negative and statistically significant for both admittance to upper
secondary school and for admittance to a college-preparatory program. While the
estimated impact on the former gap gets smaller if we instead estimate separate
regressions for the two sub-samples of students, the estimate for admittance to a college-
preparatory program remains very similar in size (see Table B2). In relation to the raw
gap in admission to college-preparatory programs between the groups, the estimate is of
similar size as the estimates for math and Swedish language.32 33
6.3 Do effects vary depending on the type of technology used? Whether a school chooses to utilize laptops or tablet computers in its 1:1 program is likely
to have consequences for how 1:1 affects the teaching at the school. Computers’ built-in
keyboard makes them a better tool for writing, and they generally have more powerful
processors which allow them to handle more complex software. Tablets may on the other
hand offer other advantages; for instance, in terms of being easier for students to carry
around and having longer battery life. What specific digital learning tools that exist on
the market for laptops vs. tablets is also likely to differ as well as how familiar teachers
are with incorporating these tools into their instruction.
32 Placebo-analyses in line with those presented in Table 6, give no indication that the achievement gap between low and high SES students was increasing at 1:1 schools, compared to other schools, already before the adoption of these programs. Such a pattern would have indicated that we risk overestimating this effect. Rather, a couple of placebo estimates suggest that the gap was closing a few years back, while most estimates are statistically insignificant; see Table B3. 33 We have also examined if the impact of 1:1 programs differs for boys and girls. There is some tendency of a more negative impact on test results in math for girls, but overall we do not find clear evidence of important differences between the sexes.
28 IFAU – A laptop for every child?
Table 10 Effects of 1:1 laptop vs. tablet programs (1) (2) (3) (4) (5) Grades on standardized tests:
Upper sec. school admittance:
Math Swedish English Reg. program College-prep. No. of semesters -0.006 -0.000 0.003 -0.002 0.001 with laptop program (0.010) (0.008) (0.008) (0.003) (0.003) No. of semesters -0.014 -0.034*** -0.014 -0.001 -0.008 with tablet program (0.019) (0.011) (0.009) (0.004) (0.007) Observations 44,479 45,747 45,308 49,190 49,190 R-squared 0.191 0.227 0.178 0.122 0.184
Notes: Students’ test results (grades) are standardized within cohort to have mean 0 and a standard deviation 1. All regressions control for school and cohort fixed effects as well as all covariates presented in Table 3. Robust standard errors in parentheses, clustered on schools. *** p<0.01, ** p<0.05, * p<0.1.
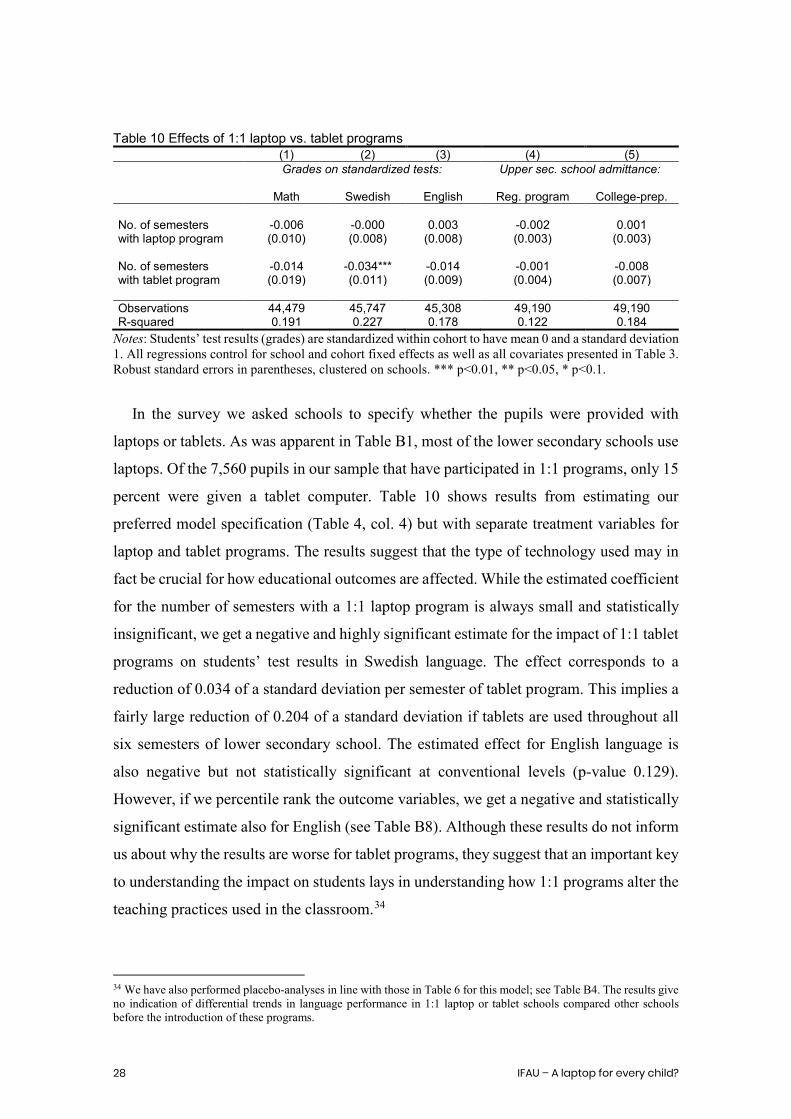
In the survey we asked schools to specify whether the pupils were provided with
laptops or tablets. As was apparent in Table B1, most of the lower secondary schools use
laptops. Of the 7,560 pupils in our sample that have participated in 1:1 programs, only 15
percent were given a tablet computer. Table 10 shows results from estimating our
preferred model specification (Table 4, col. 4) but with separate treatment variables for
laptop and tablet programs. The results suggest that the type of technology used may in
fact be crucial for how educational outcomes are affected. While the estimated coefficient
for the number of semesters with a 1:1 laptop program is always small and statistically
insignificant, we get a negative and highly significant estimate for the impact of 1:1 tablet
programs on students’ test results in Swedish language. The effect corresponds to a
reduction of 0.034 of a standard deviation per semester of tablet program. This implies a
fairly large reduction of 0.204 of a standard deviation if tablets are used throughout all
six semesters of lower secondary school. The estimated effect for English language is
also negative but not statistically significant at conventional levels (p-value 0.129).
However, if we percentile rank the outcome variables, we get a negative and statistically
significant estimate also for English (see Table B8). Although these results do not inform
us about why the results are worse for tablet programs, they suggest that an important key
to understanding the impact on students lays in understanding how 1:1 programs alter the
teaching practices used in the classroom.34
34 We have also performed placebo-analyses in line with those in Table 6 for this model; see Table B4. The results give no indication of differential trends in language performance in 1:1 laptop or tablet schools compared other schools before the introduction of these programs.

IFAU – A laptop for every child? 29
6.4 Are ICT strategies and teacher training important? Previous studies have highlighted the importance of teachers having sufficient training in
how to incorporate the new technology into teaching in order for 1:1 programs to be
successful (see e.g. Haelermans 2017). To get a rough idea about the presence of this type
of training at the schools, our survey included questions on whether the school had any
documented strategy for how ICT should be incorporated into the instruction, and
whether they had any documented strategy for teacher training in relation to increased
use of technology in the classroom. Around half of the schools that had initiated 1:1
programs answered “yes” to one or both of these questions.35 However, estimating
interactions models that allow the effect of 1:1 to differ for schools with and without
strategies for ICT and teacher training, provide no evidence in support of more successful
student outcomes in schools with such documented strategies; see Table B5.
6.5 Impact on class size To the extent that the schools have not received additional funding to fully cover their 1:1
initiatives, ICT expenditure will come at the expense of something else. Schools may, for
instance, fund their 1:1 programs by reducing the number of teachers hired, and there are
previous studies finding that larger classes tend to worsen student performance (e.g.
Angrist and Lavy 1999; Krueger and Whitmore 2001; Fredriksson, Oosterbeck and
Öckert 2013, 2016). The responses from our mini-survey among municipalities show that
all 1:1 programs were not fully financed with additional funds even though municipalities
often seem to have put in extra money (see Section 4).36 Hence, it is possible that the
absence of positive effects on average student performance could be explained by
increases in the student-teacher ratio.
The dataset that provides information on which school a student attends each school
year, also contains information on the school’s division of students into classes. Using
these data, we can examine if 1:1 initiatives seem to have led to larger classes.
However, it is important to point out that the schools’ registered class division is
unlikely to constitute a perfect measure of actual class size at all times; e.g. schools may
35 46 percent of the 1:1 schools answered that they had an ICT-strategy, 38 percent answered that they had a plan for teacher training, and 35 percent answered “yes” to both of these questions. 13 percent of the 1:1 schools did not answer these questions. In the analysis we treat missing values as a “no”. Note that we only have information of whether documented strategies existed at the time when data were collected. 36 Due to the low response rate, as well as incomplete answers, we are not able to further examine whether effects differ depending on if the schools have been provided with additional funding or not.

30 IFAU – A laptop for every child?
divide pupils into smaller (or larger) groups in certain subjects, and some schools do not
divide the cohorts into classes at all in the register but instead record the whole cohort as
the same class. Hence, for this analysis it is critical to examine if the results are sensitive
to the inclusion/exclusion of unreasonably large (and small) classes.
Table 11 Effects on class size (1) (2) (3) (4) (5) ICT program -0.408 -0.415 -0.402 -0.456 -0.259 (0.424) (0.417) (0.420) (0.417) (0.473) Observations 44,809 45,077 44,541 45,048 38,922 R-squared 0.386 0.384 0.392 0.376 0.382 Sample restriction: Included class sizes 5-40 5-45 5-35 3-40 5-40 Excl. potentially affected controls
no no no no yes
Notes: All regressions control for school and cohort fixed effects as well as all covariates presented in Table 3. Robust standard errors in parentheses, clustered on schools. *** p<0.01, ** p<0.05, * p<0.1.
Table 11 shows the estimated effect of exposure to a 1:1 program (of any length) on
class size, measured in grade 9. In the first column we include all pupils who attend
classes with at least 5, but no more than 40, pupils.37 1:1 initiatives do not seem to have
resulted in larger classes: the estimated impact is negative and statistically insignificant.
Columns (2)–(4) show that the results are very similar if we change the sample restriction
to also include somewhat larger or smaller classes, or if we are even more restrictive and
only include classes with up to 35 pupils. In the last column we have excluded schools
where it is possible that pupils in the control group also would be affected by an increased
class size, although they were not part of the 1:1 program (this would be the case if a
given school has both treated and untreated pupils enrolled at the same point in time).
Imposing this restriction also does not alter our findings. Hence, we find no indications
that the schools in our sample have financed their 1:1 programs by increasing the number
of students per class. To the extent that the schools have not received extra funds from
the municipality for their 1:1 programs, the initiatives seem to have been financed by
other means, e.g. by cutting spending on other types of teaching materials.
37 The median class size in our sample is 26 pupils. 5 percent of the students are recorded as attending classes with more than 40 students, and 1 percent in classes with 5 pupils or less.
IFAU – A laptop for every child? 31
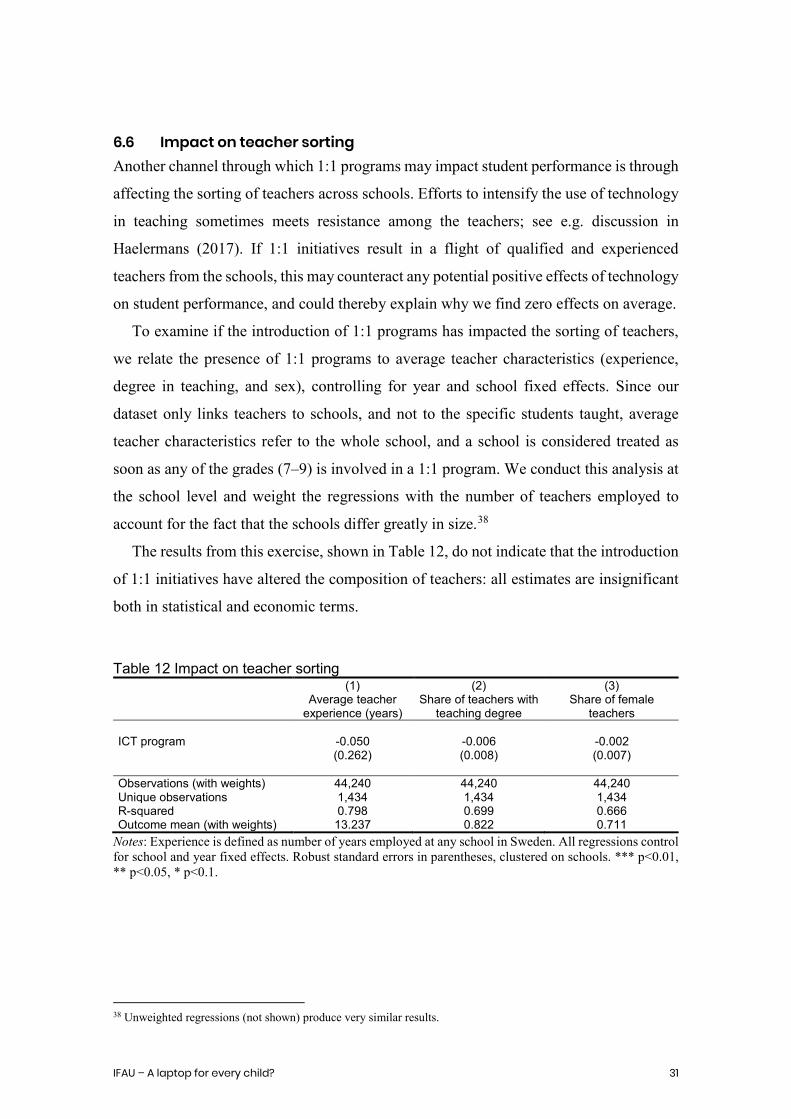
6.6 Impact on teacher sorting Another channel through which 1:1 programs may impact student performance is through
affecting the sorting of teachers across schools. Efforts to intensify the use of technology
in teaching sometimes meets resistance among the teachers; see e.g. discussion in
Haelermans (2017). If 1:1 initiatives result in a flight of qualified and experienced
teachers from the schools, this may counteract any potential positive effects of technology
on student performance, and could thereby explain why we find zero effects on average.
To examine if the introduction of 1:1 programs has impacted the sorting of teachers,
we relate the presence of 1:1 programs to average teacher characteristics (experience,
degree in teaching, and sex), controlling for year and school fixed effects. Since our
dataset only links teachers to schools, and not to the specific students taught, average
teacher characteristics refer to the whole school, and a school is considered treated as
soon as any of the grades (7–9) is involved in a 1:1 program. We conduct this analysis at
the school level and weight the regressions with the number of teachers employed to
account for the fact that the schools differ greatly in size.38
The results from this exercise, shown in Table 12, do not indicate that the introduction
of 1:1 initiatives have altered the composition of teachers: all estimates are insignificant
both in statistical and economic terms.
Table 12 Impact on teacher sorting (1) (2) (3) Average teacher
experience (years) Share of teachers with
teaching degree Share of female
teachers ICT program -0.050 -0.006 -0.002 (0.262) (0.008) (0.007) Observations (with weights) 44,240 44,240 44,240 Unique observations 1,434 1,434 1,434 R-squared 0.798 0.699 0.666 Outcome mean (with weights) 13.237 0.822 0.711
Notes: Experience is defined as number of years employed at any school in Sweden. All regressions control for school and year fixed effects. Robust standard errors in parentheses, clustered on schools. *** p<0.01, ** p<0.05, * p<0.1.
38 Unweighted regressions (not shown) produce very similar results.

32 IFAU – A laptop for every child?
7 Conclusion
One-to-one computer programs are becoming increasingly popular in schools all over the
world. By combining survey data on the implementation of such programs between 2008
and 2016 in a large number of Swedish schools with rich administrative data, we estimate
the impact of 1:1 initiatives on students’ educational performance using a difference-in-
differences design. Essentially all Swedish schools use ICT in their teaching today. Thus,
the comparison we make is between intensive use of ICT in the form of 1:1 and more
standard use of computers (e.g. pupils borrowing laptops or tablets for certain tasks).
Survey evidence from the National Agency for Education (2016a) confirms that 1:1
schools tend to involve ICT in their teaching to a much greater extent than other schools.
On average, we find no significant impact of 1:1 programs on student performance, as
measured by their results on national standardized tests in mathematics and language at
the end of lower secondary school. These findings are in line with the results in Crista et
al. (2012) and De Melo, Machado and Miranda (2014), although at least the former
studies a vastly different context (schools in poor regions of rural Peru). We extend the
literature by examining effects on the probability of transitioning to upper secondary
school and the students’ choice of educational track. We find no effects on average in
these respects either. We also examine if the impact differs depending on if the schools
use laptops or tablets. These results indicate that tablets may bring about some negative
effects on student performance. The estimates for 1:1 laptop programs are, on the other
hand, always small and statistically insignificant.
It is sometimes proposed that 1:1 programs may reduce inequality in educational
outcomes as they provide low-SES students with resources they might otherwise lack (the
so called ‘digital divide’). We find no support for this claim. If anything, our results
suggest the reverse. The performance gap in mathematics between students with low- and
high-SES background seems to increase to some extent, and so does the gap in the
probability of being admitted to a college-preparatory program in upper secondary school.
The interpretation of a zero effect on average will, of course, differ depending on how
1:1 initiatives are financed. The lack of positive effects on student outcomes, and perhaps
also negative effects in some dimensions, should be considered a larger problem if the
schools have received additional resources to launch these programs; an alternative use
of the resources (e.g. hiring more teachers) could then have generated better outcomes.
IFAU – A laptop for every child? 33
If the schools have financed the programs from their own budgets, a zero effect is less
problematic. It is, after all, likely that the increased use of ICT in the classroom have
taught students other things (such as general ICT skills), which are not captured by the
outcomes we examine.
Unfortunately, we have no systematic data on how the 1:1 programs examined have
been financed. We have contacted municipal school administrations to get a sense of
whether municipalities often put in extra money to finance these initiatives. Due to a low
response rate it is not possible to generalize from this mini-survey, but it seems like
municipalities rather often (but not always) have provided additional resources to either
fully or partially finance 1:1 programs.
For methodological reasons, we have focused the empirical analysis on the time period
when 1:1 initiatives are first introduced at the schools and the subsequent 1–5 semesters.
This gives us the best opportunities to identify causal effects. The downside is that the
effects may change when the schools have used 1:1 for a while. It is reasonable to assume
that it takes some time to find out how to best use the technology. Over time, initial
problems can perhaps be solved, appropriate software can be identified, teachers will
accumulate experience and perhaps receive adequate training. Thus, it is possible that
effects will become more positive over time. One should note, however, that we do not
find that students who have been exposed to a 1:1 program for more than two semesters
outperform those with less exposure.
All in all, the absence of positive impacts on student performance should not
necessarily be interpreted as a clear signal that it is a bad strategy for schools to invest in
1:1. At the same time, our findings point at some potential pitfalls, and it is obvious that
providing students with personal computers is unlikely to be a quick fix that improves
educational outcomes in general.

34 IFAU – A laptop for every child?
References
Angrist, J. and V. Lavy (1999), “Using Maimonide’s rule to estimate the effect of class
size on scholastic achievement”, Quarterly Journal of Economics 114(2): 533-575.
Angrist, J. and V. Lavy (2002), “New evidence on classroom computers and pupil
learning”, The Economic Journal 112(482): 735–765.
Banerjee, A., S. Cole, E. Duflo and L. Linden (2005), “Remedying education: Evidence
from two randomized experiments in India”, Quarterly Journal of Economics
122(3): 1235–1264.
Beland, L. P. and R. Murphy (2016), “Ill communicaton: Technology, distraction and
student performance”, Labour Economics 41(1): 61–76.
Beuermann, D. W., J. P. Cristia, S. Cueto, O. Malamud and Y. Cruz-Aguayo (2015),
“One laptop per child at home: Short-term impacts from a randomized experiment in
Peru”, American Economic Journal: Applied Economics 7(2): 53–80.
Bulman, G. and R. W. Fairlie (2016), “Technology and education: Computers, software,
and the internet” in Hanushek, E. A., S. Machin and L. Woessman (eds.), Handbook
of the Economics of Education, Elsevier, Amsterdam.
Böhlmark, A., H. Holmlund and M. Lindahl (2016), ”Parental choice, neighbourhood
segregation or cream skimming? An analysis of school segregation after a generalized
choice reform”, Journal of Population Economics 29(4): 1155–1190.
Carter, S. P., K. Greenberg and M. Walker (2017), “The impact of computer usage on
academic performance: Evidence from a randomized trial at the United States Military
Academy”, Economics of Education Review 56: 118–132.
Chatterji, A. K. (2018), “Innovation and American K–12 education”, Innovation Policy
and the Economy 18: 27–51.
Cristia, J. P., P. Ibarraran, S. Cueto, A. Santiago and E. Severin (2012), “Technology and
child development: Evidence from the one laptop per child program”, IDB Working
Paper Series No. IDB-WP-304, Inter-American Development Bank.
de Melo, G., A. Machado and A. Miranda (2014), “The Impact of a One Laptop per Child
Program on Learning: Evidence from Uruguay”, IZA Discussion paper No. 8489.
IFAU – A laptop for every child? 35
Danielsson, H. (2015), ”Förbättra resultaten i skolan genom att kasta ut datorerna från
lektionerna”, DN Debatt, Dagens Nyheter, 17 April. Available at:
http://www.dn.se/debatt/forbattra-resultaten-i-skolan-genom-att-kasta-ut-datorerna-
fran-lektionerna/ (accessed 8 March 2017).
Escuela, M., V. Quan, A. J. Nickow och P. Oreopoulos (2017), ”Education technology:
An evidence-based review”, NBER Working Paper 23744, National Bureau of
Economic Research, Cambridge.
Fredriksson, P., H. Oosterbeek and B. Öckert (2013), ”Long-term effects of class size”;
Quarterly Journal of Economics 128: 249–85.
Fredriksson, P., H. Oosterbeek and B. Öckert (2016), “Parental responses to public
investments in children: Evidence from a maximum class size rule”, Journal of Human
Resources, 51(4): 832-868.
Goolsbee, A. and J. Guryan (2006), “The impact of internet subsidies in public schools”,
Review of Economics and Statistics 88(2): 336–347.
Grönlund, Å. (2014), Att förändra med teknik: Bortom ”en dator per elev”, Örebro
University, Örebro.
Grönlund, Å., A. Andersson and M. Wiklund (2014), ”Unos uno årsrapport 2013”,
Örebro University, Örebro.
Haelermans, C. (2017), Digital tools in education. On usage, effect and the role of the
teacher, SNS Förlag, Stockholm.
Hanushek, E. A. (1986), “The economics of schooling: Production and efficiency in
public schools”, Journal of Economic Literature 24(3): 1141–1177.
Hatakka, M., A. Andersson & and Å. Grönlund (2013), ”Students’ use of one to one
laptops: a capability approach analysis”, Information Technology & People 26(1): 94–
112.
Hull, M. and K. Duch (2018), “One-to-One technology and student outcomes: evidence
from Mooresville’s digital conversion initiative”, Educational Evaluation and Policy
Analysis, DOI:10.3102/0162373718799969
36 IFAU – A laptop for every child?
Islam, M. S. and Å. Grönlund (2016), ”An international literature review of 1:1
computing in schools”, Journal of Educational Change 17: 191–222.
Krueger, A. and D. Whitmore, “The Effect of Attending a Small Class in the Early Grades
on College-Test Taking and Middle School Test Results: Evidence from Project
STAR”, The Economic Journal Vol. 111, No. 468: 1-28.
Leuven, E., M. Lindahl, H. Oosterbeek and D. Webbink (2007), “The effect of extra
funding for disadvantaged pupils on achievement”, Review of Economics and Statistics
89(4): 721–736.
Lindgren, K. (2011), ”Datorn – fälla eller frälsare?”, Lärarnas Tidning, 1 December.
Available at: http://lararnastidning.se/datorn-falla-eller-fralsare/ (accessed 8 March
2017).
Machin, S., S. McNally and O. Silva (2007), “New technology in schools: Is there a
payoff?”, Economic Journal 117: 1145–1167.
Mueller, P. A. and D. M. Oppenheimer (2014), ”The pen is mightier than the keyboard.
Advantages of longhand over laptop note taking”, Psychological Science 25(6): 1159–
1168.
Molin, L. and A. Lantz-Andersson (2016), “Significant structuring resources in the
reading practices of a digital classroom”, Journal of Information Technology
Education: Research 15: 131–156.
National Agency for Education (2016a), IT-användning och IT-kompetens i skolan.
Skolverkets IT-uppföljning 2015, Skolverket (National Agency for Education),
Stockholm.
National Agency for Education (2016b), Redovisning av uppdraget om att föreslå
nationella IT-strategier för skolväsendet, Skolverket (National Agency for Education),
Stockholm.
National Agency for Education (2017), ”Skolor och elever i grundskolan läsåret
2016/17”, The Internet homepage of the National Agency for Education,
https://www.skolverket.se/statistik-och-utvardering/statistik-i-tabeller/
grundskola/skolor-och-elever/skolor-och-elever-i-grundskolan-lasaret-2016-17-
1.258586

IFAU – A laptop for every child? 37
Sana, F., W. Tina and N. J. Cepeda (2013), “Laptop multitasking hinders classroom
learning for both users and nearby peers”, Computers & Education 62: 24–31.
Swedish Government (2017), “Nationell digitaliseringsstrategi för skolväsendet”, Bilaga
till regeringsbeslut I:1, 2017-10-19, Utbildningsdepartementet, Stockholm.
Tallvid, M. (2015), 1:1 i klassrummet – analyser av en pedagogisk praktik i förändring,
University of Gothenburg, Gothenburg.
Thurfjell, K. (2017), “Brittisk expert: Barn lär sig sämre med digitala hjälpmedel”,
Svenska Dagbladet, 1 March. Available at: https://www.svd.se/brittisk-expert-barn-
lar-sig-inte-med-digitala-hjalpmedel/om/sverige (accessed 8 March 2017).
Zheng, B., M. Warschauer, C. Lin and C. Chang (2016), ”Learning in one-to-one laptop
environments: A meta-analysis and research synthesis”, Review of Educational
Research 86(4): 1052–1084.

38 IFAU – A laptop for every child?
Appendix A: Description of the data collection
To identify schools with and without 1:1 programs, we collected information through a
short survey with all lower secondary schools in 26 Swedish municipalities. The survey
took place during the period June 2016 to March 2017.
To be able to analyze effects of 1:1, we needed a relatively large number of schools
that had implemented 1:1 programs. We therefore consulted local newspapers and various
internet sources (e.g. municipality homepages) to identify municipalities where 1:1 was
especially common. We selected 13 such municipalities located in different parts of
Sweden. We also made sure to get a good spread in terms of population size and
educational level. For each of the 13 municipalities selected in the first step, we selected
another municipality with similar observable characteristics but with no prior information
(from internet sources) of 1:1 programs being more common than elsewhere. Table A1
shows that the two groups of municipalities are fairly similar. In comparison to the
Swedish average, the municipalities included in the sample have more inhabitants and a
somewhat more well-educated population. Note that the sampling method implies that
our data cannot be used to give a reliable description of the existence of 1:1 programs in
Sweden over time.
We collected e-mail addresses and telephone numbers to all existing schools in the 26
municipalities from internet homepages. Both public schools and independent schools
were included in the sample. A very small number of schools were excluded at this stage,
for instance, schools in rural areas having only a couple of pupils in grade 7–9 and schools
for children with diagnoses like Autism or Asperger syndrome. Note that our data cover
schools that existed in 2016. This means that schools that have been closed down between
2008 and 2015 are not included in the sample; collecting information from these schools
would basically have been an impossible task.

IFAU – A laptop for every child? 39
Table A1 Selection of municipalities Municipality Indication in
advance of frequent
existence of 1:1
Part of Sweden
Population (2008)
Average grades in grade 9 (2008)
Municipal educational level, inhabitants aged 25–64 (2008)
Elementary education or
less (%)
Post-secondary
education (%) Small (less than 25,000 inhabitants)
Haparanda Yes Norrland 10,112 224 18.8 20.1 Pajala No Norrland 6,429 224 13.0 22.6 Nykvarn Yes Svealand 9,035 213 16.5 29.3 Vaxholm No Svealand 10,747 213 9.8 48.3 Gagnef Yes Svealand 10,107 212 15.2 26.8 Leksand No Svealand 15,288 214 13.9 31.4 Stenungsund Yes Götaland 23,657 217 14.5 34.6 Höganäs No Götaland 24,248 212 13.2 38.7
Middle size (25,000–99,999 inhabitants)
Ljungby Yes Götaland 27,430 207 17.4 26.5 Oskarshamn No Götaland 26,309 200 18.3 26.6 Hudiksvall Yes Norrland 36,905 213 17.8 27.6 Söderhamn No Norrland 25,987 210 18.6 22.4 Falkenberg Yes Götaland 40,451 205 20.0 25.6 Trelleborg No Götaland 41,558 205 18.2 27.1 Sollentuna Yes Svealand 62,097 221 10.1 51.2 Solna No Svealand 65,289 211 9.6 53.3 Skellefteå Yes Norrland 71,862 209 11.9 32.6 Östersund No Norrland 58,914 215 11.2 40.9 Botkyrka Yes Svealand 80,055 205 23.0 28.9 Haninge No Svealand 74,968 200 19.3 26.9 Växjö Yes Götaland 81,074 214 12.3 42.5 Karlstad No Götaland 83,994 211 11.4 43.1
Large (at least 100,000 inhabitants)
Malmö Yes Götaland 286,535 201 14.6 43.0 Uppsala No Svealand 190,668 213 10.7 52.9 Västerås Yes Svealand 134,468 209 13.8 39.5 Norrköping No Götaland 128,060 207 17.5 32.1 Averages: Indication of 1:1 67,241 212 15.8 32.9 No indication of 1:1 57,881
210 14.3 35.9
All Swedish municipalities
31,918 209 17.8 28.2
Notes: Data on population, grades and educational level have been retrieved from Kolada (www.kolada.se). Kolada is a database with official statistics on Swedish regions and municipalities. Part of Sweden refers to a traditional division of three Swedish geographical regions: Norrland (North), Svealand (Middle) and Götaland (South). These regions have no administrative function.
A short questionnaire was sent by e-mail to the schools. They were asked about the
existence of 1:1: Did the school have a 1:1 program? What grades were affected at

40 IFAU – A laptop for every child?
different points in time between the fall semester of 2008 and the spring semester of 2016?
Were pupils provided with a laptop or a tablet? This information made it possible for us
to construct a panel dataset, based on schools, grades and semesters 2008–2016. We also
asked whether the school had a documented plan for how teachers should integrate 1:1
computers in their daily work in the classroom, and whether the school had a documented
plan for how teachers should be trained in how to use the new technology. However, we
only have information about the presence of these plans at the time when the survey took
place.
The initial e-mail was followed up by two e-mail reminders. If the school did not reply
within 14 days, we instead contacted them by phone. In the end, we received data from
219 of 299 schools. This implies a good overall responses rate of 73 percent. In 2016,
grade 7 existed in 216 schools, grade 8 in 211 schools and grade 9 in 209 schools. For
various reasons, 168 schools are used in our empirical analysis (see Section 4).
Table A2 shows that laptop programs existed in around half of the schools in our
sample in grade 7–9 in 2016. Tablets were used by 15 percent of the schools in grade 7,
17 percent in grade 8 and 19 percent in grade 9. The development over time is displayed
in Figure A1 (laptops) and Figure A2 (tablets). Laptops are more common than tablets all
years, but the increase in 1:1 programs after 2012 is to a large extent driven by schools
providing tablets to their pupils.
Table A2 Schools in the sample with 1:1 programs in 2016 Grade Number of schools Schools with laptop programs Schools with tablet programs
Number Percent Number Percent 7
216 109 50 42 19
8
211 105 50 36 17
9 209 106 51 32 15
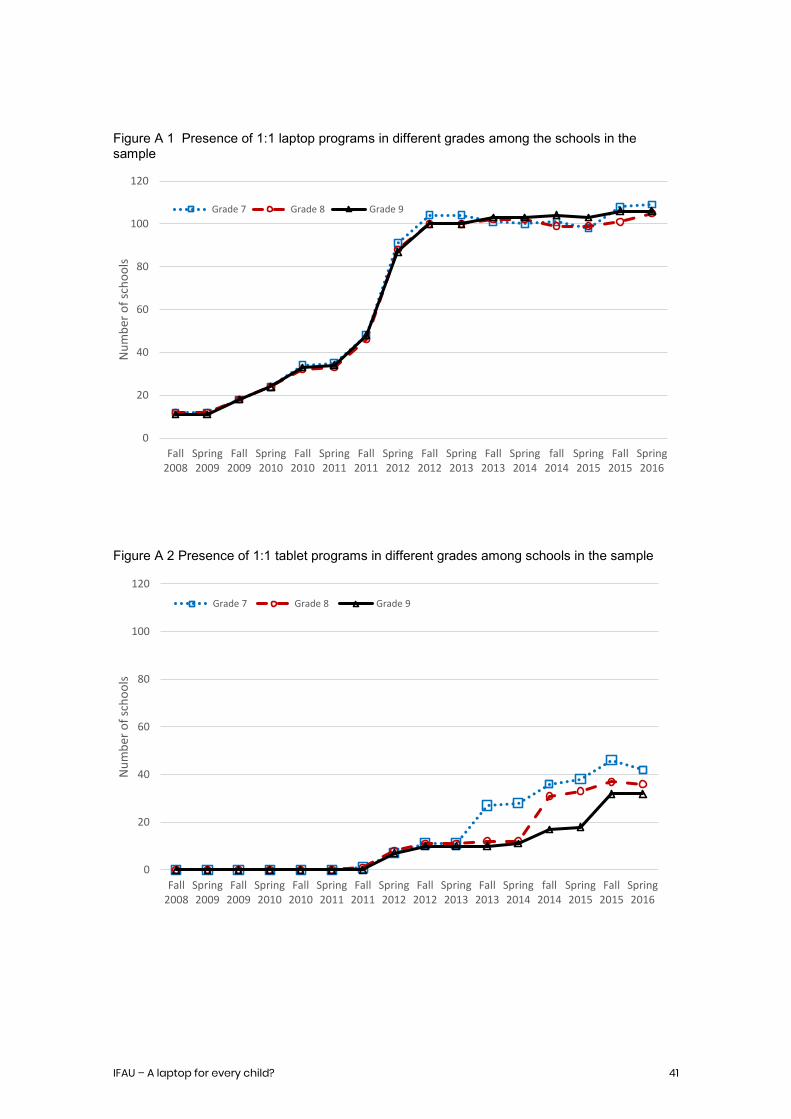
IFAU – A laptop for every child? 41
Figure A 1 Presence of 1:1 laptop programs in different grades among the schools in the sample
Figure A 2 Presence of 1:1 tablet programs in different grades among schools in the sample
0
20
40
60
80
100
120
Fall2008
Spring2009
Fall2009
Spring2010
Fall2010
Spring2011
Fall2011
Spring2012
Fall2012
Spring2013
Fall2013
Spring2014
fall2014
Spring2015
Fall2015
Spring2016
Num
ber o
f sch
ools
Grade 7 Grade 8 Grade 9
0
20
40
60
80
100
120
Fall2008
Spring2009
Fall2009
Spring2010
Fall2010
Spring2011
Fall2011
Spring2012
Fall2012
Spring2013
Fall2013
Spring2014
fall2014
Spring2015
Fall2015
Spring2016
Num
ber o
f sch
ools
Grade 7 Grade 8 Grade 9
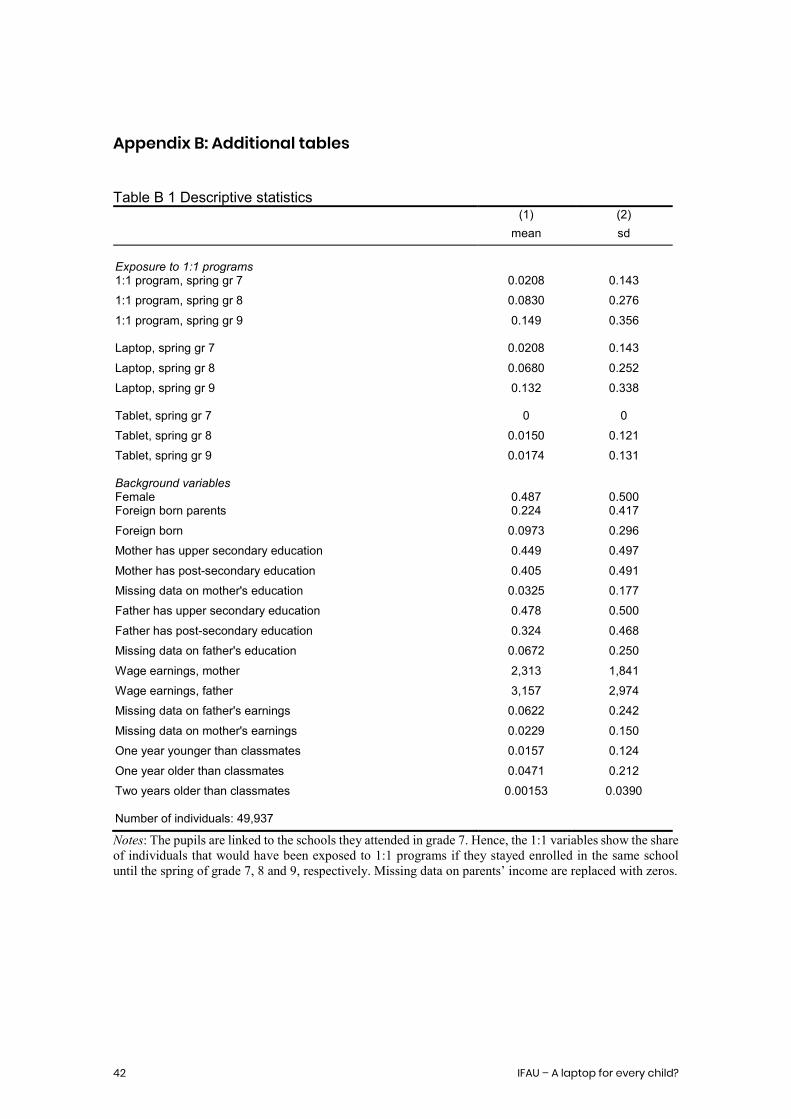
42 IFAU – A laptop for every child?
Appendix B: Additional tables
Table B 1 Descriptive statistics (1) (2) mean sd Exposure to 1:1 programs
1:1 program, spring gr 7 0.0208 0.143 1:1 program, spring gr 8 0.0830 0.276 1:1 program, spring gr 9 0.149 0.356
Laptop, spring gr 7 0.0208 0.143 Laptop, spring gr 8 0.0680 0.252 Laptop, spring gr 9 0.132 0.338
Tablet, spring gr 7 0 0 Tablet, spring gr 8 0.0150 0.121 Tablet, spring gr 9 0.0174 0.131
Background variables Female
0.487
0.500
Foreign born parents 0.224 0.417 Foreign born 0.0973 0.296 Mother has upper secondary education 0.449 0.497 Mother has post-secondary education 0.405 0.491 Missing data on mother's education 0.0325 0.177 Father has upper secondary education 0.478 0.500 Father has post-secondary education 0.324 0.468 Missing data on father's education 0.0672 0.250 Wage earnings, mother 2,313 1,841 Wage earnings, father 3,157 2,974 Missing data on father's earnings 0.0622 0.242 Missing data on mother's earnings 0.0229 0.150 One year younger than classmates 0.0157 0.124 One year older than classmates 0.0471 0.212 Two years older than classmates 0.00153 0.0390
Number of individuals: 49,937
Notes: The pupils are linked to the schools they attended in grade 7. Hence, the 1:1 variables show the share of individuals that would have been exposed to 1:1 programs if they stayed enrolled in the same school until the spring of grade 7, 8 and 9, respectively. Missing data on parents’ income are replaced with zeros.

IFAU – A laptop for every child? 43
Table B 2 Effects of 1:1 programs by parental education. Separate regressions for students’ whose parents have a high vs. low level of education (1) (2) High level of
education Low level of education
A: Mathematics
No. of semesters with ICT program 0.006 -0.020 (0.011) (0.013) Observations 23,772 20,707 R-squared 0.149 0.093
B: Swedish
No. of semesters with ICT program 0.006 -0.014 (0.009) (0.011) Observations 24,262 21,485 R-squared 0.197 0.159
C: English
No. of semesters with ICT program 0.011 -0.009 (0.008) (0.010) Observations 24,196 21,112 R-squared 0.133 0.100 D: Admitted to upper secondary school (any regular program) No. of semesters with ICT program 0.002 -0.004 (0.003) (0.004) Observations 25,523 23,667 R-squared 0.075 0.126
E: Admitted to college-preparatory program No. of semesters with ICT program 0.004 -0.004 (0.005) (0.004) Observations 25,523 23,667 R-squared 0.112 0.115
Notes: High level of education is defined as at least one parent with post-secondary education; low level of education is defined as no parent with post-secondary education. Students’ test results (grades) are standardized within cohort to have mean 0 and a standard deviation 1. All regressions control for school and cohort fixed effects as well as all covariates presented in Table 3. Robust standard errors in parentheses, clustered on schools.*** p<0.01, ** p<0.05, * p<0.1.

44 IFAU – A laptop for every child?
Table B 3 Placebo estimates by parental education (1) (2) (3) (4) (5) Math Swedish English Reg.program College-prep. A. Placebo analysis, t-1
Placebo estimate -0.012 -0.001 0.008 0.001 -0.001 (0.010) (0.010) (0.008) (0.002) (0.004) Placebo estimate* 0.012 0.008 0.004 0.001 0.006 low educated parents (0.012) (0.012) (0.009) (0.003) (0.005) Observations 95,211 97,217 96,652 104,453 104,453 R-squared 0.177 0.211 0.174 0.123 0.190
B. Placebo analysis, t-2
Placebo estimate -0.013* -0.012 -0.005 -0.002 -0.000 (0.007) (0.008) (0.006) (0.002) (0.004) Placebo estimate* 0.017** 0.013* 0.007 0.000 0.002 low educated parents (0.008) (0.008) (0.006) (0.002) (0.003) Observations 89,148 91,032 90,561 97,888 97,888 R-squared 0.176 0.210 0.173 0.122 0.188
Notes: The model estimated is the same as in Table 9, but where the treatment is (artificially) defined to have taken place one year (panel A) or two years (panel B) before actual program start. Students’ test results (grades) in col. 1-3 are standardized within cohort to have mean 0 and a standard deviation 1. All regressions control for school and cohort fixed effects as well as all covariates presented in Table 3. Robust standard errors in parentheses, clustered on schools. *** p<0.01, ** p<0.05, * p<0.1. Table B 4 Placebo estimates: laptops vs. tablet programs (1) (2) (3) (4) (5) Math Swedish English Reg.program College-prep. A. Placebo analysis, t-1
Placebo estimate 0.003 0.006 0.011 0.001 0.005 laptop program (0.012) (0.010) (0.010) (0.003) (0.005)
Placebo estimate -0.029 -0.005 0.007 0.003 -0.006 tablet program (0.023) (0.017) (0.016) (0.003) (0.006) Observations 95,211 97,217 96,652 104,453 104,453 R-squared 0.177 0.211 0.174 0.123 0.190
B. Placebo analysis, t-2
Placebo estimate -0.003 -0.006 0.000 -0.000 0.001 laptop program (0.008) (0.008) (0.006) (0.003) (0.005) Placebo estimate -0.010 -0.006 -0.007 -0.008** -0.002 tablet program (0.013) (0.016) (0.007) (0.004) (0.004) Observations 89,159 91,044 90,573 97,900 97,900 R-squared 0.176 0.210 0.173 0.122 0.188
Notes: The model estimated is the same as in Table 10, but where the treatment is (artificially) defined to have taken place one year (panel A) or two years (panel B) before actual program start. Students’ test results (grades) in col. 1-3 are standardized within cohort to have mean 0 and a standard deviation 1. All regressions control for school and cohort fixed effects as well as all covariates presented in Table 3. Robust standard errors in parentheses, clustered on schools. *** p<0.01, ** p<0.05, * p<0.1.
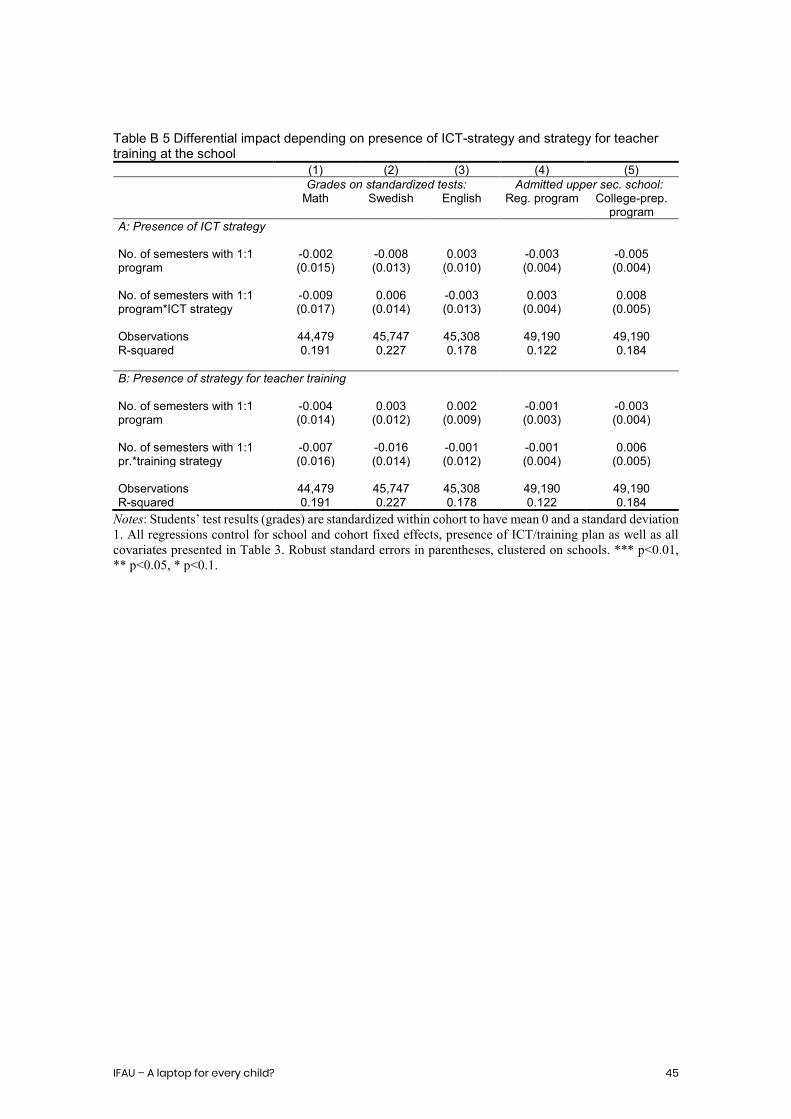
IFAU – A laptop for every child? 45
Table B 5 Differential impact depending on presence of ICT-strategy and strategy for teacher training at the school (1) (2) (3) (4) (5) Grades on standardized tests: Admitted upper sec. school: Math Swedish English Reg. program College-prep.
program A: Presence of ICT strategy
No. of semesters with 1:1 -0.002 -0.008 0.003 -0.003 -0.005 program (0.015) (0.013) (0.010) (0.004) (0.004) No. of semesters with 1:1 -0.009 0.006 -0.003 0.003 0.008 program*ICT strategy (0.017) (0.014) (0.013) (0.004) (0.005) Observations 44,479 45,747 45,308 49,190 49,190 R-squared 0.191 0.227 0.178 0.122 0.184 B: Presence of strategy for teacher training
No. of semesters with 1:1 -0.004 0.003 0.002 -0.001 -0.003 program (0.014) (0.012) (0.009) (0.003) (0.004) No. of semesters with 1:1 -0.007 -0.016 -0.001 -0.001 0.006 pr.*training strategy (0.016) (0.014) (0.012) (0.004) (0.005) Observations 44,479 45,747 45,308 49,190 49,190 R-squared 0.191 0.227 0.178 0.122 0.184
Notes: Students’ test results (grades) are standardized within cohort to have mean 0 and a standard deviation 1. All regressions control for school and cohort fixed effects, presence of ICT/training plan as well as all covariates presented in Table 3. Robust standard errors in parentheses, clustered on schools. *** p<0.01, ** p<0.05, * p<0.1.
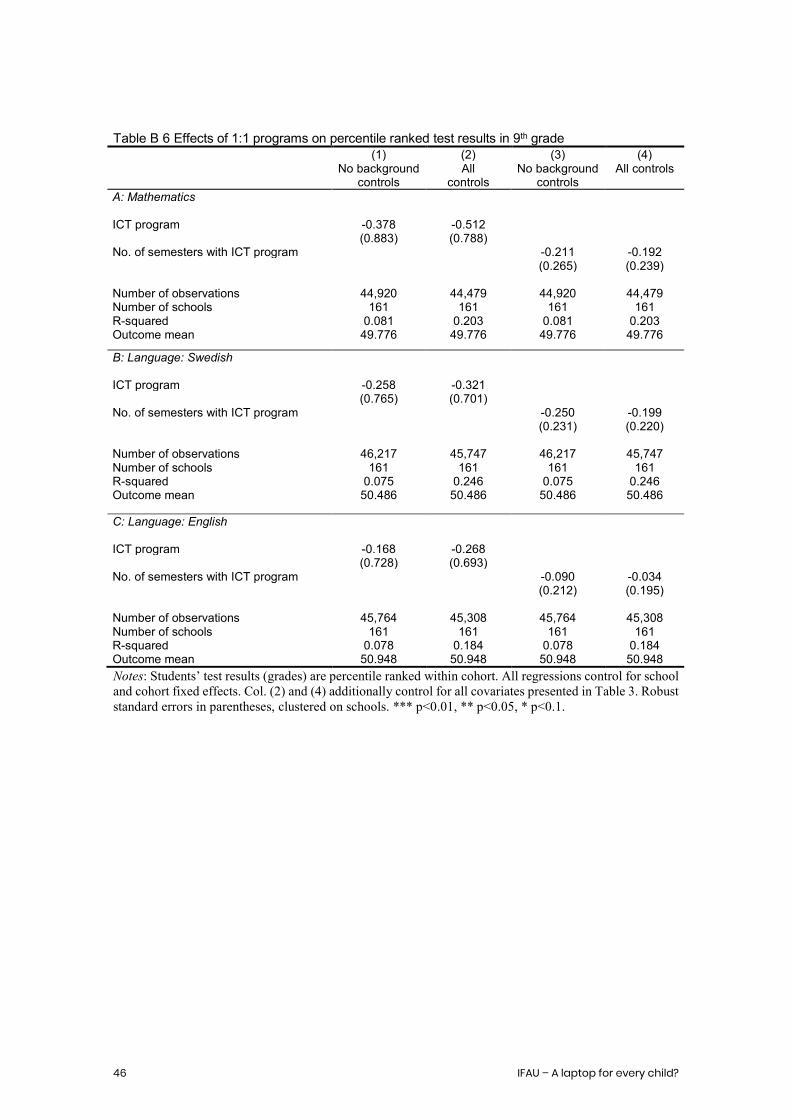
46 IFAU – A laptop for every child?
Table B 6 Effects of 1:1 programs on percentile ranked test results in 9th grade (1) (2) (3) (4) No background
controls All
controls No background
controls All controls
A: Mathematics
ICT program -0.378 -0.512 (0.883) (0.788) No. of semesters with ICT program -0.211 -0.192 (0.265) (0.239) Number of observations 44,920 44,479 44,920 44,479 Number of schools 161 161 161 161 R-squared 0.081 0.203 0.081 0.203 Outcome mean 49.776 49.776 49.776 49.776
B: Language: Swedish ICT program
-0.258
-0.321
(0.765) (0.701) No. of semesters with ICT program -0.250 -0.199 (0.231) (0.220) Number of observations 46,217 45,747 46,217 45,747 Number of schools 161 161 161 161 R-squared 0.075 0.246 0.075 0.246 Outcome mean 50.486 50.486 50.486 50.486
C: Language: English
ICT program -0.168 -0.268 (0.728) (0.693) No. of semesters with ICT program -0.090 -0.034 (0.212) (0.195) Number of observations 45,764 45,308 45,764 45,308 Number of schools 161 161 161 161 R-squared 0.078 0.184 0.078 0.184 Outcome mean 50.948 50.948 50.948 50.948 Notes: Students’ test results (grades) are percentile ranked within cohort. All regressions control for school and cohort fixed effects. Col. (2) and (4) additionally control for all covariates presented in Table 3. Robust standard errors in parentheses, clustered on schools. *** p<0.01, ** p<0.05, * p<0.1.

IFAU – A laptop for every child? 47
Table B 7 Effects of 1:1 programs on percentile ranked test results by parental education (1) (2) (3) A: Grades on standardized test Math Swedish English No. of semesters with ICT program 0.059 -0.008 0.005 (0.273) (0.264) (0.222) No. of semesters with ICT program* -0.515** -0.387* -0.082 low educated parents (0.241) (0.226) (0.229) Observations 44,479 45,747 45,308 R-squared 0.203 0.246 0.184 Outcome mean 49.776 50.486 50.948
Notes: Low level of parental education is defined as no parent with post-secondary education. Students’ test results (grades) are percentile ranked within cohort. All regressions control for school and cohort fixed effects as well as all covariates presented in Table 3. Robust standard errors in parentheses, clustered on schools.*** p<0.01, ** p<0.05, * p<0.1. Table B 8 Effects of 1:1 laptop vs. tablet programs on percentile ranked test results
(1) (2) (3) Math Swedish English
No. of semesters with laptop program -0.120 -0.045 0.063 (0.250) (0.239) (0.213) No. of semesters with tablet program -0.650 -1.178*** -0.669** (0.506) (0.344) (0.322) Observations 44,479 45,747 45,308 R-squared 0.203 0.246 0.184 Outcome mean 49.769 50.492 50.948 Notes: Students’ test results (grades) are percentile ranked within cohort. All regressions control for school and cohort fixed effects as well as all covariates presented in Table 3. Robust standard errors in parentheses, clustered on schools. *** p<0.01, ** p<0.05, * p<0.1.


![NYT 11.30.06[1] - One Laptop per Childwiki.laptop.org/images/2/2c/NYT_11.30.06-1-.pdfOne Laptop per Child Michail Bletsas, the chief connectivity officer for One Laptop Per Child,](https://img.pdfslide.us/doc/110x75/608d6f1f213fc96cc6768bab/nyt-1130061-one-laptop-per-one-laptop-per-child-michail-bletsas-the-chief.jpg)