Embed Size (px)
Citation preview

A KINEMATIC MODEL OP SURFACE RUNOFF RESPONSE:“
D. E. OVERTON and D. L. BRAKENSIEK““
SUMMARY
Henderson and Wooding [1]*** and Wooding [2] proposed a kinematic model of surface runoff of a V-shaped watershed. They applied their results to natural watersheds and obtained good agreement with the observed runoff hydrographs. A kinematic surface runoff model similar to that developed by Henderson and Wooding will be developed in this report. This new model was formulated for a specific Agricultural Research Service experimental watershed. The solution of the watershed hydrograph for a steady rainfall excess rate of a long duration is shown in general dimensionalized form in terms of the physical and hydraulic characteristics of the overland flow plane and the stream channel. These results were used to demonstrate a sensitivity analysis of the effects that errors in model parameters have on the computed outflow from the watershed. The results were used to simulate a relation between storm lag time and rainfall excess rate (response curve), and these computed results were compared with the much used lumped, linear models of watershed runoff.
RÉSUMÉ
UN MODELE CINEMATIQUE DE LA REPONSE DE LY~coULEMENT SUPERFICIEL Henderson et Wooding ainsi que Wooding ont proposé un modele cinématique de l’écoulement superficiel d’un bassin en forme de V. Ils appliquèrent leurs résultats à des bassins naturels et ils obtinrent une bonne concordance avec les hydrogrammes d’écoulement observés. Un modèle cinématique d’écoulement superficiel analogue à celui développé par Henderson et Wooding sera présenté dans ce rapport. Le nouveau modèle a été établi pour un bassin spécifique de 1’Agriculturai Research Service. La soldion de I’bydrogramme du bassin pour une pluie perma- nente de taux excessif de longue durée est montrée dans une forme générale dimensionalisée en utilisant les caractéristiques physiques et hydrauliques de l’écoulement superficiel sur le bassin et dans le chenal de ia rivière. Ces résultats furent utilisés pour montrer une analyse des effets que les erreurs sur les paramètres du modèle produisent sur la valeur calculée du débit du bassin. Les résultats furent aussi utilisés pour simuler une relation entre le temps de décalage de l’averse et le taux d’excès de la pluie (temps de réponse) et ces résultats computés furent comparés avec ceux des modèles plus courants, linéaires de l’écoulement des bassins.
K~NEMATIC WAVE APPROXIMATION
The equations of continuity and momentum are written as
aQ ay -+-=q, ax at
* Contribution from the Soil and Water Conservation Research Division, Agricultural Research Service, U.S. Department of Agriculture, Beltsville, Maryland, USA.
+* Research Hydraulic Engineer, USDA Hydrograph Laboratory and Chief Engineer, soil and Water Conservation Rcs. Div., Bcltsville, Md. respectively. Italic Numbers in brackets refer to Literature cited.
1 O0 1.100

A ltinemntic tnodei of srirfuce rinioff response
where:
Q y V g x t S q, &,
is discharge in cfs/ft width; is mean depth of flow in ft; is mean velocity of ñow in ft/sec; is gravitational acceleration in ft/sec2; is space coordinate in ft; is time coordinate in sec; is slope of the channel or overland flow plane; is lateral inflow in cfs/ft width/ft length, and is normal flow in cfs/ft width.
If the dynamic terms in the radical are very small relative to the slope of the plane
then the momentum equation reduces to
Q = Qn (4) Normal flow would be described by either the Chezy or Manning formula.
Woolhiser and Liggett [3] determined where Condition 3 was theoretically applicable for a uniform plane and a steady-uniform rainfall of a long duration. The criterion for theoretical validity of the kinematic wave approximation was the value of the index parameter IC which evolved from the normalization process of the flow equations prior to their solution, i.e.
where: L yo S Fo
They found that for values of IC of 10, the maximum error due to neglecting the dynamic terms was approximately 10% and decreased very rapidly as k was increased. By substituting the Froude number Fi = Vi/gyo and utilizing the Manning equation, equation (5) can be expressed in terms of rain rate, i, in inches per hour, and in terms of the Manning resistance coefficient, M, as
is the length of the plane; is the depth of flow at equilibrium at the end of the plane; is the slope of the plane, and is the Froude number at equilibrium at the end of the plane.
Large value of IC wouId hence be likely for long, steep, rough planes with low lateral inflow rates. These are events of hydrologic importance, particularly in upland rural watersheds. In general terms, equation (4) can be written
Q = fiy"' (7) where a and rn can be correlated with terms in the resistance formula used. Using the inethod of characteristics, Henderson and Wooding [i] have shown that the solution of equations (2) and (7) is
Q =fi(clO" (8)
1.101 101

D. E. Overton und Brukensielc
and the dimensionless form of equation (8) derived by Woolhiser and Ligett [3] was
Q* = t* (9) where
Q, is discharge normalized by the steady input or equilibrium rate and
t t, = -
tc
where t, is time to equilibrium defined as
and Va is steady state velocity at x = L, the end of the plane. The characteristic solution equation (8) was compared with over 200 overland flow hydrographs by Overton [4]. These hydrographs were collected by the Corps of Engineers [5] and were generated from artificial rainfall at steady-uniform rates on plots up to 500 feet (152.4 m) in length with slopes ranging from 0.005 to 0.02. The surfaces were formed by concrete and artificially roughened in an attempt to simulate the natural roughness of thick turf. Steady rain rates were applied between 0.50 and 8.0 inches per hour (1.27 and 20.32 cm/hr).
The lowest k index value was 26.3, which resulted for a rain rate of 8.0 inches per hour (20.32 cm/hr) over 84 feet (26.6 m) on a concrete surface sloped at 0.005. Although the theoretical validity of the kinematic solution was established, this did not prove that the solution was correct, only that the dynamic terms were negligible. The main problem with testing the solution on the real data was the errors that would be induced in extracting time of equilibrium from the hydrographs. To avoid such errors, the lag time that was derived by Overton [6] was used.
t
FIGURE 1. Deriuation of Zag time (50% of input to 50% of output)
Consider the typical equilibrium hydrograph in figure 1. MI' and MV locate the time of occurrence of 50% of rainfall and runoff respectively, and tL is the time lag between these points. In figure 1, the volumes
I+II = IIJrIII (12)
102 1.102

A kinematic niadelel of siirface runoff response
and therefore volume I = III (13)
It is also apparent that volume I is the average depth of water stored at steady conditions or at equilibrium, S,. Then, finally
As the steady state is approached the transient term in equation (1) vanishes. The solution for average depth of equilibrium storage, So), was found by combining the Manning formula with continuity equation, integrating to obtain the depth profile, and integrating again to obtain the average depth at equilibrium.
nLi o.6 L S, = I J y(x)dx = 0..58(3)
L o
Then, by combining equation (14) with equation (15),
0.58 nL o.6 t L = F ( > )
where t, will be in minutes. A solution for time to equilibrium, te, was similarly obtained and revealed that
t, = 1.60 tL (17)
Therefore, the timelag between 50% input and 50% output was measured from the overland ñow hydrographs and used to normalize the time scale. A single dimensionless hydrograph resulted. This was also reported by the Corps of Engineers [5]. The kinematic wave solution using both the Manning and the Chezy resistance relations is shown in figure 2 with the observed dimensionless hydrograph of rise. The Manning relation produced an overall standard error of 15%, as compared to a 19% standard error for the Chezy solution. Most of the error for both solutions is in the early phase of runoff, and as shown, the theoretical time of equilibrium is a near-perfect predictor of the observed time of equilibrium.
In summary, for overland flow dala or for flows in wide rectangular channels with steady uniform inputs of long durations, the kinematic wave solution to surface runoff is theoretically correct. And, the tests performed by Overton [4] provide the level of accuracy that can be achieved by this approximation.
APPLICATION TO AN EXPERIMENTAL WATERSHED
The kinematic wave approximation will be applied to a particular experimental agri- cultural watershed in a manner similar to the application made by Wooding [2]. The watershed is located near Hastings, Nebraska and is designated as W-3. It is 481 acres (194.65 ha) in size, roughly rectangular, 6000 feet (1829 m) long and 3,500 feet (1067 m) wide. The average slope of the watershed is approximately 0.05 and the average channel slope is approximately 0.005. Most of the watershed has a long record of cultivation. The watershed will be represented schematically as shown in figure 3. Two planes intersect the 30-foot (9.15-m) wide channel. Both catchment planes are assigned the same pliysica and hydraulic characteristics. The component of slope in the downstream direction will be neglected on each plane.
Assuming Manning's n values of 0.05 for the overland plane and 0.02 for the channel, the k index value for each component is
Ic0 = 3823/i,0.8 (18)
1.103 103

D, E. Overton and Brcikensiek
"O .2 .4 .6 .8 1.0 Te q
FIGURE 2. Kinematic wave solutions versus observed rising hydrograph for overland $ow
FIGURE 3. Schematic of Hastings W-3 watershed considered as triangular shape
104 1.104

A kiiiematic model of surface runof response
for overland flow, and
for channel flow.
are i, < 1690 inches/hour (4292 cm/hr)
and i, < 184 inches/hour ( 467 cm/hr). Thus for a long, steady rain excess rate less than 184 inches per hour, the dynamic terms in equation (2) are negligible in both the overland flow and channel flow phases of watershed runoff.
For a steady-uniform rain excess rate of u, in cfs per foot length per foot width of overland flow plane,
k, = 649/iC.8 (19)
Therefore, the limiting rainfall intensities for the overland plane and for the channel
i 43908.48
v, =
Equations (1) and (2) become a4 ay -+-=u, ax at
and q ayIJ>'
The solution of equation (21) and (22) is
4* = (;y where t,, is the time to equilibrium Óf overland flow. Beyond t>te, q* = 1. The input to the stream channel in units of cfs/ft length of channel is
time channel input
o < t d te, t,, < t < Teq
qL = 2VûLû(t/teJrn 2L = 2uoLo
where Tes is the time to equilibrium of the watershed.
2 VOL RAIN RATE /!
L, +eo Te q O
TIME
FIGURE 4. Warerslrsd input, and Iiydrographs of overland and channel Bow
(24)
(25)
1.105 105

D. E. Overtoti aird Brnlcensielc
The inflow and outflow from the channel are shown in figure 4. The dimensionalized output from the channel is derived from the combination of the continuity and depth- discharge relation where equations (24) and (25) are the inputs.
time watershed hydrograph
o < t < te,
t,, d t < Te,
where tec is the equilibrium constant of the channel. The time to equilibrium of the entire watershed, T,, , can be solved for from equation (27) after setting the normalized discharge equal to unity. The solution is
The solution for watershed lag time, T,, is found by combining equation (í7) with equation (29) and dividing by 1.6
Equation (30) coupled with equation (16) now forms a solution of watershed lag time as a function of the dimensions and roughEess of the overland surface and channel, and rain intensity. Since all parameters are assumed to be time-invariant, it follows that equa- tion (16) can be written as a constant times the rain excess term as
(3 1)
(32)
.-0.4 t, = y1 where thc constant, p, is
and p is designated as a lag modulus because it is a real postive number that expresses the lag or surface runoff response of the flow systems in terins of physical quantities for a unit input, il= i.
For overland flow the lag modulus is
and for channel flow, the lag modulus is
where 20 is width of the channel. Now, combining equations (31), (33) and (34) with (30) results in
(33)
(34)
(35)
1.106 106

A ltitieiiiutic model of siirfuce iunoff resporrse
Therefore, the watershed lag modulus, ,uw, is
Pw = P c + (S)P0 and equation (35) can be written
For the Hastings W-3 watershed, the lag moduli for overland flow, channel flow and for the entire watershed were calculated
po = 20.8 minutes, by equation (33) pG = 9.9 minutes, by equation (34) pw = 22.4 minutes, by equation (36)
Variation of the lag or response time with the supply rate has been noticed by a number of investigators who have studied overland €low and watershed runoff. Minshall [7] documented five ~ m i f hydvogvccghs which were observed on a small experimental water- shed that mere produced by short durction storms of varying rain excess intensities. The shapes and peaks of the hydrographs were entirely different. For the Hastings W-3 watershed, and for several other agricultural watersheds, Overton [8] derived significantly different unif hydvogvaphs from a set of complex storms using matrix inversion techniques. Amorocho and Orlob [9], the Corps of Engineers [5], and Overton [4] have made observa- tions of a definite variation of the unit response from overland flow with rainfall intensity. Henderson and Wooding [i] and Wooding [Z] have incorporated this phenomenon into their models.
SIMULATED RESPONSE CURVE
Equation (37) was plottedin figure 5 along with the lag time-rain excess values from storms on the HastinEs W-3 watershed. The simulated curve is in the immediate range of the data. This curve is called a surface runoff response curve because the watershed lag time denotes the response of the system to the input, rain excess rate.
DIMENSIONLESS HYDROGRAPH SOLUTION
The kinematic solution of the watershed hydrograph can be placed in general dimension- less forin. This will permit study of the effects that the lag moduli for overland and channel fiow have on the watershed hydrograph. In order to do this, te, is eliminated from equations (26) and (27) by working equation (29) into the solution. This produced two new equations
time watershed hydrograph
1.107 107

D. E. Overton und Bralcensiek
(XI WATERSHED LAG FROM OBSERVED EVENTS
e 5 0 x ON HASTINGS W-3 ._ E ""Il
SIMULATED FOR HASTINGS W-3
--iii. ---
I 1 I I I 4 6 8 IO
OL O ' 2
i, RAIN EXCESS RATE, idhr.
FIGURE 5. Simulated response curve und observed events on Hustings W-3
.2 .4 .6 .8 1 .o +'Te q
FIGURE 6. Generalized diniensionless kinernutic wuue solution of the watershed hydrograph. Paru- nieter is lag nzodulus ratio
1 OP 1.108

A kinernafic model of surface runoff’ response
Through the introduction of the lag modulus ratio, p*,
f..=-= Ps (40) Teq ~w
and by combining equation (40) with equations (38) and (39), the final form of the dimensionless watershed hydrograph becomes,
time watershed hydrograph
Equations (41) and (42) are plotted in figure 6 showing the effect of the lag modulus ratio. As the ratio approaches zero, the lagging effect of overland flow becomes negligible. Equation (41) drops out and equation (42) becomes the solution,
Q:, -f (tP,,Y” as P* -+ 0 (43)
Rainfall excess would be entered into the channel directly without any delay or attenua- tion. As the lag modulus ratio approaches unity, the channel lagging effect becomes negligible, equation (42) drops out and equation (41) becomes the solution.
QcI* 3 (t/Teq)»12+” as p,+1 (44)
The broken line represents watershed discharge for all values of the time to equilibrium of overland flow relative to time to equilibrium of the watershed. For times less than te,, the watershed discharge is beneath this line, and for times greater than te,, the watershed discharge is above this line. Therefore, for any particular lag modulus ratio, the broken line makes it easy to sketch in the watershed hydrograph. The simulated lag modulus ratio, ,u*, for the Hastings W-3 watershed was 0.93, which was calculated by dividing equation (36) into equation (33).
The theoretical solution also shows little agreement with ,the results that have been obtained by numerous investigators, which has been summarized by Overton [lo] and [6], that watershed hydrographs can be accurately approximated by cascades of 2 to 5 equal linear reservoirs. These models have been shown by Nash [li] to be equivalent to the gamma distribution for a steady input of a long duration. In figure 7, the gamma distribu- tion for 1,lO and an infinite number of reservoirs is superimposed over the curves from figure 6 for lag moduli ratios of O and 1. These two solutions, the kinematic wave and the Nash-type models, show little agreement.
SENSITIVITY ANALYSIS
Figure 6 provides an easy means of examining the sensitivity of the mathematical model to errors in the estimates of the n-value, and to errors in measurement of slope and length of the overland flow planes and the channel. These errors will be reflected in the lag modulus ratio. The solution is within the confines shown in figures 6. Therefore, the maximum error in the watershed hydrograph due to errors in averaging geometry and estimating roughness can be bracketed. In figure 8 the maximum error relative to the
1.109 1 o9

D.E. Ouerton and D.L. Braltensielc
.4
/<OBSERVED .2
/ O I I I I I
O .2 .4 .6 .8 I .o I .2 I .4 I .6 t/t,
FIGURE 7. Comparison of output of lumped linenr (Nash) and nori-linear distributed (kinematic wave) solutions of the watershed rising Jiydrograph
I .o
.6
.6
.4
.2
O
RAIN RATE
x
O .2 .4 .6 .8 I .o +/Teq
FIGURE 8. Maximum expected error .for kinematic solution
110 1.110
A kinematic niodel of surface runoff response
expected value for the Chezy solution is shown. As shown, the maximum error is 16% of the steady uniform rain rate.
Errors in rainfall or rainfall excess are linear with errors in the dimensionless water- shed hydrograph. This is true because superposition can be used in synthesis once the proper lag time is calculatcd for each rain intensity. Therefore, the model is much more sensitive to errors in rainfall than to errors induced by averaging hillslopes and roughness coefficients.
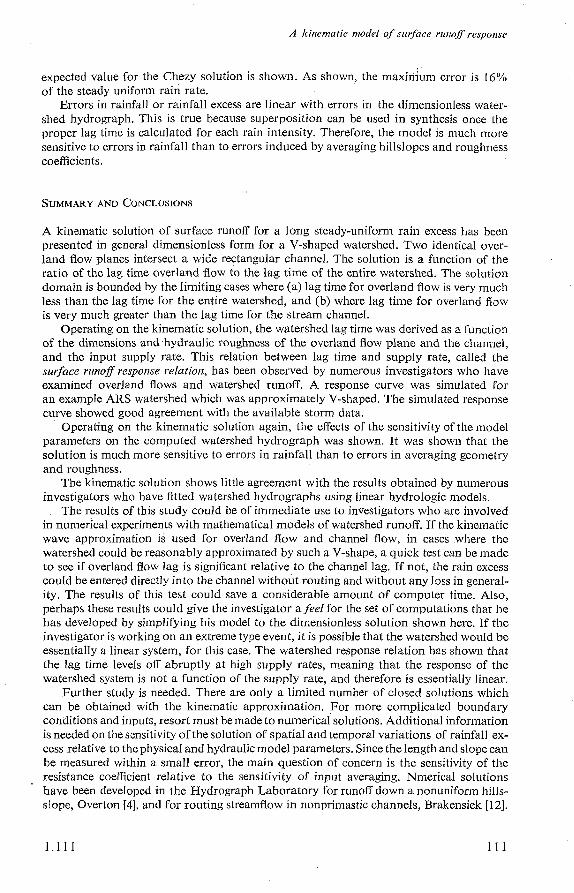
SUMMARY AND CONCLUSIONS
A kinematic solution of surface runoff for a long steady-uniform rain excess has been presented in general dimensionless form for a V-shaped watershed. Two identical over- land flow planes intersect a wide rectangular channel. The solution is a function of the ratio of the lag time overland flow to the lag time of the entire watershed. The solution domain is bounded by the limiting cases where (a) lag time for overland flow is very much less than the lag time for the entire watershed, and (b) where lag time for overland flow is very much greater than the lag time for the stream channel.
Operating on the kinematic solution, the watershed lag time was derived as a function of the dimensions and hydraulic roughness of the overland flow plane and the channel, and the input supply rate. This relation between lag time and supply rate, called the surface runoff response relatiotz, has been observed by numerous investigators who have examined overland flows and watershed runoff. A response curve was simulated for an example ARS watershed which was approximately V-shaped. The simulated response curve showed good agreement with the available storm data.
Operating on the kinematic solution again, the effects of the sensitivity of the model parameters on the computed watershed hydrograph was shown. It was shown that the solution is much more sensitive to errors in rainfall than to errors in averaging geometry and roughness.
The kinematic solution shows little agreement with the results obtained by numerous investigators who have fitted watershed hydrographs using linear hydrologic models.
The results of this study could be of immediate use to investigators who are involved in numerical experiments with mathematical models of watershed runoff, If the kinematic wave approximation is used for overland flow and channel flow, in cases where the watershed could be reasonably approximated by such a V-shape, a quick test can be made to see if overland flow lag is significant relative to the channel lag. If not, the rain excess could be entered directly into the channel without routing and without any loss in general- ity. The results of this test could save a considerable amount of computer time. Also, perhaps these results could give the investigator a jeef for the set of computations that he has developed by simplifying his model to the dimensionless solution shown here. If the investigator is working on an extreme type event, it is possible that the watershed would be essentially a linear system, for this case. The watershed response relation has shown that the lag time levels off abruptly at high supply rates, meaning that the response of the watershed system is not a function of the supply rate, and therefore is essentially linear.
Further study is needed. There are only a limited number of closed solutions which can be obtained with the kinematic approximation. For more complicated boundary conditions and inputs, resort must be made to numerical solutions. Additional information is needed on the ssnsitivity of the solution of spatial and temporal variations of rainfall ex- cess relative to the physical and hydraulic model parameters. Since the length and slope can be measured within a small error, the main question of concern is the sensitivity of the resistance coefficient relative to the sensitivity of input averaging. Nmerical solutions have been developed in the Hydrograph Laboratory for runoff down a nonuniform hills- s!ope, Overton [4], and for routing streamflow in nonprimastic channels, Brakensiek [12].
1 . 1 1 1 1 1 1

These solutions are completely general, unconditionally stable and convergent, and provide a means for continuing research toward useful solutions to watershed surface water hydraulics problems.
REFERENCES
i. HENDERSON, F. M. and WOODING, R. A. (1964): Overland flow and groundwater flow from steady rainfall of finite duration, J. Geophys. Res., 69 (8), 1531-1540.
2. WOODING, R.A.: A hydraulic model for the catchment stream problem, J. Hydrology,; I. Kinematic wave theory, vol. 3, 254-257 (1965). II. Numerical solutions, Vol. 3, 268-282 (1965). III. Comparison with runoff observations, vol. 4, 21-37 (1966).
3. WOOLHISER, D.A. and LIGGETT, J.A. (1967): Unsteady one-dimensional flow over a plane- the rising hydrograph, Water Resources Res., 3 (3), 753-771.
4. OVERTON, D.E. (1969): Mathematical models of overland flow, unpublished report, 84. p 5. Corps of Engineers, U.S. Army (1954): Data report, airfield drainage investigation, Airfield
6. OVERTON, D.E. (1970): Route or convolute?, Water Resources Res., February 1970. 7. MINSHALL, N. E. (1960): Predicting storm runoff on small experimental watersheds, J. Hydra.
Div., Amer. Soc. Civil Engrs., B6 (HY8), 17-38. 8. OVERTON, D.E. (1968): A least-squares hydrograph analysis of complex storms on small
agricultural watersheds, Water Resources Res., 4 (5), 955-963. 9. AMOROCHO, J. and ORLOB, G.T. (1961): Non-linear analysis of hydrologic systems, Water
Res. Center Contrib., no. 40, Univ. of Calif., Berkley, Calif. 10. OVERTON, D. E. (1967): Analytical simulation of watershed hydrographs from rainfall.
Proc. Internail. Hydrol. Symposium, Ft. Collins, Colo. pp. 9-17. 11. NASH, J. E. (1960): A unit hydrograph study with particular reference to British catchments,
Proc. Inst. Civil. Engrs., 17, 249-271. 12. BRAKENSIEK, D.L. (1966): Storage-flood routing without coefficients, U. S. Dept. Agr.
Research Service, 41-122.
Branch Engr. Div., Military Construction, Los Angeles, Calif.
REPRESENTATIVE AND EXPERIMENTAL BASINS AS DPSPERED SYSTEMS”
H. N. HOLTAN**
INTRODUCTION
Modelers of watershed hydrology soon experience the dilemma of subjective evaluations of parameters dependent upon the purpose of computation. Parameters descriptive of geology, soil characteristics, vegetation, routing coefficients, infiltration, evapotranspira- tion and even the computation intervals are often not evaluated the same for flood peak
* Contribution from the Soil and Water Conservation Research Division, Agricultural Research Service, U. S. Department of Agriculture, Beltsville, Maryland, U. S. A.
** Research Hydraulic Engineer and Director, USDA Hydrograph Laboratory.
112 1.112