Embed Size (px)
Citation preview

Jim RayNaval Center for Space TechnologyU.S. Naval Research Lab
A Kalman Filter to Combine VLBI UT1 & GPS LOD Estimates
OUTLINEOUTLINE
•• Context & objectives• Difficulties with satellite-based LOD• Kalman combination filter model & results• Compare new KF series with other combinations• Correlations with atmosphere angular momentum (AAM)
excitation• Fortnightly, monthly, & 9-d bands• Check consistency of UT1 & LOD values & power spectra• Conclusions
National Geodetic SurveyNational Oceanic & Atmospheric Admin
Ken Senior Jan KoubaNatural Resources Canada
European Geophysical Union2008 General AssemblyVienna, Austria
G4 session: Paper A-0753215 April 2008

•• Cannot easily assimilate full UT1 & LOD information in ITRF timeCannot easily assimilate full UT1 & LOD information in ITRF timeseries combination with station coordinates & other EOPsseries combination with station coordinates & other EOPs– UT1/LOD from 24-hr multi-baseline VLBI included OK– UT1 from 1-hr single-baseline VLBI not included
• not available in SINEX format• can distort station positions due to limited observing geometry
– LOD from satellite techniques also not included• time-varying biases are significant & not easily modeled• frame-related errors are not significant compared to orbit-related biases
•• Previously proposed a multiPreviously proposed a multi--step ITRF & EOP combination processstep ITRF & EOP combination process– ITRF2005-type TRF + EOP combination– Reduce 1-hr single-baseline VLBI sessions consistent with ITRF2005 for denser UT1
time series– Merge UT1 time series from ITRF & 1-hr VLBI steps– Assimilate GPS LOD into VLBI UT1 time series using Kalman filter
•• QuestionQuestion: Can a Kalman filter provide a useful combination of VLBI : Can a Kalman filter provide a useful combination of VLBI UT1 and satellite LOD quasiUT1 and satellite LOD quasi--optimally?optimally?
Context & Objectives

•• SatelliteSatellite--based LOD estimates are biased based LOD estimates are biased (Ray, 1996)(Ray, 1996)– biases are quasi-stochastic but correlated in time– also correlated among IGS Analysis Centers– biases mostly reflect errors in orbit modeling (i.e., constellation-averaged drift of ascending
nodes)– GPS LODs also show artifactual alias signals (e.g., in fortnightly band)
•• Other combinations sometimes ignore GPS biasesOther combinations sometimes ignore GPS biases– Thaller et al. (2007) assumed constant LOD biases & used only 2 weeks of continuous VLBI &
GPS data– ignored all other biases too– their approach can not be applied when VLBI data has gaps– applied smoothing filter using continuous linear segment parameterization (also distorts signal
content)– did not compare with any independent observations; C04 comparison is not independent
•• JPL group has long used Kalman filter for EOP combinationsJPL group has long used Kalman filter for EOP combinations– Morabito et al. (1988) & Gross et al. (1998)– copes well with natural stochastic excitation– but not used to model satellite-based LOD biases
Difficulties with Direct LOD Combination

•• UT1 is the (negative) integral of LOD + random walkUT1 is the (negative) integral of LOD + random walk– excitation variance using modern data found to agree with Morabito et al. (1988)
value
•• GaussGauss--Markov process used to model GPS LOD biasesMarkov process used to model GPS LOD biases– time-constant
•• Harmonic with period 14.19 d added to capture effect of mismodeHarmonic with period 14.19 d added to capture effect of mismodeled led tides in GPS LOD biases tides in GPS LOD biases (Kouba, 2003)(Kouba, 2003)
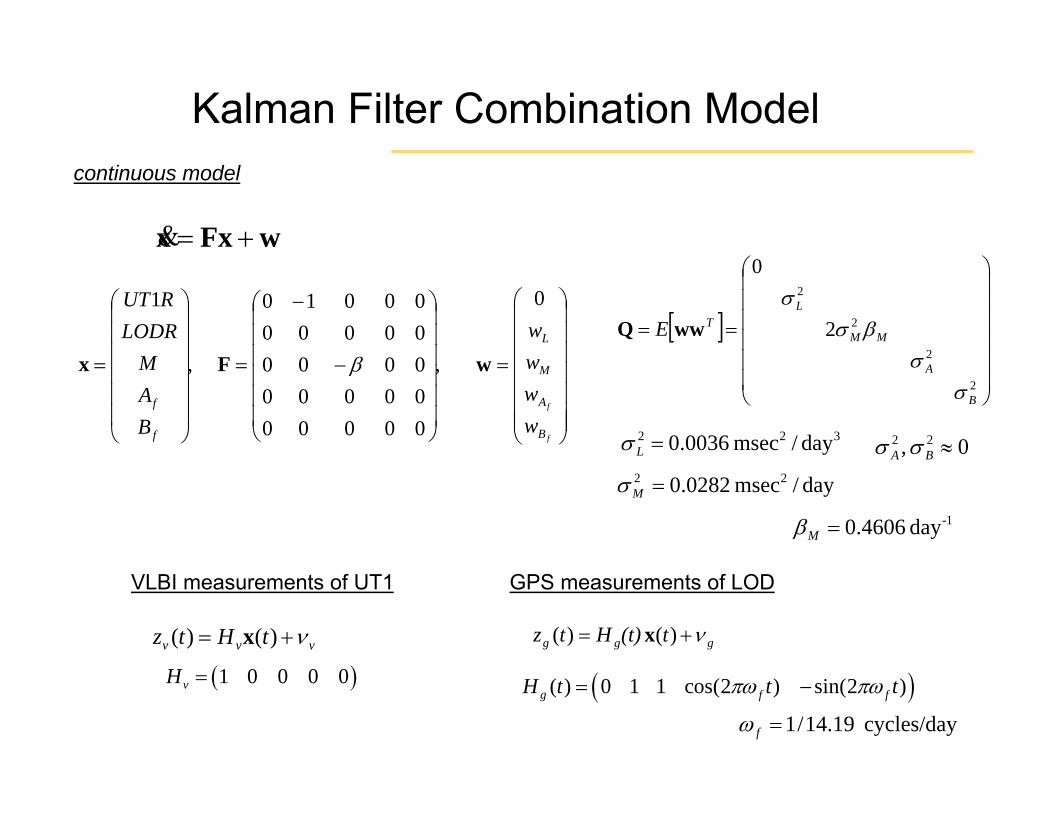
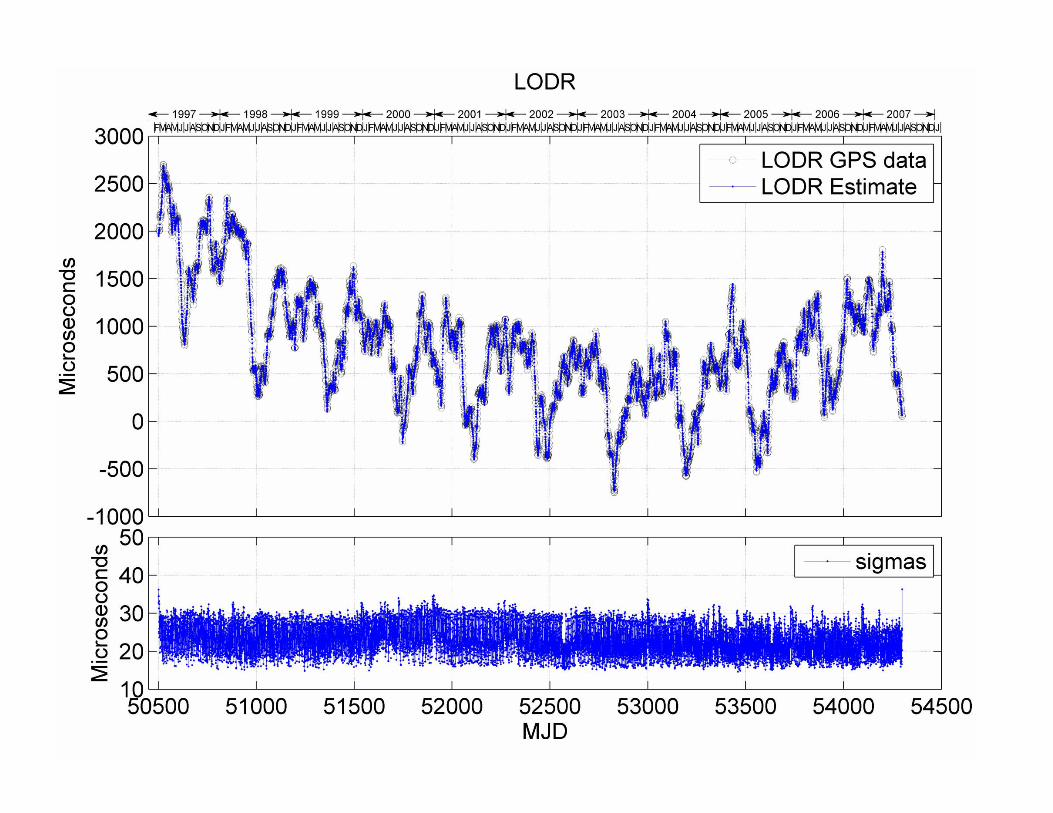
Kalman Filter Combination Model
2
2
1186400 L
d dUT R LODR wdt dt
− = = 2 2 33.6 s / dayLwσ µ=
M M Md B B wdt
β= − + 2 2 356.4 s / dayMwσ β µ=
1/ 2.17 daysβ= =

•• UT1 from 24UT1 from 24--hr multihr multi--baseline VLBI sessionsbaseline VLBI sessions– series “2007c” from NASA/GSFC– from 21 Feb 1997 to 17 Jul 2007– at irregular epochs, about 2 to 3 per week– formal errors scaled by 2
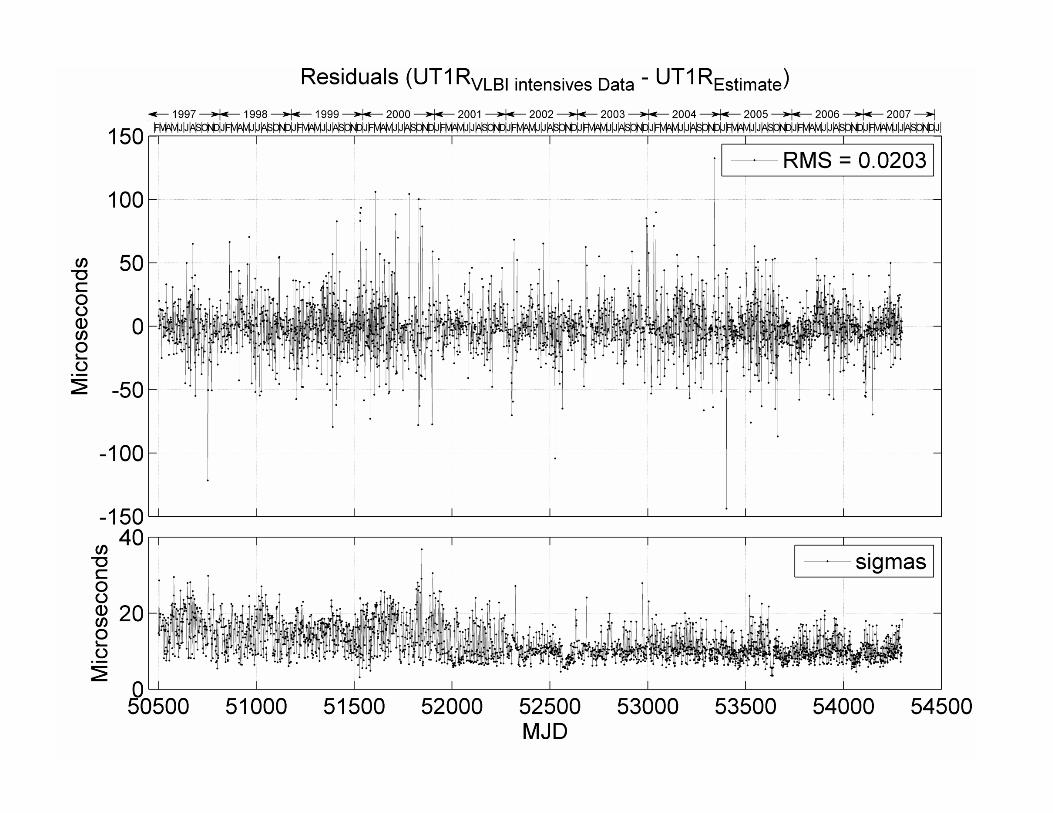
•• UT1 from 1UT1 from 1--hr singlehr single--baseline VLBI sessionsbaseline VLBI sessions– series “int21” from NASA/GSFC– from 21 Feb 1997 to 18 Jul 2007– formal errors scaled by 2– at irregular epochs, about 5 per week– consistent with 24-hr sessions: mean differences = -0.7 ± 22.5 µs with N = 1244 & χ2/dof = 2.58
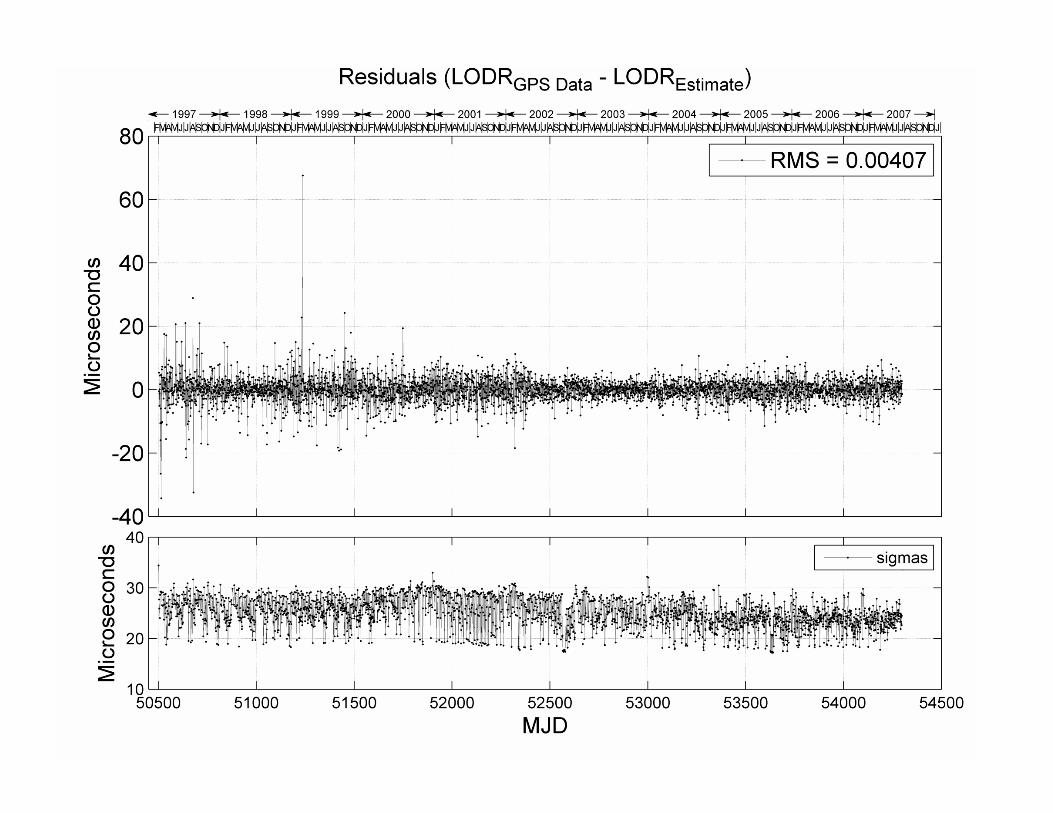
•• daily LOD from IGS combinationdaily LOD from IGS combination– series “igs00p03.erp”– noon epochs from 23 Feb 1997 to 18 Jul 2007– formal errors scaled by 2– some bias corrections applied already by IGS using IERS Bulletin A
•• corrections for zonal tides applied to all series before combincorrections for zonal tides applied to all series before combinationation
•• VLBI UT1 accuracy could be improved by adding GPS polar motion VLBI UT1 accuracy could be improved by adding GPS polar motion & global & global network in raw reduction network in raw reduction (Ray et al., 2005) (Ray et al., 2005) –– not studied herenot studied here
Input Data Sets

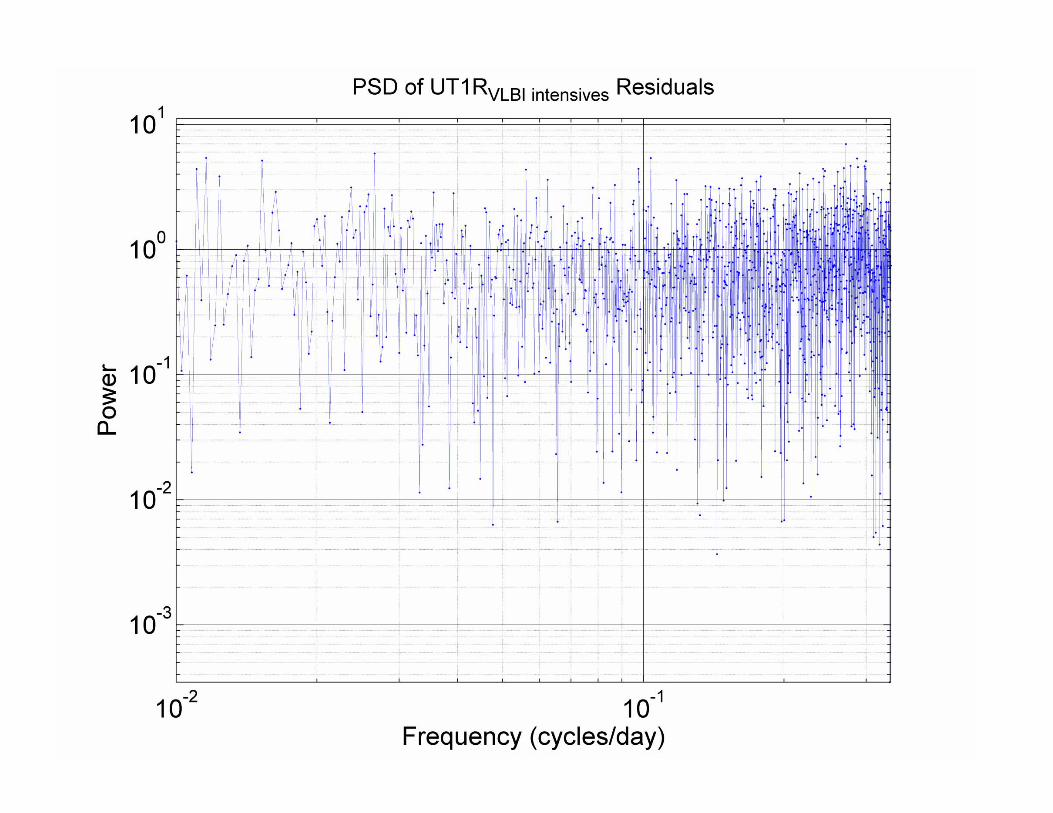
•• VLBI (1VLBI (1--hr) UT1 hr) UT1 residualsresiduals– white over full frequency
range
Some Characteristics of Kalman Filter Output
•• 14.1914.19--d periodicd periodic– treated as GPS artifact– amplitude varies between
5 & 11 µs – phase varies linearly w/ time
due to changing period
•• GPS LOD residualsGPS LOD residuals– approximately white– with small peak at 13.7 d– possible difference in
a priori tidal models wrt VLBI
•• GaussGauss--Markov values Markov values for GPS LOD biasesfor GPS LOD biases
– peak-to-peak range = ± 40 µs
– RMS = 9 µs
EMR analysis upgrade

Compare LOD w/ AAM Excitation
•• our KF w/ other LOD combinationsour KF w/ other LOD combinations– corrected for zonal tides, LODS (Yoder et al., 1981; Kantha et al., 1998)
•• Atmospheric Angular Momentum (AAM) from NCEP ReanalysisAtmospheric Angular Momentum (AAM) from NCEP Reanalysis– 4 values daily, during Feb 1997 – Dec 2006– inverted barometer correction applied– averaged to daily values at 00:00 or 12:00 epochs to match respective LOD series epochs
•• for each (LODS for each (LODS –– AAM) time series, fit for imperfectly known geophysical AAM) time series, fit for imperfectly known geophysical & systematic effects & systematic effects (Kouba & Vondrak, 2005)(Kouba & Vondrak, 2005)
– annual + semi-annual differences– monthly (27.56 d) oceanic tide correction– fortnightly (13.63/13.66 d) oceanic tide corrections– k/C core-mantle coupling constant– long-term drift differences– AAM transfer function scale factor
•• compute residuals & comparecompute residuals & compare
•• compute LODS/AAM crosscompute LODS/AAM cross--correlations & comparecorrelations & compare

(LODS – AAM) RMS Residuals
•• LOD time series studiedLOD time series studied– IERS 05C04 (00:00)– IERS Bulletin A (00:00)– JPL’s SPACE 2006 (12:00)– IGS (no UT1) (12:00) – our KF (12:00)
•• our KF has smallest our KF has smallest residualresidual
µs
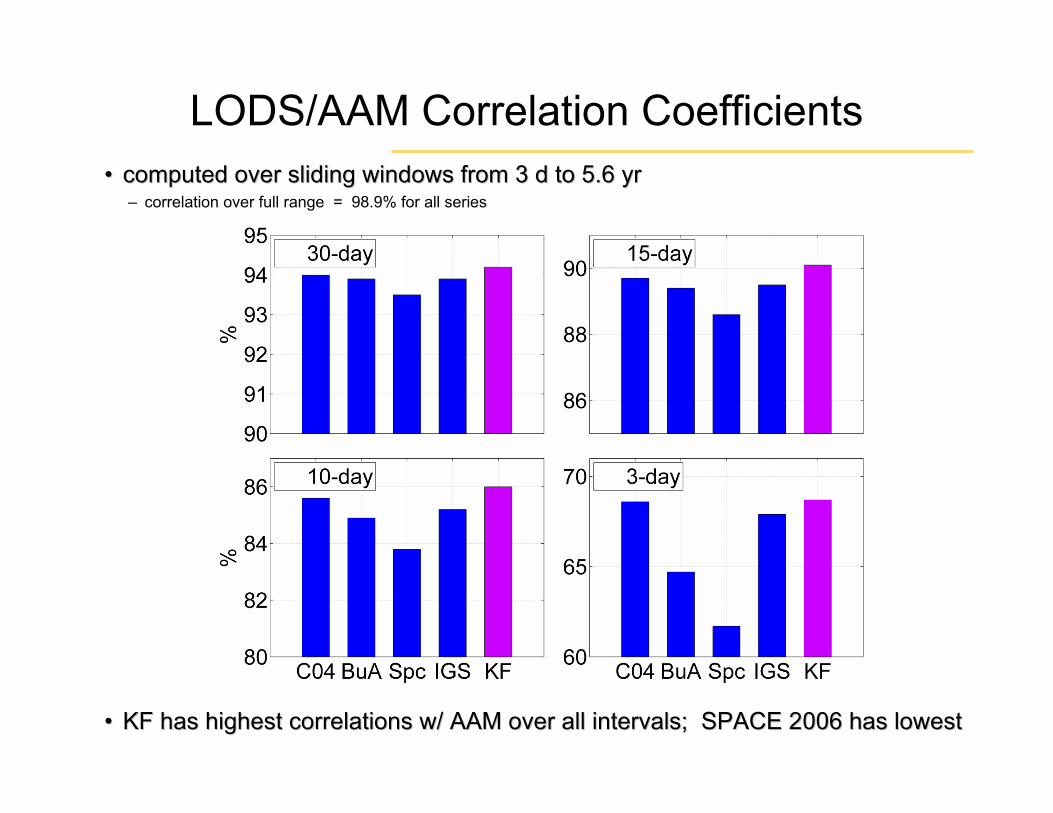
LODS/AAM Correlation Coefficients•• computed over sliding windows from 3 d to 5.6 yrcomputed over sliding windows from 3 d to 5.6 yr
– correlation over full range = 98.9% for all series
•• KF has highest correlations w/ AAM over all intervals; SPACE 2KF has highest correlations w/ AAM over all intervals; SPACE 2006 has lowest006 has lowest
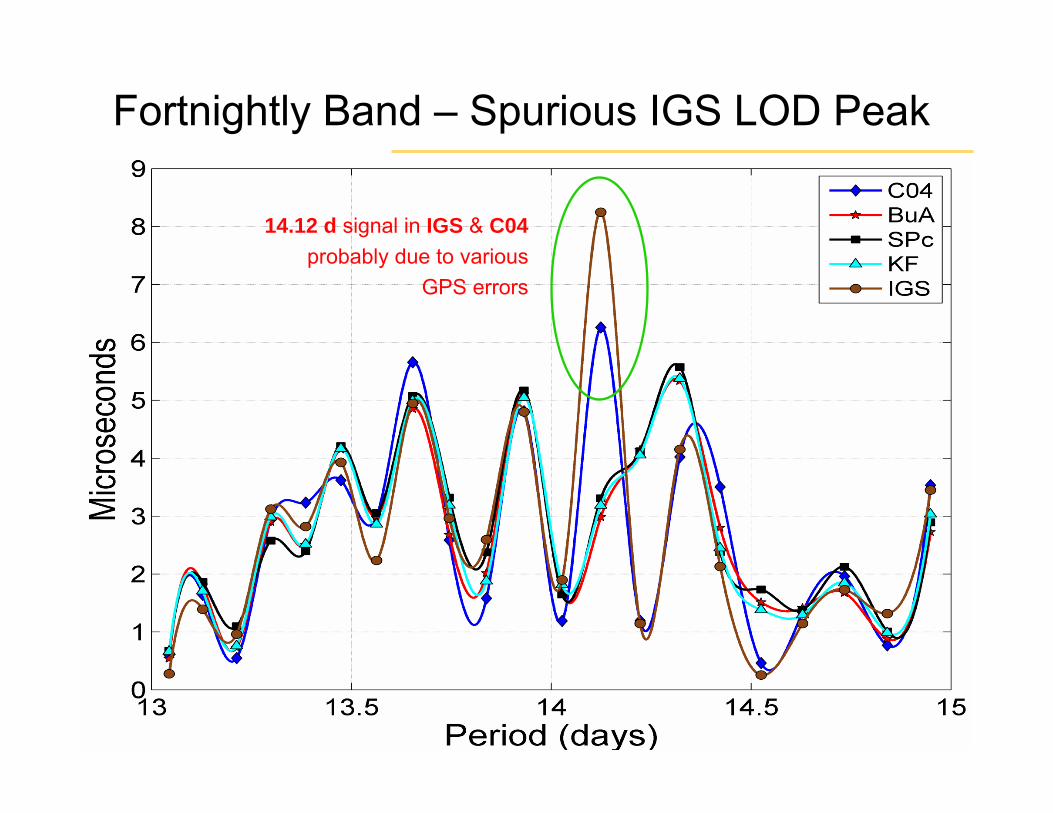
Fortnightly Band – Spurious IGS LOD Peak
14.12 d signal in IGS & C04probably due to various
GPS errors

Monthly Band – Probable GPS Errors
signal distortions in IGS monthly band probably due to GPS errors

•• 9.14 d peak seen in all LODS series 9.14 d peak seen in all LODS series –– probably geophysicalprobably geophysical•• needs further investigation needs further investigation –– could be included in (LODScould be included in (LODS--AAM) fitAAM) fit
9-d Band – Unmodeled Geophysical Effect?

Consistency of UT1 & LOD values
•• comparisons w/ AAM excitation only test LOD correlationcomparisons w/ AAM excitation only test LOD correlation
•• to verify UT1 consistency, compare to verify UT1 consistency, compare ––dUT1 & LOD values:dUT1 & LOD values:• 05C04: RMS = 21.2 µs (HIGH) • SPC: RMS = 6.7 µs• Bull A: RMS = 1.9 µs (LOW) • KF: RMS = 10.5 µs
expected difference due to –dUT1 interpolation = ~10 µs
spurious tidal lines smoothed smoothed

•• seasonally detrendedseasonally detrended
UT1 & LOD Power Spectra
LOD smoothed LOD smoothed
excess UT1 noise
05C04 Bulletin A
our KF SPACE 2006

•• our KF UT1/LOD combination performs best by all measuresour KF UT1/LOD combination performs best by all measures– further improvements possible, e.g., if VLBI UT1 analyses use IGS polar motion
•• IGS LOD series adds critical highIGS LOD series adds critical high--frequency informationfrequency information– but care needed to handle correlated biases & spurious signals
•• IERS 05C04 LODs correlate well with AAM IERS 05C04 LODs correlate well with AAM –– based on IGS LODsbased on IGS LODs– LODs enjoy benefits & liabilities of IGS LODs; but should filter out spurious signals– however, UT1 & LOD values are not consistent– strong high-frequency smoothing for LODs; excess noise for UT1
•• IERS Bulletin A LODs derived from UT1 values with strong tidal IERS Bulletin A LODs derived from UT1 values with strong tidal signalssignals– LODs have excess high-frequency noise indicated by lower AAM correlations – sharp high-frequency smoothing for LODs due to derivation from UT1 values
•• SPACE 2006 correlates worst with AAM over all intervals due to eSPACE 2006 correlates worst with AAM over all intervals due to excess noisexcess noise– badly hurt by not using GPS LODs
Conclusions 1/2

•• our Kalman filter series of UT1 & LOD values is available at:our Kalman filter series of UT1 & LOD values is available at:– https://goby.nrl.navy.mil/ut1lod/
•• MATLAB Kalman filter code is available upon requestMATLAB Kalman filter code is available upon request– [email protected]
•• should IGS produce this KF series as a new product for scientifishould IGS produce this KF series as a new product for scientific users ?c users ?– we prefer that the IERS upgrade its products
Conclusions 2/2

Backup Slides
Kalman Filter Combination Model
⎟⎟⎟⎟⎟⎟⎟
⎠
⎞
⎜⎜⎜⎜⎜⎜⎜
⎝
⎛
=
⎟⎟⎟⎟⎟⎟
⎠
⎞
⎜⎜⎜⎜⎜⎜
⎝
⎛
−
−
=
⎟⎟⎟⎟⎟⎟
⎠
⎞
⎜⎜⎜⎜⎜⎜
⎝
⎛
=
f
f
B
A
M
L
f
f
wwww
BAM
LODRRUT 0
,
000000000000000000000010
,
1
wFx β
vvv tHtz ν+= )()( x ggg t(t)Htz ν+= )( )( x
wFxx +=&
[ ]⎟⎟⎟⎟⎟⎟
⎠
⎞
⎜⎜⎜⎜⎜⎜
⎝
⎛
==
2
2
2
2
2
0
B
A
MM
LTE
σσ
βσσ
wwQ
322 day/msec 0036.0=Lσ
day/msec 0282.0 22 =Mσ1day 4606.0 -
M =β
VLBI measurements of UT1 GPS measurements of LOD
( )( ) 0 1 1 cos(2 ) sin(2 )g f fH t t tπω πω= −( )1 0 0 0 0vH =
cycles/day 19.14/1=fω
0 , 22 ≈BA σσ
continuous model

VLBI (1-hr) UT1R
Spectra of Residuals
VLBI (24-hr) UT1R
GPS LODR


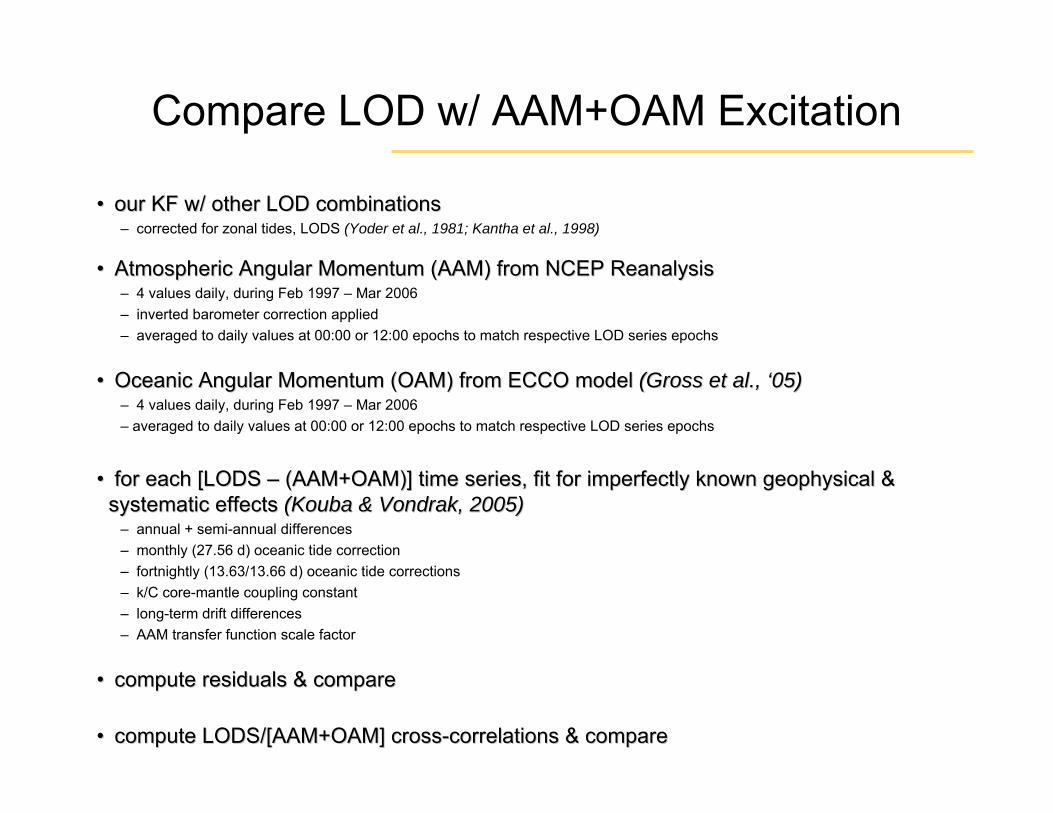
Compare LOD w/ AAM+OAM Excitation
•• our KF w/ other LOD combinationsour KF w/ other LOD combinations– corrected for zonal tides, LODS (Yoder et al., 1981; Kantha et al., 1998)
•• Atmospheric Angular Momentum (AAM) from NCEP ReanalysisAtmospheric Angular Momentum (AAM) from NCEP Reanalysis– 4 values daily, during Feb 1997 – Mar 2006– inverted barometer correction applied– averaged to daily values at 00:00 or 12:00 epochs to match respective LOD series epochs
•• Oceanic Angular Momentum (OAM) from ECCO model Oceanic Angular Momentum (OAM) from ECCO model (Gross et al., (Gross et al., ‘‘05)05)– 4 values daily, during Feb 1997 – Mar 2006– averaged to daily values at 00:00 or 12:00 epochs to match respective LOD series epochs
•• for each [LODS for each [LODS –– (AAM+OAM)] time series, fit for imperfectly known geophysical &(AAM+OAM)] time series, fit for imperfectly known geophysical &systematic effects systematic effects (Kouba & Vondrak, 2005)(Kouba & Vondrak, 2005)
– annual + semi-annual differences– monthly (27.56 d) oceanic tide correction– fortnightly (13.63/13.66 d) oceanic tide corrections– k/C core-mantle coupling constant– long-term drift differences– AAM transfer function scale factor
•• compute residuals & comparecompute residuals & compare
•• compute LODS/[AAM+OAM] crosscompute LODS/[AAM+OAM] cross--correlations & comparecorrelations & compare

[LODS – (AAM+OAM)] RMS Residuals
•• LOD time series studiedLOD time series studied– IERS 05C04 (00:00)– IERS Bulletin A (00:00)– JPL’s SPACE 2006 (12:00)– IGS (no UT1) (12:00) – our KF (12:00)
•• our KF has smallest our KF has smallest residualresidual
µs

LODS / (AAM+OAM) Correlation Coefficients•• computed over sliding windows from 3 d to 5.6 yrcomputed over sliding windows from 3 d to 5.6 yr
– correlation over full range = 99.0% for BuA, C04, SPc, & IGS and 99.1% for KF
•• KF has highest correlations w/ AAM+OAM over all intervals; SPAKF has highest correlations w/ AAM+OAM over all intervals; SPACE 2006 has CE 2006 has lowestlowest

Fortnightly Band – Spurious IGS LOD Peak
14.12 d signal in IGS & C04probably due to various
GPS errors
[LODS – (AAM+OAM)]

Monthly Band – Probable GPS Errors
signal distortions in IGS monthly band probably due to GPS errors
[LODS – (AAM+OAM)]
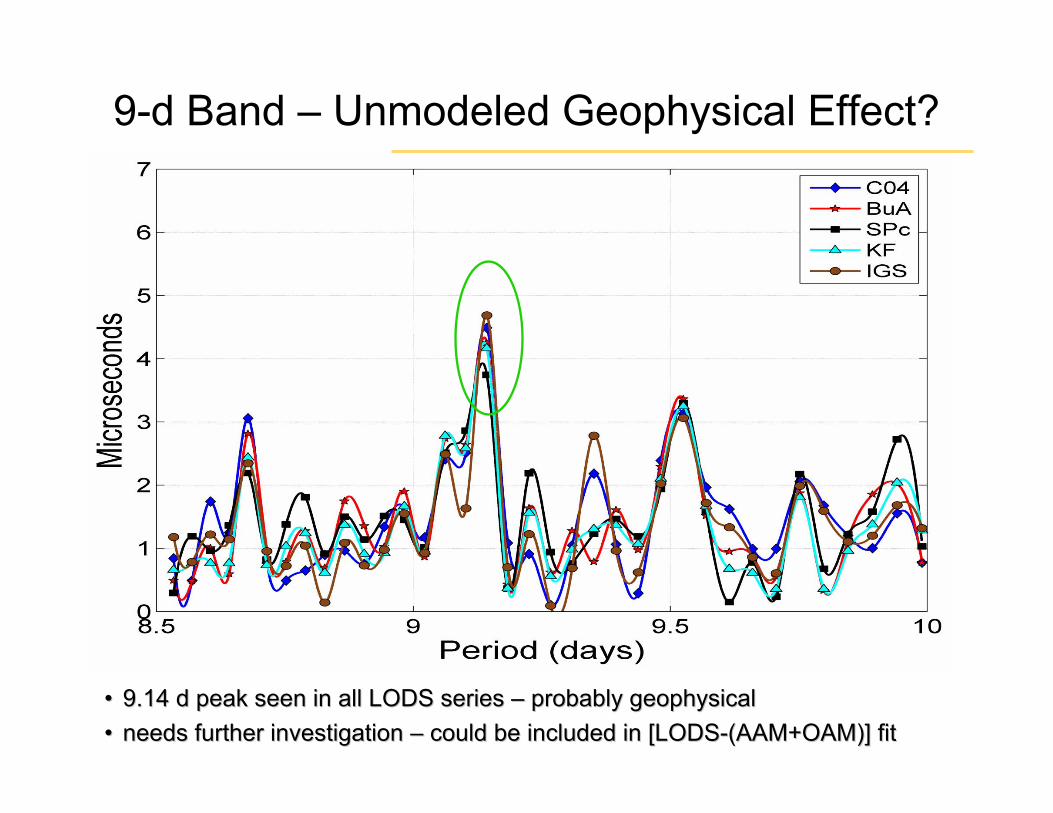
•• 9.14 d peak seen in all LODS series 9.14 d peak seen in all LODS series –– probably geophysicalprobably geophysical•• needs further investigation needs further investigation –– could be included in [LODScould be included in [LODS--(AAM+OAM)] fit(AAM+OAM)] fit
9-d Band – Unmodeled Geophysical Effect?