Embed Size (px)
Citation preview
A K-Main Routes Approach to Spatial Network Activity Summarization
Authors:
Dev Oliver
Shashi Shekhar
James M. Kang
Renee Bousselaire
Abdussalam Bannur

Outline
Motivation
Problem Statement
Contributions
Validation Analytical Experimental Case Studies
Summary and Future Work

Motivation: Crime Analysis (application domain)
Crime hotspot Area of concentrated crime
Street Place
Neighborhood
**J. E. Eck et. al. Mapping Crime: Understanding Hot Spots. US National Inst. of Justice (http://www.ncjrs.gov/pdffiles1/nij/209393.pdf), 2005.
“Most clustering algorithms will show areas of concentration even when a line is the most appropriate dimension.” – National Institute of Justice**
Star Tribune, January 26, 2011
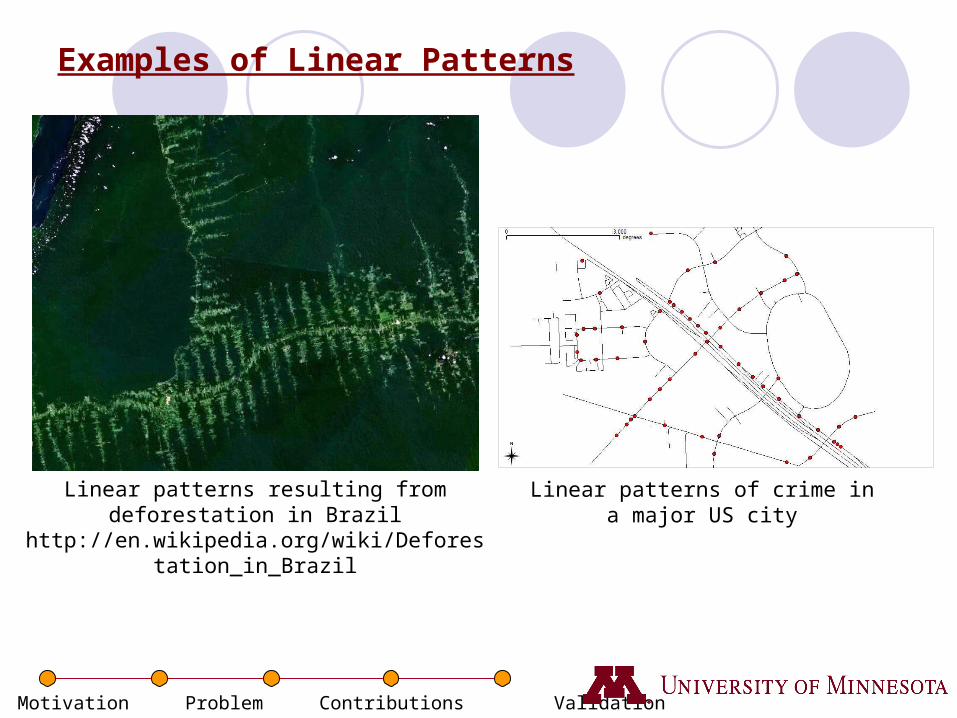
Examples of Linear Patterns
Linear patterns resulting from deforestation in Brazil http://en.wikipedia.org/wiki/Deforestation_in_Brazil
Linear patterns of crime in a major US city

Motivation: Environmental Criminology (scientific domain)
Spatial theories in Environmental Criminology
1L.E. Cohen et al., Social change and crime rate trends: A routine activity approach, American sociological review, 1979. 2P. L. Brantingham et al., Environmental Criminology, Waveland Press, 1990.
Routine Activity Theory1 Crime location related to criminal’s
frequently visited areas Crime Pattern Theory2
Based on spatial model Nodes (e.g. home, work,
entertainment), Paths (e.g. routes between
nodes), Edges
Crime locations close to edges Near criminal’s activity
boundaries where residents may not recognize him/her Source: Rossmo, Kim (2000). Geographic Profiling. Boca Raton, FL: CRC Press.
http://www.popcenter.org/learning/60steps/index.cfm?stepNum=16
Network based summarization adds value to Environmental Criminology Assist with large scale verification of real-world data matching theories Opportunities to develop hypotheses for new theory formulation

Other Domains
Accident Analysis and PreventionDisaster Relief
Motivation Problem Contributions Validation Summary
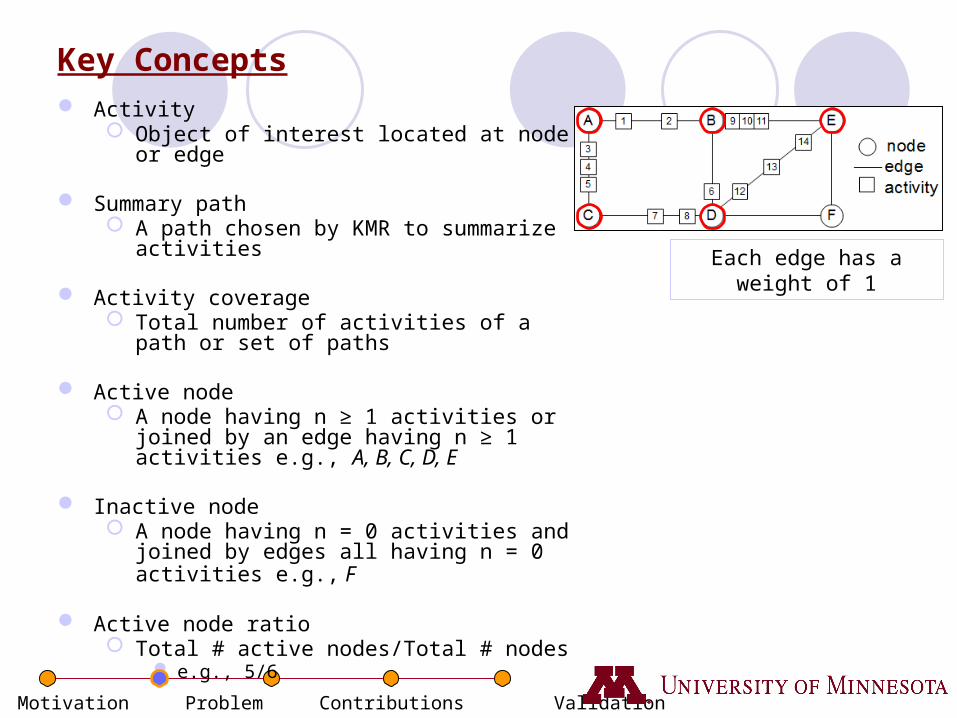
Key Concepts Activity
Object of interest located at node or edge
Summary path A path chosen by KMR to summarize activities
Activity coverage Total number of activities of a path or set of paths
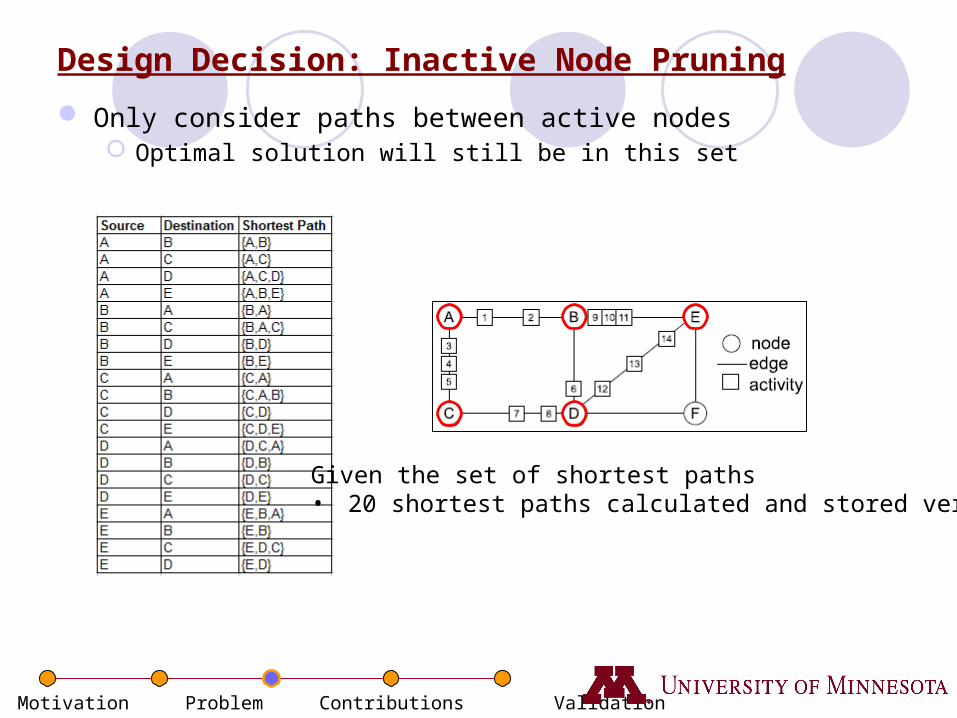
Active node A node having n ≥ 1 activities or joined by an edge
having n ≥ 1 activities e.g., A, B, C, D, E
Inactive node A node having n = 0 activities and joined by edges
all having n = 0 activities e.g., F
Active node ratio Total # active nodes/Total # nodes
e.g., 5/6
Each edge has a weight of 1

Motivation Problem Contributions Validation Summary
Problem Statement
Given A spatial network G = (N, E) A set of activities, A and their
locations (e.g. a node or edge) A set of Paths, P K (Number of routes) Edge weights
Find A cardinality k subset P′ of P, i.e.,
a subset P′ P with |P′| = k⊆
Objective Maximize the activity coverage
(AC) by P′
Constraints 1 ≤ k ≤ |P|.
k = 2
Edge Weightsare 1
Given P = the set of Shortest Paths

Motivation Problem Contributions Validation Summary
Challenges
Measures of interestingness Activity coverage, average distance, etc
Computational Complexity Choose(N,2) paths, given N nodes Exponential number of k subsets of paths
Motivation Problem Contributions Validation Summary
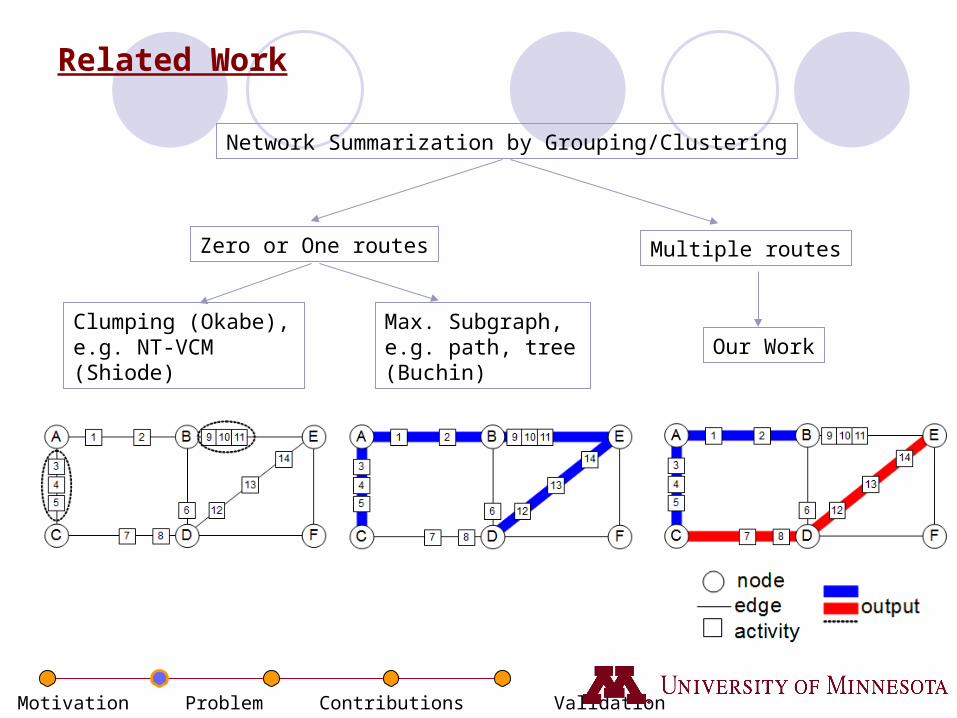
Related Work
Network Summarization by Grouping/Clustering
Clumping (Okabe), e.g. NT-VCM (Shiode)
Max. Subgraph, e.g. path, tree (Buchin)
Multiple routesZero or One routes
Our Work

Motivation Problem Contributions Validation Summary
Contributions
K-Main Routes (KMR) algorithm Finds a set of k routes to group activities New design decisions added
Network Voronoi Activity assignmentDivide and Conquer Summary path recomputation
Spatial network activity summarization is shown to be NP-complete.
Analytically demonstrate correctness of design decisions and show cost analysis
Experimental evaluation of the various algorithms Performance evaluated using synthetic and real world datasets
Case study comparing KMR with geometry based summarization
Motivation Problem Contributions Validation Summary
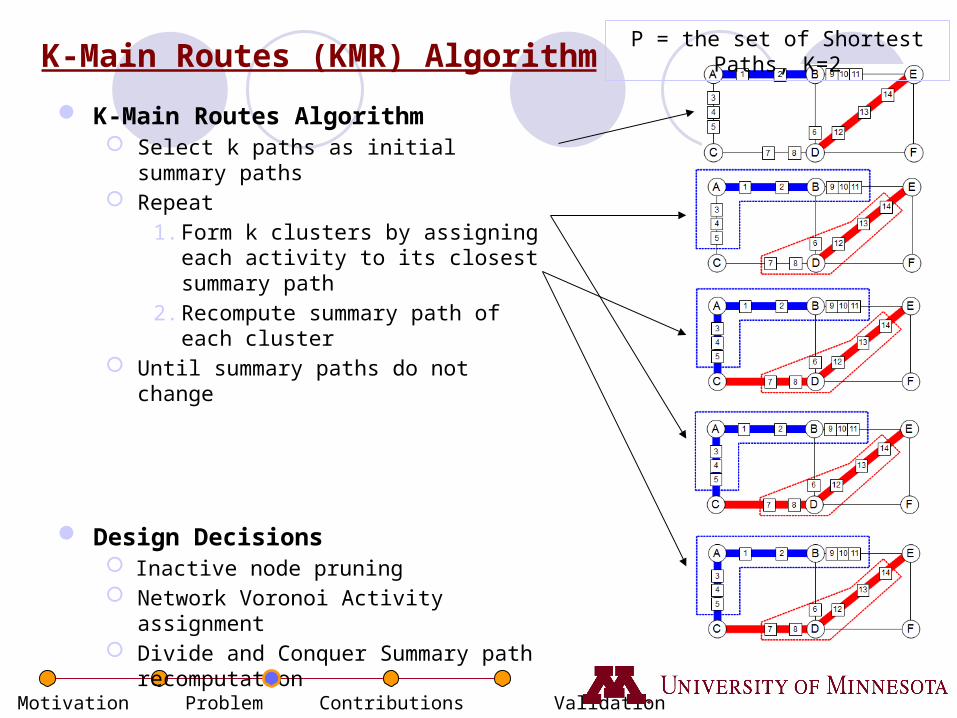
K-Main Routes (KMR) Algorithm
K-Main Routes Algorithm Select k paths as initial summary paths Repeat
1. Form k clusters by assigning each activity to its closest summary path
2. Recompute summary path of each cluster Until summary paths do not change
Design Decisions Inactive node pruning Network Voronoi Activity assignment Divide and Conquer Summary path
recomputation
P = the set of Shortest Paths, K=2
Motivation Problem Contributions Validation Summary
Design Decision: Inactive Node Pruning
Only consider paths between active nodes Optimal solution will still be in this set
Given the set of shortest paths• 20 shortest paths calculated and stored versus 30

Motivation Problem Contributions Validation Summary
Design Decision: Network Voronoi (NV) Activity Assignment Goals
Form k clusters by assigning each activity to its closest summary path Improve execution time of current assignment strategy
Example (execution trace) Next
K-Main Routes AlgorithmSelect k shortest paths as initial summary paths
Repeat
1. Form k clusters by assigning each activity to its closest summary path
2. Recompute summary path of each clusterUntil summary paths do not change
K-Main Routes AlgorithmSelect k shortest paths as initial summary paths
Repeat
1. Network Voronoi Activity Assignment
2. Recompute summary path of each clusterUntil summary paths do not change

Motivation Problem Contributions Validation Summary
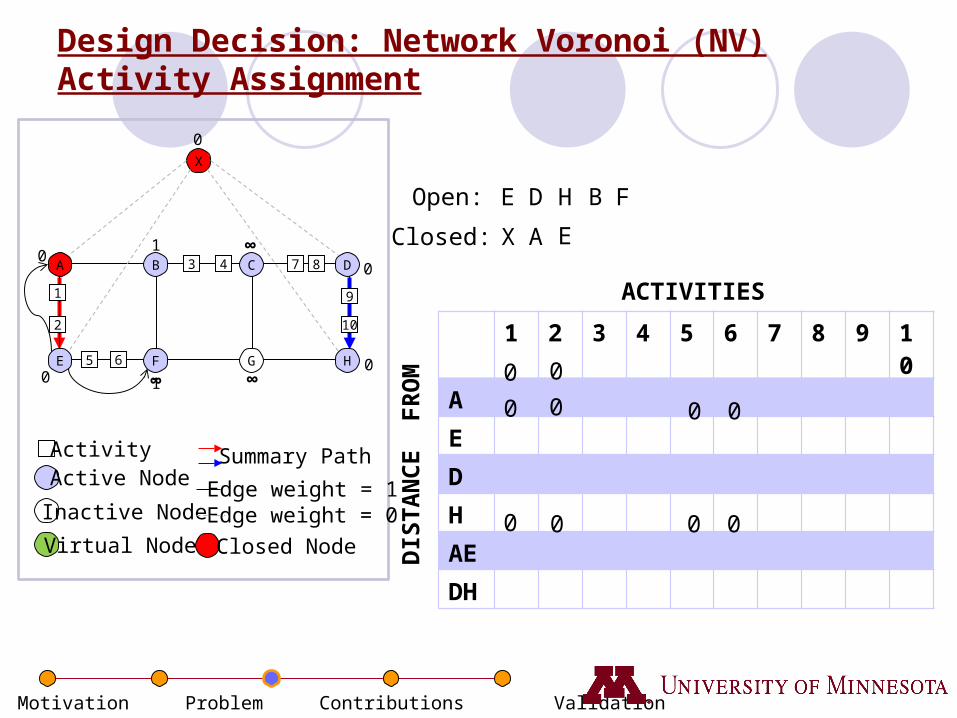
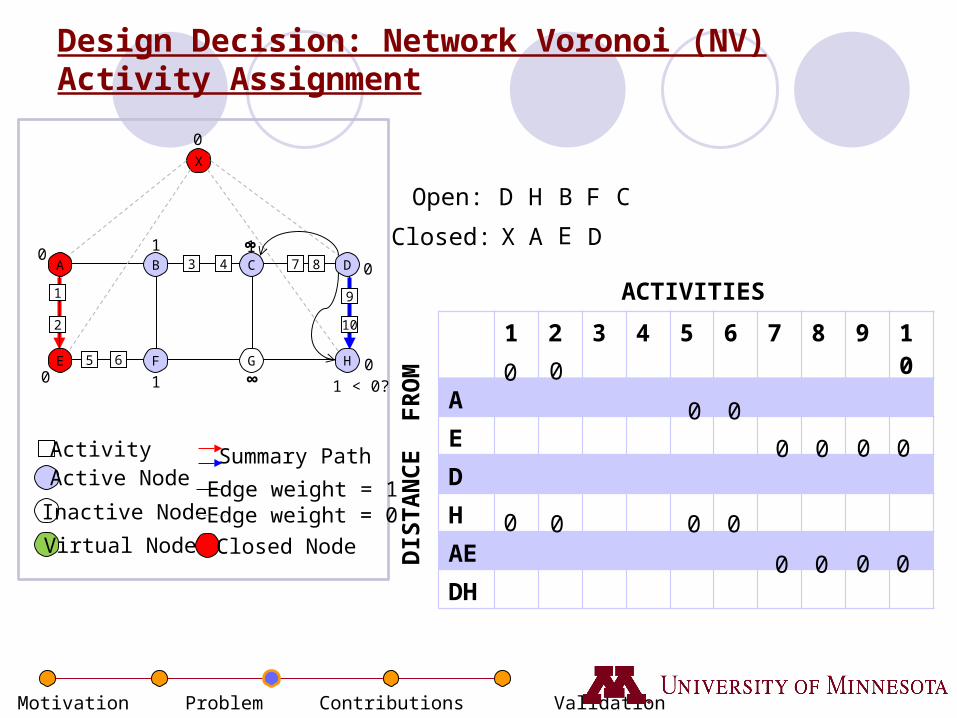
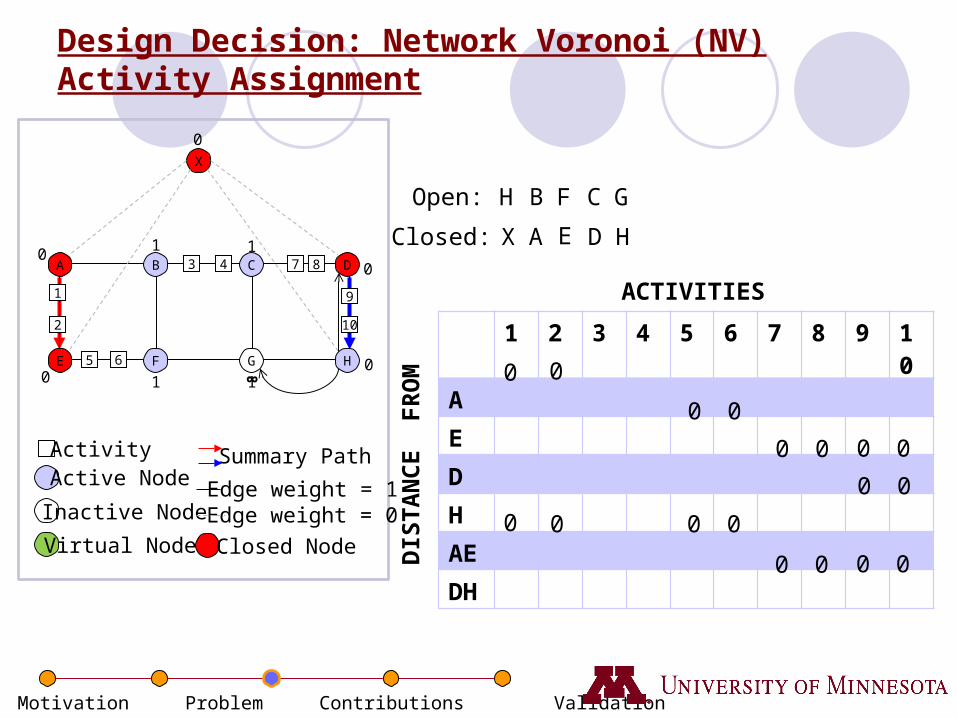
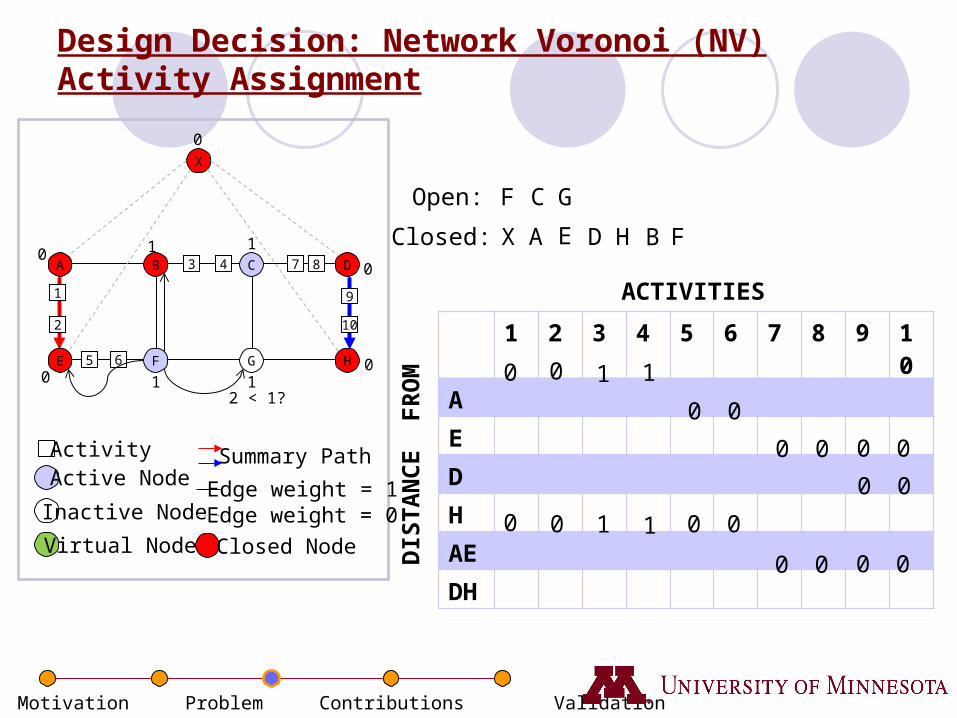
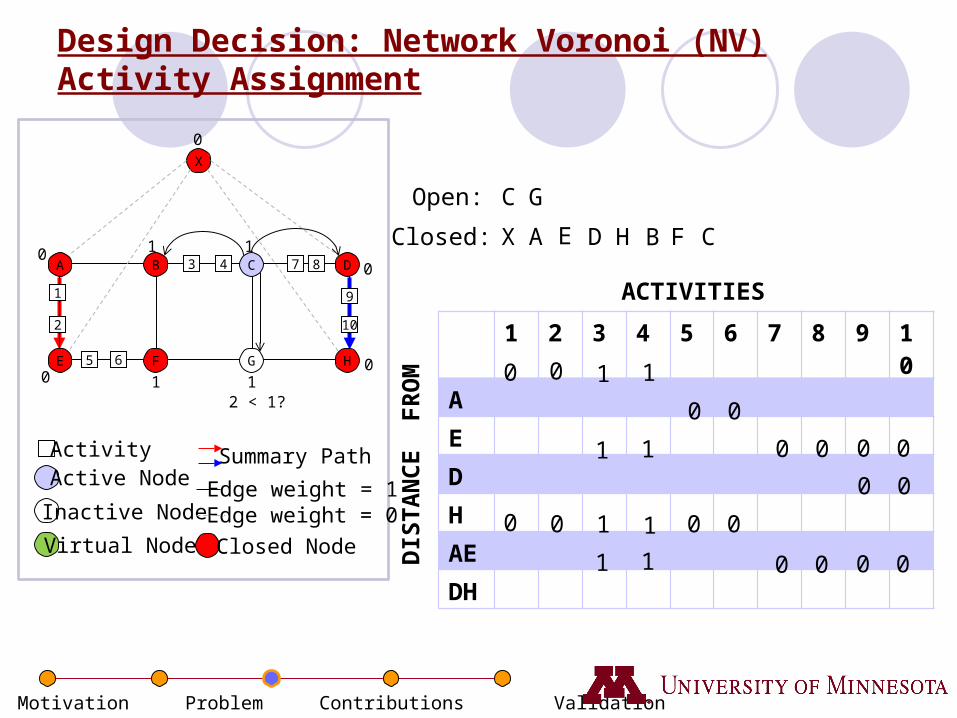
Design Decision: Network Voronoi (NV) Activity Assignment
A B C D
E F G H
1
2
3 4
5 6
7 8
9
10
X
DIS
TA
NC
E F
RO
M
Open:
ACTIVITIES
1 2 3 4 5 6 7 8 9 10
A
E
D
H
AE
DH
Closed:
ActivityActive Node
Inactive Node
Virtual Node
Summary Path
Edge weight = 1Edge weight = 0
Closed Node
X A E
∞
0
∞∞
∞∞∞
∞
∞
0
0
0
D
0
H
X

Motivation Problem Contributions Validation Summary
Design Decision: Network Voronoi (NV) Activity Assignment
A B C D
E F G H
1
2
3 4
5 6
7 8
9
10
X
DIS
TA
NC
E F
RO
M
Open:
ACTIVITIES
1 2 3 4 5 6 7 8 9 10
A
E
D
H
AE
DH
Closed:
ActivityActive Node
Inactive Node
Virtual Node
Summary Path
Edge weight = 1Edge weight = 0
Closed Node
A E
∞
0
∞
∞∞0
0
0
D
0
H
X1
B
1 < 0?0
0
A
0
0
Motivation Problem Contributions Validation Summary
Design Decision: Network Voronoi (NV) Activity Assignment
A B C D
E F G H
1
2
3 4
5 6
7 8
9
10
X
DIS
TA
NC
E F
RO
M
Open:
ACTIVITIES
1 2 3 4 5 6 7 8 9 10
A
E
D
H
AE
DH
Closed:
ActivityActive Node
Inactive Node
Virtual Node
Summary Path
Edge weight = 1Edge weight = 0
Closed Node
E
∞
0
∞
∞0
0
0
D
0
H
X1
B
0
0
A
F
10
0
0 0
0 0
E
0 0
Motivation Problem Contributions Validation Summary
Design Decision: Network Voronoi (NV) Activity Assignment
A B C D
E F G H
1
2
3 4
5 6
7 8
9
10
X
DIS
TA
NC
E F
RO
M
Open:
ACTIVITIES
1 2 3 4 5 6 7 8 9 10
A
E
D
H
AE
DH
Closed:
ActivityActive Node
Inactive Node
Virtual Node
Summary Path
Edge weight = 1Edge weight = 0
Closed Node
0
∞
∞0
0
0
D
0
H
X1
B
0
0
A
F
1 0
0
0 0
0 0
E1
C
0 0
0 0
1 < 0?
0 0
0 0
D
Motivation Problem Contributions Validation Summary
Design Decision: Network Voronoi (NV) Activity Assignment
A B C D
E F G H
1
2
3 4
5 6
7 8
9
10
X
DIS
TA
NC
E F
RO
M
Open:
ACTIVITIES
1 2 3 4 5 6 7 8 9 10
A
E
D
H
AE
DH
Closed:
ActivityActive Node
Inactive Node
Virtual Node
Summary Path
Edge weight = 1Edge weight = 0
Closed Node
0
∞
0
0
0
0
H
X1
B
0
0
A
F
1 0
0
0 0
0 0
E1
C
0 0
0 0
0 0
0 0
D
1
G
H
0 0

Motivation Problem Contributions Validation Summary
Design Decision: Network Voronoi (NV) Activity Assignment
A B C D
E F G H
1
2
3 4
5 6
7 8
9
10
X
DIS
TA
NC
E F
RO
M
Open:
ACTIVITIES
1 2 3 4 5 6 7 8 9 10
A
E
D
H
AE
DH
Closed:
ActivityActive Node
Inactive Node
Virtual Node
Summary Path
Edge weight = 1Edge weight = 0
Closed Node
0
0
0
0
0
X1
B
0
0
A
F
1 0
0
0 0
0 0
E1
C
0 0
0 0
0 0
0 0
D
1
G
H2 < 1?
1
1
1
1
2 < 1?
B
0 0
Motivation Problem Contributions Validation Summary
Design Decision: Network Voronoi (NV) Activity Assignment
A B C D
E F G H
1
2
3 4
5 6
7 8
9
10
X
DIS
TA
NC
E F
RO
M
Open:
ACTIVITIES
1 2 3 4 5 6 7 8 9 10
A
E
D
H
AE
DH
Closed:
ActivityActive Node
Inactive Node
Virtual Node
Summary Path
Edge weight = 1Edge weight = 0
Closed Node
0
0
0
0
0
X1
0
0
A
F
1 0
0
0 0
0 0
E1
C
0 0
0 0
0 0
0 0
D
1
G
H
1
1
1
1
B
2 < 1?
F
0 0
Motivation Problem Contributions Validation Summary
Design Decision: Network Voronoi (NV) Activity Assignment
A B C D
E F G H
1
2
3 4
5 6
7 8
9
10
X
DIS
TA
NC
E F
RO
M
Open:
ACTIVITIES
1 2 3 4 5 6 7 8 9 10
A
E
D
H
AE
DH
Closed:
ActivityActive Node
Inactive Node
Virtual Node
Summary Path
Edge weight = 1Edge weight = 0
Closed Node
0
0
0
0
0
X1
0
0
A
1 0
0
0 0
0 0
E1
C
0 0
0 0
0 0
0 0
D
1
G
H
1
1
1
1
B F
1 1
1 1
C
2 < 1?
0 0

Motivation Problem Contributions Validation Summary
Design Decision: Network Voronoi (NV) Activity Assignment
Network Voronoi Activity Assignment algorithm
Input: Graph G = (N, E), a set of Activities A, a set of k Summary Paths, S
Output: A set of k clusters formed by assigning all ai A to one s∈ i S, where dist(a∈ i, si) ≤ dist(ai, sj) and sj S and s∈ j ≠ si
1. Open ← all nodes S, Closed ← Ø∈2. Tnodes ← all nodes S, ∈3. Tactivities ← activities on si S∈4. repeat5. nc ← next node Open∈6. remove nc from Open7. Closed ← nc 8. X ← neighbors of nc9. foreach xi X∈10. if xi Tnodes and xi Closed ∉ ∉11. Tnodes ← xi12. xi.prev ← nc, 13. xi.dist ← dist(xi, nc) + nc.dist
14. xi.sp ← nc.sp15. else if xi Tnodes ∈16. update xi if new dist < xi.dist
17. if xi Open∉18. Open ← xi19. Y ← activities on edge {nc, xi}20. foreach yi Y∈21. if yi Tactivities ∉22. Tactivities ← yi23. yi.prev ← nc24. yi.dist ← xi.dist25. yi.sp ← xi.sp26. else 27. update yi if new dist < yi.dist28. until all active nodes Closed∈29. return currentClusters

Motivation Problem Contributions Validation Summary
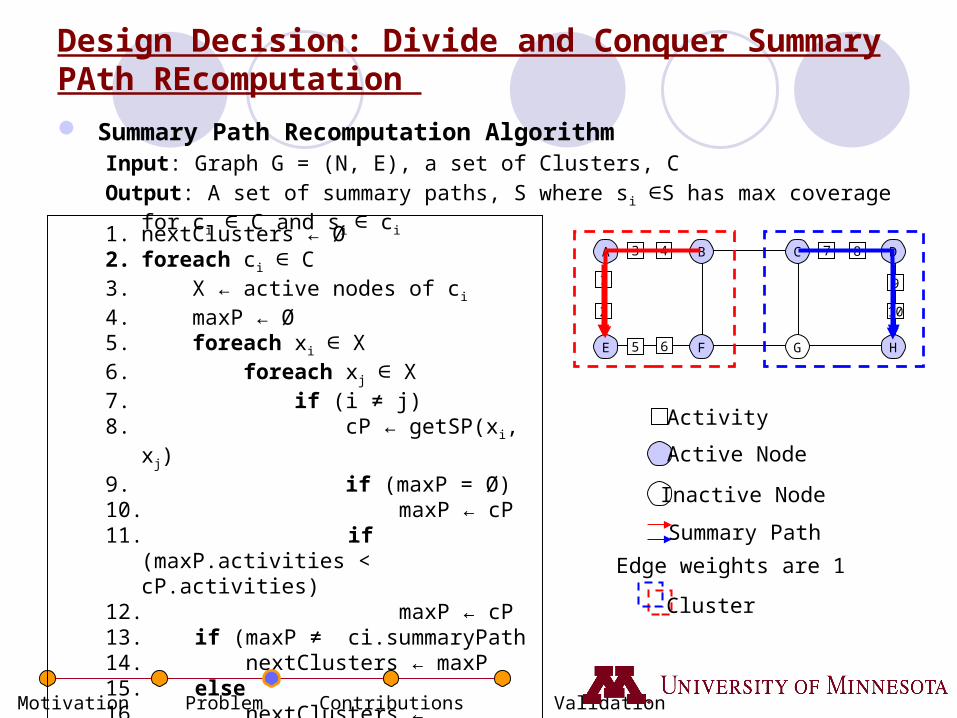
Design Decision: Divide and Conquer Summary PAth REcomputation Goals
Recompute the summary path of each cluster Improve execution time of current recomputation strategy
Example (execution trace) Next
K-Main Routes AlgorithmSelect k shortest paths as initial summary paths
Repeat
1. Network Voronoi Activity Assignment
2. Recompute summary path of each clusterUntil summary paths do not change
K-Main Routes AlgorithmSelect k shortest paths as initial summary paths
Repeat
1. Network Voronoi Activity Assignment
2. Divide and Conquer Summary path Recomputation Design Decision
Until summary paths do not change
Motivation Problem Contributions Validation Summary
Design Decision: Divide and Conquer Summary PAth REcomputation
Summary Path Recomputation AlgorithmInput: Graph G = (N, E), a set of Clusters, C
Output: A set of summary paths, S where si S has max coverage for c∈ i C and s∈ i c∈ i
1. nextClusters ← Ø2. foreach ci C ∈3. X ← active nodes of ci
4. maxP ← Ø5. foreach xi X∈6. foreach xj X∈7. if (i ≠ j)8. cP ← getSP(xi, xj) 9. if (maxP = Ø)10. maxP ← cP11. if (maxP.activities < cP.activities)12. maxP ← cP13. if (maxP ≠ ci.summaryPath14. nextClusters ← maxP15. else 16. nextClusters ← ci.summaryPath17. return nextClusters
A B C D
E F G H
1
2
3 4
5 6
7 8
9
10
Activity
Active Node
Inactive Node
Summary Path
Edge weights are 1
Cluster

Motivation Problem Contributions Validation Summary
Validation
Analytical Cost analysis explaining computational savings
Experimental Comparative analysis of KMR with various design decisions Performed on real and synthetic data Network voronoi activity assignment and divide and conquer summary path
recomputation saves computational costs Savings increase with number of nodes, routes, activities and active node ratio
Case studies Qualitatively shows the usefulness of network based summarization on Crime
data

Motivation Problem Contributions Validation Summary
Analytical Evaluation: Computational Analysis
KMR Execution Time = Number of Iterations × (Activity Assignment Cost + Summary Path Recomputation Cost)
TKMR = I × ([K × |A| × cost(ai,ci)] + [K × dc × |N|2])
TKMR_I = I × ([K × |A| × cost(ai,ci)] + [K × dc × (|N| × r)2])
TKMR_IAS = I × ([|E| + |N|×log |N|] + [K × dc × (|N|/K × r)2])
I = Number of IterationsK = Number of ClustersA = Set of activitiescost(ai, ci) = Cost of calculating the distance between activity ai and cluster ci
dc = Cost of looking up a pathN = Set of NodesE = Set of Edgesr = active node ratio, 0 ≤ r ≤ 1

Motivation Problem Contributions Validation Summary
Experimental Evaluation
• Goal: Comparative analysis• Candidates: KMR with various design decisions
• KMR_I – KMR with inactive node pruning• KMR_IV – KMR with inactive node pruning and Network voronoi activity assignment• KMR_ID – KMR with Divide and conquer summary path recomputation• KMR_IVD – KMR with all three design decisions
• Measure: CPU time (Unix time command)• Platform: Mac Pro, 2 x Xeon Quad Core 2.26 GHz, 16 GB RAM• Variables: #Nodes, #Routes, #Activities, Active Node Ratio• Fixed Parameters: unit edge length• Datasets: Synthetic and Real (Haiti Earthquake)
Real Dataset
Analysis
#Nodes
#RoutesJava-based Simulator
KMR_I KMR_IV Candidates
Variables
#Activities
Active Node Ratio
Measures
Synthetic Dataset
KMR_ID KMR_IVD

Motivation Problem Contributions Validation Summary
Data Description and Characteristics Synthetic Data
2010 Census TIGER/Line® Shapefiles used for road network Activities randomly assigned to each edge
Real-world data: Haiti Data Set Geospatial and Temporal Dataset describing recent events post-disaster Dataset collected from Jan 12, 2010 to March 23, 2010 1,677 records
CharacteristicsAttributes
• Incident Title (e.g., “Food, Water, Tents needed…”)• Incident Date and Time• Location (City, port name)• Category (numeric category)• Latitude/Longitude
SourcesCrisis Map of Haiti - http://haiti.ushahidi.com/OpenStreetMap - http://www.openstreetmap.org/
Motivation Problem Contributions Validation Summary
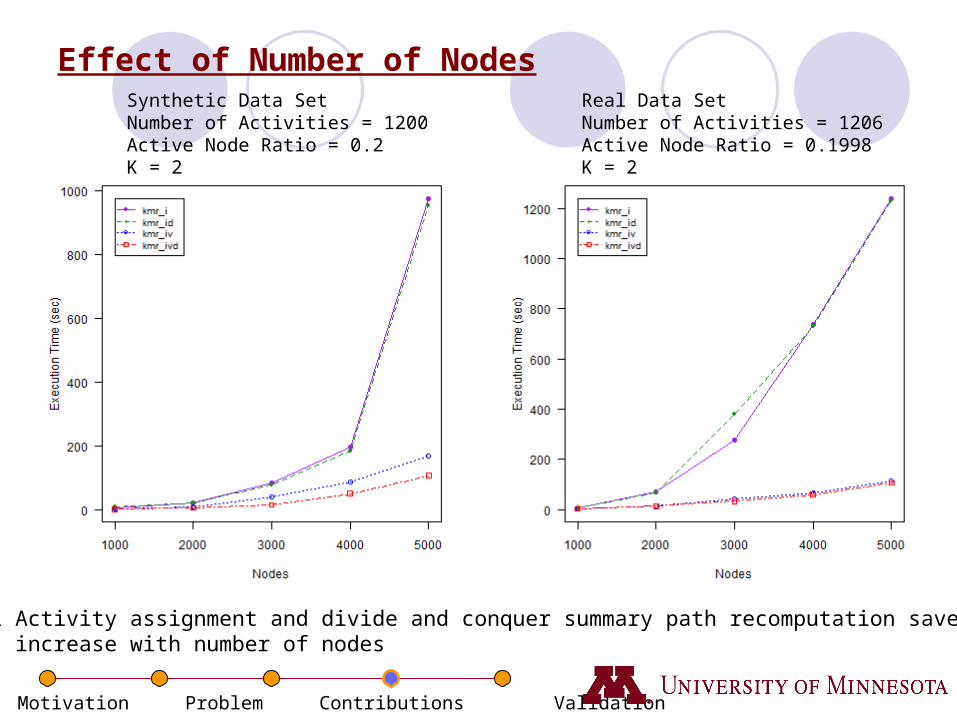
Effect of Number of NodesSynthetic Data SetNumber of Activities = 1200Active Node Ratio = 0.2K = 2
Trends: Voronoi Activity assignment and divide and conquer summary path recomputation saves comp. costs Savings increase with number of nodes
Real Data SetNumber of Activities = 1206Active Node Ratio = 0.1998K = 2
Motivation Problem Contributions Validation Summary
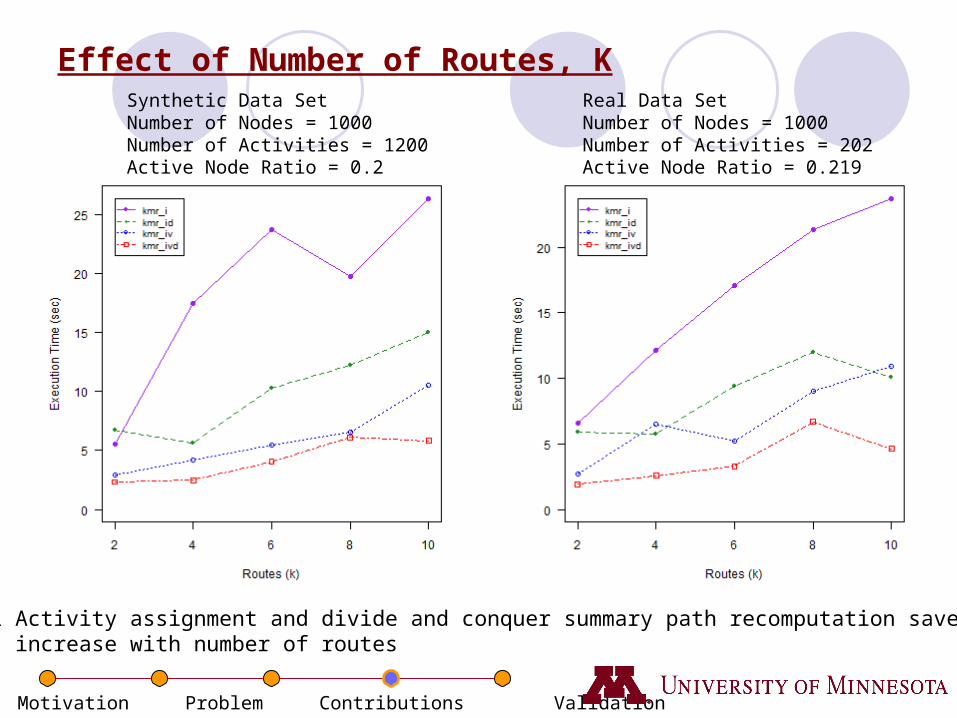
Effect of Number of Routes, KSynthetic Data SetNumber of Nodes = 1000Number of Activities = 1200Active Node Ratio = 0.2
Real Data SetNumber of Nodes = 1000Number of Activities = 202Active Node Ratio = 0.219
Trends: Voronoi Activity assignment and divide and conquer summary path recomputation saves comp. costs Savings increase with number of routes
Motivation Problem Contributions Validation Summary
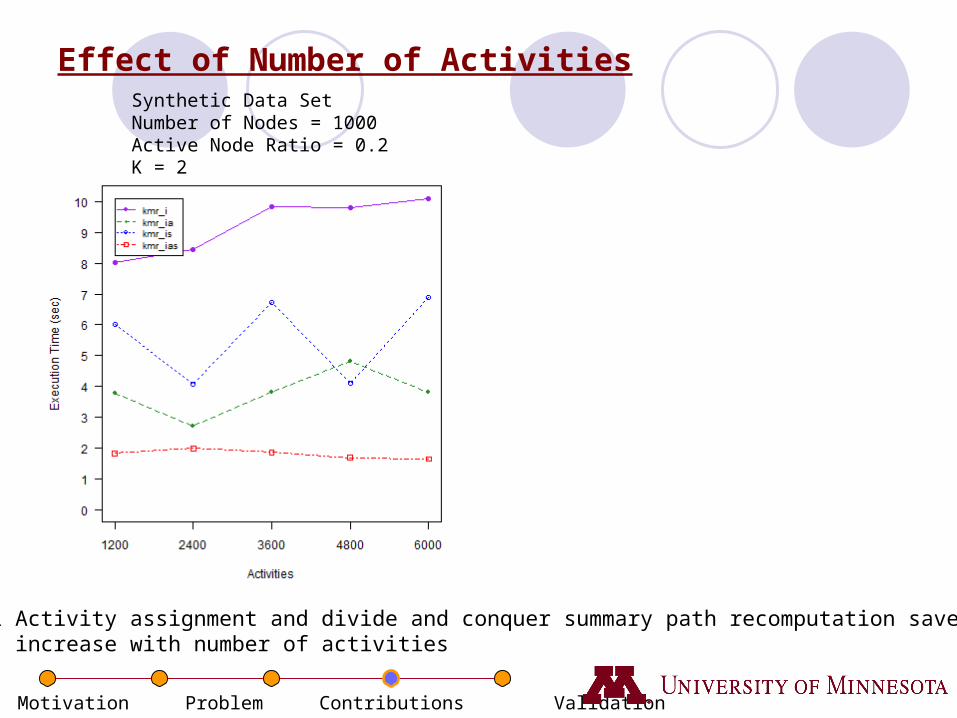
Effect of Number of ActivitiesSynthetic Data SetNumber of Nodes = 1000Active Node Ratio = 0.2 K = 2
Trends: Voronoi Activity assignment and divide and conquer summary path recomputation saves comp. costs Savings increase with number of activities
Motivation Problem Contributions Validation Summary
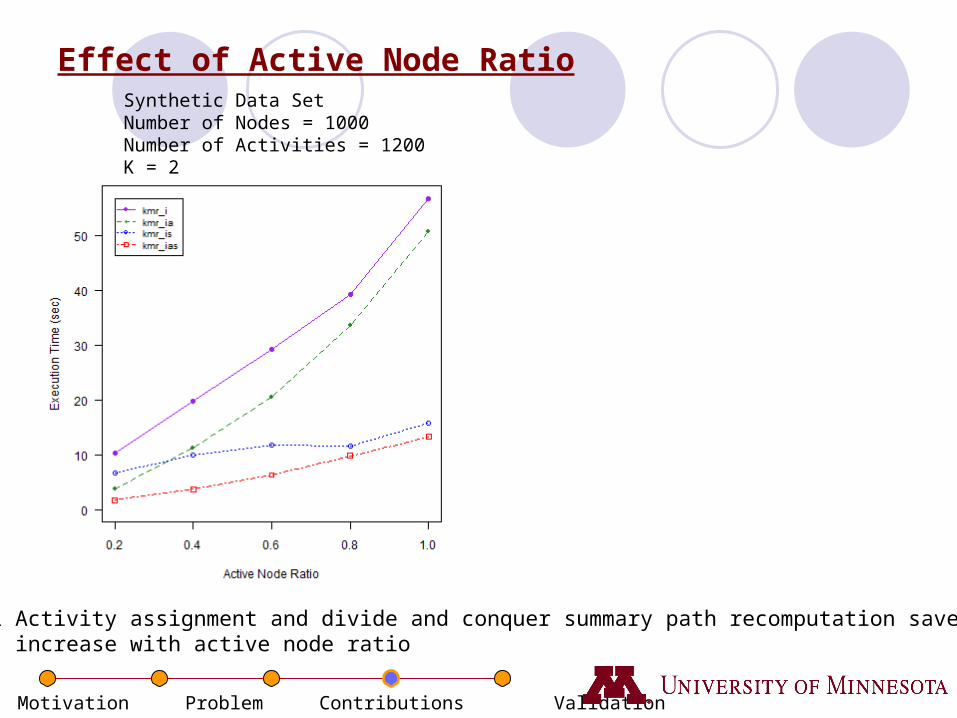
Effect of Active Node RatioSynthetic Data SetNumber of Nodes = 1000Number of Activities = 1200 K = 2
Trends: Voronoi Activity assignment and divide and conquer summary path recomputation saves comp. costs Savings increase with active node ratio

Input (a set of crime incidents, k=5) KMR Output
Crimestat K-Means (Euclidean distance) Crimestat K-Means (Network distance)
Case Study: Crime Analysis

Input (a set of crime incidents, k=5) KMR Output
Crimestat K-Means (Euclidean distance) Crimestat K-Means (Network distance)
Case Study: Crime Analysis

Input (a set of crime incidents, k=5) KMR Output
Crimestat K-Means (Euclidean distance) Crimestat K-Means (Network distance)
Case Study: Crime Analysis

Motivation Problem Contributions Validation Summary
Summary
Spatial network activity summarization was shown to be NP-complete.
K-Main Routes (KMR) algorithm and its design decisions described Inactive node pruning Network Voronoi Activity assignment Divide and Conquer Summary path recomputation
Analytically demonstrated correctness of design decisions and cost analysis showed
Experimental evaluation Performance evaluated using synthetic and real world datasets
Case study comparing KMR with geometry based summarization

Acknowledgements
Members of the Spatial Database and Spatial Data Mining Research Group, University of Minnesota, Twin-Cities.
This work was supported by grants from USARMY and USDOD.
Thank you for your time! Any questions or comments?