Embed Size (px)
Citation preview

A JOINT ANALYSIS OF HIGH-ENERGY NEUTRONS AND
NEUTRON-l)ECAY PROTONS FROM A FLARE
I.. G. KOCI-IAROV, .I. TORSTI and R. VAINIO Spac'e Re.seorch s L'sffversily o/" Thrl, u, SF-20520 7hrl~z,,, Ihl lam/
G. A. KOVALTSOV and I. G. I . .JSOSKIN ..t.1,: h:?.g]"e l~h.y.vical- 7~!chnical Ii'l.~lilttle, .S'l. I)elel:sl~zHg 194021. RHs.ffa
(Received ll April, 19%; in final form 19.1uly., 1996)
Abstract. A .joint. analysis of neum;m monitor and G()F','S dai-a is performed to sludy the production of high-e]lcrg3, nctlITons at Ihe SulL The main olziccls of lhe research arc the spectrtnTi of >50 MeV neulrorls and a possible Sl-)ectrui11 of primar.v (interacting) protons which produced those neutr,,)llS durillg the major 1990 Ma\ 24 solar flare, l)ifi~wenl possible scenarios of the neutron production are prcsenled. The high magrfilude of the 1990 May 24 neutron event provided an oppor u ~ ly to delect neu[ron decay prolons of higher energies titan ever belorc. We compare predictions of the proposed models of ilct.ltron produclion with ttle observations of prolons on board C;OES 6 and 7. It is shown thai Ihe 'precur,;or" in high-energy GOES channels observed during 2{):55-- 21:09 UT can be I~:tt ~ y exl)laincd as origin ilillo froln c. ;.',t?~ ,~. of neutrons in the interplanetary medium. The ratio of COUllting itatcs observed in different GOES channels can ensure the seleclion of the model parameters.
1"he SOl of cxpefimeutal dala can be explained in Ihc framework of a scenario which assumes the existence ofhvo COlnpOllCnlS of inleracting ])roIons ill the flare. ,.\ hard sl)cctrmll componerlt (the first compotlent) gcncrales neutrotls during a short lime M~ile Ihe interaction tlJthe second (soft spQclru111) component lasts longer. Alternative scenarios are found to be of lesser likelihood. 1-'he inte isity -lime profile of ileutroll- decay plolons g:tS predicted in the framework of the hvo-coll+ponent exponcnlial model of neutron produclion (Kocharov el al.+ 1994a) is in an agreement with the prolon proliles observer on board GOI.::S. We cornpare the deduced characlerislics of JnlclaclJllg high-energy i:)l'Ol.ons with the characteristics of protons escaping into the interplanetary medium. It is shown that, in the 100 1000 McV range, the spcclrum of the second component of interacling prolorls ,,,,;is close to lhe spectrum of the prompt componcnt of interplanetary prolons. However, il is most likely Ihat. at �9 ~300 Me\Z, the intcracling proton spectrunl was slighlly softer Ihan the spcclrum t)f interplanetary pl'OIOllS. /\rl analysis of ganmla-ray emission is required to deduce the spc, clrunl of interacting protons below 100 MeV and above I GeM
1. Introduction
The neutron monitor network is able to detect a solar neutron event-. I lov,.cver, it has only a limited capability for a study of Ihe neutron energy spectrum. On the other hand, measurements of spectra of neutron decay protons on board satellites are possible (Evenson el al. , 1983..I 990; Evenson, Meyer. and Pyle, 1983; Evcnson, Kroeger, and Meyer. 1985). This provides a capabilily to deduce the spectrum of solar neulrons more exactly, llowex.er, for such an approach, it is necessary, firstly, lo ensure that the studied prolon increase is of lhe neutron decay nature. What can show whether it is true or not is the observalion of Ihe neulrons l:rom the same ltarc (e.g., Zhang. 1995). Thus, a joint analysis of nCtlh'Oll alld proton data is necessary.
SolcH" Ph v.`,ic:~ 169: [ 81-207, 1996. (~ 1996 Kltmer AccIde/nic' I'ttb/i.vhe~:r. Pri , led in Belgium.

182 I,. (;. KOCIIAI,~O\: ET AL.
We perform such an analysis fl~r the 1990 May 24 flare, which was a source of the most powerful neutron event known so t'ar. This is the lirst time that the analysis is possible for neutrons with some hundreds of MeV energy.
The 199(i) May 24 [lare has been observed in many high-energy bands and this provided a great deal of information on high-energy particles (Pylc, Shea. and Smart, 1991; Shea, Slnart, and Pyle, 1991; Pelaez el al., 1992; Debrunner, Lock- wood, and Ryan, 1993; Talon et al.. 1993; Terekhov el al., 1993; Kocharov er al., 1993; Kovallsov, Efimov, and Kocharov, 1993; Kovaltsov et a/.. 1994; Kocharov el al., 1994a). In particular thc flare was a source o1 high-energy nucleons detec- ted by the neutron monitor network. The 1990 May 24 increase of the neutron monitor counting rate had two distinct peaks. The characteristics of the second increase (at ~,21.: 11 UT) were normal for a solar proton event. The first increase (at ~20:51 UT) of short duration was delected only by monitors on the day side of the Earth, and this increase strongly depended on the air mass along the line of sight to the Sun. These circumstances allowed Shea, Smart, and Pyle (1991) Io ascribe the first increase to the arrival of solar neutrons. ]'he ncutron origin of this increase was proved by Kovaltsov, Efimov, and Kocharov (I.993), who noted that the response of neutron monitors to solar neutrons does not follow a simple exponential dependence on the air mass along the line of sight to the Sun because of the contribution of neutrons scattered through large angles. Neglec! of this fact might be responsible fl)r misin|erpretation of the event.
A part of the solar neutrons decays when moving from the Sun, produces secondary protons. Those protons, if they havc been produced near the Earth- connected magnetic line, can be detected bel.k)re the onset of a major proton event. Three such neutron-decay proton events (21 June, 1980, 3 June, 1982, 25 April, 1984) were detecled earlier on board the ISEE-3 spacecraft (Evenson et al., 1990). These neutron-decay proton events were connected with the solar neutron events detected on board the SM M satellite, as well. as by ground-based neutron monilors (Chupp, 1990). Since the neutron event of 1990 May 24 was the strongest of Ihose known so far, one can expect neutron-decay protons to be detected for this event as well.
In our previous study (Kocharov et al., 1994a), we examined the properties of the 1990 May 24 flare source region on the basis of an integrated analysis of gamma-ray, high-energy neutron, optical, and microwave data. On the other hand, the major proton ex.'erlt has been studied rccently by Torsti et al. (1996). We extend these studies with an analysis of possible spectra of interacting high encrgy (E > 100 MeV) protons at the Sun (Sections 4 and 6) and neutron decay protons (Section 5). The onset of the major proton event was clearly seen in the intensity- time profile of the GOES proton channels. We determined the fact that some weak increase was clearly seen in the high-energy channels before the onset of the major proton event. Neutron-decay protons should produce such a 'precursor'. Inasmuch as, for this flare, high-energy neutrons were measured by neutron monitors, and interplanetary proton transport parameters are known (Torsti et al., 1996), one has

HIGI [-I-:NERGY N1-;UTRONS AND NI;;t;TRON-DI:;CAY PROI.()NS [ 83
a good chance to use this 'precursor' fi)x a verification of the parameters of nettlron injection fronl the Sun.
2. Observat ions
1 . ~ �9 The flare of 199(.) May 24 (X.)..~/I I3; N33 W78) occurred during 20:46 21:45 U"I in Ihe active region NOAA 6()63. Optical and microwave emissions of Ihe Ilare were discussed extensively by Kocharov et al. (1994a, 1996). Two sources of the ernissions were revealed. High-frequency microwave (10 GHz) and optical (H~ and Hcl)3) emissions were produced in a source of sizc ~ 2 x 109 cm, while low- frequency nlicrowave emission (1 Gltz) came from a sotuce of size ~ 2 x 10 i0 cm. Both sources were equally powerful in Ihe microwave band. This resuhed in a llqt spectrum of lhe emission at lhe maximunl of the burst (l,ee, Gary, and Zirin, 1994). An exponential decay of 1 GHz emission starled one lninute after the bursl maximum, had an ~-lbldin,~ time ~ 22() s, and lasled about 17 nlin. . &.,. . .
Radialion ill tile 2.2 MeV gamma-ray line was deteclcd durillg the Ilare by Ihe PHFBUS iristmme111 on board the GRANAT observatory (Tcrekhov el al., 1993). The decaying 2.2 .MeV line photon tlux was dclected during more than 8 mill afler tile 4 - 6 MeV intensity maximum. The e-folding time of Ihe 2.2 MeV emission gradually increased from ~ 180 s up to ~ 360 s during this time (the mean vahle of lhe e-folding time was 26(.) s for this time inlcrval). The 4--6 MeV intens- ity maximum coincided with the second peak in high-energy (157.5-- 110 MeV)
).L~) emphasized a hardening gamnm-ray e.mission (see Figure 1). Talon eta/. (1 c c- of the high-energy galilma-ray clnission specmnn at the onset of the second peak (20:48:27 UF ) and conch.ided that "hardening of the spectrum above 50 MeV durinc, the second peak stronolv sueeesled that meson decay eamma-rav radiation is dominant' (see also Vihner, 1994; and Troltet, 1994). Terekhov et al. (.1993) determin.ed tile fac! thai the second peak in 6 5 - 124 MeV band coincided with the maximum of 4 - 6 McV radiation, whicll gives additional support to the nuclear dominant explanation of the peak (see also Figure 9 by Takm e; a/., 1993). On tile other hand, it was noted by Terekhov el al. (1993) that the counlil'lg rate ill the PHEBUS 57 .5 - 11() MeV-channel did not decay down to the background level, as was observed at lower energies. 1"his lemporal behaviour was explained by lhe PHEBUS team to be a result of a contamination of the 57.5--. 110 MeV channel by solar neutrons (Talon el a/.. 1993; Terekhov el al., 1993). Figure 1 i It stmles Ihis interpretation. Solar neutrons are regarded as a source of lhe excess of thc 57.5 --110 McV channel counting rate observed after 20:50 UT.
Keeping in mind thai the 2.2 MeV gain.nil-ray line emission had an extremely hmg decay time, which is a signature of Iong-lastillg interaction of acceleraied protons with solar matter (Kocharov el al., 1994a), we approximate the time prolile of high-energy galnma-ray emission with two exponents:

1 ~ 4 I.. (7;. I<O(-.7II,M~.OV ET AI. .
0
_.Q
0
100
10 - i
i ilx p.,. x ' ~ x ~ x
J " " " .............. - " " " " - i m ' - m , ! , i �9 / - l [ - . � 9 i .........
- --... .... �9 � 9 1 st 2nd
. . . . . . . . . . . . . . . . . . . . . . . . . . . . . , i �9 15.9-21.2 MeV ....
background level i ! "~: 57.5-110 MeV
~' =0.45
. . . . . . . . . :o.65 ! l J I L . . . . . . . . . . . . . . . . . . . . . . . . . . . . . i
. . . . . . . . . . . . . . . . . I . . . . . . . . ~ . . . . . . . . . . . . . . . . . . . . . ~ - . . . . . . . .
0 5 0 100 150 200 250
T ime a f t e r 20:47:45, s e c
I"igl~ne I. The lemporal evolution of Ihe 1990 May 24 gamma-ray/neul ron event as observed by ille PHI :BUS delectors in two energy bands, 15.9 21.2 and 57.5- 110 MeV (Talon e# a/.. 1993). Arrows show Ihe t\vo peaks discussed. Curves illustrate the approximation of high-energy gamma-ray flux according to Equal:ion (I) for different values of lhe parame[cr { ' , '~.,. = 20 s. '~, = 260 s.
I ( l ) = s -exp t. " I~~" exP - ~ i !
- L 7 7 7:,,
where r times for the first ( f ) and tile second (s) components of tile emis- sion, :7~f and 7'.,,, are taken from tile observations of high-energy and 2.2 MeV gamnla-ray emissions respectively; the 'zero' time is 20:48:30 UT. The parameter ~ , which is the contribution of the lirsl component of the emission to the total flu- ence, should be adjusted to [it the observed time pmlile. One can see from Figure 1, that it is most likely that ~~ = 0.5.-(i).6. This indicates thai both the componenls (ahnosl) equally contribute to the high-energy emission. In what follows, we use the designations f and ,,: for Ihose interacting particles which produce gamma-ray emis- sions and neutrons at the S u n , a s well. The >300 MeV protons are considered to be a natural source of high-energy gamma-.ray emission observed after 20:48:30 urr. e\S an alternative, it might be proposed that electron bremsstrahlung was responsible for both peaks shown in Figure 1. However, one can see from Figure 15 by Pelaez el al. (1992) and Figure 1.0 by Talon el ol. (1993) that the 'electron-dominated' explanation of Ihe second sub-peak would implicate simultaneous hardening of the

I IIC;H-ENISRCIY NI::t,:TRONS ,.\NI) NI!t.rfI{C)N-I)ECAY I>I~,C]'IONS 185
0.1
>
0.01
o
<
E o ~ J
. + -
C 0 ,001
o o
0.0001
- . . . . . . . . . . . . . . . . . . . . . . , . . . . . . . ' . ... . ].. ' . . . . . . . . . . . .
: + o ' + s + , 7 ........... + : ' : : ..... ] : - . . . . . . . . . . . . . . . . . . . . . . . . . . . . . . . . . . . . . . . . . . . . . . :. . . . . . . . . . . . . . . . . . j +
/ . . . . : . . . . . . . . . . . . . . . . . . . . . . . . . . . . . . . : . . . . )_, -. ...... ,:/
I
I P5 / ' - ! - u s I +,, +- ............. . . _ ~ . __~, ~__~d- . ] : , _J= .~_ . _= t~"i i: _ . - - . _ _ ,
: :~~ ~ ; ~ S n--- r : . . . . . ~_-: : , : / ?
i . . . . . . . . . . . i . . . . . . . / . j . . . . . . . . . . . . . . . . . . . . . . . . i . . . . . . . . . . . . . ~ . .. J l . .
+ / �9 . . . . . . . . . . . . . . . . . . . . . . . . . . . :: . . . . . . . . . . . . . . . . . . . . . . . : . . . . . . . . . . . . . . . . . / . . . . . .
i P 6 . . . . . . . . . . . . . . . . . . . . . . . . . . . . . . . . . . . . . . . - - . . ! ( _ ' .... I
. . . . . . . . . . . . . . J l _ - ~ . . . - . . . I + . - �9 �9 �9 I " �9 ' .~,+ l j � 9 :::__ ..=a.~._..:.~= - . ~ = - ~ lIKe7... _: . . . . ~ : . . . . . ~ ._=.: .:
I : i
!............../' .. �9
. . . . .pT . . . . . . " . . . . . . . . . . . . . . . . . . . . . ! ~ " " " " 'i ' ' ; / / " :i . : : .i: ! i :::i::: v ! ! : + _ , : . . : ............... I
. + = + - * + - ++-- . . . . . . . . . . . . + ..... J . . . . . . . . . . . . . . . . .
i . . . . . . . . . . . i . . . . . . . . . .
. . . . . . . . . . . . ! . . . . . . . . . . . . . . . . 7 . . . . . . . . . . . . . . . . . . . . . . . . i
0 20 4 0 6 0 8 0
T ime a f t e r 2 0 : 0 2 : 3 0 UT, m in
/:/g~,rre 2. The 5-.rail>average uncol-rec[cd Ct)Lm{iJlg rate observed Oll bo;.tl-d C;()I~S 6 +!~tr 7 in three proton channels (avcragcd over the lwo satellites). A ' p r e c u r s o r is seen I~elol"e the onset of the mai(:,r proton evcnL The background lex els are shown I+y solid lines.
elecmm spectrum for energies above 50 MeV and softening of the spectrum in the 0 .8-15 MeV energy band. We cannot exclude such a complicated behaviour of the electron spectrum, but it seems to be less probable than Ihe 'pion dominated' scenario by Talon el a/. (1993).
]'he flare ol" 1990 May 24 was a source of a strong ground level evenl (GLE). The first increase detected by neutron monitors (2(i):49-.21:03 UT) was caused by the arrival of high-energy solar neutrons. The high magnitude of the 1990 May 24 ileUllOll event provided an e x t r a o r d i n a r y c h a n c e to study properties o[ n e u l r o l l
productioll at the Sun. Climax neutron monitor data for the neutron event were of the highest significance among the neutron monitors as well as of good, one- minute, time resoh.ltion. Thus thcse dala are lhe 1host suitable for the analysis. In the present paper, wc make use of records of neutron monitor counting rate taken i"rom the GI,1- Data Base (WDC-A). For the study of neutron decay protons, we employ data from the GOES 6 and 7 satellites on detection of protons at the Earth's orbit (CD GOES, 1992).
In Figure 2 we show thc mean of GOES 6 and GOES 7 5-rain averaged uncof recled counting rates. Background levels as obtained by averaging over the 19:40-

l g6 I.. G. KOCHAI:tOV EI" ..~,L.
> Q)
0
< E �9
0 0
I.OOE-03
8.00E-04
6.00E-04
4.00E-04
2,00E-04
0.00E+00
-2.00E-04
GOES 6,7
"1
P7
: + . -----I
P 10 15 20 25 30 , J
I "7 (57.5-110)
Time a f te r 20:40 UT on M a y 24, 1990, min
l"igure 3. The l-miri-average uncorrecled counting rate observed ill the P7 channel on board GOES 6 and 7 (averaged over the Iwo satellites). the background level is subtracted. The arrow illustrates the time of the maximum of the 57.5 - I 1(.) MeV gamma-ray emission as observed by PI II'.'.BUS/GI/ANAT detoctors.
20:40 UT interval are shown by solid lines. A 'precursor ' is cl.early seen in P7 and P6 channels before the major proton event. A less distinct 'precursor' may be seen in the P5 channel alicr 21:00 UT. It is seen from minute-averaged GOES data (Figure 3) that the onset o1' lhc precursor in the P7 channel coincided with the sharp maximum of the 57.5.-10() MeV galnma-ray emission as observed by
the GRANAT/PHEBUS detectors (Figure 1). The sharp pulse was seen in the P7 channel dur ing /he first miiiute (20:48-2(i):49 UT) only. The height o[" the pulse exceeded the l()cr level. It is known that a charged-particle detector has some sensitivity to gainma-ray elnission as well (e.g., Kocharov el al. , 1994b). No other emission in this energy band (I 1 0 - 5 0 0 MeV) but gamma-rays can arrive dur- ing the first minute. Furthermore, prolons, whenever being injected from the Sun, cannot produce one-minute pulses because of the velocity dispersion. For these reasons, one has to conclude that high-energy gamma-rays are the main source of thc lirst portion of the P7 channel 'precursor ' . The nature of the second portion ol" the precursor (20:55 - 2 1 : 0 9 UT) will be s/tidied in Seetit)ll 5.

HIGH-ENERGY NI!UfI~.ONS AND NEUTRON-I)ECAY PR(YlONS
3. The Model
187
3.1. INJECTION OF NI-UTRONS
A ground-based neutron monitor can effectively: detect solar neuuons with energy >30() MeV. It is usual for a study of solar neutron events to employ a model of neutron injection fiom the Sun, with some spectral and temporal parameters, to calculate an expected response of neutron monitors for those neutrons and to obtain va]ues of the parameters on the basis of a comparison of the ex.pecled response with the actual one. In a limited energy band (nan]ely, 100 MeV - 1 GeV), different approximations of neutron spectra can be adopted. For instance, Chupp el al. (11987) made use of'.. among others, exponential neutron spectra. More often, a power-law spectrum with an upper eutoll" is employed (Chupp el al., 1987; Debmnner, l~ockwood, and Ryan, 1993). In our previous paper (Kocharov el al.,
199'~a), we considered neutron injection from the Sun, proposing the neutron injection spectrum Io be exponential in energy. As the next slep in the study, we star! directly from the spec(rum of primary protons producing neutrons in nuclear interactions wilh solar matter. A power-law proton speclrum of interacting protons is employed, N ( E ) ---. 1~ -.s', with cutoff energ? c. Thus we use l.or the analysis a solar neutron injectio.n spectrum, /."-(,S) - F ( E . 5', c) (neutron MeV -I), which is Ihe spcctrum of neu|rons produced by prolons with a power-law spectrum in energy. (The neutron spectrum ilself is not a power-law one.) The energy spectrum of neutrons produced by those protons in the solar atmosphere has been calculated tk)r the isotropi.c thick-targel model by means of [tie Monte-Carlo lechnique described by.' Gueglel3ko el al. (1990). Throughout the prcsen( paper, this neutron spectrum is idenlified as the b'(S) spectrunL The F(S) spectrum is normalized per one interacting proton with energy above 600 MeV. Usually, the energy of 30 MeV is used as the n()rmalisation energy when dealing with interacting pro|on spectra. In the present paper, we make use of 600 MeV as the normalisation ene.~gy for the interacting proton speclrum, because such protons eflectively produce high- energy neutrons delectcd by neutron monilors. The F(5') spectrum as well as the exponential neutron spectrum adopted by Kocharov et aI. (1994a) is a Iheoretical tool for the analysis. Only a comparison of calculations wilh experimental data may show which neutron spectrum is closer to the actual spectrum of neutrons produced during the flare. However. the convenience of F(5') is that it shows explicitly lhc slope of the interacting proton spectrum (in Ihe corresponding energy band). In our calculalions, the helium abundance Help = 0.07 is employed (similar to Ilua and Lingcnfelter, 1987). A possible impact of higher vahms of the He/p-ratio has been studied additionally.
The employed model of neutron injection during the flare is based on the multi- wavelength sludy, including gamma-ray, microwave, and optical emissions (Kocha- roy et al., 1994a, 1996, and Section 2 of Ihe present paper). In the framework o1: this

] 88 L.. (3. KO(TH.,\ROV ET AI..
model, tile function of neutron il!jection towards the Earth (neutron s t - 1 s -I MeV- I ) is taken as
I . , t ) :\"0(> 600MeV) s =, ,~ - ; / 1.!::.( ,' . = . _ ' 4~ 7-1.) , l ' ( l : ' s r ' c r ) e x p +
where "u 600 MeV) is the tolal number of >600 MeV protons interacting at ,c is the portion of the first Ihe Sun (in the case of isotropic neutron production); ,,
component protons in the total proton number No(> 600 MeV); ~.S'.f,.,,s., ' and Tf(.<) denote proton spectral index and injection decay time of the firsl ( f ) or second (s) component. In l~quation. (2), the moment f =-- 0 corresponds Io 20 48:30 UT. Values of the decay lime of the neutron injeclion are taken as 'l-'.f - 20 S and ~11, = 260 s. Note thai a 3()r �9 \.ariation of these values would not lead to any essential chan,,e in the results of the analysis.
Sinmllaneously with high-energy neutrons, ~v:::-mesons are produced which is the most likely source of 57 .5 -110 IMeV emission observed after 20:48:30 UT. Ultra-relativistic electrons may also contribute to this emission. However this can- not afl:ect the conclusion that the time proIile ol: high-energy gamma-ray emission i.s the best empirical basis lkw a high-energy n e u l r o n production model, since high- ener~w~,, gamma-rays, are a si~namre~ of particles accelerated Io the hiohesl~., energies.
c, = 0 . 5 - 0 . 6 . This anyway. Thus, in a view of Figure I, il is most likely that ~ -- ~, circumstance was actually the initial point of Kocharov et al. (1994a). To perform an alternative study, we analyse all values of the 1)ammeter ~ .-,5_ [0, I ~ in the present paper.
3.2. NI2U'IR()N DECAY PROTONS
Models of the propagation of protons produced by decay of solar flare neutrons were developed by Kurganov and Ostryakov (1989, 1992) and by Rufl"olo (1991 ). These models treat the deposition, pitch-angle scattering, adiabatic focusing, and adiabatic deceleration of neutron-decay protons. We lake these effects into account. 14owever, we use another calculation technique than the one used in the papers above. In the present study, the propagation of secondary protons is traced by means of Monte-Carlo simulations. This technique is similar to that applied lo escaping (interplanelary) protons and relativistic electrons ill our recent study of the major solar COslnic-ray event of 1990 May 24 (Torsti et al., 1996) where two components (prompt and delayed) of interplanetary protons have been discussed. In contrast to the prompl component of interplanetary protons, neutron decay protons are injected not only at the foot of the interplanetary magnetic field line connected to the Earth but along the line as well. That is why the injection function of secondary protons should be taken as

HI(;II-I,:NERGY NELITRONS ANI) NI~UTRON-DI.i.CAY I)ROTONS 189
d%,.. Q(z, ts., l) =h dz d/s' dl d~S':,: 3,.rV/3(Z)r.(Z)2 X
{ "(z) } - cos }. (3) x exp " ")'rl .....
where Q(e,#, t) is the r'lte of neumm-decay proton produclion per unit of the magnelic line length, z, and per unil of lhe magnetic tube cross-section at lhe Earth's orbit, S:::::.. (i.e., we consider the production at any point along Ihe magnetic line as calculated per unit of tlle magimlic tube cross-section near the Earth); (~.(z) is Ihe angle between the normal io the solar surface at Ihe flare site and Ihe direction to Ihe point where the length of the magnetic line is equal, io z (i.e., (r(z) is the zenith angle as seen from Ihe Ilare sile); I.{cl:,/,'} is the intensity of neutron emission from lhe Sun (neutron sr- I s - I ) in a certain zenilh angle, (:}:, at lime l' -- /, - r ' (z) /V; r'(z) is the iadial distance to Ihe Sun; .)5(z) is the inclination of the interplanetary magnetic field line (see, e.g., Figure 8 of Torsii el al., 1996); 11 is the magnetic field slrenglh; V, 7, and r refer to the velocity, Lorentz-factor and dccay lime of a neutron, respectively. I1 is essential thai the use of the mean free path for the neulron-decay protons be similar Io that for the p r o m p t component of escapin<,~. protons (see Torsti et al., 1996), i..e., the mean free path of neumm decay protons is not an adjusting parameter. The total numbcr of traced secondary..' prolons was ,~ 2 • 1.() (~ in each set o[ calculations.
In our calculation we made use of the intensity of neulron emission Iowards the Earlh, 1.i:::-.', deduced from lleulron monitor data (see Equation (2)). In order to ca.lculate the flux of neulron-decay prolons, one should adopt some angular distribulion of neutron emission fiom the Sun, since those protons arc produced at any point along Ihe Earth, connected magnelJc field line. The magnetic field line connected at the Earth's was seen from the llare site al zenith angles (t, = 4() ~'-- 90 '->. In a general case, one may expect that the intensity ]{(t.. {:'} increases wiih (t:. The actual value of anisotropy o" neulron emission depends on the maonetic environmeril at Ihe flare site. Recently, we considered the angular distribution of lleutron emission fiom the 1991 March 22 solar llare (Kocharov et al. , 1995). This
( t flare was found to be similar lo the 1.:).;)() May ")4 flare with respecl to optical and microwave emissions. However, Ihe flux of high-energy neutrons as deduced from neutrola monitor data for the 1991 lVlarch 22 flare, was lower, which might be caused by the difference in the two flare locations on the solar disk. In the case of the 1991 March 22 llare, the Earlh was seen from Ihe llare sile al zeriith angle (t:., ...... 33:, while (t,;,; was 80 ~ in the case of 1990 Max; 24 flare. It was found that a relative neutron brightening, -'l_x, or the 199(.)May 24 flare due to this diflcrence in the zenilh angle was not hirge: l < ~.IA <" 3. Takintz into account
_ _22 ~.
ltlJs comparison, we consider two possibililies for lhe angular distribution of solar netttrons: (i) the isotropic neutron emission (AA = 1. along the magnetic field line): (ii) moderate weakening of neuiroil emission at small (x (by fiictor/1A = 2), I {o: . / . ' } = I,:::./AA at ~, < 57" (for ilhistraiion see Figure 8 by Worsti e t al., 1996).
190 I.. G. KOCIIAROV EI AI..
Table I Best-fit parameters o1: inleraclillg proton spectra
S.f ,% -\"u(> 60() MeV) i ():~,:~ X.'2( 1311
0.00 - 1.6 3.2 10.9 0.10 2.() 2.1 3.4 7.6 0.30 2.9 3.0 4.4 9.9 0.40 3.1 3.6 4.7 12.3 0.50 3. I 4.4 4.5 13.4 0.60 3.2 5.0 4. I 13.3 0.70 3,3 5.5 3.9 12.8 0.90 3.4 6.8 3.4 13. I 0.95 3.5 7.3 3.4 14.6 0.97 3.6 7.4 3.7 22.4
0.40 3.0 Eq. (4) 4.4 (Y = 0.0) 15.0 0.44 3.1 Eq. (4) 4.2 (Y = 1.0) 13.9 0.48 3.1 Eq. (4) 4.0(Y = 2.0) 13.1 0.50 3.1 Eq. (4) 3.8 (Y = 3.0) 12.7
The proton intensities obtained were recalculated to uncorrected GOES counting rates with all the secondmy channels taken into account (similar to ~ll)rsti el al., 1996).
4. A n a l y s i s o f N e u t r o n M o n i t o r D a t a
The analysis was t aMed out by means of a comparison of the simulated response of the Climax neutron monitor for the 1990 May 24 event wilh the observed one by a X2-tesl. The comparison was done for 14 one-minute intervals from the start of the counting rate increase at 20:49 UT until the arrival of first, relativistic protons at
the Earth's orbit at 21:03 UT. We also took into account the fact that. there was no signilicant response of the monitor during 20 :4 8 -2 0 :4 9 UT. We varied the model over 5 parameters: ~, S.f , ,5'.~, e f, and e..~. A finite value of the cutoff energy has been ffmnd to be essential for the first component only, c..f < 5 GeV, otherwise the counting rate of the Climax monitor during the first minute interval (20:48-- 20:49 UT) must be much higher than the observed one. The results presented in this paper are shown R)r e.f = e, =: 5 GeV. Examples of the fits obtained are shown in Figure 4. The best-fit parameters are presented in Table I. In Figure 5 we show the 90% confidence contours in the (S./,, S0-p lane for difl."erent possible values of the parameter ~. (The 9()% confidence corresponds to the value of X 2 (13) = 19.8.)
Two qualitatively different cases can be seen in Figure 5. First, in the range of { .<_ 0.46, it is possible to have equal spectral indices for the components. In this case, both the components may be considered as different portions of a single

k[ l( ; l l ENER(.]Y NEUTI),ONS AND NECTI~,ON-I)I!C.VY I:'.R()I(.)NS [ 9 1
~=0 ~=0.3
3 5 . . . . . . . . . . . . . . . . . . . . . . . 3 5 . . . . . . . . . . . . . . . . . . . . . . . .
3 0 -.. i
2 5
2O
o3 -,~ 1'5
o g 10 I I
5 �9 i - -
0 . - ,._ !
li
t ' !
i - 3 0 0 0 3 0 0 6 0 0 9 0 0
see, after 20:48:30 UT
3O
i 2 5 . . -
2 0
r
8 10
0 �9 -,- .~] F"
, !
;~./.
I~ " ! k .__ "
,r ' ~ !
'~..,~,.~...~, ~
_'5 . . . . . . . . . . _ _ _ , ._L , _ . �9 . . . . . . . . . ,
- 3 0 0 0 3 0 0 6 0 0 9 0 0
sec, after 20:48:30 UT
"5,,=0.5
3 5 . . . . . . . . . . . . . . . . . . . .
3 0
2 5
2O
I/J 15
5
o -
-5
- 3 0 0
h. I
L . : - -
0 3 0 0 6 0 0 9 0 0
s e e , a f t e r 2 0 : 4 8 : 3 0 U T
,~=0.7 3 5 . . . . . . . . . . . . . . . . .
3 0 -
2 5 :
o 2O g
~ 1 5 r
:3
O 1 0 , =
5 7 . . . .
0 .
-.'5 : . . . . . . . . , ~ . - - " - : - - - - ~-- ~ ' . . . . . .
- 3 0 0 0 3 0 0 60t3
see, after 20:48:30 LIT 9 0 0
I-);eure 4. The illustration o1: filling to the Climax net~llfm nlonltor cotmlillg rate al different modt,'l parameters (see Table I). Contr ibut ions of fl~c first ( f ) and the second (.~) components of solar neulrons into the total calcuhlted cot:ruling rate (~]) arc sho~vn In the case o f ( = 0, i1() impulsive neutron production is proposed. The hislogram with error bars represents the obser~.cd counting tale.
population (.).17 accelerated particles at tile flare site (of., Guglenko el aL, 1990). The 90% confidence contour for tile case ,5'f :- & is shown in Figure 6. II is seen lha! a possible speclruln of inleracting protons is rather hard, 5'.1 . . . . Es ~ 3.4. In contrast, at ~ > 0.46, the ,s.-component spectrum .is always softer Ihan the speclrum of f - componen t protons. In particular, the value of Ss could possibly bc equal to the spectral index of.-~ 1 GcV interplanelary protons, ,5't~ : 4.5 (prompl component prot(ms according to "lbrsti el a/., 1996). It is noteworthy that the spectral index of ,s'-co.mponent protons becomes close to IIlal o.r interplanetary parlicles when the parameter ~ takes its most likely value ~, - 0.5 (as discussed in Sections 2 and 3.1). One case of each lype has been sampled li)r more detailed analysis:

192 t.. G. K()CI.iAROV E.I AL.
6
5.5
5
4.5
s f 4
3.5
3
2.5
2
1.5
t \",\\ t "\ ss= ,
.................. Q,', Ss=Sp
\ . . . . . . . . . . . . . . . . . . . . . . . . . . . . . . / ................
, 1PL At/ " \ / " --: ....... "~2PL ~'~., ' ~ ~ ~ .] ~ ............... ~ _ ........ .... ]
. . . . . . . . _ \ . . . . . . . . . . . . . . . . . . . . . . . . . . a
i I I '1 I I I I
1.5 2 2.5 3 3.5 4 4.5 5 5.5 Ss
CLIMAX NM
~,e,...0.9 ",, ' . . . . . . . . . . . . . J
I I I 6 6.5 7 7.5
1"Tgt~re 5. The results of lhe parameter [itting of the Climax ilet.ltron monitor cotmting rate at dilTerent values o1' the parameter ~. The contours represents the 90% confidence level in the proton spectral index plane (S.f, ,5'.<, ). The line ,5'.~ = s corresponds to the ease when the first and second components of interacting protons may be considered as di[fcrent portions or a single population of interacting particles at the Sun. The ,5',., = Sp line illustrates Ihe case when the second component spectrum is close to the spectrum of die prompt component of intel'planet:lr.x, protons al ~ I GeV. Black triangles marked with IPL and 2Pl_, show the values of parameters sampled for calcuh.tlions of neul.ron decay protons.
(i) S.f = ,~'.~ = 3.0 at ~ -- 0.3, and (ii) S.r := 3.0, 5,'.~ = 4.5 at ( --- 0.5 (marked with IPL and 2PI. in Table I[, respectively). In. the next. section, we will compare expected fluxes of neutron decay protons for IPL and 2PL cases with the GOES observal ions to deduce the actual neutron spectruln in the event. Other possibil it ies will be discussed as well .
5. N e u t r o n D e c a y P r o t o n s
We compare in tens i ty- t ime profiles observed in the high-energy GOES channels (P5 - P 7 ) with neutron decay profiles expected for dil'[erent cases listed ill Table I1. All the observed counting rates are averaged over the two GOES satellites to get better statistics. Background levels are subtracted. Figure 7 shows calculated and observed profiles in the P6 (84-.200 MeV) channel. As was discussed in Section. 2, the excess o1 the P7 (110-500 MeV) channel counting rate observed

I IIGH-ENI~RGY NEUTRONS ANI) NEUTI{()N-DI:;(~AY PR()T()NS ] 9 3
3.5
3.3
3.1
2.9
2.7
S2.5
2.3
2.1
1.9
1.7
1.5
0 0.5 0.1 0.2 0.3 0.4
k]g t t r e 6. The resulls o f the parameter fhting of the Climax neutron monitor COLmtJng rate. The contour represenlS the 90% conlidcnce level in tile proton speclral index vs the parameter ~ plane. The contour is obtained wilh the consuaint ,% = S'./ = ,5'. I , this case, tl~e lirsl and lhc second components of f.lle interacting protons may be considered as different portions of a single population of interacting par[iclcs at the Sun. The Iriangle marl<ed ' I PI_.' shows the values of paramel.crs sampled I:or calculalions of llCUnon-deca 3. prololl: ' .;.
Table ll
l:'al-allle[C,lS i"o1 calCl.llaliOll o i l letl tron-decav pl()[(.)llS
r .S', 5', 5 , .:\-0(> 600 MeV} ; \ '", (> 6(i)0 McV) s .... I 0 ''~ ' .4.-, ' I1) . . . . [ 0:'o
0.30 3.() 3.0 - 4.4 1.0 0.0 [ PL
0.50 3.0 4.5 -. 4.5 2.0 0.0 2 P I .
0.40 3.0 Eq. (14) 4.4 1.0 0.0 BPL
0.30 3.0 3.0 4.4 2.0 0.0 1PI.A
0.40 3.0 3.0 4 .5 4.0 2.0 1.0 3Pl .A
0 . 5 5 ]':.f --- E.,, - " 2.0 EXP"
310 MeV 80 MeV
"~" ".'~'1 'V~ / : ' ' ( r lCL::1"~ ~.4.~7'~ "%'nC.LIr ~ / ' . . "Only i,3 the EXP case, ~ ~ = :3,'~ . . . . . "(>..~00 . . . e , j / . .% 'L.> 300 .a,e~ ), : , o ~../ 300 McV --
1.0 x 10 ~~ (according Io Table l by Kochar(Jv et al . , 1994a, for 7'..:, : : 260 s).

194
0.0035
] ,. G. KOCI[..\ROV ET AI_.
P
o
0
0,1 <
b
0
0.003
0,0025
0,002
0.0015
0,001
0.0005
-0.0005
G O E S 6,7 P6
I
5O
!
I |
I |
,f _ I 2P,
�9 ]PL
" " i
55 60 65
Time after 20:00 UT, rain
. . . . i . . . . . .
7O
l"igure 7. Ttle observed (points) and calculated (curves) counling rates of the GOES P6 chalmel during the time when the "precursor' ~.as observed. The intensit).- time profiles of neutron-decay protons have been calculated for tile cases lisled in Table 1[. The observed counting ntte is axeraged over the two GOES salellites wilh the background subtracted. The cm)r bars illustrate the standard deviation of Ihe counting rate as obserx, ed on board GOES 6 and 7 during 19:40 -20:40 t.T on May 24, 1990. The EXP case corresponds lo the exponenlial model by Kocharov et a/. (1994a). The BPI, case is discussed in Section 6. The dash-dotted line inarked with p shows the onset of the II|ajor pro ton e\;el3t.
during 2 0 : 4 8 - - 2 0 : 4 9 UT was caused by h igh-energy gamma- rays . For IMs reason,
we suppose the time profile o f g a m m a - r a y contamina t ion in the P7-channel to be c, _.. 0.47. This equal to that given by Equa t ion (1) at T, s = 260 s, T.f == 18 s, and ~,
time prol]le has been normal ized ta the observed P7-channel count ing rate during
2 0 : 4 8 - 2 0 : 4 9 UT and subtracted f lom file actual P7-channcl count ing rate. The
result ing i n t e n s i t y - t i m e proJile is shown in Figure 8 a long with calculated profiles
o f neut ron-decay protons. Different possible parameters o f neutron injection have been sludied. The cal-
culated shape o f the i n l e n s i t y - l i m e profile o f neut ron-decay protons is not very
sensitive to the choice o f the neutron injection scenario (speclrum). This is so because wc consider only scenarios which fit the neutron moni lor count ing rate

I.IJ(]H-ENERGY NEUTRONS AND NliL:TRON-I)ECAY PROTONS [ 95
A > |
o
o4 <
E o
0
mD 3,50E-04 -r- . . . . . . . . . . . . . . . . . . . . . . . . . . . . . . . . . . . . . . . . -F - i
/
, I i G O E S 6 , 7 P7 3.00E-04 ..... I i I
2.50E-04 ...... @ ~ i
2.00E-04 ! ~ ,
1 .50E-04
1 . 0 0 E - 0 4 -
5.00E-05
0 .00E+00
-5 .00E-05
-1 .00E-04 ] . . . . . . . . . . . . . . . . . . . ~ .... i . . . . . . . . . . . i . . . . . . . . . . . . . . . . . . ,
45 50 55 60 65 70
T ime a f t e r 20 :00 UT, m i n
EXP 2PL
-. BPL IPL
1:Tgure 8. Tim observed (points) and calculated (curves) counting rates of the GOES 1"7 channel dttring the time when the 'precursor" was observed during the 'precursor" observed in the P7-channel. The inlerlsi(y time proliles of neulron decay protons have been calculated for the cases lisled in lable I1. The observed counting rate is averaged over the two GOES satellites with Ihe bacl<ground ,:uld gamnl,:t-ray containinatiori stibtracted. The error bars illustrate the standard deviation of the counting rate as obserxed on board GOI-S 6 and 7 during 19:40---20:40 UT on May.' 24, 199(i). The BPL case is discussed in Section 6. The dash-dolled lirle marked with p shows the onset of the imuor plolon eX.elll.
actually observed. In contrast, the calculated ratio of the proton counting rates in different GOES channels depends mainly on the neutron injection spectrum. Note that the calculated maximum value of the proton intensity depends on the value of the anisotropy fact,or AA. However, we have no fitting paramelers for the shape of the proton in tens i ty- l ime prolile and fl.~r the rat.to of the intensities in different energy chaimels. The maximum value of the intensil,y may be obtained at AA " �9 1. In the case of hard neulron spectra, corresponding to ~ < 0.46, the calculated flux of neutron-decay protons is low. For this reason, the exl,rcme vahie of AA -- I is used to ,get the best possible agreement. For a comparison, Figure 9 shows the restllls of calculations for hard neutron spectra at A~x = 2, as well (see curves I PL and I PI.A). In the case o l a soft spectrum of s-component neutrons (~ > 0.46) we use AA '- 2 which corresponds to a moderate limb brightening of the neutron emission.

1.96 1.. G. KOCHAROV I:'1' AL.
2.00E-04 i !
1.80E-04 -- P7 exp (f+s) ,--- 1,60E-04
1.40E-04
o 1.20E-04
1.00E-04 <
E o 8,00E-05
6.00E-05 T
o : 1 o 4.00E-05
,t*. " " ' - - . . . . . L O,OOE+O0 . . . . . . . . . . . . . . . . . . . . . I.
45 50 55 60 65 70
Time after 20:00 UT, min
kTgure 9. The calculated inlensity- Lime protiles o[lleutroll decay prolons expected in the P7-chanlle[ For different cases lisied in "lhble II. The dashed curves ,/' and s illustrate partial cormibulions of the lhst and second components of netttrorls for the EXP case. The 3PI.A curve is discussed in Section 7.2.
The 'precursor' observed after 20:55 UT on board GOES can be explained nalurally as caused by neutron-decay protons because (i) neutrons from the 1990 May 24 flare were detected by neutron rnonitors, (ii) the prolon in lens i ty- t ime protile observed during the precursor is consislent with the neutron in tens i ty- t ime prolile observed by the neutron monilor. However, in the case of hard neutron spectra (e.g., case IPL), lhe expected maximum tlux of netltron-decay piotons is lower than the flux observed in the P6 channel (Figure 7). The reason is that all the calculated curves are based on the tilting of the Climax neutron monitor cotinting rale. This implies thai the number of ~o()0 MeV neutrons is aboul the same for each curve. The G()ES channels are available al lower energies. Hence, the GOES counting rates turn out to be sensitive to the slope of the neutron spectra at 100-300 MeV. As a result, none of the hard neuuon spectra can lit Ihe P6-channel counting rate. Note that an attempt to increase S s = ~j. up to Ihe maximum possible values, 3 .3-3 .4 , results in an excess of the counting rate in the P5-channel with only a slight increase in the P6 channel. In contrast, a soft speclrum of s<omponent neutrons, F ( S = 4.51), [its the precursor observcd in the P6 and P7 channels very wcll (see 2PL curves in Figures 7 and 8).
In addition, Figures 7 and 8 show the pioton fluxes cxpccled in the IYamc of the exponential model (Kovaltsov e t al . , 1994; Kocharov e t al . , 1994a), which also
, i n e u h ' o n �9 t . . t suggests a soft spectrum of s-component neutrons,-:~s ( l z ) .~ e x p ( - E / l ' s , ) ,

HIGII-I-NERGY Nlit;TRONS AND NEt:TRON-I)IiCAY PROTONS ] 97
where E.s. = 80 MeV (marked with EXP in Table II). It is seen that the prediction of the exponential model is in agreement with lhe GOES observations.
A comparison of the expected and observed l]uxes of neutron decay protons is sumrnarised in Figure l 0. One 5-rain bin in each channel is sampled for this figure. 11 is seen that the slope of the neutron speclrum between 100 and 500 MeV was close to that of !,he F ( S -: 4.5) specl,rum (2PL case). In the 1PL case (.l"(S = 3.0) spectrum), tlle expected P6-channel counling rate is essentially lower than the observed one (the discrepancy is 3.5o-). At, the same time, Ihe slope of the neumm spectrum bel,ween 50 and 100 MeV was delinitely less than that for the F(4.5)- spectrum. In ttfis energy band, Ihe slope was close l,o tim!, expected in the case of !,he exponential model. Thus, in Ihe entire 5 0 - 5 0 0 MeV band, the neutron spectrum may be litted with an exponent in energy. The calculated neutron spectra are shown in Figure 1 I. 11 is seen that, in the 100-500 MeV band, the exponential spectrum of .s--component, neutrons comes close l,o the specl,rum F ( S ..... 4.5). Of course, the difference between the spectra is large in the range above 500 MeM bul it does not, affecl the G()F:S and neutron monitor counting rates expected. In !,he tbllowing sections, we will discuss a possibility to Cxl)lain the Itattening of neul,ron spectrum below 150 MeV.
6. ln terac l ing Protons versus Interplanetary Protons
When analysing neutrons as detected by neutron monitors, one can extract son]e information on spectra of primary plTolons with energy >3(.)0 MeV which are responsible for Ihe production of > 150 MeV neutrons at the Sun. This is seen from tile observations of nm.ltron decay prolons in the inlerplanetary medium that the spectrum of s-component of interacting protons was close to s in this energy hand. It implies that an additional hard f-componenl of interacting protons (with a speclrum/3' ..3.2.1_o.3) is needed to [h the time profile of file neulron monitor counling rale (Figure 5; as an illustration, see also the third flame in Figure 4). Note that the J'-component almost, does not contribute l,o the production of those neutron decay protons which can be observed in the GOES P5 - P7 channels (Figure 9). It is seen l:rom Figure 5 Ihat Ihe value of the parameter ~, is close |o 0.5 in this case. This nleans that both components (./ and s) conl,ained about the sanle number of >600 MeV pml,ons.
The total number o[ >600 MeV protons inl,eracfing at the Sun is ahnost inde- pendent of the details of the scenario: NO(> 600 MeV) ...-: (4• 1) x 10 :m (Table I). It is noteworthy !.hal, about tl]e same immber of higt>encrgy pml,ons has been injected into the interplanetary medium soon after the flare, NIPM(> 600 MeV) - 5.5 • 103~ (for lhe l?rOml?l component of inlerplanetary protons by Torsi! el al., ] 996). The injection spectrum of interplanetary protons was approximated by the ftmclion
.-- -J + (r:/y2): ,: , . (4)
1.98 L. G. KO(I IAI~, ( )V E I AL.
0,01 i . . . . . . . . . . . . . . . . . . . . . . . . . . . . . . . . . . . . . . . . . . . . . . . . . . .
9 (9
0 @
0,001 O4 <
E O
O
0,0001
I
m . . . . . . . . . . . . . . . . . . . . . . . . ~ " . . . . . . 2 P L . . . . . . . . . . . . . . . . . . . . . . . . . . . . . . . . . . . . . I
. . . . . . . . . . . . . . . . . . . . . . . . . . . . . . . . . . . . . . . . . . . . . . . . . . . . . . . . . . . . . . . . . . . i
I . . . . . . . . . . . . . . . . . . . . . . . . . . . . . . . . . . . . . . . . . . . . . . i . . . . . . . . . . . . . . . . . . . . . . . . . . . . . . . . . . . . . . . . . . . . . . . . . I . . . . . . . . . . . . . . . . . . . . . . . . . . . P5 . . . . . . . . . . . . . . . . . . . . . . . . . . . . . . . . . .
! . . . . . . . . . . .......................................... I . . . . . . . ' " IPL
. . . . . . . . . . . . . . . . . . . . . . . . . . . . . . . . . . !B L . . . . . . . . . . . . . . . . . . . . . . . . . . . . . . . . . . . . . i
j ! P 6 i v.-- - 2> 2PL EXP
i 7 : : : 7 : " - 7 : i : i : : 2 :: eL :: .... ..... : ! . . . . . . . . . . . . . . . . . . . . . . . . . . . . . . . . . . . . . . . . . . . . . . . . . . . . . . I . . . . . . . . . . . . . . . . . . . . . . . . . . . . . . . . . . . . . . . . . . . . . . . . . . . . . . . . . . . ' . . . . . . . . : : i P L i
: ......... 2 .... : L 7 7: 7 7 L : 7 ::i i
I i
; P7 ] . . . . . . . . . . . . . . . . . . . . . . . . . . . . . . . . . . . . . . . . : : : } I . I : ~ tlIII:I': I - : I ` . . . . . . . . . . . . { : l l l ( : a l l I EX p ....... :
~ . , ' ~ ' : , " ~ ,-~' 2PL BPI_ ! 1PL.
i
. . . . . . . . . . . . . . . . . . . I . . . . . . . . . . . . . . . . . . . . . . . . . . . . . . i
10 1 O0 1000
E, M e V
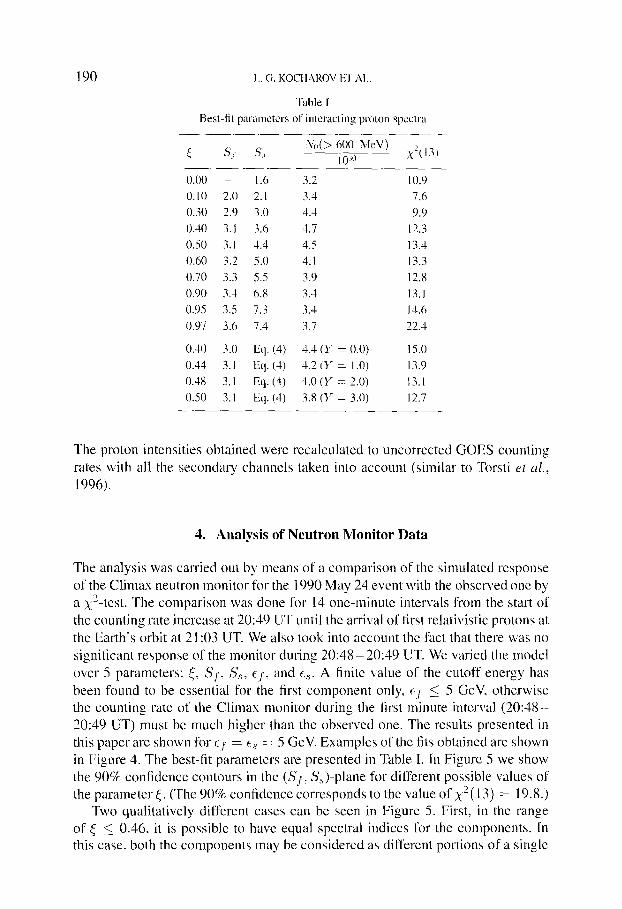
Figure I0. Composi te plot of the expected and observed fluxes of neulron-decay protons in three GOES chalme]s. Rholnbus-type [igures represent the uncorrecled averaged counting rates observed on board G()ES 6 and 7 during 21 :00 - 21:05 UT (P6 and P7) and 21:05 21:10 UT (PS) on May 24. 1990. Itorizontal bars illustrate the expected counting rales for the cases listed in Table II.
where N 1 - 1.4 x 1030 proton MeV .-1, ~;,l = 1.6. ?2 = 3.0, s =- 160 MeV. and /'22 = 360 MeV. At high energies (~. 1 GeV), this spectrum is close to Ihe spectrum of the s-component of interacting protons, E -45 (the 2PL-case in Table I I). Fur- thernx)re, it is seen from Figure l0 that the P5-channel counting rate as expected in the 2PL-case exceeds significantly the observed ()tie. This implies a flaucning of the interacting l)rolon speclrum below ~250 MeV. T.hus, the ,s-component spectrum is qualitatively similar to the spectrum of interph.metary protons (4).
As the next slep, we adopt spectrum (4) as a possible spectrum of the s- component ot interacting prolons. The calculaled spectrum of solar neutrons pro- duced by protons with spectrum (4) is shown in Figure 11 (marked with BPL). Then we use the BPL neutron spectrum ['or a fitting of the neutron monitor count- ing rate. The 90% confidence contour obtained is shown in Figure 12. Marked with BPI. is the point sampled I\)r calculations of neutron-decay protons. The corres- ponding normalisation and other parameters of interacting proton spectra are listed

I I1GH-ENIs GY NEUTRONS AN.I) NISLrfI~,ON-I)EC..VF PROTONS 199
1 , 0 0 E + 3 0 -F:.. !.: . - : . ~7 - : : . :7 ! . " : : !~ '. " : . - i 7 : r "~!:":-!!:;!:..:........i. ' - : : . . " : :7! . ::1!-. :-:=7.-~:~; : ... ' . . . . . . '.:.......!. ' :...........2P.L. '... ~:...! .. i i ' i . / . . .v ... .:.: " . . . . . . i . . '.: .....i:.v.....:. . . i .-..!....7 i . .i ... i , .:::.:. .......: ;. :.:::::::.: :...:.:: .......:i..::t.~. : . ! 7 . . . : : . . j : . . . : . : . : : . s - c : o m i ~ o n ~ n t : : : i
. . . . . . . . . . . . . . . E x P ~ , ' , ~ . . . . . . . . . . , . . . . . . . . . . . . . . . . { ? ! ~ ! 1,OOE+29 .:... :.:.::::...........=.:: ..:..:::.::~ ...................... .... !!-...~:.::.: ........ ::..:., ....... :.:....~:..::+:..:..:..i..-~:
.... :!:: :!: :::::~i;~::: !' : ~ : ~ ~ ! : ~ i : i :::: ::::, :::!: ~::::::i ?::!, > . . . . . . . . . . . . ! . . . . . . . . . . . . . . . i ! > . . . . . . . . . . . . . . . . . . . . . . . . . i : ! :~ ~ : .................. ~ ~ ' Z ~ \ \ ' ..... i ~ ::-' o , ::.:_ :: =.i..:!:_=:_::.:. ~ ~ \ ~ \ . :::::::: :+:~ ::::i: ~
' i - ~ ~ = ~ o ~ v ~ \ , x : X ! ........... ~ i ! . . . . . E2=310 MeV ! . . . . . . . . . . :~ ..... ~ I I I ~ III:II ~ ...... = I I
i.. . . -~ : : .::-. - '::-~r::: ~ . = - ~ " - ~ - : .
i .... - - - S s = 4 5 ... . . . . . . . . . . . . . . . . . . . . . . . . . . . . i V ~ ' \ : ! J
, . . . . . . . . . . . . . . . . . . . . . . i . . . . . . . . ] . 0 0 E + 2 6 . . . . . . . . . . . . . . . . . . . . "
1 , 0 0 E + 0 1 1 . 0 0 E + 0 2 1 . 0 0 E + 0 3
E, M e V
I.Tg/tre ] 1. Calculated spectra of the second cotnpcmcllt oflleutrons. Speclra BPL +: and I']XI > lil the dala at isotropic (_l...x = 1) and anisotropic (-4A ~ 21)neutron production, respectively. The parameters of the 2PL, F.XP and BPI. cases arc listed in Table II. In cases BPL and BPI.", the spectrum of interacting protons was taken according to E t l t l a l i o n (4 ) t:ll J-),,_, - 360 Me\,' and F2 - 310 Me\;, respectively.
in Table II. Thc resulls of calculations of neutron-decay prolons arc presented in Figures 7, 8, and 10. li is seen from Figure l0 thai, in a comparison with F(S)- type neutron spectra. Ihe BPL spectrum fits the P 6 - P 7 channels counting rates betier. Howevcr, the BPL neun-on speclrum still underestimates the P6 charmel counting rate (Figure 10).
7. Discussion
7. ]. SPECTR[JM OF HIGII-ENERGY N E [ T R O N S ANI) INTERACTING PR()TONS
Two components of neutron injection as well as exponemial ncutroll spectra haxe been employed by Kovaltsov et al. (1994) and Kocharov et al. (I 994a) for the fitting of the neutron increase observed by neutron monitors on 1990 May 24. In ilae case

200
3.4
L. G. K()CHAROV ET AI ..
3.3
3.2
3.1
Sf 3
2.9
2.8
2.7
2.6
0.25
. ".... ...... " .. ...
0.35 0.45 0.5
Figure 12. ]"he results of the parameter titling of the Climax neutron motlilor cot,lltiilg rate. The contour represents Ihc 9{}~.}. conlidence level in the (.5"j, {) plane. The spectrum of the .s-component of protons was taken according to Equation (4) al/7..: = 360 MeV. The black triangle (BPL) slmws the values of parameters sampled for calculations of neutron-decay protons.
of this exponential model, the predicted intensity-time proiiles of neutron-decay protons coincide with the GOlq, S observations in the high-energy proton channels. As is the case in physics research, such a coincidence supporls the model proposed earlier.
The new analysis of neutron monitor data has been performed with the employ- mcnt of neutron spectra which are produced by protons with a power-law speclrum in energy. After that, expected fluxes olneulron-decay protons have been compared with the observations. It is seen l.rom the observations in the P6 and P7 channels that, between 150 and 500 MeV, the neulron spectrum is as steep as the spectrum F(~5' ~ 4.5) (Figure 10). Hence, based on Ihe analysis of neulron monitor data, wc conclude that an additional hard component of neutrons was produced in the flare (Figure 5). This component was responsible for the [as[ increase o[neutron monitor counting rate in the beginning of the event (Figure 4). Thus, two populations of neutrons are necessary to explain both neutron monitor and GOES observations.
II is seen flom Figure I 0 Ihat the intensity of neutron-decay protons as expected in the frame of the two-component model with a soft power-law spectrum of the second component of interacting protons (21)I.) exceeds the counting rate observed in the GOES P5 channel which implies a. flattening of the s-component

I IIGI I-I!NI-.;RGY NIs ANI)Nlit.WRON-DIiCAY PROTONS 201
neutron spectrum in the energy band below 100- 150 MeV. On the other hand, the intensity-time profile of neutron-decay protons as predicted in the flame of Ihe two-component exponential (EXP) rnodcl of neutron injcction (Kovaltsov et al., 1994; Kocharov et al., 1994a) is in agreement with the proton profiles observed on board GOVS. This implies thai, in the 50-5()0 MeV range, the speclrum of solar neutrons was close Io an exponent in energy. This neutron spectrum may bc prolonged to a band of higher energies either as a power-law proton originated, I~'(S), or as an expollent in energy, exp(- E/H0) . There is no experimental device to distinguish these Iwo possibilities. However, a power-law proton originated spectrum of the ./'-component can not be extended to a band above 2 GeV. The speclrum of neutrons of low enmgies, <50 MeV; is beyond the scope of the present study.
In an attempt to obtain flattening of the neutron spectrum at h)w energies, the spectrunl oJ' .s-coinponent intelacling protons has beer1 proposed to be equal to the spectrunl of the prompt component of interplanetary protons. In this case Ihe number of neutrons with energy 100- 200 MeV appeared to be not enough, yel, to obtain good agreement with the intensity of the precursor observed in the GOES P6 channel (see BPI, point in Figure 10). Thus, better agreement can be obtained when, in the energy band 200--400 MeV, thc spcctrum of .s-component protons is slightly sleeper than the spectrum of interplanetary protons. For this reason, we adopt the spectrtun (4) at 1"2 ::- 310 McV to calculate neutron production for the s-component (see Figure 13). It is seen fiom Figure 11 that, in /lie case of Ih.is spectrum (mal:kcd with BPI++), the nunlber of --~ 1()0 MeV neumms is sufficient to fit well the GOES P6 channel counting rate. Thus, it is most likely that lhe spectrum of ,s-colnpollent protons at --300 MeV was slightly steeper that the spectrum ofl~rompt protons in the interplanetary medium. It is less likely, but still can nol be ruled out Ihal both the spectra simply coincided. It is possible that the second component of interacting protons and the prompt component of protons in the interplanetary medium were two portions of a unitary: plotoil population accelerated during I - 2 rain in Ihe impulsive phase of the flare and then trapped for 4 - 4 0 rnin in high magiletic loops in the solar corona. Sonie re-acceleration during the trapping might produce a hardeniilg of the i)rompt component spectrum before the injection into the interplanetary mediuln.
It is interesting to compare the results obtained with the observations of neutrons and neutron-decay protons from the famous 1982 .lune 3 Ilare (Chupp e* a/., 1987: Evenson, Kroeger, and Meyer, 1985). It is seen from the composite plot in Figure 8 of Chupp el al. (1987) lhaI, in the case of the 1982 June 3 flare, sorne llatlening of the neutron spectrum below 15(.) MeV may be seen. llowever the accuracy of reconstruction of the neutron spectrum in the entire 50--500 MeV energy range is not better than 30%. Recent calculations by Ruffolo (1991 ) supporl these conclusions. It is hnporlant thai Ruffolo (1991) made use of better proton data and an updated interplanetary transport model. In the 2 6 - 147 MeV range, he approximatcd t h e neutron spectrum to be a power law in energy with the neutron

202 I,. (.;. KOCIIAROV 1,71 ;\1 ..
> (1)
r < tJ._l -g
r--
D 03 d)
...c
. +~
4- - .
0
E P
.-I---
0 d)
c- O
9
1.00E+35
1,00E+34
1.00E+33
1.00E+32
! Is-component
E2=310 ~,W,v,ev ... L.. - - ,.
E2=360 MeV
10 1 O0 10000
E, M e V
!
~ . m .
1000
I~gure 13. Spectra of interacting protons, mult ipl ied b,v s used for the calculal ions of BPE and BPI," neutron Sl)ectra shown in Figure I I.
specn'um index S,,. - 1..7.-1.9, while Chupp et al. (1987) deduced the value of ~g.r~ = 2.4 in tile energy band 100-2000 MeV. In the case of the 1990 May 24 flare, we make use of an updated transport code. However, only two GOES energy, channels in the range of lower energies can be analysed. For this reason, we cannot exclude lhe possibility that a power-law approximation of the neutron spectrum in the 5 0 - 1 5 0 MeV range may be belter then the exponential one, but such a spectrum delinilel.y cannot be extended to higher energies. Probably, an exponent is not the best approximation of the actual neutron spectrum, but wha! we conclude is that, in the case of the ,.,.'-component of neutron emission, the average behaviour of the neutron spectrum can be adequately described with an exponential law in the entire 50-.. 500 MeV energy range. Another possible approximation is the spectrum of neutrons originating from prolons with the spectrum (4) al ./:~72 = 310 MeV. One can see from Figure 1 I that the accuracy of the exponential approximation is aboul 30% in the entire 50- 400 MeV range, in any case. However, the aclual neutron spectrum may be esscntially harder than the exponential one at higher energies.
As an alternative to the two-component model with a soft spectrum of Ihe s- component, a nlodel with spcct.r~.l of both the components being equal to each other has been considered, S!. = E~ '- S. Such a single population model requires hard

FIIGII-ENt;I~,GY NEUTRONS ANI)NI-UIR()N-.DI!CAY PROTONS 203
neutron spectra, /7'(S < .~.4). However, in Ihi.s case, the maximum possible llux of neutron-decay protons is not suflicient to explain the GOES observations in the P6-channel. Moreover. if ,..5' < 2.5 it is also impossible to lit the observed P7 channel, counting rate. Note that, for ,g < 2, the expected flux of neutron-capture 2.2 MeV gamma-ray line emission, as estimated according Io calculations of Hua and Lingenfelter (1987) and Ramaty el al. (I 993), is about an order of magnitude less than the one reported by Terekhov el al. (1993) for the PHEBUS/GRANAT observations. The boundary case of the only .~-component existing (,{ -~ 0) requires as hard a spectrum as F ( S = 1.6), which implies all the above-mentioned diffi- culties. Thus, we conclude that the probability of the single population scenario is small.
Let us consider additionally another boundary case of ~ = 1, when only the f-component exists (an impulsive neutron production). In this case, none of the F ( S ) spectra can fit the neutron monitor data. However, in the case of an impulsive neutron production, a timc-of-tlight approach is possible to deduce the neutron injection spectrum. The neutron spectrum deduced by such a mcans is close to F ( S -- 3.5) in the band of 3 0 0 - 150() McV. while it: turns ottl to be much softer at lower energies. This iilct may be considered again as a signature of two interacting proton components. However, Ihe spectral index of the soft component protons becomes extremely high when ,{ approaches I (see, e.g., Table I). Note thai the casc of ~ ~ I has no supporl in observations of electromagnetic emissions of the flare.
7.2. POSSIBI.HTY OF THE THIRD NEU'ERON IN,II,~CTION
We studied a possible impact of a hypothetically extremely prolonged third com- poncnt of ncumm production, which may have no clearly signature in gamma-ray emissions due to a low intensity. Such a component may exist because the injec- tion of the proml)t component of protons into the interplanetary medium had the r time of 40 rain (rorsti et aL, 1996). No one can exclude the possibility that somc portion of the prolons sirnultaneously precipitated into the chromospherc to produce thc third component of high-energy neulrons with the e-folding time 2400 s, as well. Dcbmnner, lx)ckwood, and Ryan (1.993) proposed to use Mexico City neutron monitor data for extrapolation of the Climax neutron monitor counlir~g rate after 21:03 LIT on May., 24, 1990. This approact~ showed (Debrunner, Lock- wood, and Ryan. 1993; Kovaltsov et al.. 1995) that some very., prolongcd neutron emission fiom the Sun might exist for the event, llowever, this interpretation of the Mexico Cily monitor counting rate recorded after 2.1:05 UT cannot be proved for sure because of the possible ilnpact of solar prt)tons. For this reason, we can use the counting rate observed after 21:(.)5 UT to put an tipper limit lor the third com- ponent of high-energy neutron production, only. By means of fitting of the Mexico City counting rate, the upper limit i'or the total number of the third component of
. \~(Y~ (> 600 McV) 3 x 10³o (the BPL interacting protons may be obtained as .-'.n~ix . =
204 I,. G. KOCI IAI,tO\,' lET ,,kl,.
.5 -
Sf
3 / I . . - Y = I i
Y=2
Y=3 I . . . . . . . .
2 . 5 i - - ~ . . . . . . . . . . i I-
0 . 2 0 . 3 0 . 4 0 . 5 0 . 6 0 . 7 0 . 8
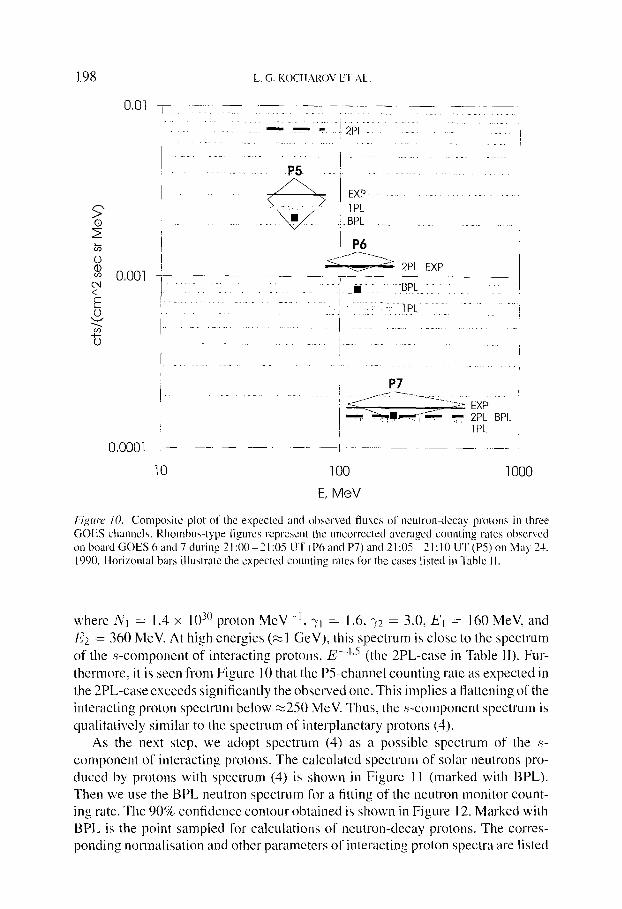
I"igtue 14. The lcsuli.s o[ the parameter Iitting o[" the Climax neutron monitor counlJng rate in the case o1 the third component introduced, lk)r dilfcrent values of die parameter "}" (see text). 1"lie contours represents the 90% confidence levels in the (S~": ~) plane. For both the sec()lld and Ihird COlTlponclllS of iicutmns, the BP[. spectrum was used.
neutron spectrum is used fl>r the third neutron component). In order to calculate the contribution o1: the third component into the neutron monitor counting rate, we introduced the parameter Y - N ~3) (> 600 MeV)/10 "3~ The Climax neum.)n monitor counting rate has been fitted al different values of the parameter Y c- [0, 3 ]. In .Figure 14 we show the 90c3:. �9 conlidence contours obtained. Some best-lit para- meters are presented in Table I. It is seen from Figure 14 that the introduction of the third component of high-energy neutrons results ntainly in a shift of the values of the parameter {. Thus, a possible contribution of lhe l h i r d component rieutron is not very essential for the analysis.
The t h i r d component being introduced does not change essentially the flux of neutron-decay protons during the time when the 'precursor' can be observed. As an example, Figure 9 shows the in tens i ty- t ime proIile of neutron-decay protons for the case ( f l y = 1.0, ~ = 0.4, S j, = S.~ : - 3.0, and the spectrum of third-component neutrons laken as F ( S ~-= 4.5) (this case is marked with 3PLA in the figure arid in Table I1). For a comparison, the 1PI ,A case (Y =- 0) is shown as well.

HIGII liNERGY NEUTRONS AND NEUTRON-I)EC.'\'f PROTONS 205
7.3. ]]N'FERPI.ANEFAI~,Y-TO-INTERACI'ING I:~ARTICI.E R,,YI.I()
In a high-energy band, the ratio of inlerph:metary to interacting particles is a sub- .ject of large uncertainties, because every high-energy secoudau emission may be anisotropic. Nevertheless, we are interested in this ratio because, being calculated under the certain 'standard" tin, positions for different �9 it may reveal tile dependence on a llare type, position on the solar disc, etc. We calculated this ratio under the proposition of isotrol:~ic production of neutrons, which may be the case if the llare is situated near the solar limb and/or the magnetic field at the flare site is tilled and sufficienlly complicated. Being calculated under this proposition, the interphmctary-to-intcracting proton ratio iX"Ir'M (> 600 MeV)/N0(> 600 MeV) = 1 -2 (Table I and Torsti eT al.. 1996). In. the case of anisotropic neutron i~roduc- tion, Ihe tolal number of >600 MeV interacling protons should be renonnalised as Nil(> 60(1 MeV) --~ No(> 600 MeV)A, where A is the anisotropy factor defined as the ratio of the angle averaged number (.rl' high-energy neutrons tit the Sun to lhe number of neutrons emitted towards the Earth. One can expect the anisotropy l~ctor 0.5 < A < 3 for a near-limb flare (.e.g., Kocharov et al., 1995). Note that the expec- ted number of secondary neutrons depends also on the composition of accelerated particles and that of ambient plasma (Ramaty et a[., 1993). This implies thai, in tile case of a composition cnriched wilh He, the total number of interacting protons may be 2---3 times less than the number deduced under the standard composition by l:lua and Lingenfeher (1987). which was actually used in the present paper. Anyway, the total number of i.nterplanetary protons is not less than 30% of lhe total lmlnber of protons inleracting at lhe Sun (cf., Debmnner, I,ockwood. and Ryan.
-, c9, ~, 19931. Note that, for tile flare of 1982 .hme .~, Ramaty {el a[. (I :) ..... .) obtained the ratio of intm]>lanetary Io interacting >30 MeV protons to be 0.26--1.3, depending on the composition of the particles.
8. Conclusions
The nmin results of this study arc the ff~llowing: (I) The high m.agnimde of the 1990 May 24 neutron event provided an oppor-
tunity to study the flux o[ neumm-decay protons of higher cnmgics than ever before. A 'precursor' was clearly seen in the high-energy proton channels of the GOES detectors beR)re the onset of the major proton event. This 'precursor' can be explained naturally as originating from decay of solar neutrons in the interphu~etary meditlm.
(2) The observed counting rate of the Climax neutron monitor fnay be lit- ted under two assulnptions: (i) a single population of interacting prou:ms with a hard power-law spectrum (@ - S~ _< 3.4); (ii) two proton components with a hard spectrum component gcneraiine neutrons during a shorl time and a lonoer intcracling soft component.

206 [,. (;. KOCI.IARO\: ET AI_.
(3) Single population models with hard power-law proton spectra imply a flux of neutron-decay protons which is essentially less than the intensity of the precursor observed in the GOES .P6 channel.
(4) The intensity--time prolile of neutron-decay protons expected in the frame of the two-component model with a soft power-law spectrum of the second component (Ss = 4.5) coincides with the GOES observations in the P6 and P7 channels. This supports the idea of a sol.t spectrum of s-component protons. Such a soft spectrum of the ,s-component implies a hard spectrum of the first component, since this is necessary for Ihe titting of the observed neutron l'nonilor countirlg rate.
(5) The likelihood of the two-component model is found to be significantly higher than that of the single population model.
(6) The intensity of neutron-decay protons as expected in the frame of the two-componem model with a soft power-law spectrum of the second component of inleracting protons (Ss = 4.5) exceeds significantly the counting tale observed in the GOES P5 channel, which implies a flattening of the neutron spectrum in the energy band below 1()0-150 MeV. The intensity-time prolilc of neutron decay protons expected in the frame of the two-component exponential model of neutron injection (Kocharov et al., 1994a) is in agreement with the proton profiles observed in all GOES channels. Hence, in the enlire 50-5()0 McV range, the average behaviour of the second c o m p o n e n t neulron spectrum followed the exponential l aw ill eller~rv
(7) The spectrum of the second component of interacting protons was quali- tatively similar and close to the injection spectrum of ttae pmmpl component of interplanelary protons at high energies, J=: =- 100- 1000 MeV. It is most likely that the spectrum of interacting protons was slightly steeper at ~300 MeV than the spectrum of interplanetary pinions. However, we cannol rule out Ihat bolh spectra did just coincide.
(81) The tolal number of interacting >600 MeV protons is found to be of the order of magnitude of the total number of the im)ml)l cornporlent protons injected into the interplanetary medium.
Acknowledgements
We thank the Academy of Finland fl)r linancial support. ()ne of us (GAK) was supported at A. F. Ioffe Physical-Technical Institute by the International Science Foundation and the Russian Government (grant J56100).
Rel'erences
CI) G()ES: 1992, Spac'e Erwironmem Monilor I-Minule and 5-Minute Averages, ,/nnua W 1986 .-.hme 1992, Version 1, National Geophys. Data Center, 325 Broadway, Boulder, C(). U.S.A.
Chupp, 1!. L., Debrunner, H., Fli, ickiger, E , t:orrest~ D..1., Golliez, F., Kanbad~, G.. \:eslrand, W. T., Cooper, J., and Share, G.: 1987. Asm:pkys. ,I. 31.8, 913.

HIGH-ENIiRGY NEUII~,ONS AND Nf.lt;TRON-DIC;AY I'ROTONS 207
Chupp, E. I..: 1990. A.vrrol~hy.~. J. Sw~pl. Se~: 73, 213. Debrunner. I l., I,ockwood, J. A., and Ryan, J. M.: 1!)93, AslroldO.'s. J. 409, 822. Evenson, P., Meyer, P.. and Pyle, K. R.: 1983, A.r/r(q~hys. J. 274, 875. Evenson, P.. Kroeger, R., and Meyer, P.: 1985, Proc. 19lh lnl. Co.smic Ray Co/!fi, l,a ,lolk~ 4, 130. Evenson, P., Kmeger, R., Meyer, R, arid M/Jller, D.: 1983, Proc. 18111 hzl. Co.w~fic Ray Co/{fl 4, 97. livens(m, P., Krocger R., Mey, er, R. and Reames, D.: 1990, Astrol)hYS. J. Szqq)l. 73, 273. Gueglenko, \:. (7.;., Kocharov. G. E., Kovahsov, G. A., Kocharov, 1.. G., and Mandzhavidze, N. Z.:
1990. Solar Phys. 125, 9 I. Guglenko, V. G., L:iimov, Yu. E., Kocharov. G. E., Kovaltsov, (]. ,\., Mandzhavidze, N. Z., Terekhov,
M. M., and Kocharov, I,. G.: 199(.), A sHw:h3'.s..I. Sul:l~l. 73, 209. l lua, X.-M. and I.ingenfeher, R. 1;.: 1987, Solar Phys. 1.07, 351. Kocharov, G. E., Kocharov, I.. G.. Kovaltsov, G. A.. Shea, M. A., Smart, D. F., :\FIIIStl'OIlg, T. P., Pyle,
K. R., and Chuikin. l-. 1.: 1993, Proc. 23rd Int. (2zsmic Ra.y C'o1{12 3. 107. Kocharov, l.. G., I.ee, J. Wl, Zilin, H.. Kovallsov, G. A, Usoskin, I. G., Pyle, K. R.., Shea, M. A.~ ancl
Smarl, D. F.: 1994a, Solar Phys. IS5, 149. Kocharov, L. G.. Kovaltsov, G. A, Kocharov, G. F., Chuikin, E. I.. Usoskin, I. G., Shea, M. A., Smart,
D. 1-'., Mehfikov. V. F., Podstrigach. T. S., Armslrong, T. R. and Zirin. H.: 1994b. Solar Phv.s. 150, 267.
I(,ocharox., L. G., Lee, .I.W.. Wang. H., Zirin, It., Kovallsov. G. A, and Usoskin, 1. G.: IC)95, Solar Phr,s. 158, 95.
Kocharov, L., Kovah.sov, G., "lorsti. J., Usoskin, l., Zirin. H., Anllila. :\., and Vainio, R.: 1996, in R. Ramaly, N. Mandzhavidze. and X. M. lhJa (eds.), P*z:w. Iligh Lkzel;g 3 Solar I'hrsic.~ Worl,.rhop, American lllslimle of Physics. Vol. 374. p. 246.
Kovaltsov, G. A., Efimov, Yu. E., and Kocharov, L. G.: 1993, Solar Phys. 144, 195. Kovallsov, G. A.. Kocharov. G. E., Kochamv, I-. (.].. and Usoskin, I. G.: 1994, Astron. Lellers 211.
No. 5,658. Kovaltsov. G. A., Kocharo\. I,. G., l..!so.,,ldll, 1. G., Kananen, ll., and Tanskanen, R: 1995, Proc. 24lh
In/. C'osmic Ray f.7o/7/i 4. 155. Kurganov, l. O. and Osnyakov. \:. M.: 1989, Izt,e.~tia Acad. A;auk ,SS.SR, Se~: I)'z. 52, 381.
. . . . . ] .... (J(:OIHglglL i Aeron. 32, 149. Kurganov. I. G. and (.)st.rvakov. \( M.: 99'~ Lee. J. W., Gary, D. E.. and Zirin, H.: 1994, Solar l-'hys. 152, 409. Pelaez, E, Mandnm, R, Nicl, M., Mmm, B., Vihncr, N.. lroltel, G., Lebrun. IE, Paul, .I., lerek-
hov, O., Sunyaev, R., (?llttl-aZoY. E., Gillimov, M., l)cnisov, D.. Kuznelsm.. A., l)yachl<ov, A., and Khavenson, N.: 19!)2, Solar I-'hys. 140, 121.
P vle, K. R., Shea, M. A., and Smart, D. F.: 1991, P~oc. 22rid hu. ()).~mic Rat Ctn!/:2 3, 57. Ramaty, R.. Mandzhax idze, N., Ko/Iovsky, B., and Skibo, .I.G.: 1993. A:h ,S))ace. Res. 13(9), 275. Ru[tbIo, D.: 1991, .4.slrol)/O.~. J. 382, 688. Shea, M. ,.\., Smart, D. 1-., and Pylc, K. R.: 1991, Geol)hy.~. Res. L.e:ters' 18, 1655. Talon, R.. Trotter, G., Vihner. N.. Barat, C., l)ezalay;, .I.-P., Stmyacv, R., Terekhov, ()., and Kuznet-
soy, A.: 1993, SolarPhy,s. 147, 137. "l;erekhov, O.. Sunyaev, R., Kuznetsov, A., Barat, C.. Talon, l.I., Trollel, G., alid Vihner, N.: 1993,
Pis 'ma ~, As/to/,. Zh. (Aslron. Le//elw) 19, No. 3. 163. l ronel . G.: 19!)4, in .l.M. Ryau and W. T. Vcstrand (eds.), American Inslilute qfPhysic.~' ('oq/2 Pro<
294, 3. li~rsfi, J., Kocharov, I,. G., Vainio, R., Anltila, ,'\., and Kovahsov, (3. A.: 1996, Solar Ph.).~. 1.66, 135. Vihner, N.: 1994, A.~riw)hy's. J. Suppl. 90, 611. Zh'mg, I , D.: 1995. As/iW~hys. ,L 449, 386.