Embed Size (px)
Citation preview

54
Journal of Management and Accounting studies
www.researchub.org
Journal of Management and accounting studies
Volume 9, Issue 1, February 2021, pp. 45-64
A Hybrid SWARA and MABAK Methods: To Identify Credit Risk
of Bank Branches
Seyad Said ShamsiNejhad 1*, Maedeh Dehnamaki 2 , Amir Mehdiabadi 3, Vahid Shahabi 4
1 Ph.D. in financial Management, Imam Sadiq University, Tehran, Iran [email protected] 2 Semnan University, semnan, Iran 3 Ph.D. in Industrial Management, Islamic Azad University, Head of Foreign Trade Holding Persiiran Gas Co, 4 Branch of Science and Research, Islamic Azad University, Tehran, Iran
Abstract Banking plays an important role in the economy of any country. The success of a healthy economy depends on a robust
and healthy banking system. Savings, investments, production, employment and growth in the national economy are
affected by the operations and decisions of the banking system. Lending is one of the main activities of most banks and this
is affected by risk. Changes in economic conditions affect bank risk. The borrower's credit status may deteriorate over time
due to various factors. Credit risk and its management at the branch level can greatly assist banks' performance. Paying
attention to credit risk indices at bank branch level is an issue that has been less addressed. In this study, the researchers
have prioritized the evaluation of branch-level indicators using new decision-making techniques, such as SWARA and
MABAK, by presenting a general model of the factors influencing credit risk at banks level. We first obtained the weight
of the indices using the SWARA technique and using the opinions of ten banking experts and then we are ready to enter
the MABAK model. The analysis was carried out in qard al-hasan RESALAT Bank, and in 30 selected branches of the bank.
Keywords Credit Risk, Bank, Prioritize, SWARA and MABAK Technique
* Corresponding Author: Ph.D. in financial Management, Imam Sadiq University, Tehran, Iran
Email Address: [email protected]
Received 21 December 2020 / Accepted 01 February 2021
DOI: https://doi.org/10.24200/jmas.vol9iss01pp45-64
2693-8464© Research Hub LLC. All rights reserved

)(2021 Journal of Management and accounting studies and et al Nejhad Shamsi .S S
54
1. Introduction
Financial services provided by banks are a prerequisite for the economic growth of countries (Ojima
& Ojima. 2019). In fact, banks are the most important institutions for allocating funds and savings (Foos
et al., 2010). As the main supplier of financing for economic and investment activities in countries, this
system plays a key role in transferring resources from savers to investor groups (Balzer, et al., 1994).
Huffman (2011) states that a healthy and profitable banking system can better resist economic shocks
and play a stronger role in the stability and stability of the financial system.Banking risks include banks'
risks. In fact, risk is an inherent component of banking and financial institutions.
The history of risk in banking is as old as banking, and despite the diversification of banking services,
the risks have increased. Because of the expansion of banking activities, borrowers' inability to repay
debts, entry into international banking and financial crises have been on the rise. Bagchi (2004, p. 123)
argues that the four-letter RISK is divided into R rarely (unexpected), I event (consequence), S selection
(identification), and K, Knocking (measurement, monitoring and control). Figure (1) presents a
classification of the types of financial risks. Among the types of risk, credit risk is the most important
and the oldest risk. So that in the banking risk management, credit risk has the most affect (Arunkumar
& Kotreshwar. 2006). The evolution and growth of the Basel Committee has been focused on credit risk
(Meulbroek. 2002). According to Mullings (2003), lack of credit risk management can jeopardize the
success of banks and thus destabilize the financial system. Therefore, understanding credit risk and its
relation to other risks is very important (Reimer, 2018).This risk arises from the fact that the recipients
of the facility are not able to repay their debt to banks. Hence, banks want to provide low risk applicants
with facilities. Credit risk in banks and financial institutions and its management has therefore become
a major concern (Caouette et al., 1998; Broll et al., 2004; Servigny& Renault. 2004). Neural Network
(Atiya, 2001), Genetic Algorithm (Chen and Huang, 2003), Combining audit analysis and Neural
Network (Yu et a.,, 2008), Data Envelopment Analysis (Emel et al., 2003; Min et al, 2008), Combined
methods of Backup Vector Machine (Yu et al., 2010), Decision Tree (Yanping et al., 2012), Combining
Decision Tree and Neural Network (Kabari & Nwachukwu. 2013), Logistic Regression (Mileris, 2011;
Lin, 2009), have been used by researchers to assess credit risk over the past years. In this article, after
reviewing the credit risk of different countries, we will look at past research and finally select banks'
credit risk indices. Next, we prioritize the selected indices and branches in the country with the help
of new multi-criteria decision-making methods (combining SWARA and MABAK).
2. Credit Risk Credit risk is one of the most important factors affecting the health of the banking system. The level
of credit risk depends on the quality of the bank's assets; the quality of a bank's assets also depends on the process of non-current claims and the health and profitability of the bank's facilities (Baral. 2005).Credit risk stems from the fact that the contractor cannot or will not fulfill its obligations. Traditionally, the impact of this risk is measured at the cost of the RIAL due to default. Credit risk arises from the division of non-current facilities over total facilities. Non-current amenities include past due, deferred and dubious loans (Tan. 2015). Chen & Pan (2012) define credit risk as fluctuations in the value of derivatives and securities due to changes in the quality of the recipient's or the transaction side of the bank. The most important reason for bank failure is credit risk (Zribi & Boujelbène, 2011, Alessandri & Drehmann. 2010, Altman & Saunders. 1998). Credit risk is the consequence of inadequate interaction with financial system actors. According to research Stiglitz & weiss (1981); Estrella & Mishkin (1996), the borrower has more information about the status of the

)(2021 Journal of Management and accounting studies and et al Nejhad Shamsi .S S
54
project than the bank. This subject, increases information asymmetry, reverses selection and moral hazard in the credit market. Serious market competition can also lead to credit risk for commercial banks (Wang et al., 2013).From a macro perspective, credit risk is the consequence of systemic risk. Systemic risk represents a major financial challenge resulting from the inability of financial market participants to perform credit obligations (Fukuda. 2012, Giesecke & Kim. 2011, Nijskens & Wagner. 2011).
Fig.1. Own design based on the book Reimer (2018)
3. Credit Risk Indicators in Studies
Studies by Stulz. (1984); Smith et al, (1990); Froot et al., (1993); emphasize the need for active credit risk management for a number of reasons. Anbar (2006) deals with different credit risk management practices in Turkish banks. Van Greuning et al., (2009) in their study outlined different types of bank risk strategies. These strategies include managing and monitoring information systems risk, establishing appropriate internal controls, assessing and analyzing risks, identifying and measuring specific risks, and developing risk mitigation policies. Horstedt & linjamaa (2015) in their research looked at the criteria banks have in assessing the credit risk of small and medium-sized enterprises as their customers. People such as Nijskens and Wagner (2011); Breuer et al., (2010); Qian & Strahan (2007); Saunders & Allen. (2002) are examples of corporate governance and poor management control. Inadequate rules and regulations, limited institutional capacity, policies inadequate credit, high interest rate fluctuations, low capital and liquidity levels, gross lending, have been the subject of many banks' licensing. Aburime (2008) states that banks' profitability depends on its ability to anticipate, avoid and control the risks involved, low asset quality and low level of liquidity are two major factors in bankruptcy. Kosmidou (2008) for measuring credit risk respectively: selected indicators of asset return ratio and reserve ratio of suspicious claims. Fixed impact assessment results on branch-level month-to-month board information uncover that branch size, store and settlements emphatically and fundamentally influences productivity, though cost the executives influences adversely (Quader et al., 2020). Cooper et al., (2003) believe that increasing credit risk of banks will have a direct impact on the

)(2021 Journal of Management and accounting studies and et al Nejhad Shamsi .S S
54
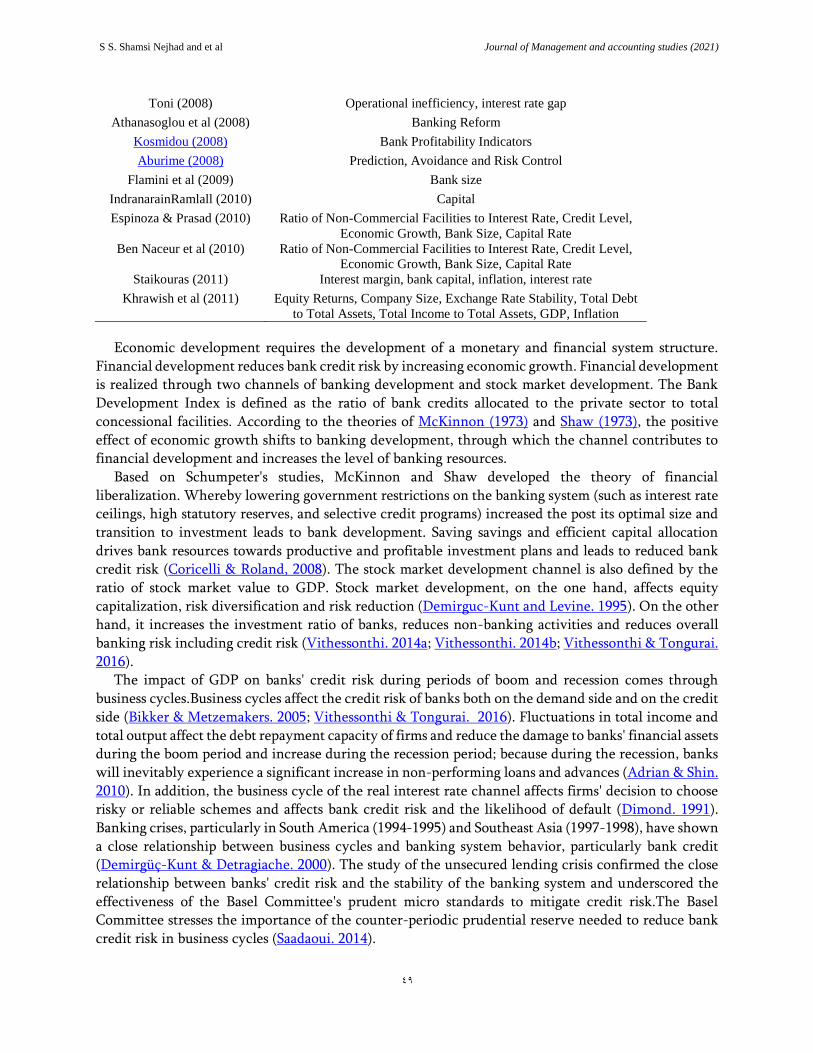
quality of the portfolio of the facility and consequently, the performance and profitability of the banks. Table (1) lists the most important researches of the past years:
Table 1. The most important credit risk factors in research Author/s Results
Haslem (1968) The ratios of capital, interest and pay, and payroll
Yeats (1974) Performance of Bank Structure
Short (1979) Market Structure Criteria (Focus or Market Share)
Revell (1980) The inflation Rate
Nienhaus (1983) Loan Rates
Smirlock (1985) Market share
Wall (1985) Managing Bank Assets and Debts, Manage funds, Non-interest cost
control
Bourke and Philips (1989) Macroeconomic factors
Short and Brock (1989) Focus on Profit Rate
Molyneux and Thornton
(1992)
Focus on Profit Rate
Molyneux (1993) Focus on costs
Stinenherr and Huveneers
(1994)
The relationship between risk and return, economic growth and
financial variables
Berger (1995) Profitability and risk relationship
Bessler and Booth (1996) The relationship between profitability and interest rate risk
Hutchison and Pennachi
(1996)
Focus on Interest Rates
Flannery et al (1997) Focus on Interest Rates
Babbel and Santomero
(1997)
Focus on asset and debt management
Neely and Wheelock (1997) Per capita income
Hoggarth et al (1998) Inflation
Jayaratneand Strahan (1998) Ownership features
Gure, B, Staunton, J and
Mugam (1999)
Commitment management, Market interest rates, The inflation rate
Bashir (2000) Capital, Overload, GDP, Interest rate, Loans ratio, Save tax
Bashir (2003) Profitability and Banking Features
DenizeMahshid-
Mohammad RaiszadehNaji
(2003)
Interest Risk
Haron (2004) Liquidity, Total Expenditures, Investment Funds, Interbank and
Borrower Profit Percentage with Total Revenue Received
IlaPatnaik& Ajay Shah
(2004)
Interest rate on equity, bank stock price
Abdus (2004) Liquidity
Baral (2005) Bank asset quality, non-performing receivables, health and
profitability of customer facilities
Hansjorg Lehmann and
Michael Manz (2006)
Macroeconomic variables
Al-Hashimi (2007) Interest rate gap
)(2021 Journal of Management and accounting studies and et al Nejhad Shamsi .S S
54
Toni (2008) Operational inefficiency, interest rate gap
Athanasoglou et al (2008) Banking Reform
Kosmidou (2008) Bank Profitability Indicators
Aburime (2008) Prediction, Avoidance and Risk Control
Flamini et al (2009) Bank size
IndranarainRamlall (2010) Capital
Espinoza & Prasad (2010) Ratio of Non-Commercial Facilities to Interest Rate, Credit Level,
Economic Growth, Bank Size, Capital Rate
Ben Naceur et al (2010) Ratio of Non-Commercial Facilities to Interest Rate, Credit Level,
Economic Growth, Bank Size, Capital Rate
Staikouras (2011) Interest margin, bank capital, inflation, interest rate
Khrawish et al (2011) Equity Returns, Company Size, Exchange Rate Stability, Total Debt
to Total Assets, Total Income to Total Assets, GDP, Inflation
Economic development requires the development of a monetary and financial system structure. Financial development reduces bank credit risk by increasing economic growth. Financial development is realized through two channels of banking development and stock market development. The Bank Development Index is defined as the ratio of bank credits allocated to the private sector to total concessional facilities. According to the theories of McKinnon (1973) and Shaw (1973), the positive effect of economic growth shifts to banking development, through which the channel contributes to financial development and increases the level of banking resources.
Based on Schumpeter's studies, McKinnon and Shaw developed the theory of financial liberalization. Whereby lowering government restrictions on the banking system (such as interest rate ceilings, high statutory reserves, and selective credit programs) increased the post its optimal size and transition to investment leads to bank development. Saving savings and efficient capital allocation drives bank resources towards productive and profitable investment plans and leads to reduced bank credit risk (Coricelli & Roland, 2008). The stock market development channel is also defined by the ratio of stock market value to GDP. Stock market development, on the one hand, affects equity capitalization, risk diversification and risk reduction (Demirguc-Kunt and Levine. 1995). On the other hand, it increases the investment ratio of banks, reduces non-banking activities and reduces overall banking risk including credit risk (Vithessonthi. 2014a; Vithessonthi. 2014b; Vithessonthi & Tongurai. 2016).
The impact of GDP on banks' credit risk during periods of boom and recession comes through business cycles.Business cycles affect the credit risk of banks both on the demand side and on the credit side (Bikker & Metzemakers. 2005; Vithessonthi & Tongurai. 2016). Fluctuations in total income and total output affect the debt repayment capacity of firms and reduce the damage to banks' financial assets during the boom period and increase during the recession period; because during the recession, banks will inevitably experience a significant increase in non-performing loans and advances (Adrian & Shin. 2010). In addition, the business cycle of the real interest rate channel affects firms' decision to choose risky or reliable schemes and affects bank credit risk and the likelihood of default (Dimond. 1991). Banking crises, particularly in South America (1994-1995) and Southeast Asia (1997-1998), have shown a close relationship between business cycles and banking system behavior, particularly bank credit (Demirgüç-Kunt & Detragiache. 2000). The study of the unsecured lending crisis confirmed the close relationship between banks' credit risk and the stability of the banking system and underscored the effectiveness of the Basel Committee's prudent micro standards to mitigate credit risk.The Basel Committee stresses the importance of the counter-periodic prudential reserve needed to reduce bank credit risk in business cycles (Saadaoui. 2014).

)(2021 Journal of Management and accounting studies and et al Nejhad Shamsi .S S
45
Both hypothetical and observational investigation was done to clarify the distinctions in credit chances among branches and auxiliaries of unfamiliar banks (Brei & Winograd. 2018). It was found that credit danger in Sub-Saharan Africa is not simply identified with macroeconomic determinants, for example, development, public obligation, monetary focus and monetary turn of events, yet additionally to the business and administrative climate (Brei et al., 2020). It was found that credit danger in Sub-Saharan Africa is not simply identified with macroeconomic determinants, for example, development, public obligation, monetary focus and monetary turn of events, yet additionally to the business and administrative climate (Musau et al., 2018). It was additionally discovered that normal people and NGOs were treated similarly by banks in evaluating their credit applications; notwithstanding, they varied in the treatment of business firms (Karsh & Abumwais. 2018).
Apart from the above factors, political developments, borrower's individual and organizational characteristics, GDP, unemployment rate, inflation rate, stock price indices, equity liquidity ratio, commercial openness and financial advantage also affect banks' credit risk. Are effective (Castro. 2013, 673).Some of these variables may or may not directly or indirectly affect the credit risk of a financial development channel or economic cycle. The literature on financial economics relates to debt leverage, the liquidity ratio (Laidroo. 2016; Black & Cox. 1976; Leland. 1994; Longstaff & Schwartz. 1995) and the degree of business openness (Chinn & Ito. 2006; Baltagi et al., 2009; Fischer & Valenzuela. 2013) acknowledge bank credit risk.
Therefore, considering the importance of addressing the indicators discussed in previous research and interviewing banking industry experts, credit risk indices at branch level are presented as Figure2:
Changing interest rate
Credit Risk indices at Branch Level
Macro Level Internal Management
Level
Branches
Inflation rate
Shari'a restrictions on participation
rates
Unemployment rate
GDP
Wages
Credit risk in the past period
The loan-to-asset ratio of the bank
Credit growth
Getting the necessary guarantees
Valid customer validation
Appropriate dealing with
customers
Depositing government loans
Follow up appointments
Improper location of branches

)(2021 Journal of Management and accounting studies and et al Nejhad Shamsi .S S
45
Fig. 2. General conceptual model
Case Study in IRAN (qard al-hasan RESALAT bank)
After designing the conceptual model (Figure 2), the researcher performed two steps in the executive steps: first by identifying the weight of the research indicators by SWARA technique and then prioritizing the 30 selected branches of Iran's largest lending bank, namely qard al-hasan RESALAT Bank(www.rqbank.ir) has used the MABAKMethod. Figure 3 illustrates the research implementation process:
Fig.3. Research Executive Model
The purpose of this study is to describe the purpose of the applied type and to collect the data descriptively. To prioritize, 30 branches of Iran's largest indebted bank, qard al-hasan RESALAT Bank, have been selected. Ten experienced banking experts have been selected to answer the questions in Table 2. The steps are described below.
Table 2.Expert Selection Row Education Work Experience Field of Study Job
1 BS 12 years Economy Head of Branch
2 DR 15 years financial manager financial manager
3 BS 8 years Banking Inspector
4 MA 9 years Management Head of Branch
5 MA 12 years Banking Head of Branch
6 BS 10 years Management auditor
7 BS 11 years financial manager Head of Branch
Bank Credit Risk Identification and
Model Drawing
Prioritize
Criteria
Prioritize Branches by MABAK
Method
Conclusions and Suggestions
Determining the Weights of Indices
by SWARA

)(2021 Journal of Management and accounting studies and et al Nejhad Shamsi .S S
45
8 MA 14 years Management Inspector
9 BS 9 years Economy Head of Branch
10 MA 10 years financial manager auditor
Stepwise Weight Assessment Ratio Analysis (SWARA) Method
The evaluation of criteria weighting has been a concern of MADM methods. Some methods of calculating the weight of criteria are:analytic hierarchy process (AHP) (Saaty. 1980), analytic network process (ANP) (Saaty& Vargas. 2001), Entropy (Shannon. 1948; Susinskas et al., 2011; Kersuliene & Turskis. 2011), FARE (Ginevicius.
2011), SWARA (Kersuliene et al., 2010)., etc. The SWARA method was introduced by Kersulieneetet, et al in 2010. In this technique, the criteria are ranked by value.In this method, the most important criterion is ranked first and the least important criterion is last. In this way, experts (respondents) play an important role in determining the weight of the criteria. The main characteristic of this method is the ability of experts and experts to estimate the relative importance of criteria in their weight determination process. This method is useful for gathering and coordinating information obtained from experts and experts. The applications of this technique are
simple and experts in various fields can easily communicate the main purpose of the technique. The steps for solving this procedure are presented in Figure 4.
The ability to estimate experts’ opinion about importance ratio of the criteria in the process of their weights determination is the main element of this method (Kersuliene et al., 2010). Moreover, this method is helpful for coordinating and gathering data from experts. Furthermore, SWARA method is uncomplicated and experts can easily work together. The main advantage of this method in decision-making is that in some problems, priorities
are defined based on policies of companies or countries and there are not any needs for evaluation to rank criteria.
Fig.4. Determining of the criteria weights based on SWARA (Kersuliene & Turskis. 2011)

)(2021 Journal of Management and accounting studies and et al Nejhad Shamsi .S S
45
So, after reviewing the experts' opinions, Weights and relative values of each indicator are calculated in Table 3:
Table 3. Results of SWARA method in weighting of indicators
Criterion Comparative importance of average value Sj
Coefficient Kj=Sj+1
Recalculated weight Wj=(Xj+1)/Kj
Weight Qj=Wj/∑ 𝒘𝒋
Invalid customer validation
1 1 0.264
Not getting the necessary guarantees
0.25 1.25 0.8 0.210
No follow up appointments 0.20 1.20 0.666 0.176
Inappropriate dealing with customers
0.30 1.30 0.512 0.134
Depositing government loans 0.15 1.15 0.445 0.118
Improper location of branches
0.20 1.20 0.370 0.098
Source: created by the authors
In the following, after determining the weight of the indices, using the MABAKTechnique, prioritizing the four selected branches of qard al-hasan RESALAT Bank throughout Iran has been discussed.
Multi-Attributive Border Approximation area Comparison (MABAC) Technique
The MABAC method is one of the newest multi-criteria decision-making techniques used to rank options in multi-criteria decision-making models. This method was first proposed by Pamučar & Ćirović. (2015). The advantages of the MABAC method are as follows: (1) it has a simple mathematical device and stable results. (2) Complete results can be easily obtained with this method because it considers the probable value of profit and loss. Moreover (3) it is possible to combine this approach with other approaches. Therefore, the MABAC method is capable of meeting the needs of a valid prioritization tool.
Steps to Solve:
Step 1: Determining research criteria and options

)(2021 Journal of Management and accounting studies and et al Nejhad Shamsi .S S
45
The first step in this method is to determine the research factors and options. In this section, literature review or methods such as Delphi or Fuzzy Delphi can be used to extract the research factors correctly.
Step 2: Forming the decision matrix
The second step is to form the decision matrix. The decision matrix in this way is a criterion-option, a matrix whose columns form the problem criteria and the rows are options. In addition, each cell is actually the score of every option over every criterion. This score can be given by real numbers or by verbal spectra.
Step 3: Decision Matrix Normalization
In this step, the decision matrix of the second step should be normalized. Normalization is done using the following equations: if the criteria are positive, the first relation is used and if the criteria are negative, the second relation is used.
𝑋𝑖𝑗 − 𝑋𝑖−
𝑋𝑖+ − 𝑋𝑖
− = 𝑛𝑖𝑗 (1)
𝑋𝑖𝑗 − 𝑋𝑖+
𝑋𝑖− − 𝑋𝑖
+ = 𝑛𝑖𝑗 (2)
Step 4: Normal matrix weighting
In this step, we weight the normal matrix using the following relation. Under W is the weight of criteria that must be obtained from other methods such as the Shannon entropy method, the AHP method or newer techniques such as the BWM method or the SWARA method.
𝑉𝑖𝑗 = 𝑊𝑖 ∗ (𝑛𝑖𝑗 + 1) (3)
Where nij represents the elements of the normalized matrix (N), wi denotes the standard weighting coefficients.
Step 5: Determine the area of similarity of the matrix (g)
In this section, using the following equation for each criterion, a similarity boundary is determined; in fact, it must be deducted from the scores of each geometric mean criterion to obtain the similarity boundary.
𝑔𝑗 = ( √∑ 𝑣𝑖𝑗
𝑚
𝑖=1
𝑚
) (4)
Where the following shows the elements of the weight matrix (V), m denotes the total number of alternatives. After calculating the value of gi according to the criteria, a matrix of approximate regions G is created in the form n x 1.

)(2021 Journal of Management and accounting studies and et al Nejhad Shamsi .S S
44
(5)
Step 6: Calculate the distance of options to the border of similarity
In this section, we obtain the options up to the area g by using the following equation. In fact, the weighted matrix should be subtracted from the matrix g.
(6)
Once the Q matrix is specified, the status of each option can be determined using the upper bound (+ G) and the lower bound (-G). Accordingly, the Ai option belongs to the set community mentioned above, as shown below. Accordingly, the upper limit of the area (+ G) is the area where the ideal positive is located and the lower limit of the area (-G) is the area where the ideal is the opposite.
Fig.5. Presentation of the upper (G+), lower (G) and border (G) approximation areas.
The degree of affiliation of the Ai option to the upper community is obtained by the following relation. According to the logic of the MABAK Method, in order to be a better option than the others, it must be in the top estimation area.
{
𝐺+ 𝐼𝐹 𝑞𝑖𝑗 > 0
𝐺 𝐼𝐹 𝑞𝑖𝑗 = 0
𝐺− 𝐼𝐹 𝑞𝑖𝑗 < 0
(7)
To select Ai as the best form of the set, it is necessary that the maximum possible criteria belong to the upper approximate region (+ G). A higher value of + qi∈G indicates that the alternative is closer to

)(2021 Journal of Management and accounting studies and et al Nejhad Shamsi .S S
44
the ideal alternative, while a lower value of -qi∈G indicates that the alternative is closer to the ideal alternative.
Step 7: Final ranking of options
In this step, using the relation below, determine the final score for each option and rank the options accordingly. The calculation of the values of the benchmark functions is obtained by the options as the sum of the alternative distances from the approximate boundary regions of qi. By summing the elements of the Q matrix in each row, the final values of the criterion function of the options are obtained.
𝑆𝑖 = ∑ 𝑞𝑖𝑗
𝑛
𝑗=1
, 𝑗 = 1,2, … . . , 𝑛 𝑎𝑛𝑑 𝑖 = 1,2, … , 𝑚 (8)
Where n represents the number of criteria, and m is the number of alternatives. The results are presented in tables 4 to 7 below:
Table 4. Normalized Matrix
weights of criteria 0.264 0.21 0.176 0.134 0.118 0.098
kind of criteria 1 1 1 -1 -1 -1
C1 C2 C3 C4 C5 C6
A1 0.5000 0.2500 0.2500 0.0000 1.0000 0.2500
A2 0.7500 0.0000 0.5000 0.7500 1.0000 0.5000
A3 0.5000 0.5000 0.0000 0.5000 0.7500 0.2500
A4 0.2500 0.2500 0.2500 0.0000 1.0000 1.0000
A5 0.5000 0.5000 0.7500 0.5000 0.0000 0.7500
A6 0.5000 1.0000 0.5000 0.0000 1.0000 0.5000
A7 0.2500 0.7500 0.2500 0.0000 0.5000 0.5000
A8 0.5000 0.5000 0.2500 0.2500 0.7500 0.0000
A9 0.7500 0.7500 0.2500 0.0000 0.7500 0.5000
A10 0.2500 0.2500 0.5000 0.7500 0.7500 0.2500
A11 0.0000 0.0000 0.2500 0.2500 0.0000 0.5000
A12 0.2500 0.2500 1.0000 0.2500 0.5000 0.2500
A13 0.5000 1.0000 0.2500 0.2500 0.7500 0.5000
A14 1.0000 1.0000 0.7500 0.7500 0.5000 0.0000
A15 0.5000 1.0000 0.2500 0.5000 0.2500 0.7500
A16 0.5000 0.5000 1.0000 0.7500 0.2500 0.7500
A17 0.2500 0.2500 1.0000 0.2500 0.0000 0.0000
A18 1.0000 1.0000 0.7500 0.7500 0.5000 0.7500
A19 0.5000 0.7500 0.7500 0.0000 0.7500 0.5000
A20 0.2500 0.2500 1.0000 0.2500 0.7500 0.7500
A21 0.2500 0.5000 0.5000 0.0000 0.2500 0.7500

)(2021 Journal of Management and accounting studies and et al Nejhad Shamsi .S S
44
A22 0.5000 0.5000 0.7500 0.0000 0.7500 0.5000
A23 0.5000 0.2500 1.0000 1.0000 1.0000 0.2500
A24 0.5000 0.2500 0.5000 0.0000 0.0000 0.0000
A25 0.5000 0.5000 1.0000 0.0000 0.5000 1.0000
A26 0.2500 0.2500 0.2500 0.2500 0.0000 0.5000
A27 0.5000 0.7500 0.2500 0.0000 0.5000 0.7500
A28 0.5000 1.0000 0.2500 0.7500 1.0000 0.5000
A29 1.0000 1.0000 0.2500 0.2500 0.5000 0.7500
A30 0.5000 1.0000 0.5000 1.0000 0.7500 0.0000
Source: created by the authors
Table 5. Normalized Weighted Matrix (V)
C1 C2 C3 C4 C5 C6
A1 0.3960 0.2625 0.2200 0.1340 0.2360 0.1225
A2 0.4620 0.2100 0.2640 0.2345 0.2360 0.1470
A3 0.3960 0.3150 0.1760 0.2010 0.2065 0.1225
A4 0.3300 0.2625 0.2200 0.1340 0.2360 0.1960
A5 0.3960 0.3150 0.3080 0.2010 0.1180 0.1715
A6 0.3960 0.4200 0.2640 0.1340 0.2360 0.1470
A7 0.3300 0.3675 0.2200 0.1340 0.1770 0.1470
A8 0.3960 0.3150 0.2200 0.1675 0.2065 0.0980
A9 0.4620 0.3675 0.2200 0.1340 0.2065 0.1470
A10 0.3300 0.2625 0.2640 0.2345 0.2065 0.1225
A11 0.2640 0.2100 0.2200 0.1675 0.1180 0.1470
A12 0.3300 0.2625 0.3520 0.1675 0.1770 0.1225
A13 0.3960 0.4200 0.2200 0.1675 0.2065 0.1470
A14 0.5280 0.4200 0.3080 0.2345 0.1770 0.0980
A15 0.3960 0.4200 0.2200 0.2010 0.1475 0.1715
A16 0.3960 0.3150 0.3520 0.2345 0.1475 0.1715
A17 0.3300 0.2625 0.3520 0.1675 0.1180 0.0980
A18 0.5280 0.4200 0.3080 0.2345 0.1770 0.1715
A19 0.3960 0.3675 0.3080 0.1340 0.2065 0.1470
A20 0.3300 0.2625 0.3520 0.1675 0.2065 0.1715
A21 0.3300 0.3150 0.2640 0.1340 0.1475 0.1715
A22 0.3960 0.3150 0.3080 0.1340 0.2065 0.1470
A23 0.3960 0.2625 0.3520 0.2680 0.2360 0.1225
A24 0.3960 0.2625 0.2640 0.1340 0.1180 0.0980
A25 0.3960 0.3150 0.3520 0.1340 0.1770 0.1960
A26 0.3300 0.2625 0.2200 0.1675 0.1180 0.1470
A27 0.3960 0.3675 0.2200 0.1340 0.1770 0.1715
A28 0.3960 0.4200 0.2200 0.2345 0.2360 0.1470
A29 0.5280 0.4200 0.2200 0.1675 0.1770 0.1715

)(2021 Journal of Management and accounting studies and et al Nejhad Shamsi .S S
44
A30 0.3960 0.4200 0.2640 0.2680 0.2065 0.0980
Source: created by the authors
Table 6. Distance of Alternatives from BAA matrix (Q)
C1 C2 C3 C4 C5 C6
A1 0.0090 -0.0574 -0.0432 -0.0395 0.0558 -0.0191
A2 0.0750 -0.1099 0.0008 0.0610 0.0558 0.0054
A3 0.0090 -0.0049 -0.0872 0.0275 0.0263 -0.0191
A4 -0.0570 -0.0574 -0.0432 -0.0395 0.0558 0.0544
A5 0.0090 -0.0049 0.0448 0.0275 -0.0622 0.0299
A6 0.0090 0.1001 0.0008 -0.0395 0.0558 0.0054
A7 -0.0570 0.0476 -0.0432 -0.0395 -0.0032 0.0054
A8 0.0090 -0.0049 -0.0432 -0.0060 0.0263 -0.0436
A9 0.0750 0.0476 -0.0432 -0.0395 0.0263 0.0054
A10 -0.0570 -0.0574 0.0008 0.0610 0.0263 -0.0191
A11 -0.1230 -0.1099 -0.0432 -0.0060 -0.0622 0.0054
A12 -0.0570 -0.0574 0.0888 -0.0060 -0.0032 -0.0191
A13 0.0090 0.1001 -0.0432 -0.0060 0.0263 0.0054
A14 0.1410 0.1001 0.0448 0.0610 -0.0032 -0.0436
A15 0.0090 0.1001 -0.0432 0.0275 -0.0327 0.0299
A16 0.0090 -0.0049 0.0888 0.0610 -0.0327 0.0299
A17 -0.0570 -0.0574 0.0888 -0.0060 -0.0622 -0.0436
A18 0.1410 0.1001 0.0448 0.0610 -0.0032 0.0299
A19 0.0090 0.0476 0.0448 -0.0395 0.0263 0.0054
A20 -0.0570 -0.0574 0.0888 -0.0060 0.0263 0.0299
A21 -0.0570 -0.0049 0.0008 -0.0395 -0.0327 0.0299
A22 0.0090 -0.0049 0.0448 -0.0395 0.0263 0.0054
A23 0.0090 -0.0574 0.0888 0.0945 0.0558 -0.0191
A24 0.0090 -0.0574 0.0008 -0.0395 -0.0622 -0.0436
A25 0.0090 -0.0049 0.0888 -0.0395 -0.0032 0.0544
A26 -0.0570 -0.0574 -0.0432 -0.0060 -0.0622 0.0054
A27 0.0090 0.0476 -0.0432 -0.0395 -0.0032 0.0299
A28 0.0090 0.1001 -0.0432 0.0610 0.0558 0.0054
A29 0.1410 0.1001 -0.0432 -0.0060 -0.0032 0.0299
A30 0.0090 0.1001 0.0008 0.0945 0.0263 -0.0436
Source: created by the authors

)(2021 Journal of Management and accounting studies and et al Nejhad Shamsi .S S
44
Table 7. The results
Alternatives Q Q Ranking
A1 -0.0943 -0.0943 25
A2 0.0882 0.0882 13
A3 -0.0483 -0.0483 20
A4 -0.0868 -0.0868 23
A5 0.0442 0.0442 15
A6 0.1317 0.1317 8
A7 -0.0898 -0.0898 24
A8 -0.0623 -0.0623 22
A9 0.0717 0.0717 14
A10 -0.0453 -0.0453 19
A11 -0.3388 -0.3388 30
A12 -0.0538 -0.0538 21
A13 0.0917 0.0917 11
A14 0.3002 0.3002 2
A15 0.0907 0.0907 12
A16 0.1512 0.1512 7
A17 -0.1373 -0.1373 27
A18 0.3737 0.3737 1
A19 0.0937 0.0937 10
A20 0.0247 0.0247 17
A21 -0.1033 -0.1033 26
A22 0.0412 0.0412 16
A23 0.1717 0.1717 6
A24 -0.1928 -0.1928 28
A25 0.1047 0.1047 9
A26 -0.2203 -0.2203 29
A27 0.0007 0.0007 18
A28 0.1882 0.1882 4
A29 0.2187 0.2187 3
A30 0.1872 0.1872 5

)(2021 Journal of Management and accounting studies and et al Nejhad Shamsi .S S
45
Source: created by the authors
4. Conclusion
The banking sector, as the most important financial institution in the country, has the task of equipping the financial resources and allocating them to the economic system. In Iran, due to the economic and financial structure of the country and the lack of proper expansion of financial markets, financing of various economic sectors is more the responsibility of the banking system. Banks have been exposed to a variety of credit risks throughout their lives, including credit risks, as the banks first role in the financial markets is in collecting deposits and lending. Therefore, identifying the factors that influence credit risk and their control for the banking system is of particular importance.
In this study, after reviewing the theoretical foundations of credit risk indices, a general model was designed at the branch level and finally, the indices were considered to assess the credit risk of the branches. Subsequently, the analysis was performed using the combined approach of SWARA and MABAK. In the first step, the weight of the indices was obtained using the SWARA technique the importance of the indices was as follows:
Invalid customer validation with a weight of 0.264 and the not getting the necessary guarantees with a score of 0.210, and no follow up appointments with a 0.176. An Inappropriate dealing with customers with a 0.134 and depositing government loans with a 0.118 and an improper location of branches with a 0.098. Then, taking into account the 30 branches selected from the resale bank, the weights obtained in the previous step were incorporated into the MABAK technique and thirty branches were prioritized. Therefore, the following suggestions for lower rated branches can be considered:
- Accurate and regular validation through a transparent system
- Permanent follow-up of branch officials in payments and the use of SMS, email and digital systems.
- Branches report monthly and report on their credit risk
- Branches that have a problem with refunds are identified and higher-rated branches are asked to share their experiences.
References
Aburime, U. (2008). Determinants of bank profitability: company level evidence from Nigeria. http://dx.doi.org/10.2139/ssrn.1106825.
Adrian, T. and Shin, H. S. (2010). “Liquidity and Leverage”. Journal of Financial Intermediation, 19(3): 418-437. https://doi.org/10.1016/j.jfi.2008.12.002
Alessandri, P., & Drehmann, M. (2010). An economic capital model integrating credit and interest rate risk. Journal of Banking and Finance (34), 752-764. https://doi.org/10.1016/j.jbankfin.2009.06.012

)(2021 Journal of Management and accounting studies and et al Nejhad Shamsi .S S
45
Altman, E. I., & Saunders, A. (1998). Credit risk measurement: Developments over the last 20 years. Journal of Banking & Finance, 21, 1721-1742. https://doi.org/10.1016/S0378-4266(97)00036-8
Anbar, a. (2006). Credit risk management in the Turkish banking sector: a survey study. Electronic journal of social science, 5(17), 10-24.
Arunkumar, R., & Kotreshwar, G. (2006). Risk Management in Commercial Banks (A Case Study of Public and Private Sector Banks). Indian Institute of Capital Markets 9th Capital Markets Conference Paper
Atiya, a. (2001). Bankruptcy Prediction for Credit Risk Using Neural. IEEE transactions on neural networks, 12(4), 929-935. DOI: 10.1109/72.935101
Bagchi,S. K. (2004). Defining Risk and Credit Risk Management, Gylan A. Holton.
Baltagi, B.H.; Demetriades, P.O. and Law, S.H. (2009). “Financial Development and Openness: Evidence from Panel Data”. Journal of Development Economics, 89(2): 285-296. https://doi.org/10.1016/j.jdeveco.2008.06.006
Balzer, Sortino, and N Lee. (1994). "Measuring Investment Risk." Journal of Investment 47-58.
Baral, K. J. (2005). Health checkup of commercial banks in the framework of CAMEL: a case study of joint venture banks in Nepal. The Journal of Nepalese Business Studies, 1(2): 231-241.
Bikker, J. and Metzemakers, P. (2005). “Bank Provisioning Behaviour and Procyclicality”. Journal of International Financial Markets, Institutions and Money, 15: 141-157. https://doi.org/10.1016/j.intfin.2004.03.004
Black, F. and Cox, J.C. (1976). “Valuing Corporate Securities: Some Effects of Bond Indenture Provisions”. Journal of Finance, 31(1): 351-367. https://doi.org/10.1111/j.1540-6261.1976.tb01891.x
Brei, M., & Winograd, C. (2018). Credit risk of foreign bank branches and subsidiaries in Argentina and Uruguay (No. 2018-12). University of Paris Nanterre, EconomiX.
Brei, M., Jacolin, L., & Noah, A. (2020). Credit risk and bank competition in Sub-Saharan Africa. Emerging Markets Review, 44, 100716. https://doi.org/10.1016/j.ememar.2020.100716
Breuer, T., Jandacka, M., Rheinberger, K., & Summer, M. (2010). Does adding up of economic capital for market-and credit risk amount to conservative risk assessment. Journal of Banking & Finance, 34(4), 703-712. https://doi.org/10.1016/j.jbankfin.2009.03.013
Broll, U., Schweimayer, G, Welzel, P (2004), Managing Credit Risk with Credit and Macro Derivatives, Schmalenbachs Zeitschriftfürbetriebswirtschaftliche Forschung 56(4):360-378 DOI: 10.1007/BF03396702. https://doi.org/10.1007/BF03396702
Caouette J, Altman E, Narayanan P. (1998). Managing Credit Risk. The Next Great Financial Challenge. JohnWiley& Sons: New York.
Castro, V. (2013). “Macroeconomic Determinants of the Credit risk in the BankingSystem: The Case of the GIPSI”. Economic Modelling, 31: 672-683. https://doi.org/10.1016/j.econmod.2013.01.027
Chen, M., Huang, S., (2003).Credit scoring and rejected instance s reassigning through evolutionary computation techniques .Exp.Syst.Appl.24, 433–441. https://doi.org/10.1016/S0957-4174(02)00191-4
Chen, K., & Pan, C. (2012). An Empirical Study of Credit Risk Efficiency of Banking Industry in Taiwan. Journal of Chinese Management Review, 1(15), 1-16.
Chinn, M.D. and Ito, H. (2006). “What matters for financial Development? Capital Controls, Institutions, and Interactions”. Journal of Development Economics, 81(1): 163-92. https://doi.org/10.1016/j.jdeveco.2005.05.010

)(2021 Journal of Management and accounting studies and et al Nejhad Shamsi .S S
45
Coricelli, F. and Roland, I. (2008). Finance and Growth: When Does Credit Really Matter? CEPR Discussion Papers, No. 6885.
Cooper, M., Jackson W. & Patterson G. (2003). Evidence of predictability in the cross-section of bank stock returns. Journal of Banking and Finance, 27: 214-245. https://doi.org/10.1016/S0378-4266(01)00263-1
Demirguc-Kunt, A. and Levine, R. (1995). “Stock Market Development and Financial Intermediaries: Stylized Facts”. World Bank Economic Review, Volume 10, Issue 2: 223-239.
Demirgüç-Kunt, A. and Detragiache, E. (2000). “Monitoring Banking SectorFragility: A Multivariate Logit Approach”. World Bank Economic Review, Volume 14, Issuue 2: 287-307. https://doi.org/10.1093/wber/14.2.287
Dimond, D. (1991). “Monitoring and Reputation: The Choice between Bank Loans and Directly Placed Debt”. Journal of Political Economy, 99(4): 689-721. 10.3366/code.2016.0000
Emel, AhmetBurak. Oral, Muhittin. Reisman, Arnold. Yolalan, Reha. (2003). A credit scoring approach for the commercial banking sector. Socio-Economic Planning Sciences, 37, 103–123. https://doi.org/10.1016/S0038-0121(02)00044-7
Estrella, a., & Mishkin, f. (1996). The Yield Curve as a Predictor of U.S. Recessions. Current issues in economics and finance, 2(7). http://dx.doi.org/10.2139/ssrn.249992
Fischer, R. and Valenzuela, P. (2013). “Financial Openness, Market Structure and Private Credit: An Empirical Investigation”. Economic Letters, 121(3): 478-481. https://doi.org/10.1016/j.econlet.2013.10.009
Foos, D., L. Norden& M. Weber. (2010). Loan growth and Riskiness of Banks, Journal of Banking & Finance, 34: 2929–2940. https://doi.org/10.1016/j.jbankfin.2010.06.007
Froot, k., scharfstein, d. s., & stein, j. c. (1993). Risk management: coordinating corporate investment and financing policies. The journal of finance, 48(5).
Fukuda, S. (2012). Market-specific and currency-specific risk during the global financial crisis: evidence from the interbank markets in Tokyo and London. Journal of Banking and Finance, 36(12), 3185-3196. https://doi.org/10.1016/j.jbankfin.2012.01.003
Giesecke, K., & Kim, B. (2011). Systemic risk: What defaults are telling us? Management Science, 57(8), 1385-1405. https://doi.org/10.1111/j.1540-6261.1993.tb05123.x
Ginevicius, R. (2011). A New Determining Method for the Criteria Weights in Multi-Criteria Evaluation. International Journal of Information Technology & Decision Making, 10(6), 1067-1095.http://dx.doi.org/10.1142/S0219 622011004713
Hoffmann, p. (2011). "Determinats of the profitability of the Us Banking industry." International Journal of Business and Social Science 22-45.
Horstedt, m., & linjamaa, j. (2015). Credit risk evaluation of Swedish SMEs.
Kabari, L. G. Nwachukwu, E. O. (2013). Credit Risk Evaluating System Using Decision Tree – Neuro Based Model. International Journal of Engineering Research &Technology, 2, 2738-2745.
Karsh, S. M. A., & Abumwais, R. M. (2018). Evaluation Strategies of Credit Risk used by Commercial Banks Listed in Palestine Stock Exchange (PSE). Global Journal of Management and Business Research.
Kersuliene, V., &Turskis, Z. (2011). Integrated Fuzzy Multiple Criteria Decision Making Model for Architect Selection. Technological and Economic Development of Economy, 17(4), 645-666.http://dx.doi.org/10.3846/20294913. 2011.635718

)(2021 Journal of Management and accounting studies and et al Nejhad Shamsi .S S
45
Kersuliene, V., Zavadskas, E. K., & Turskis, Z. (2010). Selection of Rational Dispute Resolution Method by Applying New Step-Wise Weight Assessment Ratio Analysis (SWARA). Journal of Business Economics and Management, 11(2), 243-258.http://dx.doi.org/10.3846/jbem.2010.12
Kosmidou, K. (2008). The determinant of banks' profit in Greece during the period of EU financial integration. Journal of Managerial Finance, 34(3): 417-428. https://doi.org/10.1108/03074350810848036
Laidroo, L (2016). Bank ownership and lending: does bank ownership matter?, Emerging Markets Finance and Trade 52 (2), 285-301. https://doi.org/10.1080/1540496X.2015.1095032
Leland, H. E (1994). Corporate Debt Value, Bond Covenants, and Optimal Capital Structure, the Journal of Finance, Vol. 49, No. 4. (Sep. 1994), pp. 1213-1252. https://doi.org/10.1111/j.1540-6261.1994.tb02452.x
Lin, S. (2009). A new two-stage hybrid approach of credit risk in banking industry, Expert Systems with Applications, 36, 8333–8341. https://doi.org/10.1016/j.eswa.2008.10.015
Longstaff, F.A. and Schwartz, E.S. (1995). “A Simple Approach to Valuing Risky fixed and floating Rate Debt”. Journal of Finance, 50(3): 789-819.
McKinnon, R. (1973). Money and Capital in Economic Development. Washington, D.C: Brookings Institution.
Meulbroek, L. K. (2002). Integrated Risk Management for the Firm: A Senior Manager's Guide. Claremont Colleges - Robert Day School of Economics and Finance. http://dx.doi.org/10.2139/ssrn.301331
Mileris, Ricardas. Boguslauskas, Vytautas. (2011). Credit Risk Estimation Model Development Process: Main Steps and Model Improvement. InzinerineEkonomika-Engineering Economics, 22, 126-133. http://dx.doi.org/10.5755/j01.ee.22.2.309
Min, Jae H. Lee, Young-Chan. (2008). A practical approach to credit scoring. Expert Systems with Applications, 35, 1762–1770. https://doi.org/10.1016/j.eswa.2007.08.070
Mullings, R. (2003), “Capital Requirements and Commercial Bank Behavior: The Jamaican Experience”, Bank of Jamaica Papers, Kingston: Bank of Jamaica.
Musau, S., Muathe, S., & Mwangi, L. (2018). Financial inclusion, bank competitiveness and credit risk of commercial banks in Kenya. International Journal of Financial Research, 9(1), 203.
Nijskens, R., & Wagner, W. (2011). Credit risk transfer activities and systemic risk: how banks became less risky individually but posed greater risks to the financial system at the same time. Journal of Banking & Finance, 35(6), 1391-1398. https://doi.org/10.1016/j.jbankfin.2010.10.001
Ojima, D, Ojima, N (2019). CREDIT RISK AND ECONOMIC GROWTH IN NIGERIA, European Journal of Business, Economics and Accountancy, Vol. 7, No. 1, 2019, ISSN 2056-6018
Pamučar, D., & Ćirović, G. (2015). The selection of transport and handling resources in logistics centers using Multi-Attributive Border Approximation area Comparison (MABAC). Expert Systems with Applications, 42(6), 3016–3028. doi:10.1016/j.eswa.2014.11.057
Qian, J., & Strahan, P. (2007). How laws and institutions shape financial contracts: the case of bank loans. The Journal of Finance, 62(6), 2803-2834. https://doi.org/10.1111/j.1540-6261.2007.01293.x
Quader, S. M., Shamsi, N. I., & Abdullah, M. N. (2020). Expansion and profitability of bank branches: a study on selected rural branches of Bangladesh. Macroeconomics and Finance in Emerging Market Economies, 1-21. https://doi.org/10.1080/17520843.2020.1746679
Reimer, K. (2018). Theoretical Foundations of Credit Risk Fundamentals and Methods of Determining Credit Risk. Asymmetric Cost Behavior, 39–61. Doi: 10.1007/978-3-658-22822-4_3.

)(2021 Journal of Management and accounting studies and et al Nejhad Shamsi .S S
45
Saaty, L. T. (1980). The Analytic Hierarchy Process. McGraw Hill Company, New York.
Saaty, L. T., & Vargas, L. G. (2001). Models, Methods, Concepts &Applications of the Analytical Hierarchy Process. Kluwer Academic Publishers, Boston. http://dx.doi.org/10.1007/978-1-4615-1665-1.
Saadaoui, Z. (2014). Business cycle, market power and bank behaviour in emerging countries. International Economics. 139: 109-132. https://doi.org/10.1016/j.inteco.2014.04.001
Saunders, a., Allen, l. (2002). Credit Risk Measurement: New Approaches to Value at Risk and Other Paradigms. Wiley.
Servigny, A, Renault, O., (2004). Measuring and Managing Credit Risk, Business & Economics, 388 pages
Shannon, C. E. (1948). The Mathematical Theory of Communication. Bell System Technical Journal,27, 379-423.http://dx.doi.org/10.1002/j.1538-7305.1948.tb01338.x
Shaw, E. (1973). Financial Deepening in Economic Development. New York: Oxford University Press.
SMITH, C., SMITHSON, C. & WILFORD, S. (1990). Managing financial risk (New York, Harper & Row).
Stiglitz, j., &weiss, a. (1981). Credit rationing in markets with imperfect information. The american economic review, 71(3), 393-410.
Stulz, R., 1984, Optimal hedging policies, Journal of Financial and Quantitative Analysis 19, 12740. https://doi.org/10.2307/2330894
Susinskas, S., Zavadskas, E. K., & Turskis, Z. (2011). Multiple Criteria Assessment of Pile-Columns Alternatives. The Baltic Journal of Road and Bridge Engineering, 6(3), 77-83.http://dx.doi.org/10.3846/bjrbe.2011.19. Doi: 10.3846/1648715X.2015.1132790
Tan, Y. (2015). The Impacts of Risk and Competition on Bank Profitability in China. Journal of International and Financial Markets, Institutions and Money, (40), 85-110. https://doi.org/10.1016/j.intfin.2015.09.003
Van Greuning, Hennie; BrajovicBratanovic, Sonja. (2009). Analyzing Banking Risk: A Framework for Assessing Corporate Governance and Risk Management, Third Edition. World Bank. © World Bank. https://openknowledge.worldbank.org/handle/10986/2618 License: CC BY 3.0 IGO.”
Vithessonthi, C. (2014a). “The Effect of Financial Markets Development on Bank Risk: Evidence from Southeast Asian Countries”. International Review of Financial Analysis, 35: 249-260. https://doi.org/10.1016/j.irfa.2014.10.005
Vithessonthi, C. (2014b). “Financial Markets Development and Bank Risk: Experience from Thailand during 1990-2012”. Journal of Multinational Financial Management, 27: 67-88. https://doi.org/10.1016/j.mulfin.2014.05.003
Vithessonthi, C. and Tongurai, J. (2016). “Financial Markets Development, Business Cycles, and Bank Risk in South America”. Research in International Business and Finance, 36: 472-484. https://doi.org/10.1016/j.ribaf.2015.10.012
Wang, y., gao, s., &zhang, j. (2013). Credit risk management in rural commercial banks in chin the seventh international days of statistics and economics. Prague.
Yanping, Y., Zhengming, Q., Min, Y., Rui, G.,Liting, F.,Penghui, G. (2012). Research on the Application of Decision Tree to the Analysis of Individual Credit Risk. Information Technology, 25, 209-214.
Yu, L., Wang, S., Lai, K. (2008). Credit risk assessment with a multistage neural network ensemble learning approach. Expert Systems with Applications. 34, 1434–1444. https://doi.org/10.1016/j.eswa.2007.01.009

)(2021 Journal of Management and accounting studies and et al Nejhad Shamsi .S S
44
Yu, L., Yue, W., Wang, S., Lai, K.K. (2010). Support vector machine based multi agent ensemble learning for credit risk evaluation. Expert Systems with Applications, 37, 1351-1360. https://doi.org/10.1016/j.eswa.2009.06.083
Zribi, N., & Boujelbène, Y. (2011). The factors influencing bank credit risk: The case of Tunisia. Journal of Accounting and Taxation, 4, 70-78.