Embed Size (px)
Citation preview

Ar
CD
a
ARRAA
KSSGPFM
1
arfaiessamvwi
md(
1d
Applied Soft Computing 12 (2012) 807–818
Contents lists available at SciVerse ScienceDirect
Applied Soft Computing
j ourna l ho mepage: www.elsev ier .com/ locate /asoc
hybrid stock selection model using genetic algorithms and support vectoregression
hien-Feng Huang ∗
epartment of Computer Science and Information Engineering, National University of Kaohsiung, Kaohsiung, Taiwan, ROC
r t i c l e i n f o
rticle history:eceived 28 January 2011eceived in revised form 1 June 2011ccepted 23 October 2011vailable online 31 October 2011
eywords:tock selectionupport vector regressionenetic algorithmsarameter optimization
a b s t r a c t
In the areas of investment research and applications, feasible quantitative models include methodolo-gies stemming from soft computing for prediction of financial time series, multi-objective optimizationof investment return and risk reduction, as well as selection of investment instruments for portfoliomanagement based on asset ranking using a variety of input variables and historical data, etc. Among allthese, stock selection has long been identified as a challenging and important task. This line of researchis highly contingent upon reliable stock ranking for successful portfolio construction. Recent advances inmachine learning and data mining are leading to significant opportunities to solve these problems moreeffectively. In this study, we aim at developing a methodology for effective stock selection using supportvector regression (SVR) as well as genetic algorithms (GAs). We first employ the SVR method to generatesurrogates for actual stock returns that in turn serve to provide reliable rankings of stocks. Top-ranked
eature selectionodel validation
stocks can thus be selected to form a portfolio. On top of this model, the GA is employed for the opti-mization of model parameters, and feature selection to acquire optimal subsets of input variables to theSVR model. We will show that the investment returns provided by our proposed methodology signifi-cantly outperform the benchmark. Based upon these promising results, we expect this hybrid GA–SVRmethodology to advance the research in soft computing for finance and provide an effective solution to
e.
stock selection in practic. Introduction
Stock selection has been a challenging and important researchrea in finance and investment decision-making. This line ofesearch is highly contingent upon reliable prediction of future per-ormance of stocks and successful portfolio construction. Recentdvances in computational intelligence and data mining are lead-ng to significant opportunities to solve these problems moreffectively. Feasible quantitative models include methodologiestemming from soft computing [1] for prediction of financial timeeries, multi-objective optimization of expected investment returnnd risk reduction, and portfolio management – selection of invest-ent instruments based on asset ranking using a variety of input
ariables and historical data, etc. [2,3]. All these research effortsere in an attempt to facilitate the task of decision-making for
nvestment.In the research area of stock selection and portfolio opti-
ization, several machine learning methodologies have beeneveloped, including fuzzy systems, artificial neural networksANNs), evolutionary algorithms (EAs) as well as support vector
∗ Tel.: +886 7 5919798; fax: +886 7 5919514.E-mail address: [email protected]
568-4946/$ – see front matter © 2011 Elsevier B.V. All rights reserved.oi:10.1016/j.asoc.2011.10.009
© 2011 Elsevier B.V. All rights reserved.
machines (SVMs). Earlier work includes several fuzzy approaches;for instance, Chu et al. [4] used fuzzy multiple attribute decisionanalysis to select stocks for portfolio construction. Analogously,Zargham and Sayeh [5] employed a fuzzy rule-based system toevaluate a set of stocks for the same purpose. Although thesefuzzy approaches denote early efforts in employing computationalintelligence for financial applications, they usually lack sufficientlearning ability.
Quah and Srinivasan [6] studied an ANN stock selection sys-tem to choose stocks that are top-ranked performers. They showedtheir proposed model outperformed the benchmark model in termsof compounded actual returns overtime. Chapados and Bengio [7]also trained neural networks for estimation and prediction of assetbehavior in order to facilitate decision-making in asset allocation.Although these models worked in some applications, they oftensuffer from the overfitting problem and may tend to fall into a localoptimum.
For portfolio optimization, Kim and Han [8] proposed a geneticalgorithm (GA) approach to feature discretization and the determi-nation of connection weights for ANNs to predict the stock price
index. They suggested that their approach was able to reducethe numbers of attributes and the prediction performance wasenhanced. In addition, Caplan and Becker [9] employed geneticprogramming (GP) to develop a stock ranking model for the high
8 Comp
tBfsrf
daTtssuitcoeSaotmSobcBti
lomttiul[ousvrra
Ssvtfatta
rloactt
08 C.-F. Huang / Applied Soft
echnology manufacturing industry in the U.S. More recently,ecker et al. [10] explored various single-objective fitness functions
or GP to construct stock selection models for particular investmentpecifics with respect to risk. In a nutshell, these GP-based modelsank stocks from high to low according to a pre-defined objectiveunction.
Because stock market data is highly noisy and complex inimensionality, it often occurs that most of the aforementionedpproaches exhibit inconsistent and unpredictable performance.hese challenges arise mainly from the fact that the characteris-ics and processes of the underlying system that generate timeeries are generally nonlinear and non-stationary, and for theseystems the models solving the relevant applications are usuallynknown a priori. An advanced class of novel machine learn-
ng algorithms – support vector machines – that improve uponhe deficiency of well-known linear techniques for solving theseomplex applications, was thus developed by Vapnik [11]. Aspposed to the traditional empirical risk minimization principlemployed by ANNs that minimizes the error on training data,VMs employ the principle of structural risk minimization thatims to minimize the upper bound of generalization error, andver-fitting is less likely to occur. In general, the optimal solu-ion to SVMs may also be global whereas other neural-network
odels tend to fall into a local optimal solution. As a result,VM research thus far has showed that this methodology canutperform other non-linear methods, including neural-networkased non-linear prediction, case based reasoning, Linear Dis-riminant Analysis, Quadratic Discriminant Analysis and Elmanack-propagation Neural Networks [12–15]. In this study, weherefore adopt this methodology for the investment problemnvestigated here.
Furthermore, even though SVMs have been employed as a popu-ar research methodology in the area of financial applications, mostf them focused on the forecast of future direction of either a stockarket index or individual stocks [14–18]. Rather than the predic-
ion of financial time series alone, in this study we investigate theask of stock selection using SVMs. This problem is challenging andmportant in investment, but it is not clear yet how SVMs can besed to advance this research area. Although there exists an ear-
ier attempt using SVMs for this problem by Fan and Palaniswami19], they solely employed SVMs to classify stocks into winningr losing groups, and this coarse-grained classification proceduresually failed to capture more subtle characteristics of individualtocks. In this study, we will utilize SVMs for regression (supportector regression – SVR) of stock returns, which then serve as sur-ogates for the actual returns of stocks to imply their quality andelative rankings. Via this improvement, we shall demonstrate SVRs an effective means for stock selection.
However, despite the promising performance of the SVM andVR in classification and regression, respectively, its success inolving these two problems is highly contingent upon the inputariables (features) to the model. Yang and Honavar [20] indicatedhat several classification issues are determined by the choice ofeatures that describe given patterns presented to a classifier, suchs the classification accuracy of the learned classifier, the compu-ational overhead required for learning a classification function,he number of training examples needed for learning, and the costssociated with the features.
The goal of feature selection aims to identify useful, non-edundant subsets of features for a given data mining or machineearning task. By extracting the most essential yet least numberf features, one can reduce the computational cost significantly,
nd construct models that are generalized enough to bring aboutonsistent performance over unseen datasets. Furthermore, sincehe variables relevant to the SVM/SVR consist of not only the fea-ures but also the kernel parameters, it is expected that a successfuluting 12 (2012) 807–818
model along this line of research shall take into consideration thesetwo issues simultaneously.
In the literature, simultaneous optimization on kernel parame-ters and feature subsets for SVM-based models has been conducted.Fröhlich et al. [21] first presented a study on this problem for SVMby using the GA, in which feature selection was the main researchsubject. Huang and Wang [22] then presented a different version forthis sort of simultaneous optimization and showed that the classifi-cation accuracy of their proposed SVM can be improved for severalUCI datasets [23]. Due to these promising results, in this stock-selection study, we thus propose to employ a SVR-based model witha hybrid feature selection and parameter optimization method-ology by the GA. In our proposed framework, the task of featureselection depends on the learning algorithm that constructs the SVRmodel, and our scheme shall be categorized as a wrapper approach[24,25], as opposed to a filter approach. The wrapper approach forfeature selection is employed in this study because of its improvedperformance over the filter approach [22–26]. In essence, the opti-mization method we adopted here is very similar to that proposedby Huang and Wang [22], yet we will demonstrate our main con-tribution lies in a proper setup that successfully applied this hybridmethodology to stock selection, which is a new SVR applicationarea.
In a nutshell, the methodology we proposed here is to use theSVR to generate reliable surrogates of actual stock returns for stockrankings. Top-ranked stocks are then chosen for portfolio construc-tion. For the simultaneous optimization on model parameters andfeature subsets, we employ the GA for this task. We will report theportfolios constructed by our proposed scheme will substantiallyoutperform the benchmark over the long period of time.
This paper is organized into five sections. Section 2 outlines themethods employed in our study. Section 3 describes the researchdata used in this study. In Section 4, we describe the experimentaldesign and empirical results are reported and discussed. Section 5presents the conclusions and future research directions.
2. Methodology
This section first reviews the SVM/SVR theory, followed by thedescription for our proposed stock selection model. Afterwards,model optimization, including parameter optimization and featureselection, will be performed by the GA. The detailed explanationsabout the SVM and GA theories may be found in the referenceslisted in this paper.
2.1. Support vector machines
The SVM was first proposed by Vapnik [11], which aims to learna separate function that divides training instances into distinctgroups according to their class labels. By this point of view, SVMsform a class of supervised learning models with main applicationsto solving problems in classification and regression.
2.1.1. ClassificationThrough mapping input vectors x into a high-dimensional
feature space, SVM models constructed in the new space may repre-sent a linear or nonlinear decision boundary in the original space. Inthe new space, an optimal separation between instances of distinctclasses is achieved by the hyperplane that has the maximal dis-tance to the nearest training instances. As a result, SVMs are knownas a methodology that generates the maximum margin hyper-plane to provide the maximum separation between distinct classes.
The maximum margin hyperplane for a given learning problem isuniquely defined by the instances that are closest to it, and theseinstances are known as support vectors. In addition, the separatefunction can be linear or nonlinear. In the linearly separable case,
Comp
tt
liasf
y
weth
v
o
y
waSipfpb
2
oeiw
tmnap
w
wwfli
f
C.-F. Huang / Applied Soft
he instances can be separated by a linear hyperplane; otherwise,he case is nonlinearly separable.
For the linearly separable case, consider a given set S with nabeled training instances {(x1, y1), (x2, y2), . . ., (xn, yn)}. Each train-ng instance xi ∈ Rk, for i = 1, . . ., n, belongs to either of the two classesccording to its label yi ∈ {−1, +1}, where k is the input dimen-ion. The maximum margin hyperplane can be represented by theollowing equation:
= b +∑
wiyix(i) · x, (1)
here · represents the dot product; the vector x represents a testxample and the vectors x(i)s are the support vectors. In this equa-ion, b and wi are parameters that determine the hyperplane andave to be learned by the SVM.
To obtain an optimal hyperplane, one solves the following con-ex quadratic programming (QP) problem [11]:
Minimize12||w||2
Subject to yi(w · xi + b) ≥ 1, i = 1, . . . , n. (2)
For the nonlinearly separable case, a high-dimensional versionf Eq. (1) is represented as follows:
= b +∑
wiyiK(x(i), x), (3)
here the function K(x(i), x) is defined as the kernel function. Therere various kernels for generating the inner products to constructVMs with different types of nonlinear decision surfaces in thenput space. Common choices of the kernel functions include theolynomial kernel K(x, y) = (xy + 1)d, and the Gaussian radial basisunction K(x, y) = exp(− 1/ı2(x − y)2), where d is the degree of theolynomial kernel and ı2 is the bandwidth of the Gaussian radialasis function [14].
.1.2. RegressionThe concept of a maximum margin hyperplane described above
nly applies to classification. However, the SVM models have beenxtended for general estimation and prediction problems, includ-ng a version of SVM for regression proposed by Drucker et al. [27],
hich is known as support vector regression (SVR).The objective of SVR is to find a function that approximates the
raining instances well by minimizing the prediction error. Wheninimizing the error, the risk of over-fitting is reduced by simulta-
eously trying to maximize the flatness of the function. To obtainn optimal hyperplane, one again solves the following quadraticrogramming problem:
Minimize12||w||2
Subject to ||yi − (w · xi + b)|| ≤ ε, (4)
here ε ≥ 0 represents the bound for the prediction error.The above convex optimization problem is feasible in cases
here f = 〈w, x〉 + b actually exists and approximates all pairs (xi, yi)ith ε precision. To permit some errors in the exchange for modelexibility, one introduces slack variables �i, �∗
ito tackle otherwise
nfeasible constraints of the following optimization problem:
Minimize12||w||2 + C
l∑i=1
(�i + �∗i )
Subject to
⎧⎪⎨ yi − 〈w, xi〉 − b ≤ ε + �i
〈w, xi〉 + b − yi ≤ ε + �∗i
. (5)
⎪⎩�i, �∗
i≥ 0
The constant C determines the trade-off between the flatness of and the amount up to which deviations larger than ε are tolerated.
uting 12 (2012) 807–818 809
By constructing the Lagrangian function, this optimization problemcan be formulated as a dual problem:
L = 12||w||2 + C
l∑i=1
(�i + �∗i ) −l∑
i=1
�i(ε + �i − yi + 〈w, xi〉 + b)
−l∑
i=1
�∗i (ε + �∗i + yi − 〈w, xi〉 − b)
−l∑
i=1
�i(�i�i + �∗i �∗i ), and �i, �∗i , �i, �∗i ≥ 0.
Solving the Lagrangian, one obtains the optimal solutions w* andb*:
w∗ =l∑
i=1
(�i − �∗i )xi,
b∗ = yi − 〈w∗, xi〉 − ε, 0 ≤ �i ≤ C, i = 1, . . . , l,
b∗ = yi − 〈w∗, xi〉 + ε, 0 ≤ �∗i ≤ C, i = 1, . . . , l.
Analogous to classification, the inner products can be replacedby proper kernels for nonlinear problems. The tradeoff betweenminimizing the prediction error and maximizing the flatness of theregression function is controlled by enforcing the upper limit C onthe absolute value of the coefficients wis. The upper limit restrictsthe influence off the support vectors on the shape of the regressionfunction and is a parameter that the user must specify in addition toε. The larger C is, the more closely the function can fit the data. In thedegenerate case where ε = 0, the algorithm simply performs least-absolute-error regression under the coefficient size constraint, andall training instances become support vectors. Conversely, if ε islarge enough, the error approaches zero, and the algorithm outputsthe flattest that encloses the data irrespective of value of C.
2.2. Predicted stock returns via SVR as surrogates for stockselection
In this study, we are concerned with the relative quality of stocksthat can be described by their predicted returns at a future point oftime. The predicted stock returns by the SVR are determined by themodel parameters and the set of input features to the SVR, includingfundamental variables that describe firms’ share price rationality,growth, profitability, liquidity, efficiency, and leverage attributes.The predicted returns are then used to determine the rankingsof stocks, by which top-ranked stocks are picked to construct theportfolio.
More specifically, the SVR predicts the return of stock i at timet as yi,t (F, �) ∈ R, for i = 1, . . ., n, where F and � denote the set ofinput features and kernel parameters used by the SVR. It is worthmentioning that the prediction for the returns of individual stocksdoes not have to be perfect. Rather, it is crucial that the predictedreturns can serve as reliable surrogates of actual returns to facili-tate effective stock rankings. Thus given the predicted returns of allstocks, the ranking of a stock can be defined as:
˛i,t(F, �) = �(yi,t(F, �)), (6)
where ˛i,t ∈ N is the ranking of stock i at time t; ˛i,t ≥ ˛j,t iff yi, t ≥ yj,t.The task of stock selection can be achieved using these rankings
whereby top-ranked m stocks (stocks corresponding to the top m˛s) are selected as components of a portfolio. The performance of

8 Comp
as
R
wfi
Rii
R
h
2
dSssmwnm
2
btGaeiaesaAgapainvo
all optimization task due to its straightforward binary encodingscheme and effectiveness for feature selection.
In the encoding design of our proposed scheme, the composi-tion of a chromosome is devised to consist of four portions – the
1
10 C.-F. Huang / Applied Soft
portfolio can be evaluated by averaging the actual returns of thetocks in the portfolio, which is defined as:
t = 1m
m∑i=1
Rt(si,t), (7)
here si,t is the i-th ranked stock at time t; Rt(·) is the actual returnor a stock at time t and Rt is the average return over all the m stocksn the portfolio at time t.
In this study we use the cumulative total (compounded) return,c, to evaluate the performance of a stock selection model, where Rc
s defined by the product of average yearly return, Rt , of the stocksn a portfolio over n consecutive years as:
c =n∏
t=1
Rt. (8)
To sum up, the SVR-based stock selection algorithm employedere can be described as follows.
Step 1: i ← 1.Step 2: Use the input data (i.e., F, �) to the SVR and actual returnsof stocks of year i to find the support vectors for the instance sets.Step 3: Use the input data (F, �) of year i + 1 to compute the pre-dicted yearly returns of stocks for stock ranking by Eq. (6).Step 4: Pick top m stocks according to the rankings obtained inStep 3. Compute the average yearly return of these selected stocksby Eq. (7).Step 5: i ← i + 1; repeat Steps 2–4 until i = n − 1.Step 6: Compound the average yearly returns by Eq. (8) to obtainthe cumulative total return of the portfolio over the n years.
.3. Model optimization
The performance of the SVR-based stock selection model isetermined by the input features F and the parameters � to theVR. Therefore, we expect that the optimization of � as well as sub-ets of F shall enhance the effectiveness of the SVR model. In thistudy, we propose to use genetic algorithms for simultaneous opti-ization with respect to these two tasks. In the next subsectionse describe the basics of the GA, the motivation of using this tech-ique, and the relevant optimization scheme for our stock selectionodel.
.3.1. Genetic algorithmsGenetic algorithms were developed by Holland [28] and have
een used as computational models of natural evolutionary sys-ems and as adaptive algorithms for solving optimization problems.As operate on an evolving population of artificial organisms, orgents. Each agent is comprised of a genotype (often a binary string)ncoding a solution to some problem and a phenotype (the solutiontself). GAs regularly start with a population of randomly gener-ted agents within which solution candidates are embedded. Inach iteration, a new generation is created by applying variations,uch as crossover and mutation, to promising candidates selectedccording to probabilities biased in favor of the relatively fit agents.s a result, evolution occurs by iterated stochastic variation ofenotypes, and selection of the best phenotypes in an environmentccording to how well the respective solution solves a problem (orroblem-specific fitness function). Successive generations are cre-
ted in the same manner until a well-defined termination criterions met. The core of this class of algorithms lies in the production ofew genetic structures along the course of evolution, thereby pro-iding innovations to solutions for the problem at hand. The stepsf a simple GA are shown in the following:uting 12 (2012) 807–818
Step 1: Randomly generate an initial population of l agents, eachbeing an n-bit genotype (chromosome).Step 2: Evaluate each agent’s fitness.Step 3: Repeat until l offspring have been created.(a) select a pair of parents for mating;(b) apply variation operators (crossover and mutation);Step 4: Replace the current population with the new population.Step 5: Go to Step 2 until terminating condition.
2.3.2. Chromosome encoding and fitness functionAmong many paradigms of search algorithms GAs have been
proven to have an advantage over traditional optimization meth-ods in problems with many complex, discontinuous constraintsin the search space. This methodology contributes for a global,population-based search in the search space, in contrast with thekind of local, greedy search conducted by most rule-inductionand decision-tree algorithms. Lower computation cost is a generaladvantage of local, greedy search algorithms. However, the solu-tion quality achieved by these algorithms can be greatly degradedif there exists a considerable degree of feature interactions, whichis usually the case for real-world problems. Since GAs can bedesigned to perform a global search for various combinations ofsets of features that improve given optimization criteria, this classof algorithms are expected to cope better with feature interactionproblems.
In addition to several existing results demonstrating the effec-tiveness of using GAs for feature selection [21,22,29], it is alsoappealing to use GA’s straightforward binary coding scheme to des-ignate allele ‘1’ or ‘0’ to represent a feature being selected or not,respectively. Therefore, in this study, we propose to use the GAto search for optimal subsets of features for the SVR-based stockselection model.
Apart from feature selection, we use the RBF kernel function forthe SVR model because it can be used to analyze high dimensionaldata [22,30,31].1 In this case, three free parameters, C, ı2 and ε areto be provided for the SVR model. Notice that for the numericaloptimization and tuning on these parameters, other options maybe preferable to the GA – for instance, ES (Evolution Strategies,especially Evolution Strategy with Covariance Matrix Adaptation[33]), Sequential Parameter Optimization (SPO) [29,34], and Parti-cle Swarm Optimization (PSO) [35].
It is worth mentioning that by translating features into numer-ical values, Lin et al. [36] then used the PSO for numericaloptimization on feature selection and model parameters, simul-taneously. However, with this setup, Lin et al. [36] showed thatthe performance of the PSO-based SVM is similar to that of theGA-based model in the test problems they studied. Apparently,whether it is beneficial to convert the simultaneous optimizationproblem to all numerical (convenient for the PSO search) or all com-binatorial values (convenient for the GA search) remains an openquestion.2 However, as can be seen shortly in our results, featureselection appears to play a more significant role than the parameteroptimization alone, we hereby propose to adopt the GA for the over-
The other reason we chose the Gaussian kernel is that a Gaussian kernel satisfiesMercer’s condition [32], which shall make the system more reliable.
2 According to the No-Free-Lunch theorems [37], one has no guarantee that analgorithm will perform well on a particular problem without tailoring it to thedomain at hand. Therefore, a further study on the characteristics of the stock selec-tion domain shall facilitate the decision for which algorithm to use, and we willleave this as a future research project.
C.-F. Huang / Applied Soft Computing 12 (2012) 807–818 811
osom
citwv
o
e
pEet
y
wepo
c
fi
w
cGmi
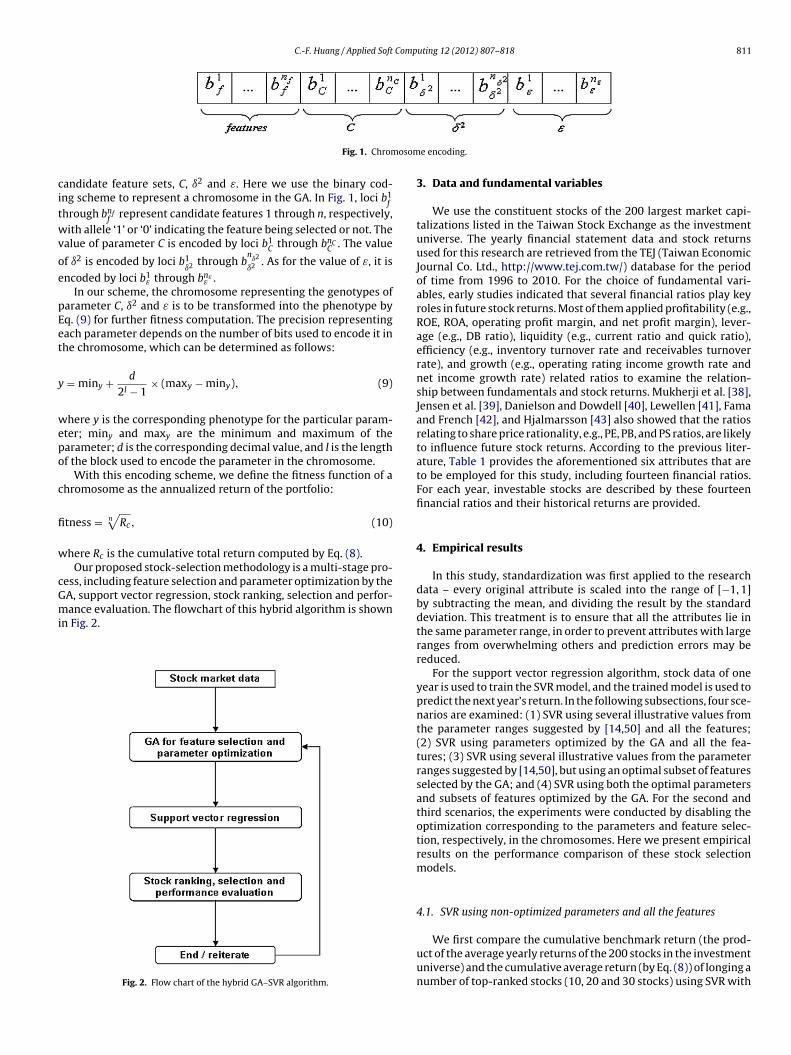
Fig. 1. Chrom
andidate feature sets, C, ı2 and ε. Here we use the binary cod-ng scheme to represent a chromosome in the GA. In Fig. 1, loci b1
f
hrough bnff
represent candidate features 1 through n, respectively,ith allele ‘1’ or ‘0’ indicating the feature being selected or not. The
alue of parameter C is encoded by loci b1C through bnC
C . The value
f ı2 is encoded by loci b1ı2 through b
nı2
ı2 . As for the value of ε, it is
ncoded by loci b1ε through bnε
ε .In our scheme, the chromosome representing the genotypes of
arameter C, ı2 and ε is to be transformed into the phenotype byq. (9) for further fitness computation. The precision representingach parameter depends on the number of bits used to encode it inhe chromosome, which can be determined as follows:
= miny + d
2l − 1× (maxy − miny), (9)
here y is the corresponding phenotype for the particular param-ter; miny and maxy are the minimum and maximum of thearameter; d is the corresponding decimal value, and l is the lengthf the block used to encode the parameter in the chromosome.
With this encoding scheme, we define the fitness function of ahromosome as the annualized return of the portfolio:
tness = n√
Rc, (10)
here Rc is the cumulative total return computed by Eq. (8).Our proposed stock-selection methodology is a multi-stage pro-
ess, including feature selection and parameter optimization by the
A, support vector regression, stock ranking, selection and perfor-ance evaluation. The flowchart of this hybrid algorithm is shownn Fig. 2.
Fig. 2. Flow chart of the hybrid GA–SVR algorithm.
e encoding.
3. Data and fundamental variables
We use the constituent stocks of the 200 largest market capi-talizations listed in the Taiwan Stock Exchange as the investmentuniverse. The yearly financial statement data and stock returnsused for this research are retrieved from the TEJ (Taiwan EconomicJournal Co. Ltd., http://www.tej.com.tw/) database for the periodof time from 1996 to 2010. For the choice of fundamental vari-ables, early studies indicated that several financial ratios play keyroles in future stock returns. Most of them applied profitability (e.g.,ROE, ROA, operating profit margin, and net profit margin), lever-age (e.g., DB ratio), liquidity (e.g., current ratio and quick ratio),efficiency (e.g., inventory turnover rate and receivables turnoverrate), and growth (e.g., operating rating income growth rate andnet income growth rate) related ratios to examine the relation-ship between fundamentals and stock returns. Mukherji et al. [38],Jensen et al. [39], Danielson and Dowdell [40], Lewellen [41], Famaand French [42], and Hjalmarsson [43] also showed that the ratiosrelating to share price rationality, e.g., PE, PB, and PS ratios, are likelyto influence future stock returns. According to the previous liter-ature, Table 1 provides the aforementioned six attributes that areto be employed for this study, including fourteen financial ratios.For each year, investable stocks are described by these fourteenfinancial ratios and their historical returns are provided.
4. Empirical results
In this study, standardization was first applied to the researchdata – every original attribute is scaled into the range of [−1, 1]by subtracting the mean, and dividing the result by the standarddeviation. This treatment is to ensure that all the attributes lie inthe same parameter range, in order to prevent attributes with largeranges from overwhelming others and prediction errors may bereduced.
For the support vector regression algorithm, stock data of oneyear is used to train the SVR model, and the trained model is used topredict the next year’s return. In the following subsections, four sce-narios are examined: (1) SVR using several illustrative values fromthe parameter ranges suggested by [14,50] and all the features;(2) SVR using parameters optimized by the GA and all the fea-tures; (3) SVR using several illustrative values from the parameterranges suggested by [14,50], but using an optimal subset of featuresselected by the GA; and (4) SVR using both the optimal parametersand subsets of features optimized by the GA. For the second andthird scenarios, the experiments were conducted by disabling theoptimization corresponding to the parameters and feature selec-tion, respectively, in the chromosomes. Here we present empiricalresults on the performance comparison of these stock selectionmodels.
4.1. SVR using non-optimized parameters and all the features
We first compare the cumulative benchmark return (the prod-uct of the average yearly returns of the 200 stocks in the investmentuniverse) and the cumulative average return (by Eq. (8)) of longing anumber of top-ranked stocks (10, 20 and 30 stocks) using SVR with

812 C.-F. Huang / Applied Soft Computing 12 (2012) 807–818
Table 1Attributes used in the stock selection model.
Attribute Ratios Description Refs.
Share price rationality(1) PE ratio Price-to-earnings ratio = share price/earnings
per share[38,40,41,43]
(2) PB ratio Price-to-book ratio = share price/book valueper share
[38–42]
(3) PS Ratio Price-to-sales ratio = share price/sales per share [38]
Profitability
(4) ROE Return on equity (after tax) = net income aftertax/shareholders’ equity
[44,45]
(5) ROA Return on asset (after tax) = net income aftertax/total assets
[44]
(6) OPM Operating profit margin = operatingincome/net sales
[46]
(7) NPM Net profit margin = net income after tax/netsales
[45]
Leverage (8) DE ratio Debt-to-equity ratio = totalliabilities/shareholders’ equity
[44]
Liquidity(9) CR Current ratio = current assets/current liabilities [44](10) QR Quick ratio = quick assets/current liabilities [44]
Efficiency(11) ITR Inventory turnover rate = cost of goods
sold/average inventory[44]
(12) RTR Receivables turnover rate = net creditsales/average accounts receivable
[47]
Growth(13) OIG Operating income growth rate = (operating
income at the current year −operating incomeat the previous year)/operating income at theprevious year
[48]
(14) NIG Net income growth rate = (net income after taxat ththe
prev
[49]
Ff
tf1Cptam
i
t
4.2. SVR using optimized parameters and all the features
The results just presented reveal the necessity of a comprehen-sive study on the optimization of our stock selection model. We
ig. 3. Cumulative returns of benchmark vs longing top-ranked stocks by the SVRor (C, ı2) = (25, 25).
he Gaussian radial basis function.3 As an illustration, we examineour combinations of (C, ı2) = (25, 25), (25, 100), (100, 25), (100,00) and ε = 0.1 as the model parameters to the SVR. The values of
and ı2 are chosen from the potentially beneficial range of the SVRarameters suggested by [14,50].4 Figs. 3 and 4 show the results for
he cases of (C, ı2) = (25, 25) and (25, 100), respectively. In Fig. 3,s can be seen, longing 20 and 30 stocks outperform the bench-ark at the end of year 2010, whereas as shown in Fig. 4, longing3 “Longing” is a term used in Finance. In this study, “longing” a stock means buyingt and also keeping it for another year.
4 The value of ε used here is merely for the illustrative purpose. Further results ofhe optimization on C, ı2 and ε will be shown in the following subsections.
e current year − net income after tax atprevious year)/net income after tax at theious year
10, 20 and 30 stocks all outperform the benchmark. Figs. 5 and 6show the results for the cases of (C, ı2) = (100, 25) and (100, 100),respectively. In Fig. 5, longing 20 and 30 stocks still outperform thebenchmark at the end of year 2010. In Fig. 6, longing 10, 20 and 30stocks all outperform the benchmark again. These figures thus showthat the portfolios constructed by the SVR (without any optimiza-tion on the parameters and sets of features yet) can outperform thebenchmark.
Fig. 4. Cumulative returns of benchmark vs longing top-ranked stocks by the SVRfor (C, ı2) = (25, 100).
C.-F. Huang / Applied Soft Computing 12 (2012) 807–818 813
Fig. 5. Cumulative returns of benchmark vs longing top-ranked stocks by the SVRfor (C, ı2) = (100, 25).
Ff
pitdtcgc
aom
pfi–a[u
geous to stock selection than the optimization of model parametersalone.
ig. 6. Cumulative returns of benchmark vs longing top-ranked stocks by the SVRor (C, ı2) = (100, 100).
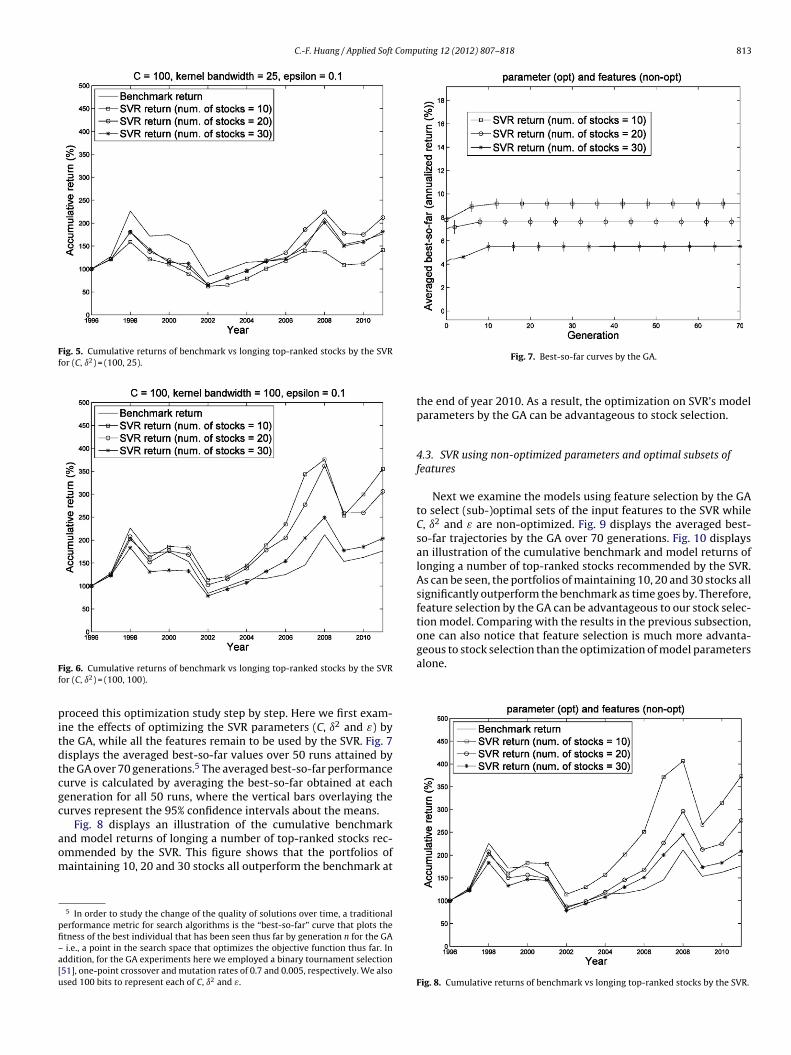
roceed this optimization study step by step. Here we first exam-ne the effects of optimizing the SVR parameters (C, ı2 and ε) byhe GA, while all the features remain to be used by the SVR. Fig. 7isplays the averaged best-so-far values over 50 runs attained byhe GA over 70 generations.5 The averaged best-so-far performanceurve is calculated by averaging the best-so-far obtained at eacheneration for all 50 runs, where the vertical bars overlaying theurves represent the 95% confidence intervals about the means.
Fig. 8 displays an illustration of the cumulative benchmark
nd model returns of longing a number of top-ranked stocks rec-mmended by the SVR. This figure shows that the portfolios ofaintaining 10, 20 and 30 stocks all outperform the benchmark at5 In order to study the change of the quality of solutions over time, a traditionalerformance metric for search algorithms is the “best-so-far” curve that plots thetness of the best individual that has been seen thus far by generation n for the GA
i.e., a point in the search space that optimizes the objective function thus far. Inddition, for the GA experiments here we employed a binary tournament selection51], one-point crossover and mutation rates of 0.7 and 0.005, respectively. We alsosed 100 bits to represent each of C, ı2 and ε.
Fig. 7. Best-so-far curves by the GA.
the end of year 2010. As a result, the optimization on SVR’s modelparameters by the GA can be advantageous to stock selection.
4.3. SVR using non-optimized parameters and optimal subsets offeatures
Next we examine the models using feature selection by the GAto select (sub-)optimal sets of the input features to the SVR whileC, ı2 and ε are non-optimized. Fig. 9 displays the averaged best-so-far trajectories by the GA over 70 generations. Fig. 10 displaysan illustration of the cumulative benchmark and model returns oflonging a number of top-ranked stocks recommended by the SVR.As can be seen, the portfolios of maintaining 10, 20 and 30 stocks allsignificantly outperform the benchmark as time goes by. Therefore,feature selection by the GA can be advantageous to our stock selec-tion model. Comparing with the results in the previous subsection,one can also notice that feature selection is much more advanta-
Fig. 8. Cumulative returns of benchmark vs longing top-ranked stocks by the SVR.

814 C.-F. Huang / Applied Soft Computing 12 (2012) 807–818
4
sbattetmip(
f
4
tdp
F
Fig. 11. Best-so-far curves by the GA.
Fig. 9. Best-so-far curves by the GA..4. SVR using optimized parameters and optimal sets of features
Here we examine the effect of optimized C, ı2, ε as well asubsets of features. Fig. 11 displays the corresponding averagedest-so-far curves. Notice that, for each case in Figs. 9 and 11, theveraged best-so-far curves converged at nearly the same values,hereby indicating the effect of the optimization on model parame-ers is again not as significant as feature selection. However, Fig. 11xhibits slightly larger 95% confidence intervals, implying it is likelyo generate higher annualized returns by the models with opti-
ized parameters. Fig. 12 displays an illustration for this effect,n which the cumulative returns by the models with optimizedarameters are higher than those without optimized parametersin Fig. 10) at the end of 2010.
In order to examine the validity of our proposed methodology,urther statistical tests are presented next.
.4.1. Model validation
In the previous subsections, the models were obtained using allhe financial data available from year 1996 to 2010. In reality, theata is usually divided into two mutually exclusive parts, a trainingart Dr that is used to construct the models, and a testing part Dv
ig. 10. Cumulative returns of benchmark vs longing top-ranked stocks by the SVR.
Fig. 12. Cumulative returns of benchmark vs longing top-ranked stocks by the SVR.
that is used to validate the models. The goal of doing so is to examineif the models learned in the training phase are applicable to thehold-out data samples during the testing phase.
In this study, we split the data into two parts: the data for thefirst n years are used to train the stock selection models and the datafor the remaining years are used to validate the models. As shown
in Table 2, in the first row the gray area indicates the training data(year 1996) and the model learned from this is examined by thetesting data in the black area (year 1997–2010). In the second row,Table 2Model validation: training period (gray) and testing period (black).
N/Y 96 97 98 99 00 01 02 03 04 05 06 07 08 09 10 1 2 3 4 5 6 7 8 9 10 11 12 13 14
C.-F. Huang / Applied Soft Computing 12 (2012) 807–818 815
Table 3Statistics of the benchmark and SVR–GA stock selection models for 10 stocks.
Case index Trainingperiod
Annualizedbenchmarkreturn (%)
Mean ofannualizedmodel return(%)
Variance ofannualizedmodel return(%)
Testingperiod
Annualizedbenchmarkreturn (%)
Mean ofannualizedmodel return(%)
Variance ofannualizedmodel return(%)
1 1 27.2615 61.7676 5.5770 2–15 2.3489 5.2850 7.73162 1–2 50.4192 107.7513 1768.1 3–15 −1.9077 2.9041 22.99123 1–3 19.7369 41.7102 261.3085 4–15 0.2147 4.5146 37.34094 1–4 14.9839 39.6706 229.5432 5–15 0.0694 6.0917 25.34875 1–5 8.9005 24.9487 67.3695 6–15 1.4078 7.3426 19.75756 1–6 −2.8317 14.0150 49.0752 7–15 8.5513 13.6560 28.48097 1–7 −0.1497 19.5937 102.3874 8–15 7.4737 16.0384 26.69168 1–8 1.7285 24.4311 67.8455 9–15 6.3206 14.4583 18.54639 1–9 1.7348 29.2812 53.8386 10–15 7.0959 10.4337 12.8360
10 1–10 2.2505 29.7401 56.8345 11–15 7.1129 5.8753 19.969311 1–11 3.4922 33.5983 52.1087 12–15 4.8263 −1.6058 2.726912 1–12 6.4443 30.1030 52.3017 13–15 −5.9271 −5.4475 5.500013 1–13 3.3426 23.7139 29.7553 14–15 7.1805 14.0516 21.584814 1–14 3.5111 21.5515 35.0980 15 8.6541 22.1951 51.9317
Table 4Statistics of the benchmark and SVR–GA stock selection models for 20 stocks.
Case index Training period Annualizedbenchmarkreturn (%)
Mean ofannualizedmodel return(%)
Variance ofannualizedmodel return(%)
Testingperiod
Annualizedbenchmarkreturn (%)
Mean ofannualizedmodel return(%)
Variance ofannualizedmodel return(%)
1 1 27.2615 49.2870 9.9148 2–15 2.3489 7.7781 4.76132 1–2 50.4192 120.1057 213.0099 3–15 −1.9077 7.8102 6.51073 1–3 19.7369 49.2441 78.2888 4–15 0.2147 7.9523 9.40304 1–4 14.9839 46.0218 76.8551 5–15 0.0694 8.0555 10.79925 1–5 8.9005 26.5578 18.6353 6–15 1.4078 9.0566 19.18456 1–6 −2.8317 14.6168 20.4075 7–15 8.5513 17.5293 17.26207 1–7 −0.1497 22.6957 22.4438 8–15 7.4737 17.5719 1.67938 1–8 1.7285 24.4411 31.5812 9–15 6.3206 14.3132 4.63299 1–9 1.7348 26.7380 16.4054 10–15 7.0959 10.9044 3.0459
10 1–10 2.2505 26.4249 11.8420 11–15 7.1129 9.1535 4.538011 1–11 3.4922 28.9976 7.4316 12–15 4.8263 1.0441 1.2721
451
925
46
tf
viiswh
TS
12 1–12 6.4443 27.6245 13.813 1–13 3.3426 22.2604 10.714 1–14 3.5111 21.2373 6.84
he training data is from year 1996 to 1997, and the testing data isrom year 1998 to 2010, and so on.
Notice that this setup is different from the regular cross-alidation procedure where the process of data being split into twondependent sets is randomly repeated several times without tak-
ng into account the data’s temporal order. However, in the stockelection study here, temporal order is critical as practically oneould like to use all available data so far to train the model andope to apply the models in the future to gain real profits.able 5tatistics of the benchmark and SVR–GA stock selection models for 30 stocks.
Case index Trainingperiod
Annualizedbenchmarkreturn (%)
Mean ofannualizedmodel return(%)
Variance ofannualizedmodel retur(%)
1 1 27.2615 44.8906 1.7525
2 1–2 50.4192 104.7810 40.3210
3 1–3 19.7369 50.4839 11.3351
4 1–4 14.9839 48.0834 19.9948
5 1–5 8.9005 28.2866 10.9252
6 1–6 −2.8317 16.4473 16.2906
7 1–7 −0.1497 21.3169 4.2989
8 1–8 1.7285 23.5317 8.5510
9 1–9 1.7348 24.5284 7.0644
10 1–10 2.2505 23.9266 2.8914
11 1–11 3.4922 24.9979 1.5967
12 1–12 6.4443 24.4613 3.8801
12 1–13 3.3426 19.6302 1.6463
14 1–14 3.5111 18.0476 1.9504
13–15 −5.9271 −4.6934 2.762214–15 7.1805 8.7823 9.846415 8.6541 12.0599 20.1834
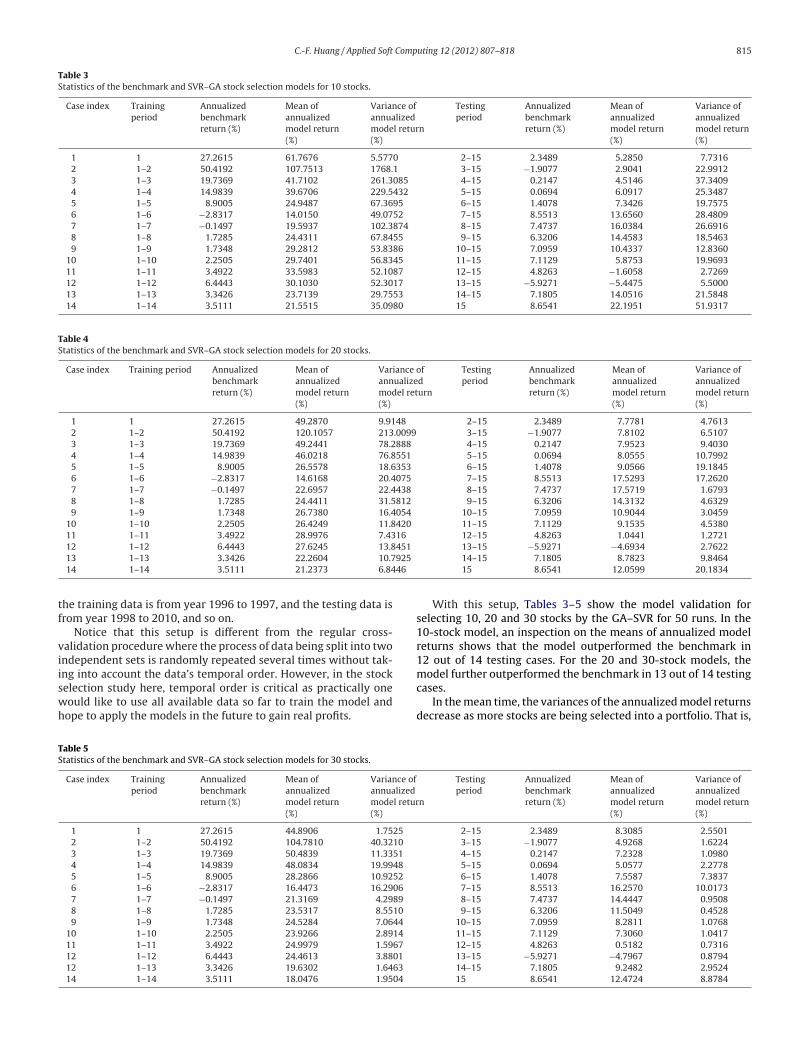
With this setup, Tables 3–5 show the model validation forselecting 10, 20 and 30 stocks by the GA–SVR for 50 runs. In the10-stock model, an inspection on the means of annualized modelreturns shows that the model outperformed the benchmark in12 out of 14 testing cases. For the 20 and 30-stock models, the
model further outperformed the benchmark in 13 out of 14 testingcases.In the mean time, the variances of the annualized model returnsdecrease as more stocks are being selected into a portfolio. That is,
n
Testingperiod
Annualizedbenchmarkreturn (%)
Mean ofannualizedmodel return(%)
Variance ofannualizedmodel return(%)
2–15 2.3489 8.3085 2.55013–15 −1.9077 4.9268 1.62244–15 0.2147 7.2328 1.09805–15 0.0694 5.0577 2.27786–15 1.4078 7.5587 7.38377–15 8.5513 16.2570 10.01738–15 7.4737 14.4447 0.95089–15 6.3206 11.5049 0.4528
10–15 7.0959 8.2811 1.076811–15 7.1129 7.3060 1.041712–15 4.8263 0.5182 0.731613–15 −5.9271 −4.7967 0.879414–15 7.1805 9.2482 2.952415 8.6541 12.4724 8.8784

816 C.-F. Huang / Applied Soft Computing 12 (2012) 807–818
−20
0
20
40
60
1413121110987654321
Num. of stocks = 10
−20
0
20
40
60
1413121110987654321
Num. of stocks = 20A
nnua
lized
mod
el r
etur
n (%
)
−20
0
20
40
60
1413121110987654321
Case index
Num. of stocks = 30
Fig. 13. Box plots for the annualized model returns.
Fig. 14. Ratios of features being selected.
Table 6Distributions of TP, FP, TN, FN for the 30-stock model.
Case index
1 2 3 4 5 6 7 8 9 10 11 12 13 14
TP 50 50 50 50 49 48 50 50 46 32 0 47 43 48FP 0 0 0 0 1 2 0 0 4 18 50 3 7 2
TN 50 50 50 50 49 48 50FN 0 0 0 0 1 2 0
50 48 43 0 47 43 480 2 7 50 3 7 2

C.-F. Huang / Applied Soft Comp
Table 7Accuracy and precision for the 10, 20 and 30-stock models.
10-stock model 20-stock model 30-stock model
so
tpatvm
binsttsfit
m
A
P
pnstdfat
Tcadpstw
ste
5
so
t
Accuracy 0.800 0.8907 0.8850Precision 0.7671 0.8871 0.8757
electing 30 stocks apparently yields more consistent performancen the model return than the 10 and 20-stock cases do.
Here we also provide Fig. 13 to visualize the results of Tables 3–5hrough three diagrams – each of them shows a series of 14 boxlots, where x and y-axis designate the case index and the annu-lized model return, respectively. Each box plot is generated forhe corresponding 50-run GA–SVR model. These plots thus offer aisual gist on the spread of the model returns, and clearly selectingore stocks tends to reduce the variation in model returns.Furthermore, it is worthwhile to investigate which features have
een selected by the GA since such findings shall be important fornvestment in practice. Here we display in Fig. 14 the ratio of theumber of times a feature being selected to the total of 700 modelstudied.6 As can be seen, the results are fairly consistent over thehree scenarios. Especially in the 20 and 30-stock cases, among allhe features, feature 2 (PB ratio) and feature 5 (ROA) appear beingelected most times, indicating that the GA is able to consistentlynd similar subsets of significant features for the construction ofhe models.
Finally, we examine the accuracy and precision of our proposedodel, where the accuracy and precision are defined as
ccuracy = TP + TN
TP + TN + FP + FN,
recision = TP
TP + FP, respectively.
In these two definitions, TP and TN denote the number of trueositives and true negatives, respectively. FP and FN denote theumber of false positives and false negatives, respectively. In thistudy, a true positive occurs when the annualized model return (i.e.,he annualized average return of the stocks selected by the model)oes outperform the benchmark; otherwise, the model generates aalse positive. Analogously, a true negative occurs when the annu-lized average return of the unselected stocks does underperformhe benchmark; otherwise, the model generates a false negative.
As an illustration, Table 6 displays the distributions of TP, FP,N and FN over the 14 testing cases for the 30-stock model. Onean notice that, in case 11, the model generated all false positivesnd negatives; and there are also 18 false positives in case 10. Ouretailed inspection indicates that this is mainly because the sup-ort vectors acquired in the training phase failed to capture theeemingly distinct characteristics of the bear-market induced byhe financial crisis in 2007–2009; as a consequence, the SVR modelas not able to recommend winning stocks successfully.
In Table 7, we summarize the results of the accuracy and preci-ion calculated for the 10, 20 and 30-stock models, which appearo be satisfactory. Thus all the results so far provide promisingvidence for the effectiveness of our proposed methodology.
. Conclusions
In this paper we presented a hybrid GA–SVR model for stockelection. The SVR method was used to generate predicted returnsn a collective of stocks, which in turn served as surrogates of
6 We studied 50 GA models for each of the 14 cases; thus there are 700 models inotal.
[
[
[
uting 12 (2012) 807–818 817
the actual returns for stock rankings. Top-ranked stocks are thenselected as components in a portfolio. On top of this model, theGA was employed for feature selection and optimization of modelparameters. We have evaluated our GA–SVR models statisticallyand validated the effectiveness of this method by comparing withthe benchmark.
In this study, we have shown that feature selection can shedlight on which features play more important roles in our proposedmodel. Interestingly, the results also showed that, in this particularapplication, the contribution of feature selection to effective stockselection appear to be more significant than that of the optimiza-tion on the model parameters alone. This work again highlightsthe crucial importance of feature selection in complex real-worldproblems, such as the stock selection problem studied here.
Overall, the empirical results showed that the investmentreturns provided by our proposed model can significantly outper-form the benchmark. Therefore, we expect this hybrid GA–SVRmethodology to advance the research in computational finance andprovide a promising solution to stock selection in practice. In thefuture, a plausible research direction is to employ more advancedSVR models to investigate how performance of stock selectioncan be further improved. In addition, because investment returnand risk management appear to be two distinct objectives, in thefuture work, we expect that a study for simultaneous optimiza-tion on these multi-objectives is also a promising research subjectto explore. Finally, we intend to conduct a further study on thecharacteristics of the stock selection domain to determine whichalgorithms, including ES, PSO or GA, shall be most fruitful for theoptimization on our proposed work.
Acknowledgements
This work is fully supported by the National Science Council,Taiwan, Republic of China, under grant number NSC 99-2221-E-390-032. The author would also like to thank Prof. Chih-HsiangChang for his generosity in providing the financial data.
References
[1] A. Mochón, D. Quintana, Y. Sáez, Soft computing techniques applied to finance,Applied Intelligence 9 (2) (2008) 111–115.
[2] D. Zhang, L. Zhou, Discovering golden nuggets: data mining in financial applica-tion, IEEE Transactions on Systems, Man, and Cybernetics—Part C: Applicationsand Review 34 (4) (2004) 513–522.
[3] K.K. Lai, L. Yu, S. Wang, C. Zhou, A double-stage genetic optimization algorithmfor portfolio selection, in: Proceedings of the 13th International Conference onNeural Information Processing, 2006, pp. 928–937.
[4] T.C. Chu, C.T. Tsao, Y.R. Shiue, Application of fuzzy multiple attribute decisionmaking on company analysis for stock selection, in: Proceedings of Soft Com-puting on Intelligent Systems and Information Processing, 1996, pp. 509–514.
[5] M.R. Zargham, M.R. Sayeh, A web-based information system for stock selectionand evaluation, in: Proceedings of the First International Workshop on AdvanceIssues of E-Commerce and Web-Based Information Systems, 1999, pp. 81–83.
[6] T.-S. Quah, B. Srinivasan, Improving returns on stock investment through neuralnetwork selection, Expert Systems with Applications 17 (1999) 295–301.
[7] N. Chapados, Y. Bengio, Cost functions and model combination for VaR-basedasset allocation using neural networks, IEEE Transactions on Neural Networks12 (2001) 890–906.
[8] K.-J. Kim, I. Han, Genetic algorithms approach to feature discretization in arti-ficial neural networks for the prediction of stock price index, Expert Systemswith Applications 19 (2000) 125–132.
[9] M. Caplan, Y. Becker, Lessons learned using genetic programming in a stockpicking context, in: U.-M. O’Reilly, T. Yu, R. Riolo, B. Worzel (Eds.), GeneticProgramming Theory and Practice II, Springer, Ann Arbor, MI, 2004, pp. 87–102,Chapter 6.
10] Y. Becker, P. Fei, A. Lester, Stock selection – an innovative application of geneticprogramming methodology, in: R. Riolo, T. Soule, B. Worzel (Eds.), Genetic Pro-gramming Theory and Practice IV, Genetic and Evolutionary Computation, vol.5, Springer, Ann Arbor, MI, 2006, pp. 315–334, Chapter 12.
11] V.N. Vapnik, The Nature of Statistical Learning Theory, Springer-Verlag, NewYork, 1995.
12] N.I. Sapankevych, R. Sankar, Time series prediction using support vectormachines: a survey, IEEE Computational Intelligence Magazine 4 (2) (2009)24–38.
8 Comp
[
[
[
[
[
[
[
[
[
[
[
[
[
[
[
[
[
[
[
[
[
[
[
[
[
[
[
[
[
[
[
[
[
[
[
[
[
18 C.-F. Huang / Applied Soft
13] J.H. Min, Y.-C. Lee, Bankruptcy prediction using support vector machine withoptimal choice of kernel function parameters, Expert Systems with Applica-tions 28 (4) (2005) 603–614.
14] K.-J. Kim, Financial time series forecasting using support vector machines, Neu-rocomputing 55 (2003) 307–319.
15] W. Huang, Y. Nakamori, S.Y. Wang, Forecasting stock market movement direc-tion with support vector machine, Computers and Operations Research 32(2005) 2513–2522.
16] C.-L. Huang, C.-Y. Tsai, A hybrid SOFM-SVR with a filter-based feature selec-tion for stock market forecasting, Expert Systems with Applications 36 (2009)1529–1539.
17] M.C. Lee, Using support vector machine with a hybrid feature selection methodto the stock trend prediction, Expert Systems with Applications 36 (2009)10896–10904.
18] D.Y. Chiu, P.J. Chen, Dynamically exploring internal mechanism of stock mar-ket by fuzzy-based support vector machines with high dimension inputspace and genetic algorithm, Expert Systems with Applications 36 (2009)1240–1248.
19] A. Fan, M. Palaniswami, Stock selection using support vector machines, in: Pro-ceedings of the International Joint Conference on Neural Networks 3, 2001, pp.1793–1798.
20] J. Yang, V. Honavar, Feature subset selection using a genetic algorithm, IEEEIntelligent Systems 13 (2) (1998) 44–49.
21] H. Fröhlich, O. Chapelle, B. Schölkopf, Feature selection for support vec-tor machines by means of genetic algorithms, in: Proceedings of the 15thIEEE International Conference on Tools with Artificial Intelligence, 2003, pp.142–148.
22] C.-L. Huang, C.-J. Wang, A GA-based feature selection and parameters optimiza-tion for support vector machines, Expert Systems with Applications 31 (2006)231–240.
23] S. Hettich, C.L. Blake, C.J. Merz, UCI Repository of Machine Learning Databases,Department of Information and Computer Science, University of California,Irvine, CA, 1998, http://archive.ics.uci.edu/ml/.
24] G. John, R. Kohavi, K. Peger, Irrelevant features and the subset selection prob-lem, in: Proceedings of the 11th International Conference on Machine Learning,1994, pp. 121–129.
25] R. Kohavi, G. John, Wrappers for feature subset selection, Artificial Intelligence97 (1–2) (1997) 273–324.
26] I.H. Witten, E. Frank, Data Mining: Practical Machine Learning Tools and Tech-niques, 2nd edition, Morgan Kaufmann, San Francisco, 2005.
27] H. Drucker, C.J.C. Burges, L. Kaufman, A. Smola, V. Vapnik, Support vector regres-sion machines, Advances in Neural Information Processing Systems 9 (1996)155–161.
28] J.H. Holland, Adaptation in Natural and Artificial Systems, University of Michi-gan Press, Ann Arbor, MI, 1975.
29] W. Konen, P. Koch, O. Flasch, T. Bartz-Beielstein, M. Friese, B. Naujoks, TunedData Mining: A Benchmark Study on Different Tuners, Cologne University of
Applied Sciences, CIOP Technical Report 03/11 (2011).30] C.W. Hsu, C.C. Chang, C.J. Lin, A practical guide to support vectorclassification, technical report, Department of Computer Science andInformation Engineering, National Taiwan University, 2003. Available at:http://www.csie.ntu.edu.tw/∼cjlin/papers/guide/guide.pdf.
[
[
uting 12 (2012) 807–818
31] H.T. Lin, C.J. Lin, A study on sigmoid kernels for SVM and the training of non-PSD kernels by SMO-type methods, technical report, Department of ComputerScience and Information Engineering, National Taiwan University (2003). Avail-able at: http://www.csie.ntu.edu.tw/∼cjlin/papers/tanh.pdf.
32] S. Qiu, T. Lane, Parallel computation of RBF kernels for support vector classi-fiers, in: Proceedings of the 5th SIAM International Conference on Data Mining(SDM05), 2005, pp. 334–345.
33] N. Hansen, S.D. Müller, P. Koumoutsakos, Reducing the time complexity of thederandomized evolution strategy with covariance matrix adaptation (CMA-ES),Evolutionary Computation 11 (1) (2003) 1–18.
34] T. Bartz-Beielstein, C. Lasarczyk, M. Preuß, Sequential parameter optimization,in: Proceedings of the 2005 Congress on Evolutionary Computation (1), 2005,pp. 773–780.
35] J. Kennedy, R.C. Eberhart, Particle swarm optimization, in: Proceedings of theIEEE International Conf. on Neural Networks, 1995, pp. 1942–1948.
36] S.-W. Lin, K.-C. Ying, S.-C. Chen, Z.-J. Lee, Particle swarm optimization for param-eter determination and feature selection of support vector machines, ExpertSystems with Applications 35 (2008) 1817–1824.
37] D.H. Wolpert, W.G. Macready, No free lunch theorems for optimization, Evolu-tionary Computation 1 (April) (1997) 67–82.
38] S. Mukherji, M.S. Dhatt, Y.H. Kim, A fundamental analysis of Korean stockreturns, Financial Analysts Journal 53 (3) (1997) 75–80.
39] G.R. Jensen, R.R. Johnson, J.M. Mercer, New evidence on size and price-to-bookeffects in stock returns, Financial Analysts Journal 53 (6) (1997) 34–42.
40] M.G. Danielson, T.D. Dowdell, The return-stages valuation model and the expec-tations within a firm’s P/B and P/E ratios, Financial Management 30 (2) (2001)93–124.
41] J. Lewellen, Predicting returns with financial ratio, Journal of Financial Eco-nomics 74 (2) (2004) 209–235.
42] E.F. Fama, K.R. French, Average returns, B/M, and share issue, Journal of Finance63 (6) (2008) 2971–2995.
43] E. Hjalmarsson, Predicting global stock returns, Journal of Financial and Quan-titative Analysis 45 (1) (2010) 49–80.
44] M. Omran, Linear versus non-linear relationships between financial ratios andstock returns: empirical evidence from Egyptian firms, Review of Accountingand Finance 3 (2) (2004) 84–102.
45] R. Bauer, N. Guenster, R. Otten, Empirical evidence on corporate governancein Europe: the effect on stock returns, firm value and performance, Journal ofAsset Management 5 (2) (2004) 91–104.
46] M.T. Soliman, The use of DuPont analysis by market participants, AccountingReview 83 (3) (2008) 823–853.
47] T.A. Carnes, Unexpected changes in quarterly financial-statement line itemsand their relationship to stock prices, Academy of Accounting and FinancialStudies Journal 10 (3) (2006) 99–116.
48] D. Ikenberry, J. Lakonishok, Corporate governance through the proxy contest:evidence and implications, Journal of Business 66 (3) (1993) 405–435.
49] G. Sadka, R. Sadka, Predictability and the earnings–returns relation, Journal of
Financial Economics 94 (1) (2009) 87–93.50] F.E.H. Tay, L. Cao, Application of support vector machines in financial time seriesforecasting, Omega 29 (2001) 309–317.
51] D.E. Goldberg, K. Deb, A comparative analysis of selection schemes used ingenetic algorithms, Foundation of Genetic Algorithms (1991) 69–93.


![Research Article A Genetic Algorithm Based Support Vector ...downloads.hindawi.com › journals › bmri › 2015 › 292683.pdfGenetic Algorithms. Genetic algorithms (GA) [ ]are stochastic](https://img.pdfslide.us/doc/110x75/5f0497197e708231d40eb947/research-article-a-genetic-algorithm-based-support-vector-a-journals-a-bmri.jpg)


![Manufacturing Dispatching using Reinforcement and Transfer … · Vector Machines [24], etc. Genetic algorithms (GA) and Genetic Programming (GP) are evolutionary computation methods](https://img.pdfslide.us/doc/110x75/5f2ee6cb3215b2471220bddc/manufacturing-dispatching-using-reinforcement-and-transfer-vector-machines-24.jpg)