Embed Size (px)
Citation preview
Abstract
The existing flood control dam at Canton, OK, is being upgraded with an auxiliary spillway to enable it to
safely pass the new Probable Maximum Flood (PMF). The auxiliary spillway weir will be equipped with
Fusegates, which will tip individually at predetermined water elevations to release flood water as
needed. The service and auxiliary spillways together must be able to discharge a PMF of 17,000m3/s
without overtopping the dam. To facilitate this, a hybrid numerical and physical hydraulic model study
of the spillway system was conducted at Alden Research Laboratory.
First, a numerical model study was carried out for various approach geometry designs to investigate
approach flow patterns, resulting water surface elevations throughout the reservoir and spillways, as
well as flow rate splits between the two spillways. Based on the CFD results, a favorable design was
selected, constructed and tested in a large-scale 1:54 scale topographic physical model. The advantage
of this hybrid, integrated numerical and physical modeling approach is that each model can be used
where it has its strengths: Numerous modifications of the approach channel geometry were made in a
cost-effective way in the numerical model. The large-scale physical model was then used to validate the
numerical results, for final modifications that brought the maximum reservoir elevation at PMF to within
acceptable levels, to obtain the spillway rating curves and for Fusegate-specific tests.
Introduction
Hydrological information was comparatively limited when dams were designed and built in the first half
of the 20th century. Throughout the 1960s, spillways were sized using the Spillway Design Flood (SDF),
which is calculated by transposing an actual storm that occurred nearby and centering it over the
reservoir under consideration. Since the 1970s, the SDF criteria has been replaced by the probable
maximum flood (PMF), which is the flood that may be expected from the most severe combination of
critical meteorological and hydrological conditions that are reasonably possible in the region. As more
long-term hydrological data is gathered and processed, the inflow design flood (IDF) used for many
existing dams and spillways is being reviewed, usually resulting in an increase and creating new dam
safety challenges. Under an increased IDF, insufficient discharge capacity or undesirable performance of
spillways can potentially result in dam failure.
A Hybrid Numerical and Physical Hydraulic Model Study of the Canton Dam Spillway System
Martin Wosnik1,2, Songheng Li1, Christopher Miller1, Russell Wyckhoff3, Hasan Kocahan4, Dan Gessler1, Stuart Cain1 1Alden Research Laboratory, Holden, MA 01520, USA 2Department of Mechanical Engineering, University of New Hampshire, Durham, NH 03824, USA 3U.S. Army Corps of Engineers, Tulsa District, Tulsa, OK 74128, USA 4Hydroplus Inc., Falls Church, VA 22041, USA
Physical scale models have been used to simulate and study the behavior of hydraulic structures and
projects for over 100 years. Physical modeling is a mature, proven tool and its results are used with high
confidence. With the availability of powerful computational fluid dynamics (CFD) codes and advances in
computer technology, numerical modeling/CFD can now be effectively included in the design process of
hydraulic structures. One of the primary functions of either type of modeling is to test design
alternatives. Which of the two tools is faster and cheaper depends on the specific project, the extent of
modifications between design alternatives and the answers sought. Some modeling requirements
cannot be met by CFD at this stage, or would be prohibitively costly, such as simulating the tipping of
Fusegates at predetermined water levels, navigation or air entrainment due to free surface vortices. In
many situations numerical models require validation by physical models, for example when evaluating
complex hydraulic conditions or a non-standard design, or when there is high risk such as in dam safety.
Often a hybrid, integrated approach that combines physical and CFD modeling is the most effective. CFD
modeling is typically employed early in the modeling process to evaluate design alternatives. The
physical model is then used to validate the CFD results, establish experimental spillway rating curves and
conduct aspects of a hydraulic model study that would not be cost-effective in a numerical model. While
CFD modeling after careful validation can be a cost-effective and reliable tool, it cannot be considered a
complete replacement of physical modeling. Hydrodynamic characteristics of flow over spillways have
been systematically investigated since the late 1950s at the US Army Corps of Engineers (USACE)
Waterways Experiment Station (WES) using physical models (USACE WES 1977). To this day, hydraulic
engineers still benefit from a series of design charts developed from physical models of spillway designs.
More recently, researchers have begun to use CFD for simulations of spillway flows. (for example Savage
and Johnson 2001, Ho et al 2006, Chanel and Doering 2008, Song and Zhou 1999, Cagri et al. 2008, Lee
et al. 2008).
Canton Dam Spillway System
Canton Dam is located in western Oklahoma on the North Canadian River, approximately 75 miles
northwest of Oklahoma City. It was constructed under the Flood Control Act and completed in 1948.
Canton Dam was built with one service spillway equipped with 16 Tainter gates and three outlet works
with a total discharge capacity of 9,970m3/s, which is inadequate to safely pass the revised reservoir
inflow PMF of 17,950m3/s (Figure 1). The US Army Corps of Engineers (USACE) decided to add a 146.3 m
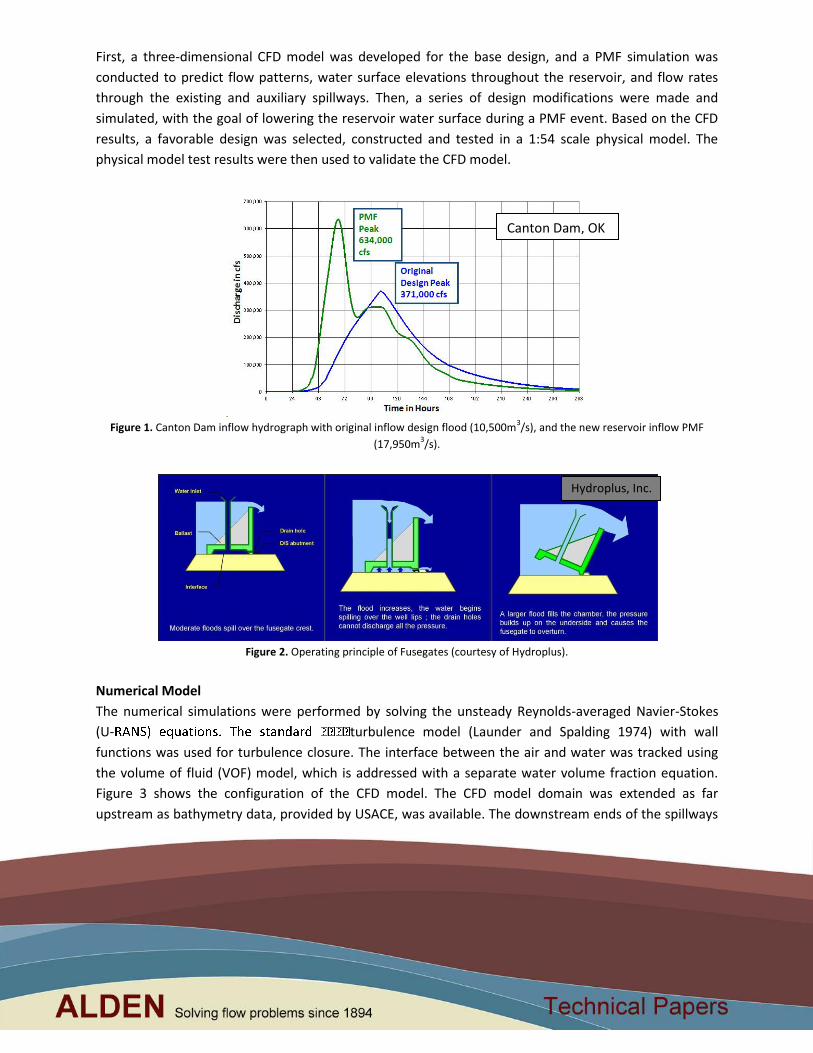
wide auxiliary spillway, equipped with a broad-crested weir on which 9 Fusegates will be placed.
Fusegates, designed by Hydroplus, tip individually when a chamber underneath each block is flooded at
a predetermined water elevation and release flood water as needed. The operating principle is
illustrated in Figure 2. In order to improve the design of the auxiliary spillway, an integrated model study
approach by combining CFD and a physical model was proposed by Alden.
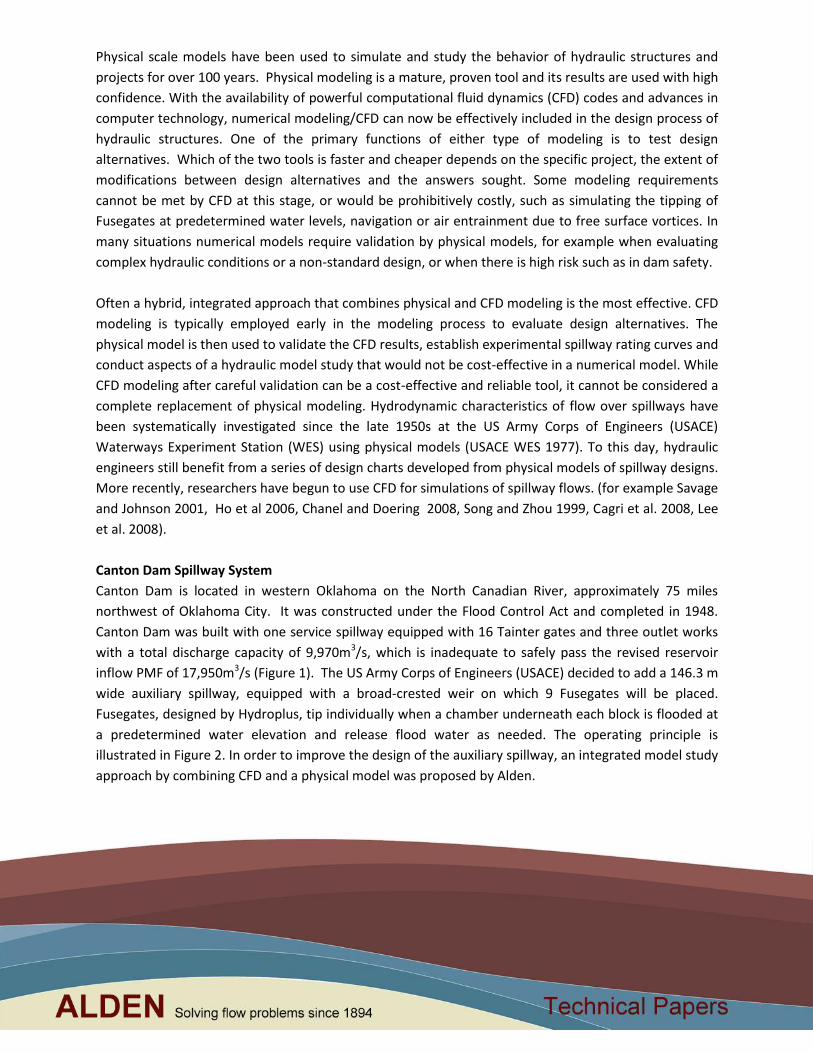
First, a three-dimensional CFD model was developed for the base design, and a PMF simulation was
conducted to predict flow patterns, water surface elevations throughout the reservoir, and flow rates
through the existing and auxiliary spillways. Then, a series of design modifications were made and
simulated, with the goal of lowering the reservoir water surface during a PMF event. Based on the CFD
results, a favorable design was selected, constructed and tested in a 1:54 scale physical model. The
physical model test results were then used to validate the CFD model.
Figure 1. Canton Dam inflow hydrograph with original inflow design flood (10,500m
3/s), and the new reservoir inflow PMF
(17,950m3/s).
Figure 2. Operating principle of Fusegates (courtesy of Hydroplus).
Numerical Model
The numerical simulations were performed by solving the unsteady Reynolds-averaged Navier-Stokes
(U- turbulence model (Launder and Spalding 1974) with wall
functions was used for turbulence closure. The interface between the air and water was tracked using
the volume of fluid (VOF) model, which is addressed with a separate water volume fraction equation.
Figure 3 shows the configuration of the CFD model. The CFD model domain was extended as far
upstream as bathymetry data, provided by USACE, was available. The downstream ends of the spillways
Canton Dam, OK
Hydroplus, Inc.
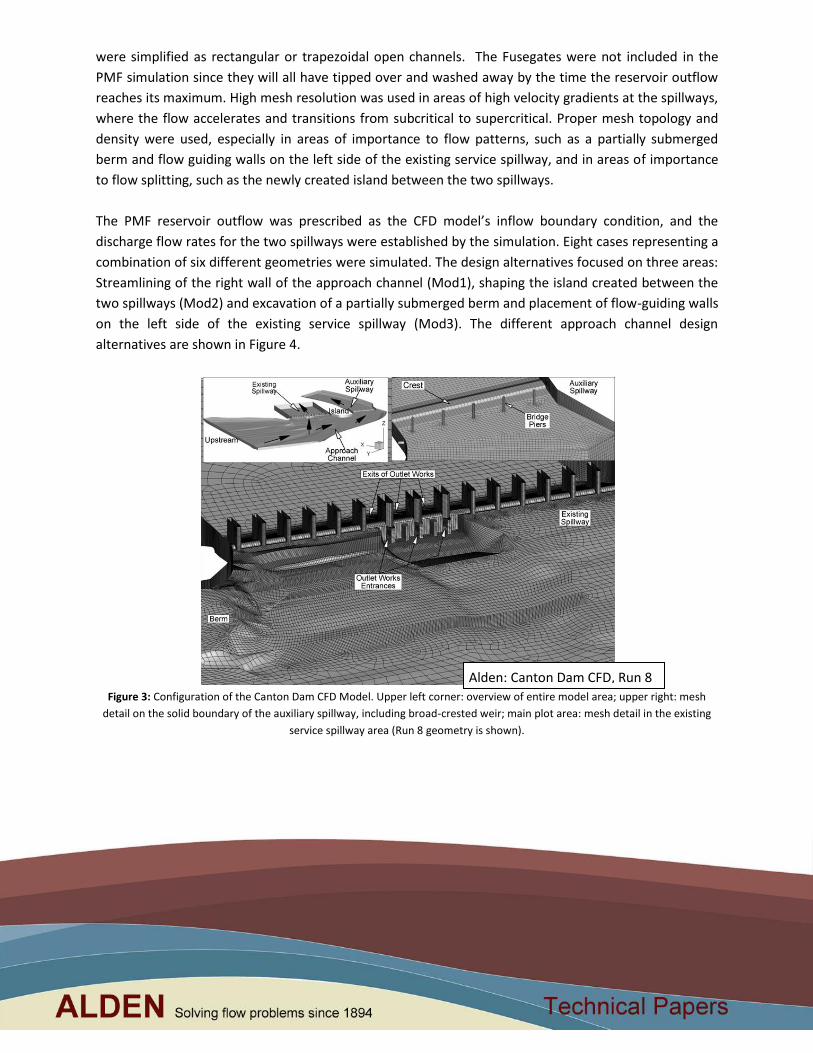
were simplified as rectangular or trapezoidal open channels. The Fusegates were not included in the
PMF simulation since they will all have tipped over and washed away by the time the reservoir outflow
reaches its maximum. High mesh resolution was used in areas of high velocity gradients at the spillways,
where the flow accelerates and transitions from subcritical to supercritical. Proper mesh topology and
density were used, especially in areas of importance to flow patterns, such as a partially submerged
berm and flow guiding walls on the left side of the existing service spillway, and in areas of importance
to flow splitting, such as the newly created island between the two spillways.
The PMF reservoir outflow was prescribed as the CFD model’s inflow boundary condition, and the
discharge flow rates for the two spillways were established by the simulation. Eight cases representing a
combination of six different geometries were simulated. The design alternatives focused on three areas:
Streamlining of the right wall of the approach channel (Mod1), shaping the island created between the
two spillways (Mod2) and excavation of a partially submerged berm and placement of flow-guiding walls
on the left side of the existing service spillway (Mod3). The different approach channel design
alternatives are shown in Figure 4.
Figure 3: Configuration of the Canton Dam CFD Model. Upper left corner: overview of entire model area; upper right: mesh
detail on the solid boundary of the auxiliary spillway, including broad-crested weir; main plot area: mesh detail in the existing
service spillway area (Run 8 geometry is shown).
Alden: Canton Dam CFD, Run 8
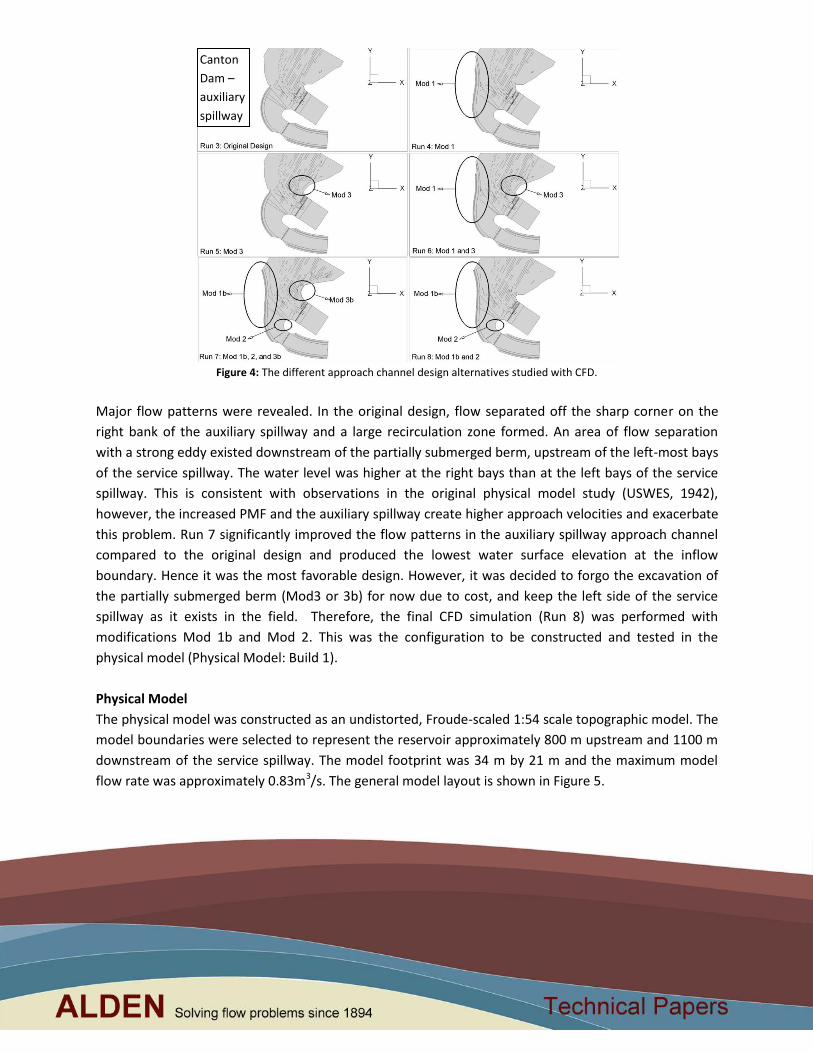
Figure 4: The different approach channel design alternatives studied with CFD.
Major flow patterns were revealed. In the original design, flow separated off the sharp corner on the
right bank of the auxiliary spillway and a large recirculation zone formed. An area of flow separation
with a strong eddy existed downstream of the partially submerged berm, upstream of the left-most bays
of the service spillway. The water level was higher at the right bays than at the left bays of the service
spillway. This is consistent with observations in the original physical model study (USWES, 1942),
however, the increased PMF and the auxiliary spillway create higher approach velocities and exacerbate
this problem. Run 7 significantly improved the flow patterns in the auxiliary spillway approach channel
compared to the original design and produced the lowest water surface elevation at the inflow
boundary. Hence it was the most favorable design. However, it was decided to forgo the excavation of
the partially submerged berm (Mod3 or 3b) for now due to cost, and keep the left side of the service
spillway as it exists in the field. Therefore, the final CFD simulation (Run 8) was performed with
modifications Mod 1b and Mod 2. This was the configuration to be constructed and tested in the
physical model (Physical Model: Build 1).
Physical Model
The physical model was constructed as an undistorted, Froude-scaled 1:54 scale topographic model. The
model boundaries were selected to represent the reservoir approximately 800 m upstream and 1100 m
downstream of the service spillway. The model footprint was 34 m by 21 m and the maximum model
flow rate was approximately 0.83m3/s. The general model layout is shown in Figure 5.
Canton
Dam –
auxiliary
spillway
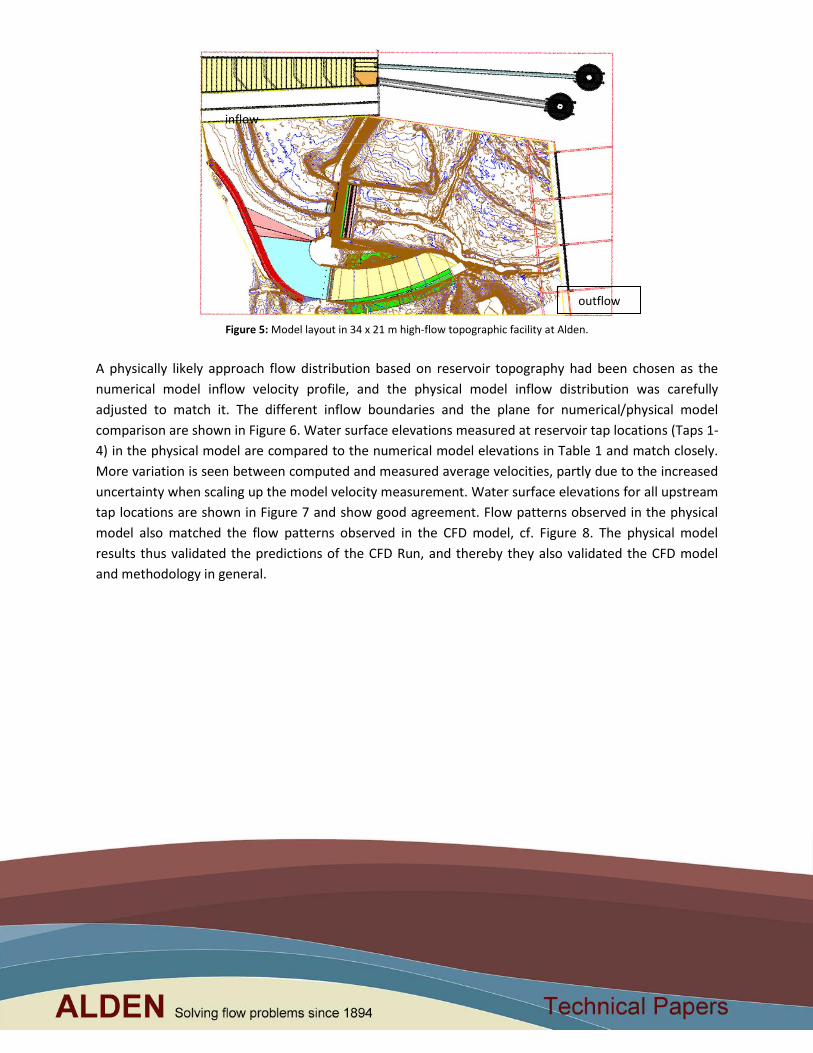
Figure 5: Model layout in 34 x 21 m high-flow topographic facility at Alden.
A physically likely approach flow distribution based on reservoir topography had been chosen as the
numerical model inflow velocity profile, and the physical model inflow distribution was carefully
adjusted to match it. The different inflow boundaries and the plane for numerical/physical model
comparison are shown in Figure 6. Water surface elevations measured at reservoir tap locations (Taps 1-
4) in the physical model are compared to the numerical model elevations in Table 1 and match closely.
More variation is seen between computed and measured average velocities, partly due to the increased
uncertainty when scaling up the model velocity measurement. Water surface elevations for all upstream
tap locations are shown in Figure 7 and show good agreement. Flow patterns observed in the physical
model also matched the flow patterns observed in the CFD model, cf. Figure 8. The physical model
results thus validated the predictions of the CFD Run, and thereby they also validated the CFD model
and methodology in general.
inflow
outflow
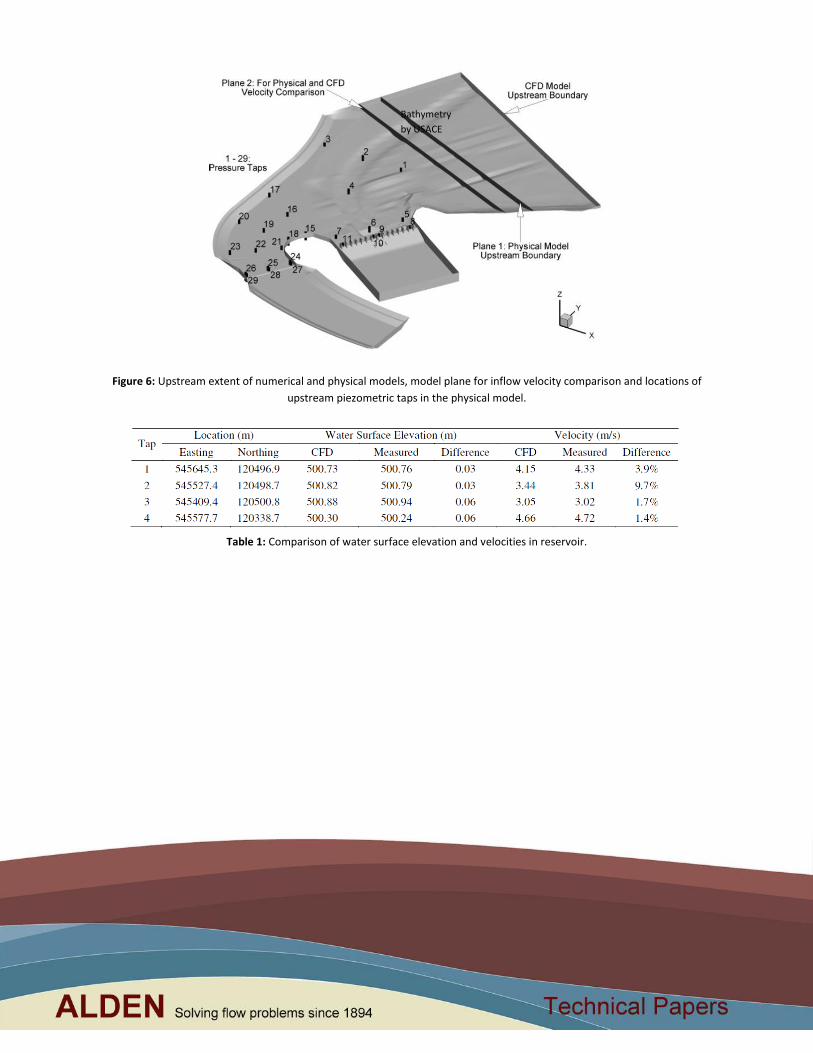
Figure 6: Upstream extent of numerical and physical models, model plane for inflow velocity comparison and locations of
upstream piezometric taps in the physical model.
Table 1: Comparison of water surface elevation and velocities in reservoir.
Bathymetry
by USACE
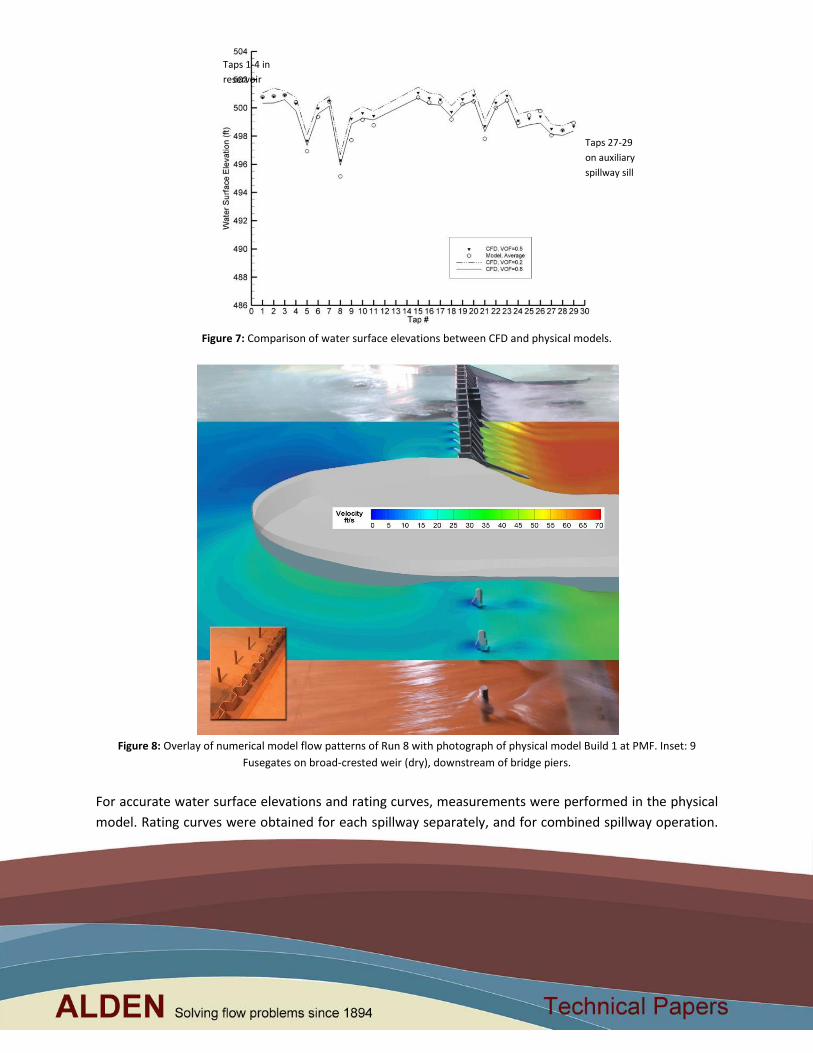
Figure 7: Comparison of water surface elevations between CFD and physical models.
Figure 8: Overlay of numerical model flow patterns of Run 8 with photograph of physical model Build 1 at PMF. Inset: 9
Fusegates on broad-crested weir (dry), downstream of bridge piers.
For accurate water surface elevations and rating curves, measurements were performed in the physical
model. Rating curves were obtained for each spillway separately, and for combined spillway operation.
Taps 1-4 in
reservoir
Taps 27-29
on auxiliary
spillway sill
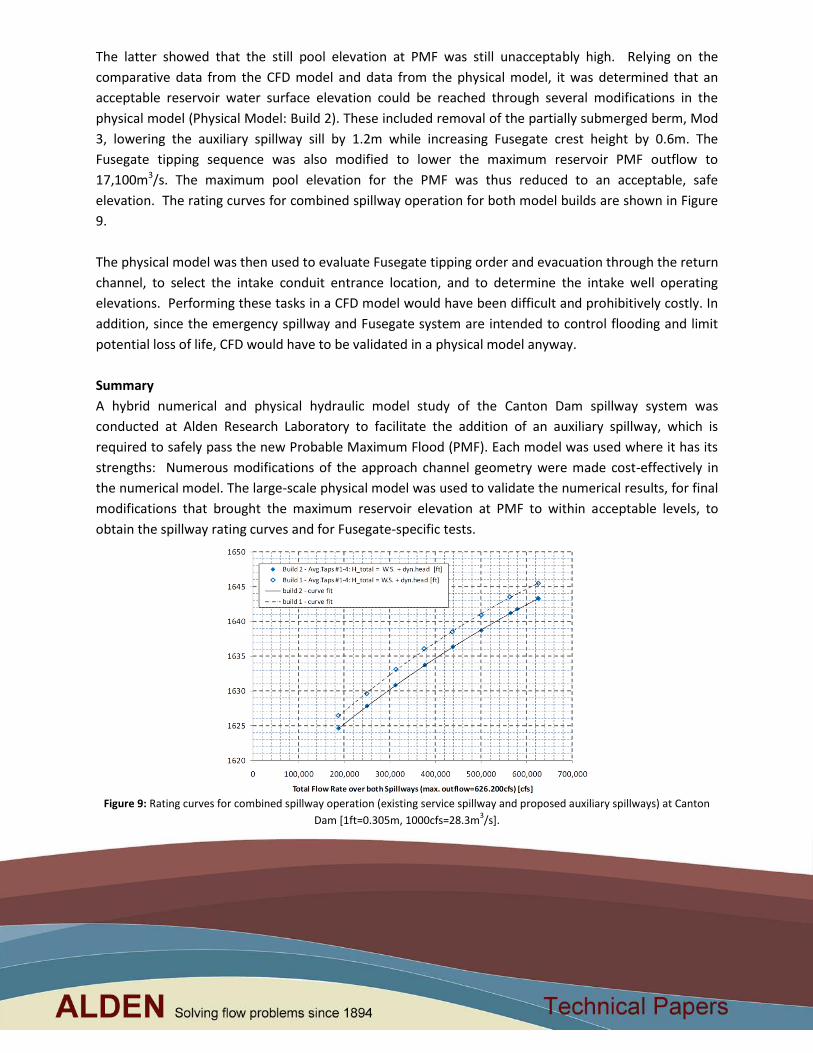
The latter showed that the still pool elevation at PMF was still unacceptably high. Relying on the
comparative data from the CFD model and data from the physical model, it was determined that an
acceptable reservoir water surface elevation could be reached through several modifications in the
physical model (Physical Model: Build 2). These included removal of the partially submerged berm, Mod
3, lowering the auxiliary spillway sill by 1.2m while increasing Fusegate crest height by 0.6m. The
Fusegate tipping sequence was also modified to lower the maximum reservoir PMF outflow to
17,100m3/s. The maximum pool elevation for the PMF was thus reduced to an acceptable, safe
elevation. The rating curves for combined spillway operation for both model builds are shown in Figure
9.
The physical model was then used to evaluate Fusegate tipping order and evacuation through the return
channel, to select the intake conduit entrance location, and to determine the intake well operating
elevations. Performing these tasks in a CFD model would have been difficult and prohibitively costly. In
addition, since the emergency spillway and Fusegate system are intended to control flooding and limit
potential loss of life, CFD would have to be validated in a physical model anyway.
Summary
A hybrid numerical and physical hydraulic model study of the Canton Dam spillway system was
conducted at Alden Research Laboratory to facilitate the addition of an auxiliary spillway, which is
required to safely pass the new Probable Maximum Flood (PMF). Each model was used where it has its
strengths: Numerous modifications of the approach channel geometry were made cost-effectively in
the numerical model. The large-scale physical model was used to validate the numerical results, for final
modifications that brought the maximum reservoir elevation at PMF to within acceptable levels, to
obtain the spillway rating curves and for Fusegate-specific tests.
Figure 9: Rating curves for combined spillway operation (existing service spillway and proposed auxiliary spillways) at Canton
Dam [1ft=0.305m, 1000cfs=28.3m3/s].
References Chanel P; Doering J (2008) "Assessment of spillway modeling using computational fluid dynamics." Can. J. Civ. Eng., 35, 1481-1485.
Ettema R; Arndt REA; Roberts P; Wahl T (2000) Hydraulic Modeling: Concepts and Practice. ASCE Manuals and Reports on Engineering Practice
No. 97.
Ho D; Cooper B; Riddtte K; Donohoo S (2006) "Appl. of numerical modeling to spillways in Australia." In Dams and Reservoirs. eds. Berga et
al.,Taylor and Francis.
Launder B; Spalding D (1974) "The numerical computation of turbulent flows." Computer Methods in Applied Mechanics and Engineering, 3,
269-289.
Lee H; Lin C; Weber LJ (2008) "Application of a non-hydrostatic model to flow in a free surface fish passage facility." J. Hydraul. Eng., 134(7),
993-999.
Savage B; Johnson M (2001) "Flow over an ogee spillway: Physical and numerical model case study." J. Hydraul. Eng., 127(8), 640-649.
Song C; Zhou F (1999) "Simulation of free surface flow over a spillway." J. Hydraul. Eng., 125(9), 959-967.
US Army Corps Engineers, Waterways Experiment Station (1977). "Corps of Engineers Hydraulic Design Criteria”, Volume 2.
U.S. Waterways Experiment Station (USWES) (1942). "Model Studies of the Spillway and Integral Sluices for the Canton Dam, North Canadian
River, Oklahoma" U.S. Army, Technical Memorandum No. 190-1, Vicksburg, Miss.