Embed Size (px)
Citation preview
1
A Hybrid Approach to the Creation
of Dynamic Risk Management Models
Nicolas Dulac1, Brandon D. Owens
2, Nancy G. Leveson
1,2, John S. Carroll
2,3
1Department of Aero/Astro,
2Engineering Systems Division,
3Sloan School of Management
Massachusetts Institute of Technology, 77 Massachusetts Ave, Cambridge, MA 02139
email: [email protected], [email protected], [email protected]
1. Abstract
Traditionally, system dynamics models are created using the “standard method”: A problem is
identified, a dynamic hypothesis is generated based on causal loop diagramming and reference
mode definition, a stock and flow structure is created to test the dynamic hypothesis, and finally,
insights and potential high-leverage policies are identified based on the resulting model. In this
paper, a hybrid approach for the creation of dynamic risk management models is introduced by
combining system dynamics with the STAMP accident model. The new approach relies heavily
on system dynamics concepts and retains the essence of the “standard method”, but the structure
of the models created is linked to the STAMP safety control structure necessary to ensure safety
in the entire lifecycle of complex engineering systems. The main steps of the hybrid method are
introduced and the similarities and differences with the standard method are emphasized. An
example is provided based on a risk management modeling project performed for the NASA
Exploration Systems Mission Directorate (ESMD).
2. Introduction and Background
The hybrid modeling method introduced in this paper builds upon two major theoretical
foundations: system dynamics and the STAMP accident model. These two foundations have
much in common. System dynamics has been used for years to find high-leverage policies to
help solve problems encountered in complex dynamic systems [Senge, 1990; Sterman, 2000].
STAMP was created to improve safety in the development and operation of complex, dynamic,
engineering systems. STAMP views safety as a control problem, where every component of the
socio-technical system has a role to play in enforcing the constraints necessary to ensure system
safety. In this section, the STAMP accident model is briefly introduced, then, the similarities
and differences that make STAMP and SD complementary are highlighted and context is
provided for the risk management example used to illustrate the hybrid methodology.
2.1 The STAMP accident model
STAMP (Systems-Theoretic Accident Modeling and Processes) is a new way of thinking about
accidents that integrates all aspects of risk, including organizational and social aspects. STAMP
can be used as a foundation for improved approaches to accident investigation and analysis,
hazard analysis and accident prevention, risk assessment and risk management, and derivation of
risk metrics and performance monitoring strategies. One unique aspect of this approach to risk
management is the emphasis on the use of visualization and building shared mental models of
2
complex system behavior among those responsible for managing risk. The techniques integral to
STAMP can assist in achieving more effective organizational decision-making.
STAMP is constructed from three fundamental concepts: constraints, hierarchical levels of
control, and process models. These concepts, in turn, give rise to a classification of control flaws
that can lead to accidents. Each of these is briefly described here. A more complete description
can be found in [Leveson, 2004; Leveson, 2007].
The most basic component of STAMP is not an event, but a constraint. In systems theory and
control theory, systems are viewed as hierarchical structures where each level imposes
constraints on the activity of the level below it - that is, constraints or a lack of constraints at a
higher level allow or control lower-level behavior. Safety-related constraints specify those
relationships among system variables that constitute the non-hazardous or safe system states, for
example, the power must never be on when the access to the high-voltage power source is open,
or two aircraft must not violate minimum separation requirements.
Instead of viewing accidents as the result of an initiating (root cause) event in a chain of events
leading to a loss, accidents are viewed as resulting from interactions among components that
violate the system safety constraints. The control processes that enforce these constraints must
limit system behavior to the safe changes and adaptations implied by the constraints. Preventing
accidents requires the design of a control structure encompassing the entire socio-technical
system that will enforce the necessary constraints on development and operations. Figure 1
shows a generic hierarchical safety control structure. Accidents result from inadequate
enforcement of constraints on behavior (e.g. the physical system, engineering design,
management, and regulatory behavior) at each level of the socio-technical system. Inadequate
control may result from missing safety constraints, inadequately communicated constraints, or
from constraints that are not enforced correctly at a lower level. For example, the safety analysis
process that generates constraints always involves some basic assumptions about the operating
environment of the process. When the environment changes such that those assumptions are no
longer true, the controls in place may become inadequate.
The general model in Figure 1 has two basic hierarchical control structures - one for system
development (on the left) and one for system operation (on the right) - with interactions between
them. A spacecraft manufacturer, for example, might only have system development under its
immediate control, but safety involves both development and operational use of the spacecraft,
and neither can be accomplished successfully in isolation: safety must be designed into the
physical system, and safety during operation depends partly on the original system design and
partly on effective control over operations. Manufacturers must communicate to their customers
the assumptions about the operational environment upon which their safety analysis and design
was based, as well as information about safe operating procedures. The operational environment,
in turn, provides feedback to the manufacturer about the performance of the system during
operations.
Between the hierarchical levels of each control structure, effective communication channels are
needed, both a downward reference channel providing the information necessary to impose
constraints on the level below and a measuring channel to provide feedback about how
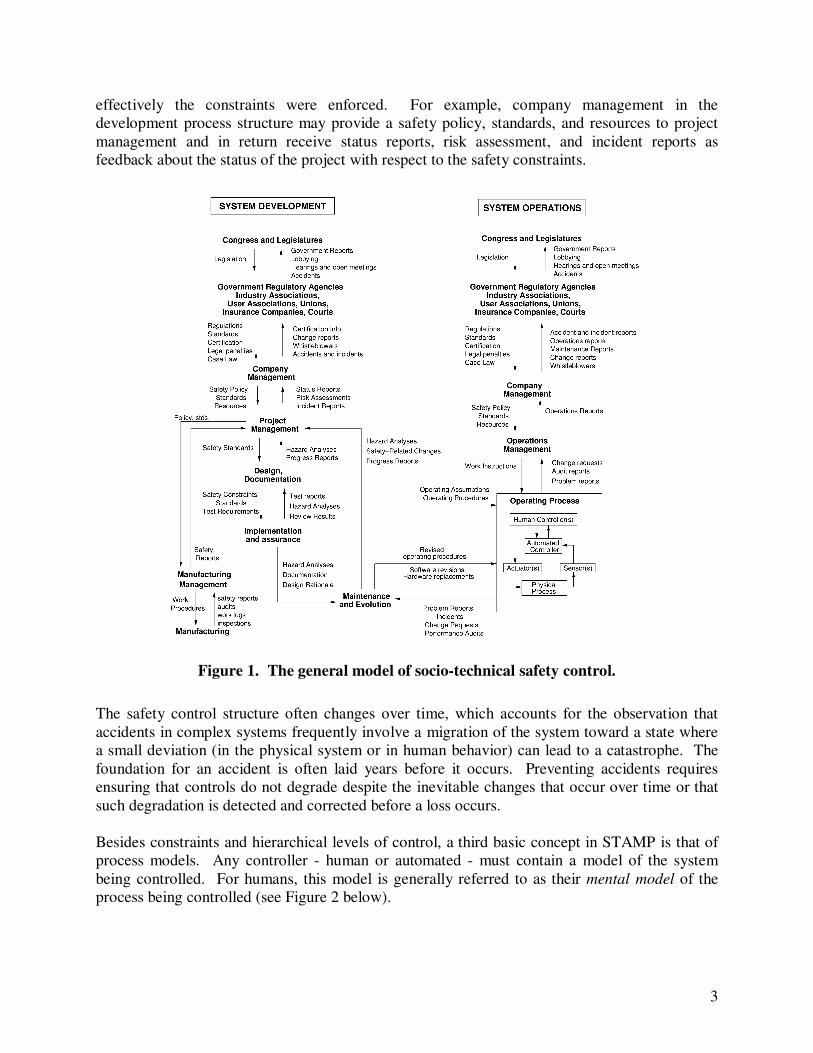
3
effectively the constraints were enforced. For example, company management in the
development process structure may provide a safety policy, standards, and resources to project
management and in return receive status reports, risk assessment, and incident reports as
feedback about the status of the project with respect to the safety constraints.
Figure 1. The general model of socio-technical safety control.
The safety control structure often changes over time, which accounts for the observation that
accidents in complex systems frequently involve a migration of the system toward a state where
a small deviation (in the physical system or in human behavior) can lead to a catastrophe. The
foundation for an accident is often laid years before it occurs. Preventing accidents requires
ensuring that controls do not degrade despite the inevitable changes that occur over time or that
such degradation is detected and corrected before a loss occurs.
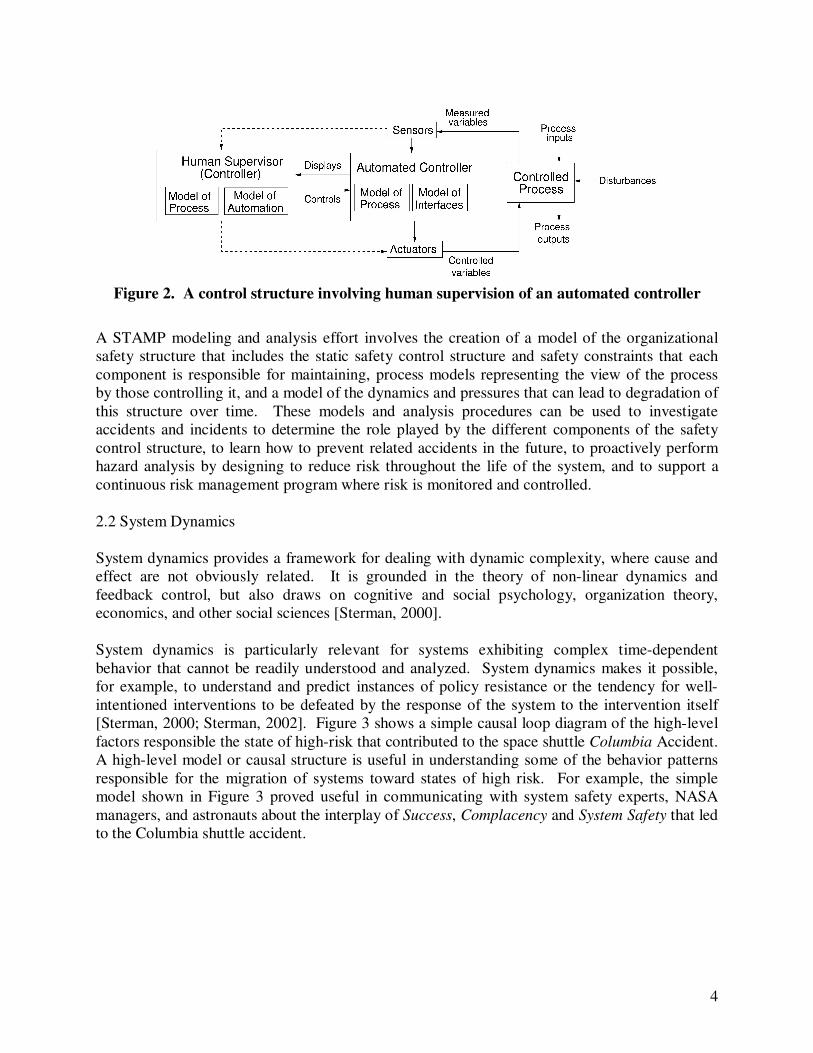
Besides constraints and hierarchical levels of control, a third basic concept in STAMP is that of
process models. Any controller - human or automated - must contain a model of the system
being controlled. For humans, this model is generally referred to as their mental model of the
process being controlled (see Figure 2 below).
4
Figure 2. A control structure involving human supervision of an automated controller
A STAMP modeling and analysis effort involves the creation of a model of the organizational
safety structure that includes the static safety control structure and safety constraints that each
component is responsible for maintaining, process models representing the view of the process
by those controlling it, and a model of the dynamics and pressures that can lead to degradation of
this structure over time. These models and analysis procedures can be used to investigate
accidents and incidents to determine the role played by the different components of the safety
control structure, to learn how to prevent related accidents in the future, to proactively perform
hazard analysis by designing to reduce risk throughout the life of the system, and to support a
continuous risk management program where risk is monitored and controlled.
2.2 System Dynamics
System dynamics provides a framework for dealing with dynamic complexity, where cause and
effect are not obviously related. It is grounded in the theory of non-linear dynamics and
feedback control, but also draws on cognitive and social psychology, organization theory,
economics, and other social sciences [Sterman, 2000].
System dynamics is particularly relevant for systems exhibiting complex time-dependent
behavior that cannot be readily understood and analyzed. System dynamics makes it possible,
for example, to understand and predict instances of policy resistance or the tendency for well-
intentioned interventions to be defeated by the response of the system to the intervention itself
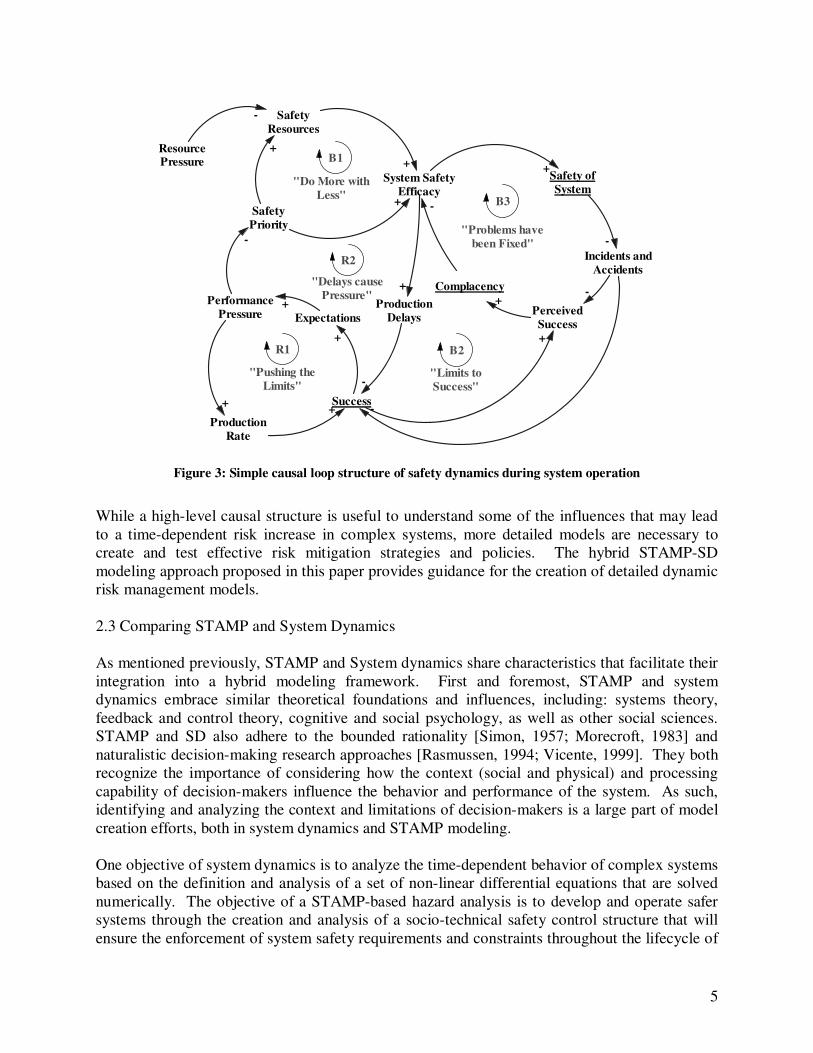
[Sterman, 2000; Sterman, 2002]. Figure 3 shows a simple causal loop diagram of the high-level
factors responsible the state of high-risk that contributed to the space shuttle Columbia Accident.
A high-level model or causal structure is useful in understanding some of the behavior patterns
responsible for the migration of systems toward states of high risk. For example, the simple
model shown in Figure 3 proved useful in communicating with system safety experts, NASA
managers, and astronauts about the interplay of Success, Complacency and System Safety that led
to the Columbia shuttle accident.
5
Success
Expectations
Production
Rate
+
+
+
Performance
Pressure
+
Safety
Priority
System Safety
Efficacy
-
ResourcePressure
Safety
Resources
-
+
+
+
Safety of
System
+
Perceived
Success
+
Complacency
+
-
Incidents and
Accidents
-
-
-
R1
"Pushing the
Limits"
B1
"Do More with
Less"
B2
"Limits to
Success"
B3
"Problems have
been Fixed"
Production
Delays
+
-
R2
"Delays cause
Pressure"
Figure 3: Simple causal loop structure of safety dynamics during system operation
While a high-level causal structure is useful to understand some of the influences that may lead
to a time-dependent risk increase in complex systems, more detailed models are necessary to
create and test effective risk mitigation strategies and policies. The hybrid STAMP-SD
modeling approach proposed in this paper provides guidance for the creation of detailed dynamic
risk management models.
2.3 Comparing STAMP and System Dynamics
As mentioned previously, STAMP and System dynamics share characteristics that facilitate their
integration into a hybrid modeling framework. First and foremost, STAMP and system
dynamics embrace similar theoretical foundations and influences, including: systems theory,
feedback and control theory, cognitive and social psychology, as well as other social sciences.
STAMP and SD also adhere to the bounded rationality [Simon, 1957; Morecroft, 1983] and
naturalistic decision-making research approaches [Rasmussen, 1994; Vicente, 1999]. They both
recognize the importance of considering how the context (social and physical) and processing
capability of decision-makers influence the behavior and performance of the system. As such,
identifying and analyzing the context and limitations of decision-makers is a large part of model
creation efforts, both in system dynamics and STAMP modeling.
One objective of system dynamics is to analyze the time-dependent behavior of complex systems
based on the definition and analysis of a set of non-linear differential equations that are solved
numerically. The objective of a STAMP-based hazard analysis is to develop and operate safer
systems through the creation and analysis of a socio-technical safety control structure that will
ensure the enforcement of system safety requirements and constraints throughout the lifecycle of
6
complex systems. A static control structure analysis can identify gaps in the control and
feedback requirements necessary to enforce safety constraints. However, many risks in complex
systems are time-dependent and a static analysis will not be sufficient to analyze and mitigate
these types of risk. For example, managing the NASA workforce to maintain adequate in-house
technical capability during the development of the new space exploration system is a dynamic
problem that requires the use of inherently dynamic analysis tools. In this paper a hybrid
framework is proposed that extends the STAMP risk analysis approach with the dynamic
analysis capabilities of system dynamics to facilitate the analysis of time-dependent risks in
complex systems.
2.4 ESMD Risk Management Project
The hybrid methodology introduced in this paper was used to perform a risk management study
for the newly formed Exploration Systems Mission Directorate (ESMD) at NASA. ESMD is the
directorate in charge of the development and implementation of new space exploration systems
as defined by the President’s Vision for Space Exploration. Among other objectives, the Vision
for Space Exploration will require NASA to develop human-rated launch and landing systems
for the first time since the 1970s, as well as a versatile Crew Exploration Vehicle adaptable for
Lunar and Martian exploration.
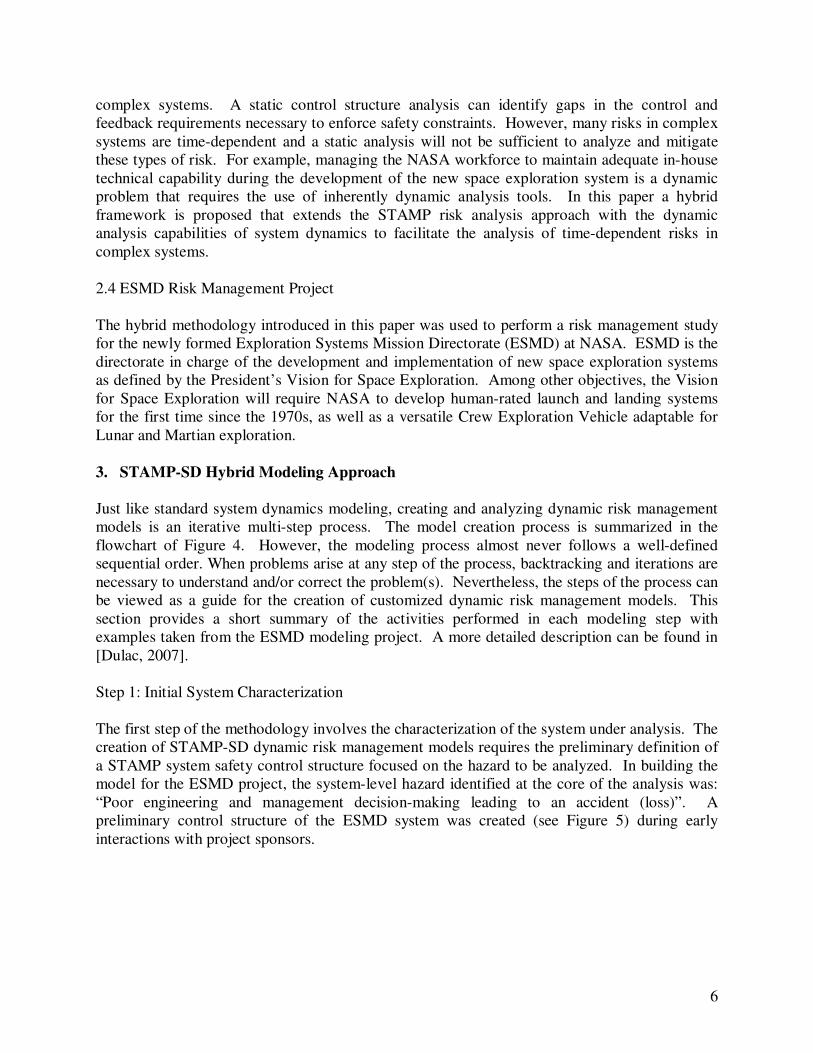
3. STAMP-SD Hybrid Modeling Approach
Just like standard system dynamics modeling, creating and analyzing dynamic risk management
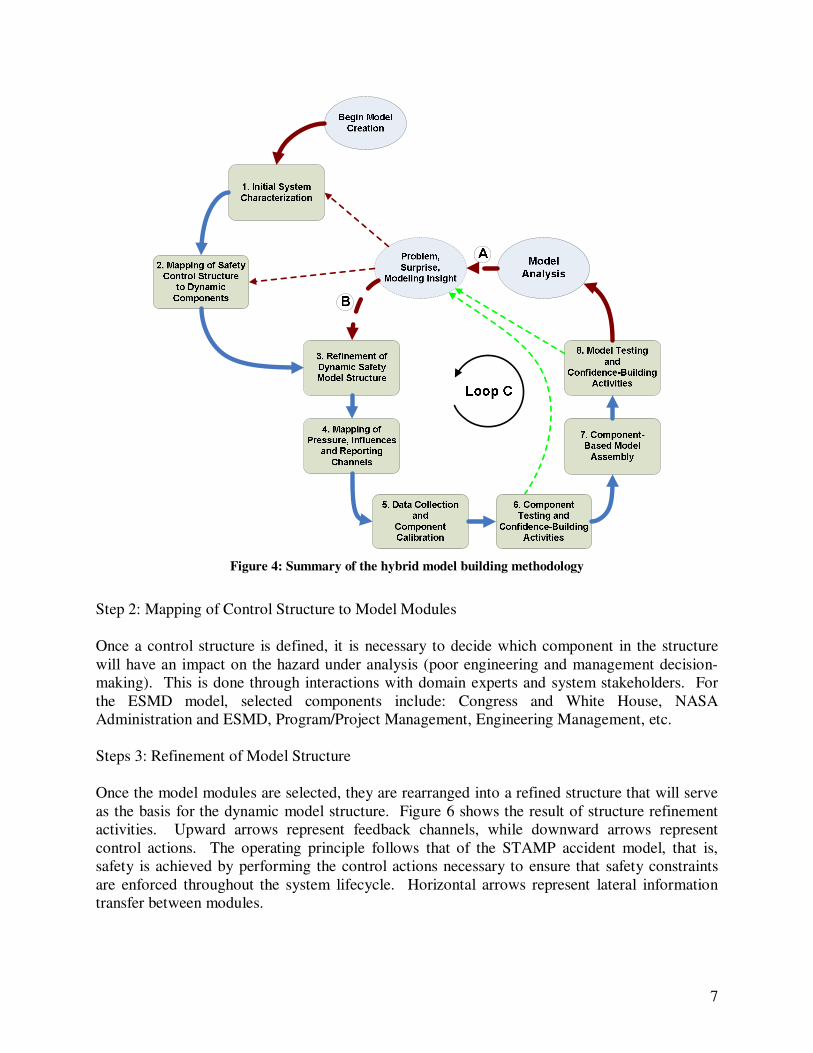
models is an iterative multi-step process. The model creation process is summarized in the
flowchart of Figure 4. However, the modeling process almost never follows a well-defined
sequential order. When problems arise at any step of the process, backtracking and iterations are
necessary to understand and/or correct the problem(s). Nevertheless, the steps of the process can
be viewed as a guide for the creation of customized dynamic risk management models. This
section provides a short summary of the activities performed in each modeling step with
examples taken from the ESMD modeling project. A more detailed description can be found in
[Dulac, 2007].
Step 1: Initial System Characterization
The first step of the methodology involves the characterization of the system under analysis. The
creation of STAMP-SD dynamic risk management models requires the preliminary definition of
a STAMP system safety control structure focused on the hazard to be analyzed. In building the
model for the ESMD project, the system-level hazard identified at the core of the analysis was:
“Poor engineering and management decision-making leading to an accident (loss)”. A
preliminary control structure of the ESMD system was created (see Figure 5) during early
interactions with project sponsors.
7
Figure 4: Summary of the hybrid model building methodology
Step 2: Mapping of Control Structure to Model Modules
Once a control structure is defined, it is necessary to decide which component in the structure
will have an impact on the hazard under analysis (poor engineering and management decision-
making). This is done through interactions with domain experts and system stakeholders. For
the ESMD model, selected components include: Congress and White House, NASA
Administration and ESMD, Program/Project Management, Engineering Management, etc.
Steps 3: Refinement of Model Structure
Once the model modules are selected, they are rearranged into a refined structure that will serve
as the basis for the dynamic model structure. Figure 6 shows the result of structure refinement
activities. Upward arrows represent feedback channels, while downward arrows represent
control actions. The operating principle follows that of the STAMP accident model, that is,
safety is achieved by performing the control actions necessary to ensure that safety constraints
are enforced throughout the system lifecycle. Horizontal arrows represent lateral information
transfer between modules.
8
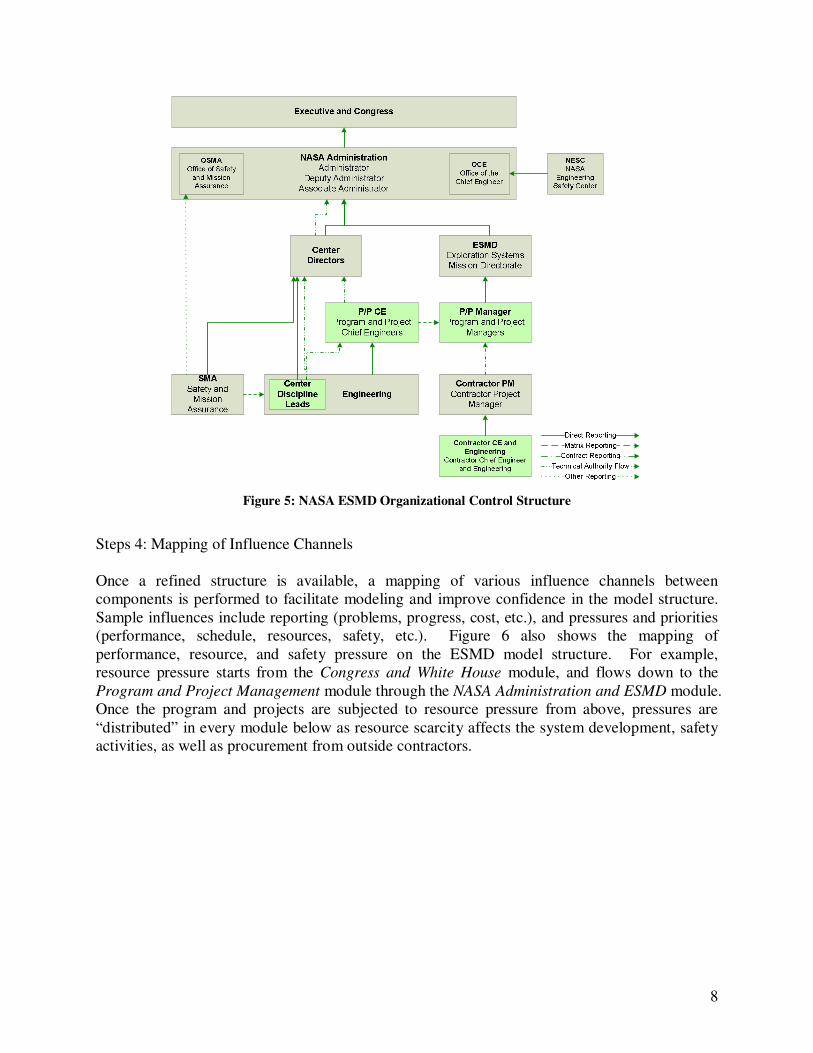
Figure 5: NASA ESMD Organizational Control Structure
Steps 4: Mapping of Influence Channels
Once a refined structure is available, a mapping of various influence channels between
components is performed to facilitate modeling and improve confidence in the model structure.
Sample influences include reporting (problems, progress, cost, etc.), and pressures and priorities
(performance, schedule, resources, safety, etc.). Figure 6 also shows the mapping of
performance, resource, and safety pressure on the ESMD model structure. For example,
resource pressure starts from the Congress and White House module, and flows down to the
Program and Project Management module through the NASA Administration and ESMD module.
Once the program and projects are subjected to resource pressure from above, pressures are
“distributed” in every module below as resource scarcity affects the system development, safety
activities, as well as procurement from outside contractors.
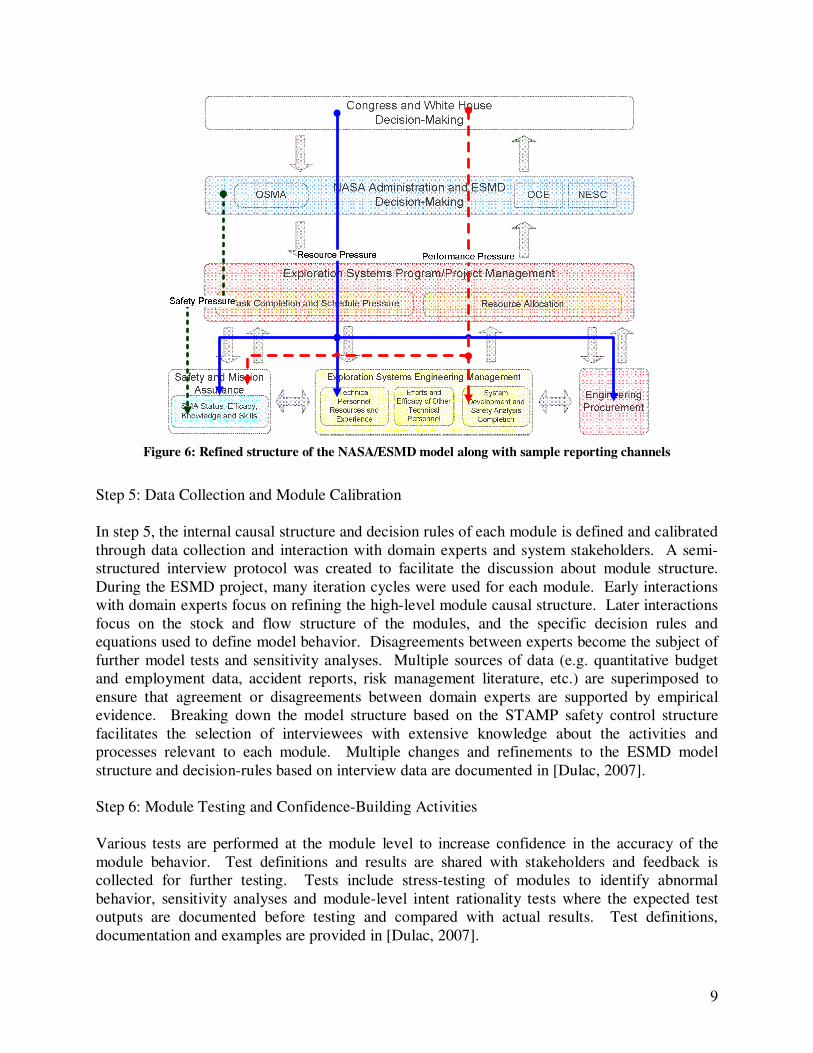
9
Figure 6: Refined structure of the NASA/ESMD model along with sample reporting channels
Step 5: Data Collection and Module Calibration
In step 5, the internal causal structure and decision rules of each module is defined and calibrated
through data collection and interaction with domain experts and system stakeholders. A semi-
structured interview protocol was created to facilitate the discussion about module structure.
During the ESMD project, many iteration cycles were used for each module. Early interactions
with domain experts focus on refining the high-level module causal structure. Later interactions
focus on the stock and flow structure of the modules, and the specific decision rules and
equations used to define model behavior. Disagreements between experts become the subject of
further model tests and sensitivity analyses. Multiple sources of data (e.g. quantitative budget
and employment data, accident reports, risk management literature, etc.) are superimposed to
ensure that agreement or disagreements between domain experts are supported by empirical
evidence. Breaking down the model structure based on the STAMP safety control structure
facilitates the selection of interviewees with extensive knowledge about the activities and
processes relevant to each module. Multiple changes and refinements to the ESMD model
structure and decision-rules based on interview data are documented in [Dulac, 2007].
Step 6: Module Testing and Confidence-Building Activities
Various tests are performed at the module level to increase confidence in the accuracy of the
module behavior. Test definitions and results are shared with stakeholders and feedback is
collected for further testing. Tests include stress-testing of modules to identify abnormal
behavior, sensitivity analyses and module-level intent rationality tests where the expected test
outputs are documented before testing and compared with actual results. Test definitions,
documentation and examples are provided in [Dulac, 2007].
10
Steps 7 and 8: Model Assembly, Testing and Confidence-Building Activities
Step 7 involves the assembly of modules into an integrated model. The refined structure
obtained in earlier steps (see Figure 6) provides a map of the necessary connections. The use of
standard interfaces at the boundary of each module facilitates the assembly of executable,
previously-tested and semi-validated modules into an integrated model. Once the model is
assembled, system-level testing and confidence-building activities (step 8) are performed in a
manner similar to step 6. In addition, the scenarios investigated during model analysis are used
to further improve confidence in model behavior and to identify problems that may require
backtracking to earlier model development steps.
3.1 STAMP-SD Hybrid Approach vs. Standard Method
While it may appear that large differences exist between a STAMP analysis and a typical SD
analysis, a closer look allows the uncovering of many similarities in the two approaches that
facilitate the creation and use of a hybrid approach. This section highlights similarities and
differences between the two approaches
Using a standard SD research approach, a single problem is identified as the core issue to be
addressed. During research and modeling, the scope of the model is progressively increased to
include the factors, tangibles or intangibles, which may contribute to the creation and
perpetuation of the problem under analysis. Nevertheless, a single core theme and dynamic
hypothesis is at the center of the research project. Similarly, using a STAMP analysis, individual
hazards are identified as the core issue to be tackled. The entire STAMP analysis is focused at
eliminating or otherwise mitigating the chosen hazard(s).
A difference of the hybrid STAMP-SD approach is the use of dynamic components mapped to a
STAMP safety control structure. In the standard method, dynamic models are created by adding
individual loops related to a problem under analysis. In the hybrid method the models are built
by assembling the STAMP control structure components that have an impact on the hazard to be
analyzed. Causal loops are embedded within components and are individually reviewed by
system stakeholders during interviews. Additional causal loops are created by the assembly of
individual components into an integrated model.
Just like traditional system dynamics modeling, the hybrid STAMP-SD methodology
necessitates the involvement of system stakeholders and is heavily participative, in the tradition
of action research [McKernan, 1996]. Traditionally, modeling projects involve the use of
consultants acting as facilitators, model-builders, and analysts. Consultants usually approach a
problem along the sequence of Schein’s classical process consultation prescription of
“engagement-analysis-action-disengagement” [Schein, 1969]. This consultation process is not
adequate for lifecycle risk management in complex systems because inevitable changes in the
safety control structure may erode its efficacy over time. Consequently, control structures and
their associated dynamic models must be analyzed periodically and tracked over time to ensure
their continued ability to keep risk to acceptable levels. One main objective of the module-based
hybrid methodology is to facilitate model-building and analysis to a point where it can be
11
performed by system stakeholders, including engineers, managers, and safety analysts with
acceptable levels of training.
4. ESMD Model
This section describes the model created for the ESMD risk management project along with data
sources used as the basis for model development. An interview protocol was developed to
streamline data collection, model development, testing and review. In all, 44 people were
interviewed during 41 interviews conducted over a three-month period at NASA Headquarters,
the Marshall Space Flight Center, the Johnson Space Center, and the Langley Research Center.
In addition, quantitative data was used from a number of sources in the public domain. These
sources, which mostly contain budget and personnel data, are summarized in Table 1.
SOURCE TYPES OF DATA
Workforce Data Cubes on the
NASAPeople Website • Center support contractor headcounts for FY 2002
• Headcounts of civil servant workforce in Science and
Engineering (S&E) positions
• S&E civil servant workforce age, experience, hiring
counts, attrition counts, retirement eligibility
• Age of civil servant new hires
• Etc.
FY 2004 to FY 2007 NASA
Budget Requests • Budget breakdowns to the program level (historical and
forecast) for FY 2002 to FY 2011
• Estimates of civil servant unfunded capacity
FY 2002 to FY 2004 NASA
Procurement Reports • Total procurement dollars for FY 2002 to FY 2004
• Procurement Awards by type of effort for FY 2002 to
FY 2004
Columbia Accident Investigation
Board Report • Space Shuttle Program civil servant and support
contractor workforce for FY 1993 to FY 2002
• Space Shuttle Program budget for FY 1993 to FY 2002
Table 1. Budget and personnel data sources used in the model.
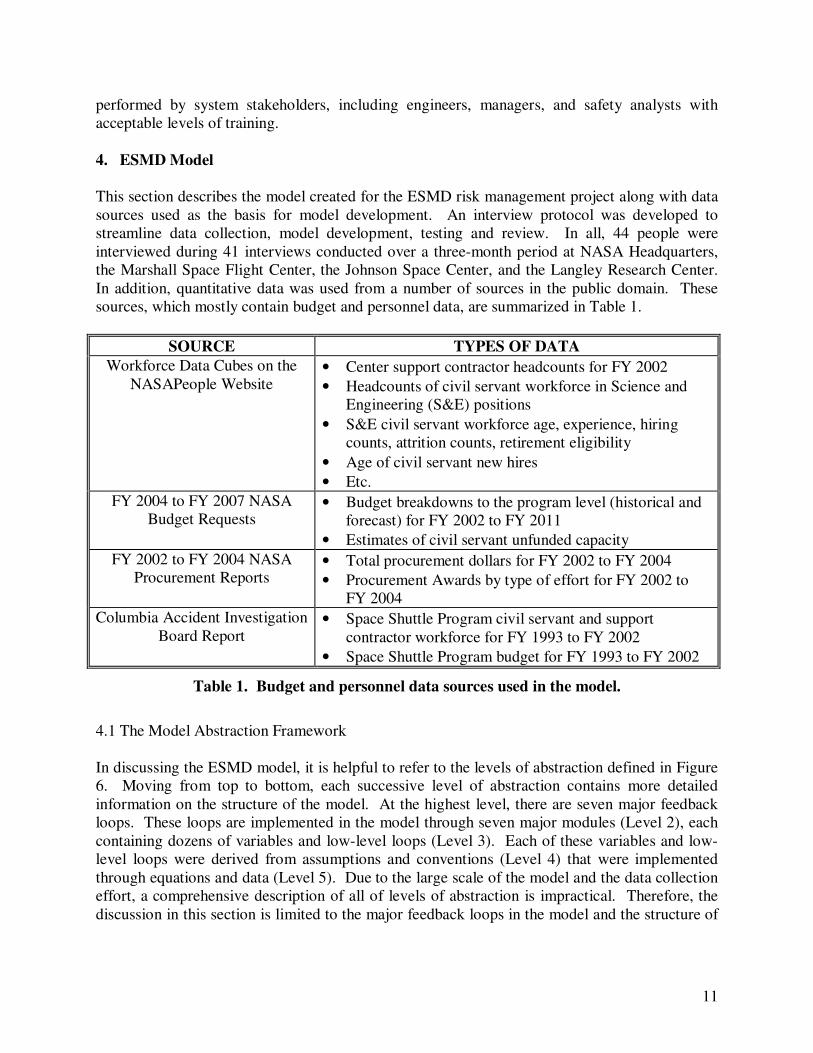
4.1 The Model Abstraction Framework
In discussing the ESMD model, it is helpful to refer to the levels of abstraction defined in Figure
6. Moving from top to bottom, each successive level of abstraction contains more detailed
information on the structure of the model. At the highest level, there are seven major feedback
loops. These loops are implemented in the model through seven major modules (Level 2), each
containing dozens of variables and low-level loops (Level 3). Each of these variables and low-
level loops were derived from assumptions and conventions (Level 4) that were implemented
through equations and data (Level 5). Due to the large scale of the model and the data collection
effort, a comprehensive description of all of levels of abstraction is impractical. Therefore, the
discussion in this section is limited to the major feedback loops in the model and the structure of
12
the modules in which these loops are implemented (Levels 1 and 2). Further model
documentation can be found in [Dulac, 2007; Dulac, 2007b].
Level 5: Data and Equations
Level 4: Assumptions and Conventions
Level 2: Model Modules
Level 1:
Major Loops
Level 3: Variables and Minor Loops
Figure 7: Levels of abstraction for describe the ESMD Model
4.2 Abstraction Level 1: Major Feedback Loops
Some important high-level feedback loops in the model are shown in Figure 8. Some of these
loops were derived from existing literature on the dynamics of project management and system
development, as well as from dynamic safety archetypes [Marais, 2003] and on the authors’
direct interactions and interviews with project management professionals in NASA.
The loops shown in Figure 8 are supplemented in the model with a significant number of
additional variables (not shown in the figure) that track real system characteristics, such as the
amount of resources (material and human) allocated to a particular project, as well as the number
of tasks allocated, the number of tasks completed, and the number of safety analyses completed
and used in design.
The first and arguably most critical balancing loop is labeled “Delays Cause Pressure” (B1),
which is the balancing loop for schedule pressure. Loop B1 is responsible for system
development being completed on schedule. As the system development completion falls behind,
schedule delays start to accumulate, which leads to more pressure to accelerate system
development and a faster work rate. However, other reinforcing mechanisms may reduce the
actual impact of this loop on schedule completion. The “Burnout Cycle” loop (R2) and the
“Rework Cycle” loop (R3), for example, limits the impact of the “Delays cause Pressure” loop as
shown in Figure 8. The “Rework Cycle” is a standard component of development dynamics and
has been discussed in great detail in the project dynamics literature [Ford, 1995; Ford, 1998;
Sterman, 2000; Lyneis, 2001].
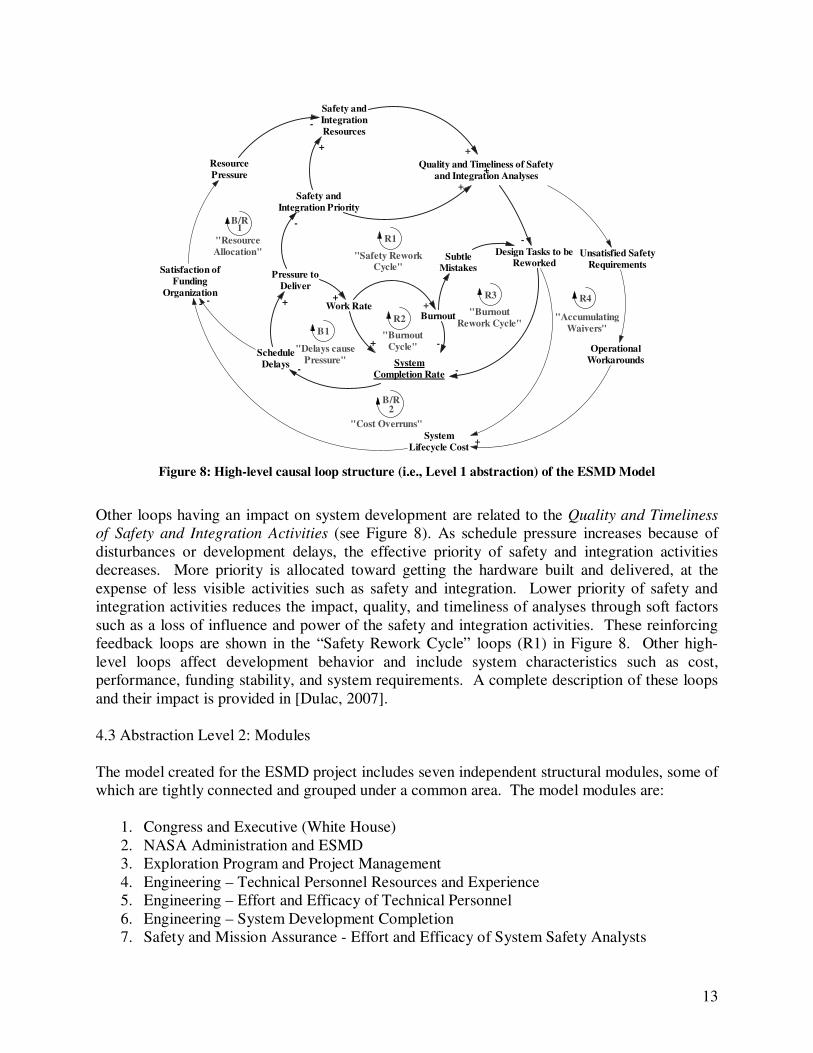
13
System
Completion Rate
Schedule
Delays
Work Rate
-
+
+
Pressure to
Deliver+
Safety and
Integration Priority
-
Resource
Pressure
Safety and
Integration
Resources-
+
+
R1
"Burnout
Cycle"
B1
"Burnout
Rework Cycle"
R4
"Accumulating
Waivers"R2
"Delays cause
Pressure"
Satisfaction of
Funding
Organization
Burnout+
-
Quality and Timeliness of Safety
and Integration Analyses
-
Design Tasks to beReworked
Unsatisfied Safety
Requirements
-
SubtleMistakes
-
System
Lifecycle Cost
-
+
+
Operational
Workarounds
+
"Safety ReworkCycle"
R3
B/R1
"Resource
Allocation"
B/R2
"Cost Overruns"
Figure 8: High-level causal loop structure (i.e., Level 1 abstraction) of the ESMD Model
Other loops having an impact on system development are related to the Quality and Timeliness
of Safety and Integration Activities (see Figure 8). As schedule pressure increases because of
disturbances or development delays, the effective priority of safety and integration activities
decreases. More priority is allocated toward getting the hardware built and delivered, at the
expense of less visible activities such as safety and integration. Lower priority of safety and
integration activities reduces the impact, quality, and timeliness of analyses through soft factors
such as a loss of influence and power of the safety and integration activities. These reinforcing
feedback loops are shown in the “Safety Rework Cycle” loops (R1) in Figure 8. Other high-
level loops affect development behavior and include system characteristics such as cost,
performance, funding stability, and system requirements. A complete description of these loops
and their impact is provided in [Dulac, 2007].
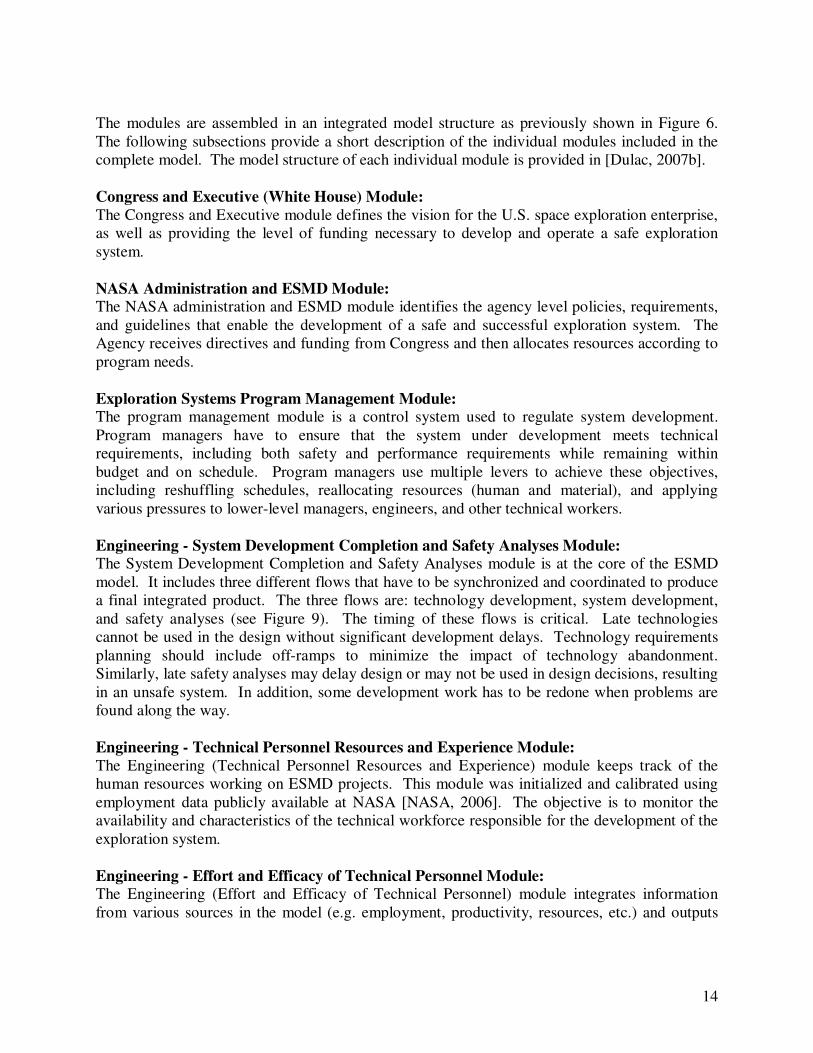
4.3 Abstraction Level 2: Modules
The model created for the ESMD project includes seven independent structural modules, some of
which are tightly connected and grouped under a common area. The model modules are:
1. Congress and Executive (White House)
2. NASA Administration and ESMD
3. Exploration Program and Project Management
4. Engineering – Technical Personnel Resources and Experience
5. Engineering – Effort and Efficacy of Technical Personnel
6. Engineering – System Development Completion
7. Safety and Mission Assurance - Effort and Efficacy of System Safety Analysts
14
The modules are assembled in an integrated model structure as previously shown in Figure 6.
The following subsections provide a short description of the individual modules included in the
complete model. The model structure of each individual module is provided in [Dulac, 2007b].
Congress and Executive (White House) Module:
The Congress and Executive module defines the vision for the U.S. space exploration enterprise,
as well as providing the level of funding necessary to develop and operate a safe exploration
system.
NASA Administration and ESMD Module: The NASA administration and ESMD module identifies the agency level policies, requirements,
and guidelines that enable the development of a safe and successful exploration system. The
Agency receives directives and funding from Congress and then allocates resources according to
program needs.
Exploration Systems Program Management Module: The program management module is a control system used to regulate system development.
Program managers have to ensure that the system under development meets technical
requirements, including both safety and performance requirements while remaining within
budget and on schedule. Program managers use multiple levers to achieve these objectives,
including reshuffling schedules, reallocating resources (human and material), and applying
various pressures to lower-level managers, engineers, and other technical workers.
Engineering - System Development Completion and Safety Analyses Module: The System Development Completion and Safety Analyses module is at the core of the ESMD
model. It includes three different flows that have to be synchronized and coordinated to produce
a final integrated product. The three flows are: technology development, system development,
and safety analyses (see Figure 9). The timing of these flows is critical. Late technologies
cannot be used in the design without significant development delays. Technology requirements
planning should include off-ramps to minimize the impact of technology abandonment.
Similarly, late safety analyses may delay design or may not be used in design decisions, resulting
in an unsafe system. In addition, some development work has to be redone when problems are
found along the way.
Engineering - Technical Personnel Resources and Experience Module:
The Engineering (Technical Personnel Resources and Experience) module keeps track of the
human resources working on ESMD projects. This module was initialized and calibrated using
employment data publicly available at NASA [NASA, 2006]. The objective is to monitor the
availability and characteristics of the technical workforce responsible for the development of the
exploration system.
Engineering - Effort and Efficacy of Technical Personnel Module: The Engineering (Effort and Efficacy of Technical Personnel) module integrates information
from various sources in the model (e.g. employment, productivity, resources, etc.) and outputs
15
the total capacity of in-house workforce to perform development work in areas of technology
development, system integration, and system development.
Design Work
Remaining
Design Work
Completed
Pending Technology
Development Tasks
Completed Technology
Development Tasks
Design Task
Completion Rate
Technology Development
Task Completion Rate
Technologies used in
DesignTechnology
Utilization Rate
Pending Hazard
Analyses
Incoming Program
Design Work
Incoming Hazard
Analysis Tasks
Incoming Technology
Development Tasks
Completed Hazard
Analyses
Hazard Analyses
used in DesignHA Completion
Rate
HA Utilization
Rate
Hazard Analyses
unused in Design
Decisions
HA Discard Rate
Abandoned
Technologies
Technology
Abandonment Rate
Design Task AllocationRate (from P/P
Management)
Technology Development TaskAllocation Rate (from P/P
Management)
Capacity for Performing
System Design Work 0Capacity for
PerformingTechnology
Development Work 0
Design SchedulePressure from
Management
Fraction of HAs Too
Late to Influence Design
Average Hazard
Analysis Quality
Average Quality of
Hazard Analyses used inDesign
Fraction of Design Tasks with
Associated Hazard Analysis
Technology Available to
be used in Design
Additional Incoming
Design Work
Progress Report to
Management
Additional Incoming Work
from Changes (from P/P
Management)
Design Work
Completed with
Undiscovered Safety
and Integration
Problems
Design Work CompletionRate with Safety and
Integration Flaws
Total Design Work
Completion Rate
Work Discovered with
Safety and Integration
Problems
Flaw Discovery
Rate
Design Work with
Accepted Problems or
UnsatisfiedRequirements
Acceptance Rate
Unplanned Rework
Decision Rate
Additional Operations Cost for Safety
and Integration Workaround
Efficacy of Safety
Assurance (SMA)
Safety Assurance
Resources
Time to Discover
Flaws
Incentives to
Report Flaws
Efficacy of System
Integration
Quality of Safety
Analyses 0
Maximum System Safety
Analysis Completion Rate
System
Performance
Apparent Work
Completed
Desired Design Task
Completion Rate
Safety of
Operational System
System Design
Overwork
Desired Safety Analysis
Completion Rate
Ability to PerformContractor Safety
Oversight 2
Fraction of Design Tasks
Completed with Safety andIntegration Flaws
Safety Rework
Technology
Development
Figure 9: Three completion flows: Technology development, System development, and Safety analysis
Safety and Mission Assurance - Effort and Efficacy of System Safety Activities Module:
The Safety and Mission Assurance module focuses on the effort and efficacy of in-house
employees working on safety activities. The purpose of the module is to determine the capacity
of safety personnel to work hand-in-hand with other engineers and technical people in order to
produce high quality, useful safety information for making design decisions.
5. Sample Analysis Results
A preliminary analysis of safety-related decision-making at ESMD was performed to provide a
demonstration of model capability, as well as initial results upon which further analyses will be
based. The initial risk analysis scenarios were created based on recommendations from the
NASA workforce. Because of space limitations, a single risk analysis scenario is presented in
this paper. Additional scenarios can be found in [Dulac, 2007].
5.1 Sample Scenario: Effect of Schedule Pressure and Safety Priority
Schedule pressure was one of the most common themes discussed by interviewees. The
Columbia Accident Investigation Board (CAIB) made it clear that the managers and engineers of
16
the shuttle program were under tremendous pressure from the NASA administration to meet the
February 2004 deadline for the Space Station to reach “core complete” configuration [Gehman,
2003]. As a NASA manager mentioned during the interviews, ESMD may feel similar pressure
as deadlines for project completion approach:
“Schedule is a major risk factor; […] what we’re trying to do in exploration is pretty aggressive
so it’s going to make it hard to not get caught in some of the same kind of [pause…] I mean
everybody is really sensitized to not caving in to budget and schedule pressures (everybody
knows) what happened on Columbia and Challenger, all of these things. Having a way to keep
that from happening again, I think it’s going to be an issue.”
A scenario was developed to investigate the impact of schedule pressure and enforcement in the
exploration development program. Management pressures were implemented in the model as a
simple proportional controller. A profile for the desired fraction of completed development was
obtained based on actual and forecasted yearly budget allocations [NASA, 2004]. The schedule
pressure applied at the program management and administration level is a function of the
difference between the measured work completed and the desired work completed at any point in
time. This simple controller framework is applied to the desired system development completion
profile, as well as the desired safety analyses completion profile.
In the current scenario, the proportional gain responsible for the application of pressure at the
program management level (when development falls behind schedule) is varied from a value of 0
to 10. Consequently, the pressure applied is simply equal to the gap in schedule completion
multiplied by a proportional gain (K). The same variation (0 to 10) applies to the safety pressure
gain, that is, the pressure applied to ensure that safety analyses are performed early enough to be
used in design decisions.
5.2 Scenario Results and Insights
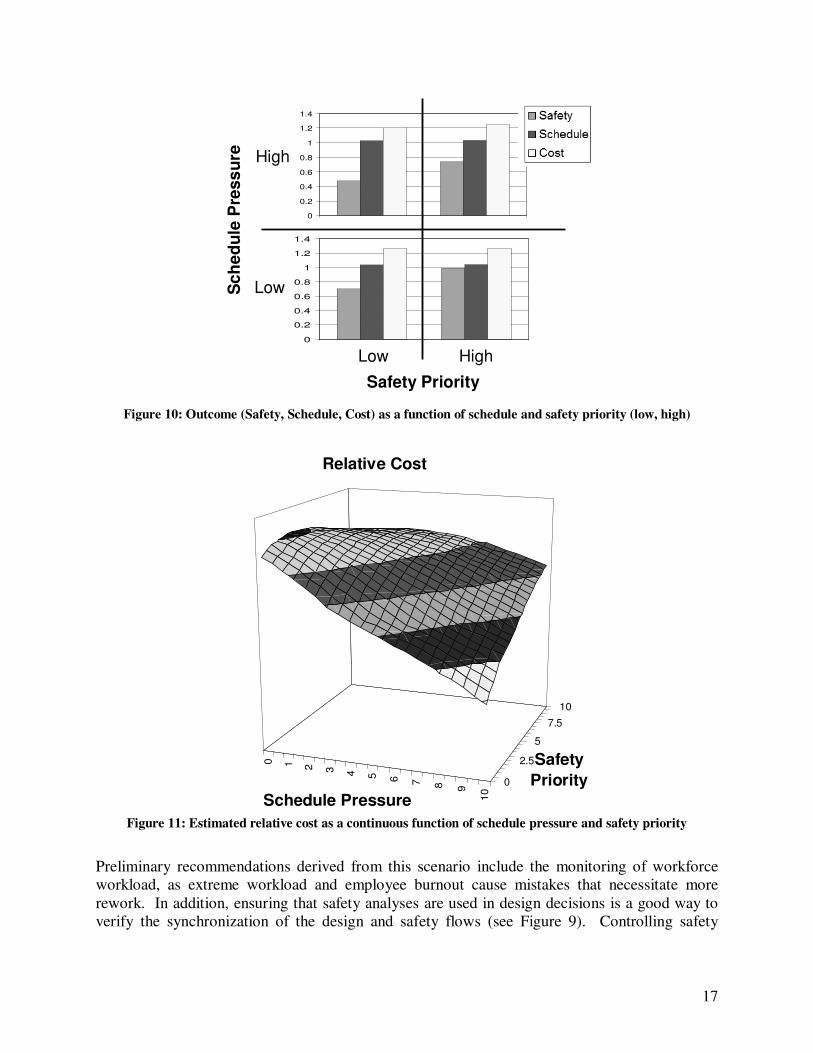
Figure 10 shows the estimated project outcomes for safety, schedule, and cost as a function of
extreme values (0:Low, 10:High) of schedule pressure and safety priority gains. As can be
observed, overly aggressive schedule enforcement has little effect on completion time (<2%) and
cost, but has a large negative impact on safety. Inversely, priority of safety activities has a large
positive impact, including a positive cost impact as less rework is required because high-quality
safety analyses were used to influence design decisions in the first place.
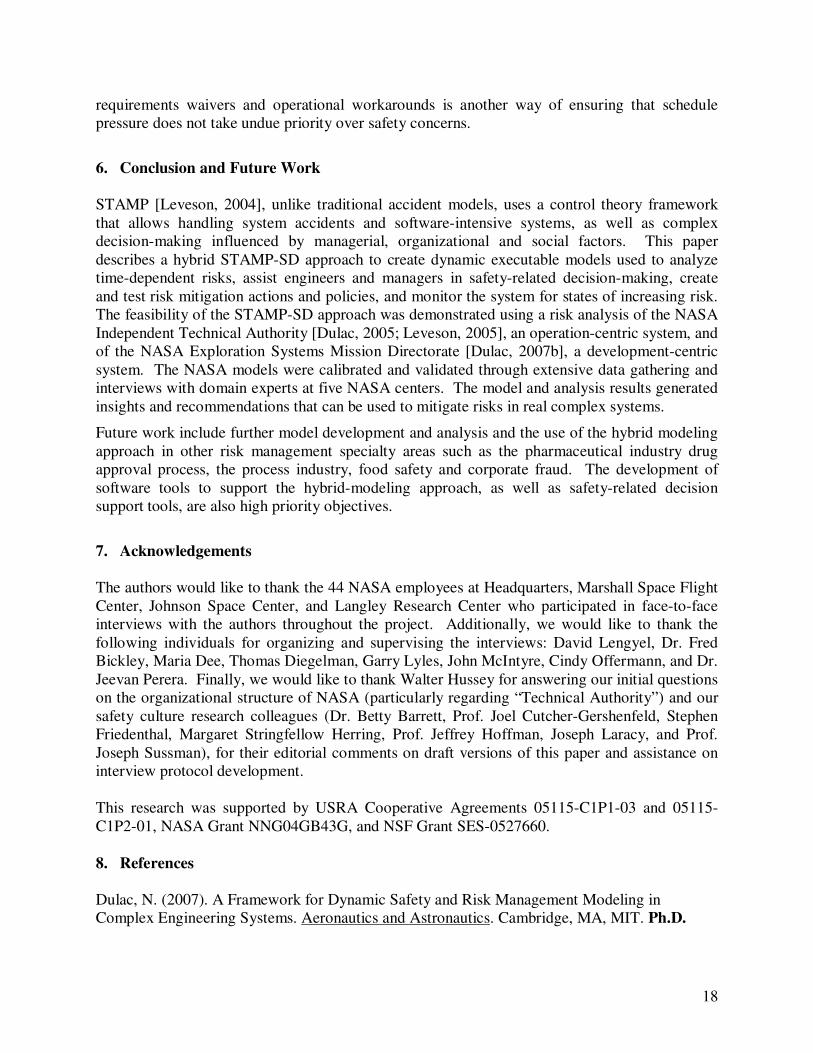
Figure 11 shows the estimated cost resulting (computed as a function of work performed, project
duration, satisfied requirements and rework fractions) from a continuous variation of the
schedule and safety gains from 0 to 10. The improvement in cost observed when the schedule
gain is low and the safety gain is high is achieved because less rework (associated with variable
and fixed costs) is necessary as the safety work was done correctly and on time. The
improvement in cost associated with high schedule pressure and low safety priority is achieved at
the detriment of safety, which means development is finished earlier (lower fixed costs) but the
final system is unsafe.
17
0
0.2
0.4
0.6
0.8
1
1.2
1.4
0
0.2
0.4
0.6
0.8
1
1.2
1.4
Safety Priority
Sc
he
du
le P
res
su
re
Low High
Low
High
Figure 10: Outcome (Safety, Schedule, Cost) as a function of schedule and safety priority (low, high)
0 1 2 3 4 5 6 7 8 9
10
0
2.5
5
7.5
10
Schedule Pressure
Safety
Priority
Relative Cost
Figure 11: Estimated relative cost as a continuous function of schedule pressure and safety priority
Preliminary recommendations derived from this scenario include the monitoring of workforce
workload, as extreme workload and employee burnout cause mistakes that necessitate more
rework. In addition, ensuring that safety analyses are used in design decisions is a good way to
verify the synchronization of the design and safety flows (see Figure 9). Controlling safety
18
requirements waivers and operational workarounds is another way of ensuring that schedule
pressure does not take undue priority over safety concerns.
6. Conclusion and Future Work
STAMP [Leveson, 2004], unlike traditional accident models, uses a control theory framework
that allows handling system accidents and software-intensive systems, as well as complex
decision-making influenced by managerial, organizational and social factors. This paper
describes a hybrid STAMP-SD approach to create dynamic executable models used to analyze
time-dependent risks, assist engineers and managers in safety-related decision-making, create
and test risk mitigation actions and policies, and monitor the system for states of increasing risk.
The feasibility of the STAMP-SD approach was demonstrated using a risk analysis of the NASA
Independent Technical Authority [Dulac, 2005; Leveson, 2005], an operation-centric system, and
of the NASA Exploration Systems Mission Directorate [Dulac, 2007b], a development-centric
system. The NASA models were calibrated and validated through extensive data gathering and
interviews with domain experts at five NASA centers. The model and analysis results generated
insights and recommendations that can be used to mitigate risks in real complex systems.
Future work include further model development and analysis and the use of the hybrid modeling
approach in other risk management specialty areas such as the pharmaceutical industry drug
approval process, the process industry, food safety and corporate fraud. The development of
software tools to support the hybrid-modeling approach, as well as safety-related decision
support tools, are also high priority objectives.
7. Acknowledgements
The authors would like to thank the 44 NASA employees at Headquarters, Marshall Space Flight
Center, Johnson Space Center, and Langley Research Center who participated in face-to-face
interviews with the authors throughout the project. Additionally, we would like to thank the
following individuals for organizing and supervising the interviews: David Lengyel, Dr. Fred
Bickley, Maria Dee, Thomas Diegelman, Garry Lyles, John McIntyre, Cindy Offermann, and Dr.
Jeevan Perera. Finally, we would like to thank Walter Hussey for answering our initial questions
on the organizational structure of NASA (particularly regarding “Technical Authority”) and our
safety culture research colleagues (Dr. Betty Barrett, Prof. Joel Cutcher-Gershenfeld, Stephen
Friedenthal, Margaret Stringfellow Herring, Prof. Jeffrey Hoffman, Joseph Laracy, and Prof.
Joseph Sussman), for their editorial comments on draft versions of this paper and assistance on
interview protocol development.
This research was supported by USRA Cooperative Agreements 05115-C1P1-03 and 05115-
C1P2-01, NASA Grant NNG04GB43G, and NSF Grant SES-0527660.
8. References
Dulac, N. (2007). A Framework for Dynamic Safety and Risk Management Modeling in
Complex Engineering Systems. Aeronautics and Astronautics. Cambridge, MA, MIT. Ph.D.
19
Dulac, N., Brandon Owens, Nancy Leveson (2007b). Demonstration of a New Dynamic
Approach to Risk Analysis for NASA’s Constellation Program. Cambridge, MA, Massachusetts
Institute of Technology.
Dulac, N., Nancy Leveson, David Zipkin, Steve Friedenthal, Joel Cutcher-Gershenfeld, John
Carroll, Betty Barrett (2005). Using System Dynamics for Safety and Risk Management in
Complex Engineering Systems. Winter Simulation Conference. Orlando, FL.
Ford, D. (1995). The Dynamics of Project Management: An Investigation of the Impacts of
Project Process and Coordination on Performance. Dynamic Engineering Systems. Cambridge,
MA, MIT. Ph.D.
Ford, D., Sterman J. D. (1998). "Dynamic Modeling of Product Development Processes."
System Dynamics Review 14(1): 31-68.
Gehman, H. (2003). Columbia Accident Investigation Report, NASA.
Leveson, N. G. (2004). "A New Accident Model for Engineering Safer Systems." Safety Science
42(4): 237–270.
Leveson, N. G. (2007). A New Approach to System Safety Engineering. Cambridge, MA,
Unpublished Manuscript.
Leveson, N. G., Nicolas Dulac (2005). Risk Analysis of NASA Independent Technical Authority.
Cambridge, MA, MIT.
Lyneis, J. M., Kenneth G. Cooper, Sharon A. Els (2001). "Strategic Management of Complex
Projects: A Case Study Using System Dynamics." System Dynamics Review 17(3).
Marais, K., Nancy G. Leveson (2003). Archetypes for Organizational Safety. Workshop on
Investigating and Reporting of Incidents and Accidents. Williamsburg, VA.
McKernan, J. (1996). Curriculum Action Research: A handbook of methods for the reflective
practitioner. London, Kogan Page.
Morecroft, J. D. W. (1983). "System Dynamics: Portraying Bounded Rationality." International
Journal of Management Science 11(2): 131-142.
NASA. (2004). "NASA Budget Request." from http://www.nasa.gov/about/budget/index.html.
NASA. (2006). "NASAPeople Website." from
http://nasapeople.nasa.gov/Workforce/data/page8.htm.
Rasmussen, J., Annelise Mark Pejtersen, L. P. Goodstein (1994). Cognitive Systems Engineering,
Wiley-Interscience.
20
Schein, E. H. (1969). Process consultation: Its role in organizational development. Reading, MA,
Addison-Wesley.
Senge, P. M. (1990). The Fifth Discipline: The Art and Practice of the Learning Organization.
New York, NY, Doubleday Currency.
Simon, H. A. (1957). Rationality and Decision-Making. Models of Man. New York, NY, John
Wiley.
Sterman, J. D. (2000). Business Dynamics: Systems Thinking and Modeling for a Complex
World. Boston, MA, Irwin McGraw-Hill.
Sterman, J. D. (2002). "All Models are Wrong: Reflections on Becoming a Systems Scientist."
System Dynamics Review 18(4): 501-531.
Vicente, K. J. (1999). Cognitive work analysis : toward safe, productive and healthy computer-
based work Mahwah, NJ, Lawrence Erlbaum Associates.