Embed Size (px)
Citation preview
A
Hybrid Analytical Modeling of Pending Cache Hits, Data Prefetching,and MSHRs1
XI E. CHENandTOR M. AAMODTUniversity of British Columbia
This paper proposes techniques to predict the performance impact of pending cache hits, hardware prefetch-ing, and miss status holding register resources on superscalar microprocessors using hybrid analytical models.The proposed models focus on timeliness of pending hits and prefetches and account for a limited numberof MSHRs. They improve modeling accuracy of pending hits by 3.9x and when modeling data prefetching, alimited number of MSHRs, or both, these techniques result in average errors of 9.5% to 17.8%. The impactof non-uniform DRAM memory latency is shown to be approximated well by using a moving average ofmemory access latency.
Categories and Subject Descriptors: C.4 [Computer Systems Organization]: Performance of Systems—modeling techniques
General Terms: Performance
Additional Key Words and Phrases: Analytical modeling, pending hit, data prefetching, miss status holdingregister
1. INTRODUCTION
To design a new microprocessor architects typically create or extensively modify a cycle-accurate simulator and run numerous simulations to quantify performance trade-offs. Bothsimulator creation or modification and data collection using the simulator can be significantcomponents of overall design-to-market time. As microprocessor design cycles stretch withincreasing transistor budgets, architects effectively start each new project with less accurate
1Extension of Conference Paper: An earlier version of the work in this paper appeared in the 41stIEEE/ACM International Symposium on Microarchitecture (MICRO’08) [Chen and Aamodt 2008]. The newmaterial in this paper consists of: (1) An analysis of the trace of mcf showing the importance of accuratelymodeling pending cache hits in pointer chasing benchmarks in Section 3.1.1 (2) A comparison of ournovel compensation technique (as described in Section 3.2) to the prior proposed fixed-cycle compensationtechniques when pending hits are modeled and SWAM is applied in Section 5.2; (3) A sensitivity analysis ofour analytical models for various instruction window sizes and fixed memory access latencies in Section 5.7(4) An evaluation of the impact of nonuniform memory access latency due to DRAM timing and contentionon the accuracy of our analytical models in Section 5.8; (5) A detailed description and analysis of the reasonthat the overall average memory access latency is not enough to achieve reasonable accuracy for analyticalmodels as well as a proposal of using average latency in short time intervals when considering DRAM timingand contention in Section 5.8.
Author’s address: Tor M. Aamodt, Department of Electrical and Computer Engineering, University ofBritish Columbia, 2356 Main Mall, Vancouver, BC, Canada V6T 1Z4.
Permission to make digital or hard copies of part or all of this work for personal or classroom use isgranted without fee provided that copies are not made or distributed for profit or commercial advantageand that copies show this notice on the first page or initial screen of a display along with the full citation.Copyrights for components of this work owned by others than ACM must be honored. Abstracting withcredit is permitted. To copy otherwise, to republish, to post on servers, to redistribute to lists, or to use anycomponent of this work in other works requires prior specific permission and/or a fee. Permissions may berequested from Publications Dept., ACM, Inc., 2 Penn Plaza, Suite 701, New York, NY 10121-0701 USA,fax +1 (212) 869-0481, or [email protected]© YYYY ACM 0000-0000/YYYY/01-ARTA $10.00DOI 10.1145/0000000.0000000 http://doi.acm.org/10.1145/0000000.0000000
ACM Journal Name, Vol. V, No. N, Article A, Publication date: January YYYY.
A:2 Xi E. Chen and Tor M. Aamodt
0
2
4
6
8
10
12
20 50 100 200 500memory access latency (cycle)
CP
I_D
$mis
s
actual baseline SWAM w/ PH
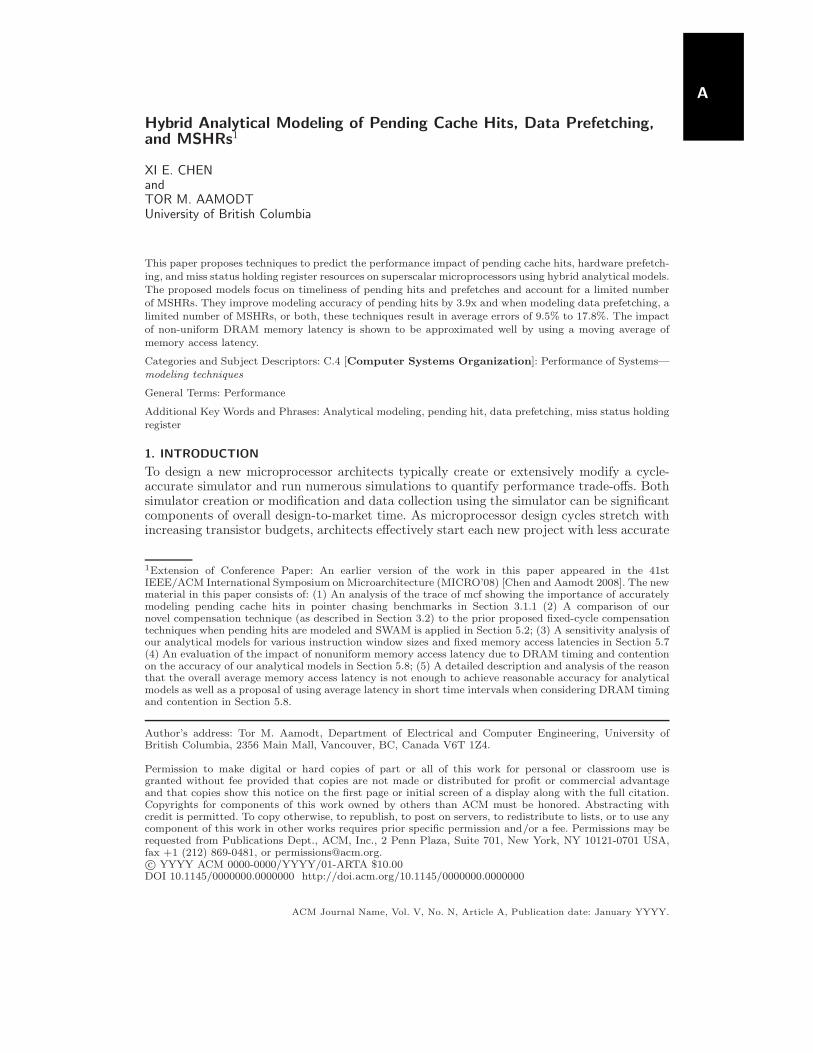
Fig. 1. Comparison of CPI component due to long data cache miss versus modeled result for mcf withdifferent memory access latencies
information about the eventual process technology that will be used, leading to designs thatmay not achieve the full potential of a given process technology node.
An orthogonal approach to obtaining performance estimates for a proposed design isanalytical modeling [Yi et al. 2006]. An analytical model employs mathematical formulasthat approximate the performance of the microprocessor being designed based upon pro-gram characteristics and microarchitectural parameters. One of the potential advantagesof analytical modeling is that it can require much less time than crafting and running aperformance simulator. Thus, when an architect has analytical models available to evaluatea given design, the models can help shorten the design cycle. While cycle-accurate simula-tor infrastructures exist that leverage re-use of modular building blocks [Emer et al. 2002;Vachharajani et al. 2002], and workload sampling [Sherwood et al. 2002; Wunderlich et al.2003] can reduce simulation time, another key advantage of analytical modeling is its abilityto provide insights that a cycle-accurate simulator may not.
Several analytical models have been proposed before [Chow 1974; MacDonald and Sig-worth 1975; Noonburg and Shen 1994; 1997; Jacob et al. 1996; Ofelt 1999; Michaud et al.1999; 2001; Karkhanis and Smith 2004; Eyerman et al. 2009] and Karkhanis and Smith’sfirst-order model [Karkhanis and Smith 2004] is relatively accurate. Their first-order modelseparately estimates the cycles per instruction (CPI) component due to branch mispredic-tions, instruction cache misses, and data cache misses, then adds each CPI component toan estimated CPI under ideal conditions to arrive at a final model for the performance of asuperscalar processor. However, little prior work has focused on analytically modeling theperformance impact of data prefetching and the performance impact of hardware supportfor a limited number of overlapping long latency data cache misses due to finite MSHRresources. In this paper we explore how to accurately model these important aspects ofmodern microprocessor designs.
One significant aspect of long latency data cache misses is the large effect of pendingdata cache hits (PH) on overall performance. In this work a pending data cache hit meansa memory reference to a cache block for which a request has already been initiated byan earlier instruction but has not yet completed (i.e., the requested block is still on itsway from memory). Accurately modeling pending data cache hits is important both forpredicting performance of out-of-order execution and prefetching in the presence of longmemory access latencies. When pending data cache hits (also referred to as pending hitslater in this article) are treated as cache hits in the first-order model, the amount of memorylevel parallelism may be overestimated. This in turn may lead to an underestimate of theperformance loss due to data cache misses.
For example, Figure 1 compares actual component of CPI due to long latency data cachemisses to the same quantity predicted as described in the next section for mcf . The first bar(actual) shows the result from a cycle-accurate simulator whose configuration is described
ACM Journal Name, Vol. V, No. N, Article A, Publication date: January YYYY.
Hybrid Analytical Modeling of Pending Cache Hits, Data Prefetching, and MSHRs A:3
in Section 4. The second bar (baseline) shows the result from a careful re-implementation ofa previously proposed hybrid analytical model [Karkhanis and Smith 2004]2. The third bar(SWAM w/ PH) illustrates the result from a new technique that we propose in this paper(see Section 3.5.1). In this figure (and throughout the rest of the paper), the CPI componentresulting from long latency data cache misses (CPID$miss) measures the total extra cyclesdue to long latency data cache misses divided by the total number of instructions committed.Figure 1 demonstrates that the underestimation is significant and the disparity grows withincreasing memory latency.
A careful consideration of the impact of pending hits is central to our approach to mod-eling data prefetching. Taking account of pending hits improves our analysis of the numberof misses that cannot be overlapped. We extend this analysis by proposing techniques tobetter select the cache misses that should be analyzed during each modeling step, furtherimproving model accuracy. As the instruction window of future microprocessors becomeslarger [Cristal et al. 2004], a limited number of Miss Status Holding Registers (MSHRs) canhave a dramatic impact on the performance of the whole system [Tuck et al. 2006]. ModelingMSHRs requires additional consideration of which cache misses can be overlapped.
This paper makes the following contributions:
— It explains why pending hits can have non-negligible impact for memory intensive appli-cations and describes how to model their effect on performance in the context of a tracedriven hybrid analytical model (Section 3.1).
— It presents a novel technique to more accurately compensate for the potential overesti-mation of CPID$miss in the context of the first-order superscalar model. This techniquederives a compensation factor based upon individual program characteristics (Section 3.2).
— It proposes a technique to model CPID$miss when a data prefetching mechanism is appliedin a microprocessor, without requiring a detailed simulator (Section 3.3).
— It describes a technique to analytically model the impact of a limited number of outstand-ing cache misses supported by a memory system (Section 3.4).
— It proposes two novel profiling techniques to better analyze overlapped data cache misses(Section 3.5).
— It also evaluates of the impact of nonuniform memory access latency due to DRAM timingand contention on the accuracy of hybrid analytical models. This illustrates the need forfurther research on more accurate memory system analytical models (Section 5.8).
The proposed approach for modeling data prefetching is evaluated by using it to predictthe performance impact of three different prefetching strategies and the average error ofis shown to be 13.8% (versus 50.5% when pending hits are treated as normal hits). Theproposed technique for modeling MSHRs reduces the arithmetic mean of the absolute errorof our baseline from 33.6% to 9.5%. As with earlier hybrid modeling approaches [Karkhanisand Smith 2004; Karkhanis 2006; Karkhanis and Smith 2007], we find our model is twoorders of magnitude faster than detailed simulations. Our improvements increase the realism(and hence applicability) of analytical models for microprocessor designers.
The rest of this paper is organized as follows. Section 2 reviews the first-ordermodel [Karkhanis 2006; Karkhanis and Smith 2004; 2007]. Section 3 describes how to ac-curately model the effects of pending data cache hits, data prefetching, and hardware that
2 Our analysis shows that pending data cache hits can significantly impact model accuracy. However,we note that the prediction error of the CPI due to long latency data cache misses we report for ourbaseline modeling technique (described in Section 2) is in some cases large relative to those reportedin [Karkhanis and Smith 2004]. Our baseline modeling technique is our implementation of the first-ordermodel described in [Karkhanis and Smith 2004] based upon the details described in that paper and thefollow-on work [Karkhanis 2006; Karkhanis and Smith 2007]. We believe the discrepancy is partly due toour use of a smaller L2 cache size of 128 KB versus 512 KB used in [Karkhanis and Smith 2004], and partlydue to their use of a technique similar to the one we describe in Section 3.5.1 [Tejas S. Karkhanis ].
ACM Journal Name, Vol. V, No. N, Article A, Publication date: January YYYY.
A:4 Xi E. Chen and Tor M. Aamodt
time
IPC
miss-event #1 miss-event #2 miss-event #3
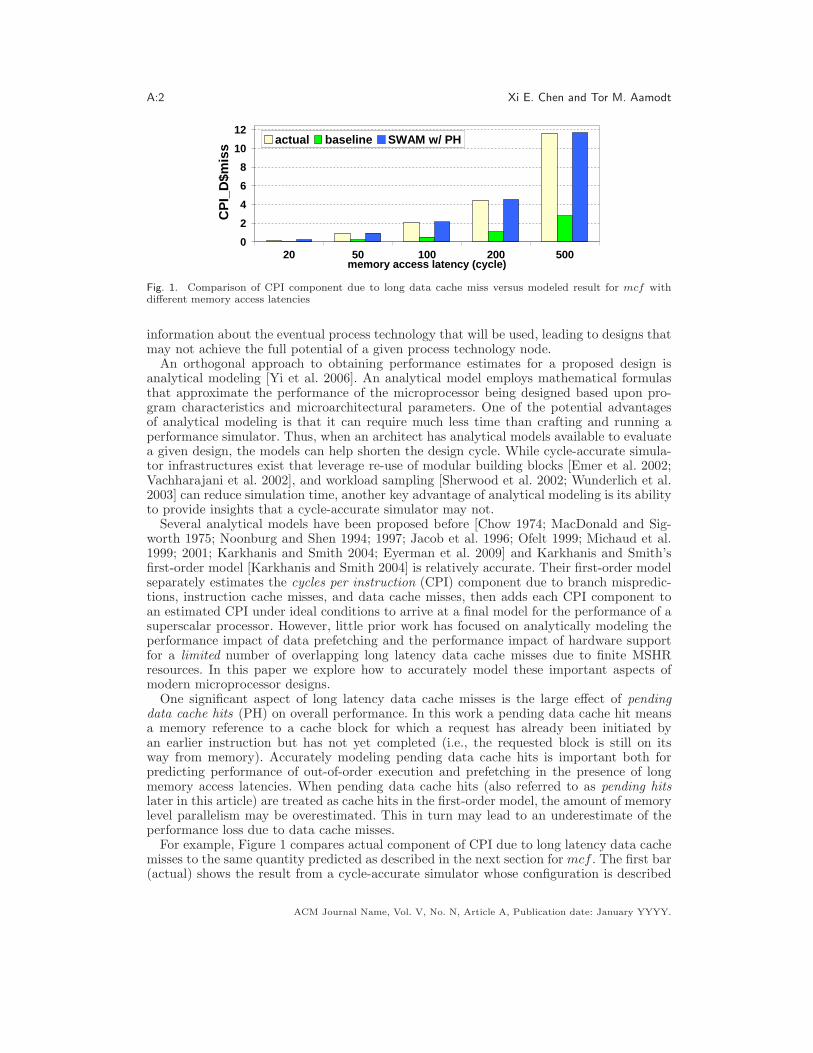
Fig. 2. Useful instructions issued per cycle (IPC) over time used in the first order model
supports a limited number of outstanding data cache misses. Section 4 describes the ex-perimental methodology and Section 5 presents and analyzes our results. Section 6 reviewsrelated work and Section 7 concludes the paper.
2. BACKGROUND: FIRST-ORDER MODEL
Before explaining the details of our techniques introduced in Section 3, it is necessary to befamiliar with the basics of the first-order model of superscalar microprocessors. Karkhanisand Smith’s first-order model [Karkhanis and Smith 2004] leverages the observation thatthe overall performance of a superscalar microprocessor can be estimated reasonably well bysubtracting the performance losses due to different types of miss-events from the processor’ssustained performance under the absence of miss-events. The miss-events considered includelong latency data cache misses (e.g., L2 cache misses for a memory system with two-levelcache hierarchy), instruction cache misses, and branch mispredictions.
Figure 2 illustrates this approach. When there are no miss-events, the performance of thesuperscalar microprocessor is approximated by a stable IPC, expressed through a constantuseful instructions issued per cycle (IPC) over time. When a miss-event occurs, the perfor-mance of the processor falls and the IPC gradually decreases to zero. After the miss-event isresolved, the decreased IPC ramps up to the stable value under ideal conditions. A carefulanalysis of this behavior leads to the first-order model [Karkhanis and Smith 2004].
While Figure 2 shows that a miss-event occurs only after the previous miss-events havebeen resolved, in a real processor it is possible for different types of miss-events to overlap.For example, a load instruction can miss in the data cache a few cycles after a branchis mispredicted. However, it has been observed that overlapping between different typesof miss-events is rare enough that ignoring it results in negligible error in typical appli-cations [Karkhanis and Smith 2004; Eyerman et al. 2006]. Figure 3 plots data from oursimulation setup that verifies this observation for our benchmarks and realistic branch pre-diction and caches. The figure compares the cycles per instruction (CPI) obtained fromour performance simulator to the CPI resulting from adding individual CPI componentsmeasured as follows. Each individual CPI component is measured as the difference in CPIwhen the impact on execution cycles is modeled versus when the structure is modeled asideal during detailed simulation.
This paper focuses on improving the accuracy of the modeled CPID$miss (i.e., CPI com-ponent due to long latency data cache misses) since it is the component with the largest errorin prior first-order models [Karkhanis 2006; Karkhanis and Smith 2004]. Note that shortlatency data cache misses (i.e., L1 data cache misses that hit in the L2 cache in this paper)are not regarded as miss-events in prior first-order models [Karkhanis 2006; Karkhanis andSmith 2004] and they are modeled as long-execution-latency instructions when modelingthe base CPI. In the rest of this paper, we use the term “cache misses” to represent longlatency data cache misses. As noted by Karkhanis and Smith [Karkhanis and Smith 2004],the interactions between microarchitectural events of the same type cannot be ignored.
Our baseline technique for modeling data cache misses, based upon Karkhanis and Smith’sfirst-order model [Karkhanis and Smith 2004], analyzes dynamic instruction traces createdby a cache simulator. To differentiate such models, which analyze instruction traces, fromearlier analytical models [Chow 1974; MacDonald and Sigworth 1975; Agarwal et al. 1989;
ACM Journal Name, Vol. V, No. N, Article A, Publication date: January YYYY.

Hybrid Analytical Modeling of Pending Cache Hits, Data Prefetching, and MSHRs A:5
0
2
4
6
8
10
app art eqk luc swm mcf em hth prm lbmC
PI
Base Branch Mispred. I$ Miss D$ Miss actual
Fig. 3. Comparison of the actual CPI to the CPI modeled by accumulating CPI components dueto each miss-event in addition to the ideal CPI
Noonburg and Shen 1994; Jacob et al. 1996; Noonburg and Shen 1997] that do not, wealso refer to them as hybrid analytical models in this paper. In each profile step, a ROBsize
number of consecutive instructions in the trace are put into the profiling window (or block)and analyzed, where ROBsize is the size of the re-order buffer. If all of the loads missingin the data cache in a profile step are data independent of each other, they are consideredoverlapped (i.e., the overlapped misses have the same performance impact as a single miss).When data dependencies exist between misses, the maximum number of misses in the samedata dependency chain is recorded and the execution of all the other misses are modeled tobe hidden under this dependency chain. The reason for limiting the profile window to thesize of the reorder buffer is that long latency memory accesses can only overlap if they arein the reorder buffer simultaneously. Increasing the profile window size further might resultin an overestimate of memory level parallelism.
In the rest of this paper, num serialized D$miss represents the sum of the maximumnumber of misses measured in any single data dependency chain in a block of instructions,accumulated over all blocks making up the entire instruction trace. When all instructionsin the trace have been analyzed, the CPID$miss can be estimated as
CPID$miss =num serialized D$miss × mem lat
total num instructions(1)
where mem lat stands for the main memory latency and total num instructions is thetotal number of instructions committed (of any type).
The CPID$miss modeled in Equation 1 often overestimates the actual CPID$miss sinceout-of-order execution enables overlap of computation with long latency misses. A simplesolution proposed by Karkhanis and Smith [Karkhanis and Smith 2004] is to subtract afixed number of cycles per serialized data cache miss based upon ROB size to compensate.The intuition for this compensation is that when a load issues and accesses the cache, it canbe the oldest instruction in the ROB, the youngest instruction in the ROB, or somewhere inbetween. If the instruction is the oldest or nearly the oldest, the performance loss (penaltyof the instruction) is the main memory latency. On the other hand, if the instruction isthe youngest or nearly the youngest one in the ROB and the ROB is full, its penalty canbe partially hidden by the cycles required to drain all instructions before it, and can beapproximated as mem lat − ROBsize
issue width[Karkhanis and Smith 2004].
It has been observed that loads missing in the cache are usually relatively old whenthey issue [Karkhanis and Smith 2004]; and thus, perhaps the simplest (though not mostaccurate) approach is to use no compensation at all [Karkhanis and Smith 2004]. The mid-point of the two extremes mentioned above can also be used (i.e., a load missing in the cacheis assumed to be in the middle of ROB when it issues), and the numerator in Equation 1becomes num serialized D$miss × (mem lat − ROBsize
2×issue width) [Karkhanis 2006].
ACM Journal Name, Vol. V, No. N, Article A, Publication date: January YYYY.
A:6 Xi E. Chen and Tor M. Aamodt
i1: LD, R1, 0(R2) miss (Block A)
i2: LD, R3, 4(R2) pending hit (Block A)
i3: LD, R4, 0(R3) miss (Block B)
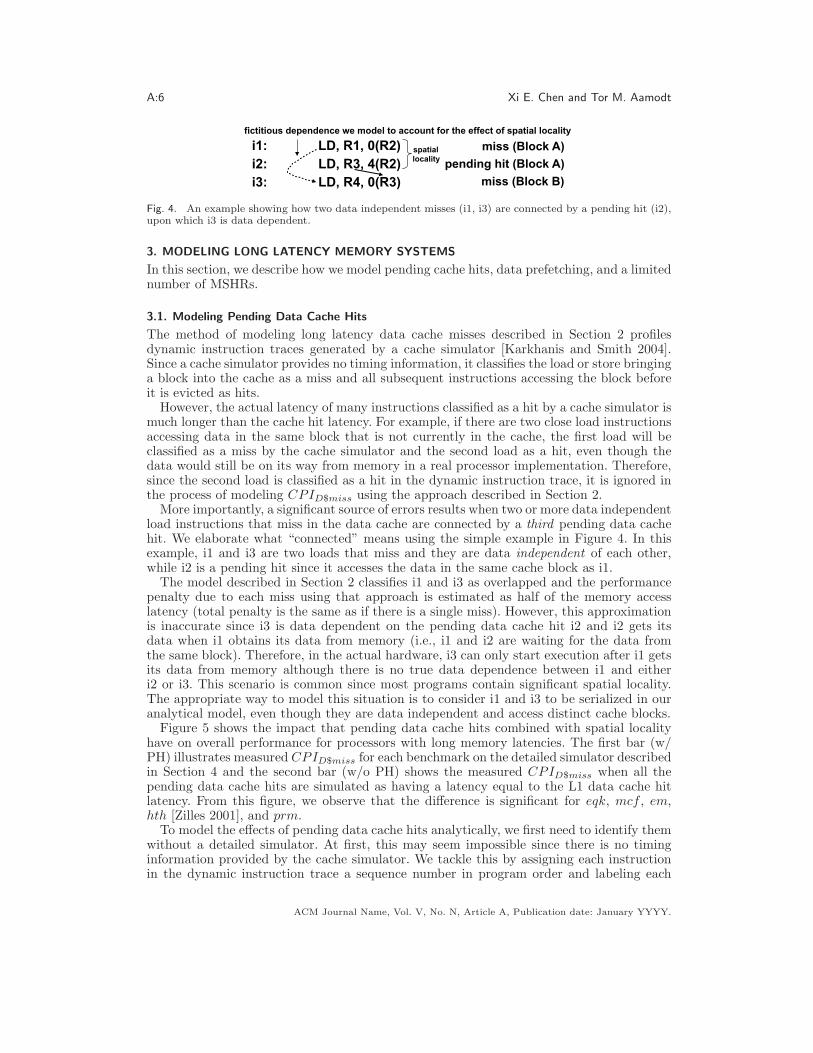
fictitious dependence we model to account for the effect of spatial locality
spatiallocality
Fig. 4. An example showing how two data independent misses (i1, i3) are connected by a pending hit (i2),upon which i3 is data dependent.
3. MODELING LONG LATENCY MEMORY SYSTEMS
In this section, we describe how we model pending cache hits, data prefetching, and a limitednumber of MSHRs.
3.1. Modeling Pending Data Cache Hits
The method of modeling long latency data cache misses described in Section 2 profilesdynamic instruction traces generated by a cache simulator [Karkhanis and Smith 2004].Since a cache simulator provides no timing information, it classifies the load or store bringinga block into the cache as a miss and all subsequent instructions accessing the block beforeit is evicted as hits.
However, the actual latency of many instructions classified as a hit by a cache simulator ismuch longer than the cache hit latency. For example, if there are two close load instructionsaccessing data in the same block that is not currently in the cache, the first load will beclassified as a miss by the cache simulator and the second load as a hit, even though thedata would still be on its way from memory in a real processor implementation. Therefore,since the second load is classified as a hit in the dynamic instruction trace, it is ignored inthe process of modeling CPID$miss using the approach described in Section 2.
More importantly, a significant source of errors results when two or more data independentload instructions that miss in the data cache are connected by a third pending data cachehit. We elaborate what “connected” means using the simple example in Figure 4. In thisexample, i1 and i3 are two loads that miss and they are data independent of each other,while i2 is a pending hit since it accesses the data in the same cache block as i1.
The model described in Section 2 classifies i1 and i3 as overlapped and the performancepenalty due to each miss using that approach is estimated as half of the memory accesslatency (total penalty is the same as if there is a single miss). However, this approximationis inaccurate since i3 is data dependent on the pending data cache hit i2 and i2 gets itsdata when i1 obtains its data from memory (i.e., i1 and i2 are waiting for the data fromthe same block). Therefore, in the actual hardware, i3 can only start execution after i1 getsits data from memory although there is no true data dependence between i1 and eitheri2 or i3. This scenario is common since most programs contain significant spatial locality.The appropriate way to model this situation is to consider i1 and i3 to be serialized in ouranalytical model, even though they are data independent and access distinct cache blocks.
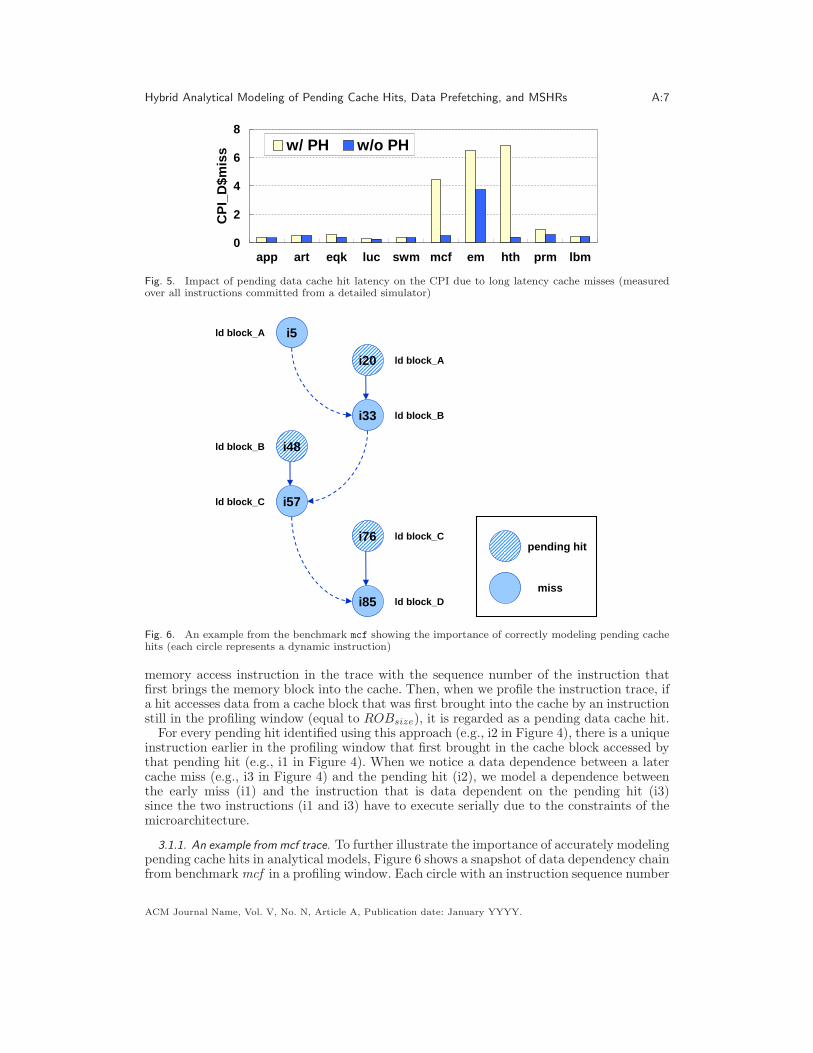
Figure 5 shows the impact that pending data cache hits combined with spatial localityhave on overall performance for processors with long memory latencies. The first bar (w/PH) illustrates measured CPID$miss for each benchmark on the detailed simulator describedin Section 4 and the second bar (w/o PH) shows the measured CPID$miss when all thepending data cache hits are simulated as having a latency equal to the L1 data cache hitlatency. From this figure, we observe that the difference is significant for eqk, mcf , em,hth [Zilles 2001], and prm.
To model the effects of pending data cache hits analytically, we first need to identify themwithout a detailed simulator. At first, this may seem impossible since there is no timinginformation provided by the cache simulator. We tackle this by assigning each instructionin the dynamic instruction trace a sequence number in program order and labeling each
ACM Journal Name, Vol. V, No. N, Article A, Publication date: January YYYY.
Hybrid Analytical Modeling of Pending Cache Hits, Data Prefetching, and MSHRs A:7
0
2
4
6
8
app art eqk luc swm mcf em hth prm lbm
CP
I_D
$mis
s w/ PH w/o PH
Fig. 5. Impact of pending data cache hit latency on the CPI due to long latency cache misses (measuredover all instructions committed from a detailed simulator)
i5
i20
i33
i48
i57
i76
i85
ld block_A
ld block_B
ld block_C
ld block_A
ld block_B
ld block_C
ld block_D
pending hit
miss
Fig. 6. An example from the benchmark mcf showing the importance of correctly modeling pending cachehits (each circle represents a dynamic instruction)
memory access instruction in the trace with the sequence number of the instruction thatfirst brings the memory block into the cache. Then, when we profile the instruction trace, ifa hit accesses data from a cache block that was first brought into the cache by an instructionstill in the profiling window (equal to ROBsize), it is regarded as a pending data cache hit.
For every pending hit identified using this approach (e.g., i2 in Figure 4), there is a uniqueinstruction earlier in the profiling window that first brought in the cache block accessed bythat pending hit (e.g., i1 in Figure 4). When we notice a data dependence between a latercache miss (e.g., i3 in Figure 4) and the pending hit (i2), we model a dependence betweenthe early miss (i1) and the instruction that is data dependent on the pending hit (i3)since the two instructions (i1 and i3) have to execute serially due to the constraints of themicroarchitecture.
3.1.1. An example from mcf trace. To further illustrate the importance of accurately modelingpending cache hits in analytical models, Figure 6 shows a snapshot of data dependency chainfrom benchmark mcf in a profiling window. Each circle with an instruction sequence number
ACM Journal Name, Vol. V, No. N, Article A, Publication date: January YYYY.
A:8 Xi E. Chen and Tor M. Aamodt
in Figure 6 represents a dynamic instruction in the trace (note only relevant instructionsare shown in the figure). Shaded circles stand for loads that miss in the data cache andcircles filled with hatching represent pending cache hits.
In this figure i20 is a pending cache hit because it accesses data on the same block asi5 (i.e., block A). There is a true data dependency between i20 and i33 (denoted by thesolid arrow line from i20 to i33) since i33 needs data from i20 to calculate its effectiveaddress due to the pointer chasing behavior in mcf ; therefore, although there is no truedata dependency between i5 and i33, their executions must be serialized (denoted by thebroken arrow line from i5 to i33) since they are connected by the pending hit i20. In otherwords, i5 and i33 should be considered to be on the same data dependency chain whenupdating num serialized D$miss after this profile step. In this common example in mcf,a similar pattern repeats seven times in a 256-entry profiling window (note Figure 6 onlyshows three repetitions) and num serialized D$miss should be incremented by eight sinceexecutions of the eight loads that miss in the cache (e.g., i5, i33, i57, and i85 in Figure 6)are serialized.
On the other hand, if the pending cache hits (e.g., i20) are not modeled (e.g., by includingthe broken arrow lines in Figure 6) then executions of all the loads that miss in the datacache are modeled as being overlapped when assuming no limit to the maximum numberof outstanding cache misses3. Then, num serialized D$miss will only be incremented byone after the profile step, significantly underestimating the impact on CPI resulting fromlong latency data cache misses.
3.2. Accurate Exposed Miss Penalty Compensation
While the model described in Section 2 uses a fixed number of cycles to adjust the modeledCPID$miss, we found that compensation with a fixed number of cycles (a constant ratioof the reorder buffer size) does not provide consistently accurate compensation for all ofthe benchmarks that we studied, resulting in large modeling errors (see Figure 12). Tocapture the distinct distribution of long latency data cache misses of each benchmark, wepropose a novel compensation method. The new method is motivated by our observationthat the number of cycles hidden for a load missing in the cache is roughly proportionalto the distance between the load and the immediately preceding load that missed in thecache (we define the distance between two instructions to be the difference between theirinstruction sequence number). This is because when a load instruction misses in the cache,most of the instructions between that load and the immediately preceding long latency missare independent of that load. Therefore, we approximate the latency of the later load thatcan be overlapped with useful computation as the time used to drain those intermediateinstructions from the instruction window, which we estimate as the distance between thetwo loads divided by the issue width. When we profile an instruction trace, the averagedistance between two consecutive loads missing in the cache is also collected and used toadjust the modeled CPID$miss. If the distance between two misses exceeds the window size,it is truncated since the miss latency can be overlapped by at most ROBsize−1 instructions.
Equation 2, below, shows how the CPID$miss is adjusted by subtracting a compensationterm, dist
issue width× num D$miss, from the numerator in Equation 1.
CPID$miss =num serialized D$miss × mem lat − comp
total num instructions
comp = (dist
issue width× num D$miss ) (2)
3The case when the number of outstanding cache misses is limited is discussed in detail in Section 3.4
ACM Journal Name, Vol. V, No. N, Article A, Publication date: January YYYY.
Hybrid Analytical Modeling of Pending Cache Hits, Data Prefetching, and MSHRs A:9
if ( the instruction (crntInst) is a pending hit (e.g., i8 in Fig 8) ) {
find the most recent instruction (prevInst) in profiling window (e.g., i6 in Fig 8) that brings crntInst’s required data into the cache
crntInst.lat = max(memLat - (crntInst.iseq – prevInst.iseq) / issueWidth, 0) // calculate the latency of the current instruction
crntInst.lat = crntInst.lat / memLat // normalize the crntInst.lat to the memory latency
crntInst.length = max(inst.length) where inst is an instruction on which crntInst directly depends
(true data dependency exists, e.g., i7 ! i8 in Fig 8)
if (crntInst.length < prevInst.length – prevInst.lat) {
crntInst.length = critInst.length + 1
crntInst.lat = 1
} else {
accmLength = prevInst.length – prevInst.lat + crntInst.lat
if (accmLength > crntInst.length) {
crntInst.lat = accmLength – crntInst.length
crntInst.length = accmLength
}
else
crntInst.lat = 0
}
}
Notation
crntInst: the current instruction being analyzed
prevInst: the instruction bringing the data required
by the current instruction into the cache
crntInst.iseq: the instruction sequence number of
the current instruction
issueWidth: the issue width of the microprocessor
memLat: the memory access latency
crntInst.lat: the normalized time interval between
the issue and the writeback of the current instruction
crntInst.length: the normalized length of the data
dependency chain up to the current instruction
C
B
A
timelyprefetch
tardy prefetch
estimated hidden latency
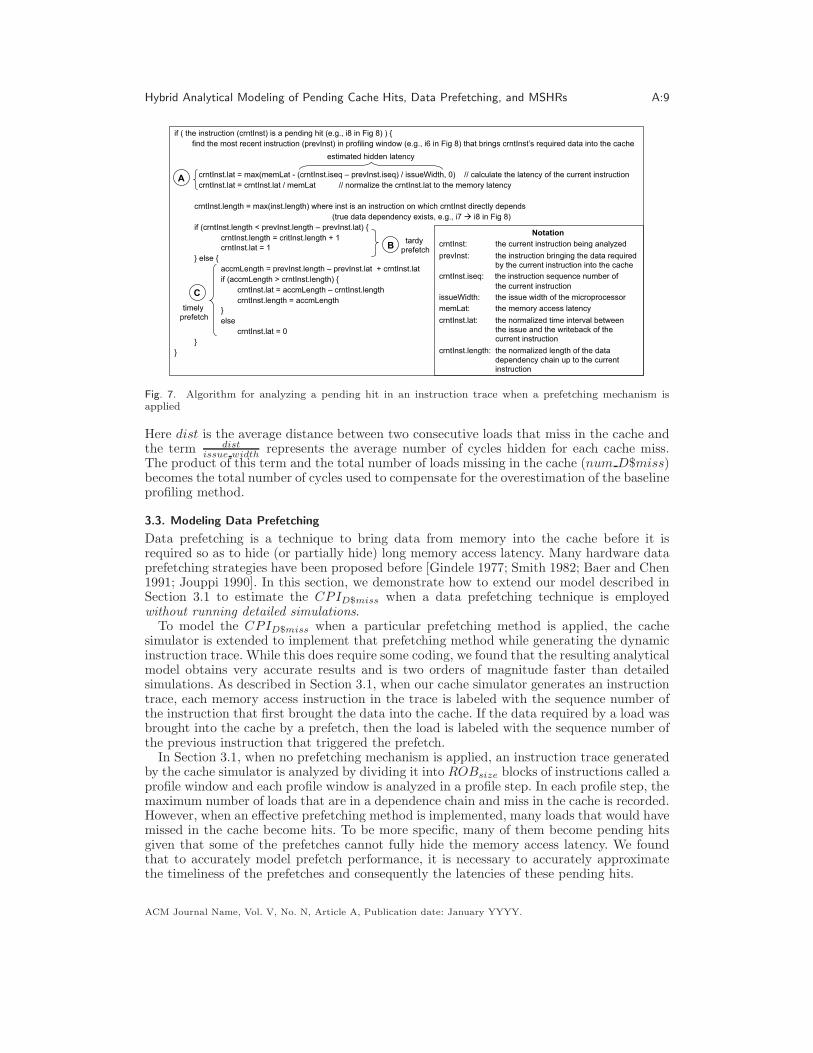
Fig. 7. Algorithm for analyzing a pending hit in an instruction trace when a prefetching mechanism isapplied
Here dist is the average distance between two consecutive loads that miss in the cache andthe term dist
issue widthrepresents the average number of cycles hidden for each cache miss.
The product of this term and the total number of loads missing in the cache (num D$miss)becomes the total number of cycles used to compensate for the overestimation of the baselineprofiling method.
3.3. Modeling Data Prefetching
Data prefetching is a technique to bring data from memory into the cache before it isrequired so as to hide (or partially hide) long memory access latency. Many hardware dataprefetching strategies have been proposed before [Gindele 1977; Smith 1982; Baer and Chen1991; Jouppi 1990]. In this section, we demonstrate how to extend our model described inSection 3.1 to estimate the CPID$miss when a data prefetching technique is employedwithout running detailed simulations.
To model the CPID$miss when a particular prefetching method is applied, the cachesimulator is extended to implement that prefetching method while generating the dynamicinstruction trace. While this does require some coding, we found that the resulting analyticalmodel obtains very accurate results and is two orders of magnitude faster than detailedsimulations. As described in Section 3.1, when our cache simulator generates an instructiontrace, each memory access instruction in the trace is labeled with the sequence number ofthe instruction that first brought the data into the cache. If the data required by a load wasbrought into the cache by a prefetch, then the load is labeled with the sequence number ofthe previous instruction that triggered the prefetch.
In Section 3.1, when no prefetching mechanism is applied, an instruction trace generatedby the cache simulator is analyzed by dividing it into ROBsize blocks of instructions called aprofile window and each profile window is analyzed in a profile step. In each profile step, themaximum number of loads that are in a dependence chain and miss in the cache is recorded.However, when an effective prefetching method is implemented, many loads that would havemissed in the cache become hits. To be more specific, many of them become pending hitsgiven that some of the prefetches cannot fully hide the memory access latency. We foundthat to accurately model prefetch performance, it is necessary to accurately approximatethe timeliness of the prefetches and consequently the latencies of these pending hits.
ACM Journal Name, Vol. V, No. N, Article A, Publication date: January YYYY.
A:10 Xi E. Chen and Tor M. Aamodt
i2
i3
i5 i6
i7 i8
i1
i4
i1.length = 1
i2.length = 0
i3.length = 1
i4.length = 1
i5.length = 2 i6.length = 2
i7.length = 1 i8.length = 2 + i8.lat
prefetch
should be 1+i8.lat
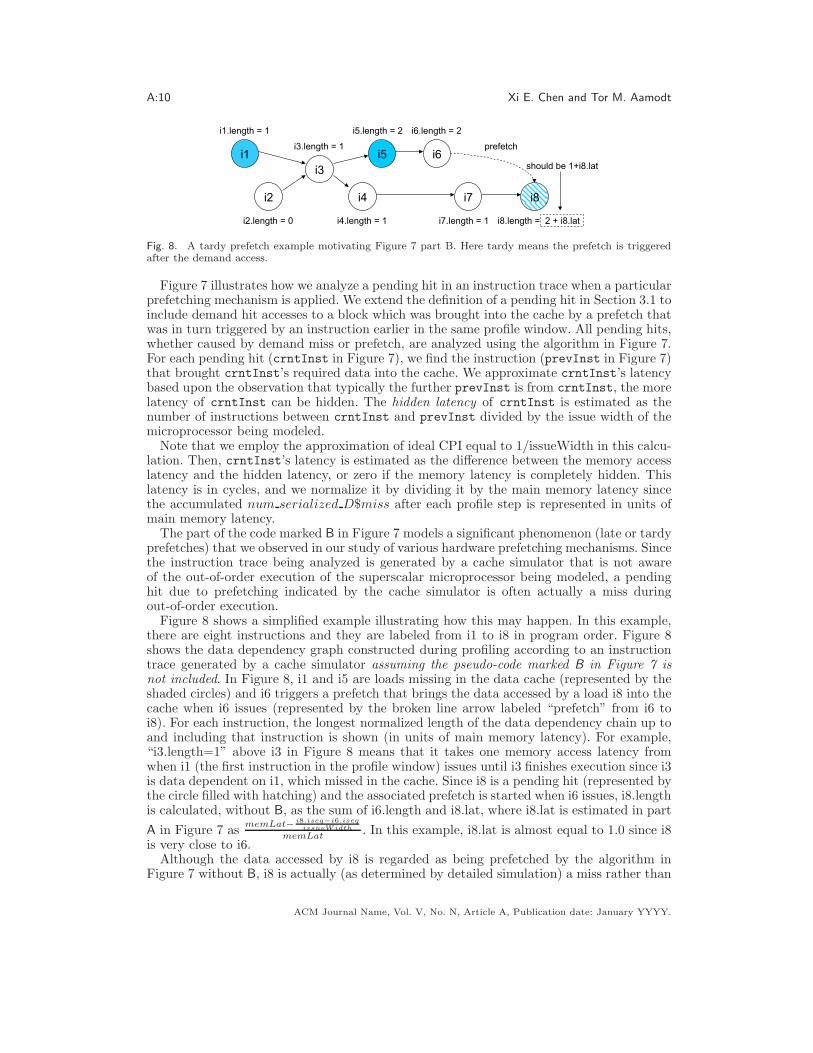
Fig. 8. A tardy prefetch example motivating Figure 7 part B. Here tardy means the prefetch is triggeredafter the demand access.
Figure 7 illustrates how we analyze a pending hit in an instruction trace when a particularprefetching mechanism is applied. We extend the definition of a pending hit in Section 3.1 toinclude demand hit accesses to a block which was brought into the cache by a prefetch thatwas in turn triggered by an instruction earlier in the same profile window. All pending hits,whether caused by demand miss or prefetch, are analyzed using the algorithm in Figure 7.For each pending hit (crntInst in Figure 7), we find the instruction (prevInst in Figure 7)that brought crntInst’s required data into the cache. We approximate crntInst’s latencybased upon the observation that typically the further prevInst is from crntInst, the morelatency of crntInst can be hidden. The hidden latency of crntInst is estimated as thenumber of instructions between crntInst and prevInst divided by the issue width of themicroprocessor being modeled.
Note that we employ the approximation of ideal CPI equal to 1/issueWidth in this calcu-lation. Then, crntInst’s latency is estimated as the difference between the memory accesslatency and the hidden latency, or zero if the memory latency is completely hidden. Thislatency is in cycles, and we normalize it by dividing it by the main memory latency sincethe accumulated num serialized D$miss after each profile step is represented in units ofmain memory latency.
The part of the code marked B in Figure 7 models a significant phenomenon (late or tardyprefetches) that we observed in our study of various hardware prefetching mechanisms. Sincethe instruction trace being analyzed is generated by a cache simulator that is not awareof the out-of-order execution of the superscalar microprocessor being modeled, a pendinghit due to prefetching indicated by the cache simulator is often actually a miss duringout-of-order execution.
Figure 8 shows a simplified example illustrating how this may happen. In this example,there are eight instructions and they are labeled from i1 to i8 in program order. Figure 8shows the data dependency graph constructed during profiling according to an instructiontrace generated by a cache simulator assuming the pseudo-code marked B in Figure 7 isnot included. In Figure 8, i1 and i5 are loads missing in the data cache (represented by theshaded circles) and i6 triggers a prefetch that brings the data accessed by a load i8 into thecache when i6 issues (represented by the broken line arrow labeled “prefetch” from i6 toi8). For each instruction, the longest normalized length of the data dependency chain up toand including that instruction is shown (in units of main memory latency). For example,“i3.length=1” above i3 in Figure 8 means that it takes one memory access latency fromwhen i1 (the first instruction in the profile window) issues until i3 finishes execution since i3is data dependent on i1, which missed in the cache. Since i8 is a pending hit (represented bythe circle filled with hatching) and the associated prefetch is started when i6 issues, i8.lengthis calculated, without B, as the sum of i6.length and i8.lat, where i8.lat is estimated in part
A in Figure 7 asmemLat−
i8.iseq−i6.iseq
issueWidth
memLat. In this example, i8.lat is almost equal to 1.0 since i8
is very close to i6.Although the data accessed by i8 is regarded as being prefetched by the algorithm in
Figure 7 without B, i8 is actually (as determined by detailed simulation) a miss rather than
ACM Journal Name, Vol. V, No. N, Article A, Publication date: January YYYY.

Hybrid Analytical Modeling of Pending Cache Hits, Data Prefetching, and MSHRs A:11
i86
i2
i3 i4
i83
i84
i85 i245
i1
i1.length = 1
i2.length = 0
i3.length = 1
i4.length = 2
i84.length = 2
i85.length = 2
i86.length = 2
i245.length = 2.8
i83.length = 2 prefetch
prefetch
Fig. 9. A timely prefetch example to illustrate application of Figure 7 part C. Here timely means theprefetch is initiated before the demand access.
.
a pending hit due to out-of-order execution. In Figure 8, we observe that i6.length is biggerthan i7.length. Therefore, before i6 (e.g., a load instruction) issues (and hence triggers ahardware generated prefetch), i8 has already issued and missed in the data cache. Thus, theprefetch provides no benefit. The code marked B in Figure 7 accurately takes account ofthis significant effect of out-of-order scheduling by checking if crntInst (i8) issues before theprefetch is triggered. We observed that removing part B in Figure 7 increases the averageerror for the three prefetching techniques that we model from 13.8% to 21.4% while addingpart B slows our model by less than 2%.
An example in Figure 9 shows how the part of code marked C in Figure 7 models the casewhen a useful prefetch occurs in out-of-order execution (i.e., a prefetch which lowers CPI).In Figure 9, only nine relevant instructions are shown out of the 256 instructions includedin a profile window (assuming ROBsize is 256). Among these nine instructions, i1 and i4are loads that miss in the data cache and both i3 and i85 trigger prefetches, making i83 andi245, respectively, pending hits.
The number of cycles hidden in the prefetch triggered by i3 is estimated asi83.iseq−i3.iseq
issueWidth= 83−3
4= 20 (when issue width is four), and then the remaining latency
after normalization is calculated as memLat−20memLat
= 0.9 (we assume throughout our examplesthat memory access latency is 200 cycles). However, since i83 is data dependent on i4 andi4.length=2, when i83 issues, its prefetched data has already arrived at the data cache andits real latency becomes zero (this case corresponds to the “else part” inside of part C inFigure 7).
The number of cycles hidden by the prefetch for i245 is estimated (from part A in Figure 7)
as i245.iseq−i85.iseq
issueWidth= 245−85
4= 40 with remaining normalized latency of memLat−40
memLat= 0.8.
Since the instruction triggering the prefetch (i85) and the instruction that i245 directlydepends on (i86) finish execution around the same time (i.e., i85.length=i86.length),i245.length becomes 2.8 and i245.lat becomes 0.8 (this case corresponds to the “if part”inside of part C in Figure 7).
We note that the importance of modeling pending hits may decrease as the fraction ofprefetch requests that are timely increases.
3.4. Modeling a Limited Number of MSHRs
The method of analytically modeling the CPI due to long latency data cache misses de-scribed in Section 2 assumes that at most ROBsize cache misses can be overlapped. However,this assumption is unreasonable for most modern processors since the maximum numberof outstanding cache misses the system supports is limited by the number of Miss StatusHolding Registers (MSHRs) [Kroft 1981; Farkas et al. 1995; Belayneh and Kaeli 1996] inthe processor. In a real processor, the issue of memory operations to the memory systemhas to stall when available MSHRs run out.
ACM Journal Name, Vol. V, No. N, Article A, Publication date: January YYYY.

A:12 Xi E. Chen and Tor M. Aamodt
Profiling Window
i1 i2 i3 i4 i5 i6 i7 i8 i9 i10
i1
i3
i2
i4
i5 i8
i10
next profile stepstarts here
i7
i6
i9ROB Size
Fig. 10. An example showing profiling with ROBsize = 8 and NMSHR = 4. Each arrow corresponds to adynamic instruction in the trace. Data cache misses are filled with patterns. Corresponding data dependencygraph is shown to the right.
Based upon the technique described in Section 2, the profiling window with the same sizeas the instruction window is always assumed to be full when modeling CPID$miss. In orderto model a limited number of outstanding cache misses, we need to refine this assumption.During a profile step, we first stop putting instructions into the profiling window when thenumber of instructions that miss in the data cache and have been analyzed is equal toNMSHR (number of MSHRs) and then update num serialized D$miss only based uponthose instructions that have been analyzed to that point4.
Figure 10 illustrates how the profiling technique works when the number of out-standing cache misses supported is limited to four. Once we encounter NMSHR (four)cache misses in the instruction trace (i.e., i1, i2, i4, and i6), the profile step stops andnum serialized D$miss is updated (i.e., the profiling window is made shorter). In the ex-ample, the four misses are data independent of each other (and not connected with eachother via a pending hit as described in Section 3.1), thus num serialized D$miss is incre-mented by only one. Although i7 also misses in the cache, it is included in the next profilewindow since all four MSHRs have been used.
3.5. Profiling Window Selection
In this section, we present two important refinements to the profiling technique described inSection 2 (which we will refer to hereafter as plain profiling) to better model the overlappingbetween cache misses.
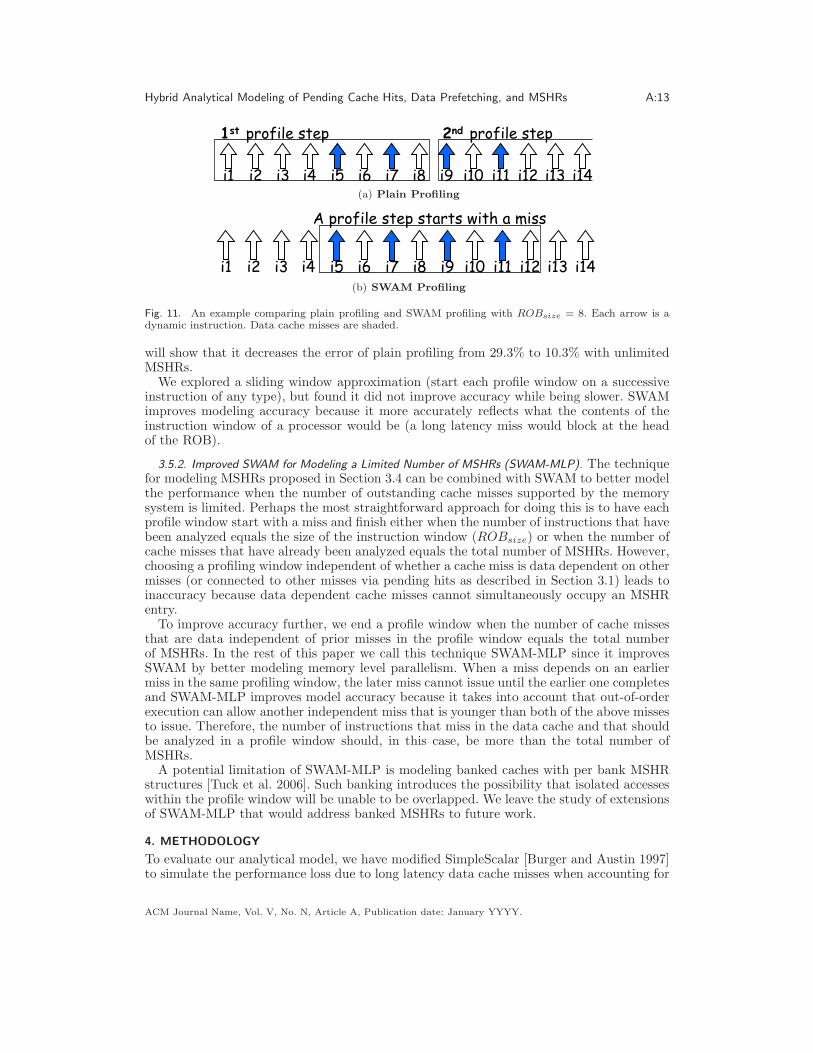
3.5.1. Start-With-A-Miss (SWAM) Profiling. We observe that often the plain profiling tech-nique described in Section 2 does not account for all of the cache misses that can be over-lapped, due to the simple way in which it partitions an instruction trace. Figure 11(a) showsan example. In this example, we assume that all the cache misses (shaded arrows) are dataindependent of each other for simplicity. Using the profiling approach described in Section 2,a profile step starts at pre-determined instructions based upon multiples of ROBsize (forexample, i1, i9, i17..., when ROBsize is eight and the first instruction is i1). Therefore,although the latency of i5, i7, i9, and i11 can be overlapped, the plain profiling techniquedoes not account for this.
By making each profile window start with a cache miss, we find that the accuracy ofthe model improves significantly. Figure 11(b) illustrates this idea. Rather than starting aprofile window with i1, we start a profile window with i5, so that the profiling window willinclude i5 to i12. Then, the next profile window will seek and start with the first cache missafter i12. We call this technique start-with-a-miss (SWAM) profiling and in Section 5.1 we
4 In real execution, cache misses that are regarded as not present in the profiling window simultaneouslydue to lack of available MSHRs could actually be in the instruction window simultaneously. Reducing theprofiling window size only approximates the performance loss due to a limited number of MSHRs. Weleverage this observation in Section 3.5.2.
ACM Journal Name, Vol. V, No. N, Article A, Publication date: January YYYY.
Hybrid Analytical Modeling of Pending Cache Hits, Data Prefetching, and MSHRs A:13
1st profile step
i1 i2 i3 i4 i5 i6 i7 i8 i9 i10 i11 i12 i13 i14
2nd profile step
(a) Plain Profiling
i9 i10i1 i2 i3 i4 i5 i6 i7 i8 i11 i12 i13 i14
A profile step starts with a miss
(b) SWAM Profiling
Fig. 11. An example comparing plain profiling and SWAM profiling with ROBsize = 8. Each arrow is adynamic instruction. Data cache misses are shaded.
will show that it decreases the error of plain profiling from 29.3% to 10.3% with unlimitedMSHRs.
We explored a sliding window approximation (start each profile window on a successiveinstruction of any type), but found it did not improve accuracy while being slower. SWAMimproves modeling accuracy because it more accurately reflects what the contents of theinstruction window of a processor would be (a long latency miss would block at the headof the ROB).
3.5.2. Improved SWAM for Modeling a Limited Number of MSHRs (SWAM-MLP). The techniquefor modeling MSHRs proposed in Section 3.4 can be combined with SWAM to better modelthe performance when the number of outstanding cache misses supported by the memorysystem is limited. Perhaps the most straightforward approach for doing this is to have eachprofile window start with a miss and finish either when the number of instructions that havebeen analyzed equals the size of the instruction window (ROBsize) or when the number ofcache misses that have already been analyzed equals the total number of MSHRs. However,choosing a profiling window independent of whether a cache miss is data dependent on othermisses (or connected to other misses via pending hits as described in Section 3.1) leads toinaccuracy because data dependent cache misses cannot simultaneously occupy an MSHRentry.
To improve accuracy further, we end a profile window when the number of cache missesthat are data independent of prior misses in the profile window equals the total numberof MSHRs. In the rest of this paper we call this technique SWAM-MLP since it improvesSWAM by better modeling memory level parallelism. When a miss depends on an earliermiss in the same profiling window, the later miss cannot issue until the earlier one completesand SWAM-MLP improves model accuracy because it takes into account that out-of-orderexecution can allow another independent miss that is younger than both of the above missesto issue. Therefore, the number of instructions that miss in the data cache and that shouldbe analyzed in a profile window should, in this case, be more than the total number ofMSHRs.
A potential limitation of SWAM-MLP is modeling banked caches with per bank MSHRstructures [Tuck et al. 2006]. Such banking introduces the possibility that isolated accesseswithin the profile window will be unable to be overlapped. We leave the study of extensionsof SWAM-MLP that would address banked MSHRs to future work.
4. METHODOLOGY
To evaluate our analytical model, we have modified SimpleScalar [Burger and Austin 1997]to simulate the performance loss due to long latency data cache misses when accounting for
ACM Journal Name, Vol. V, No. N, Article A, Publication date: January YYYY.
A:14 Xi E. Chen and Tor M. Aamodt
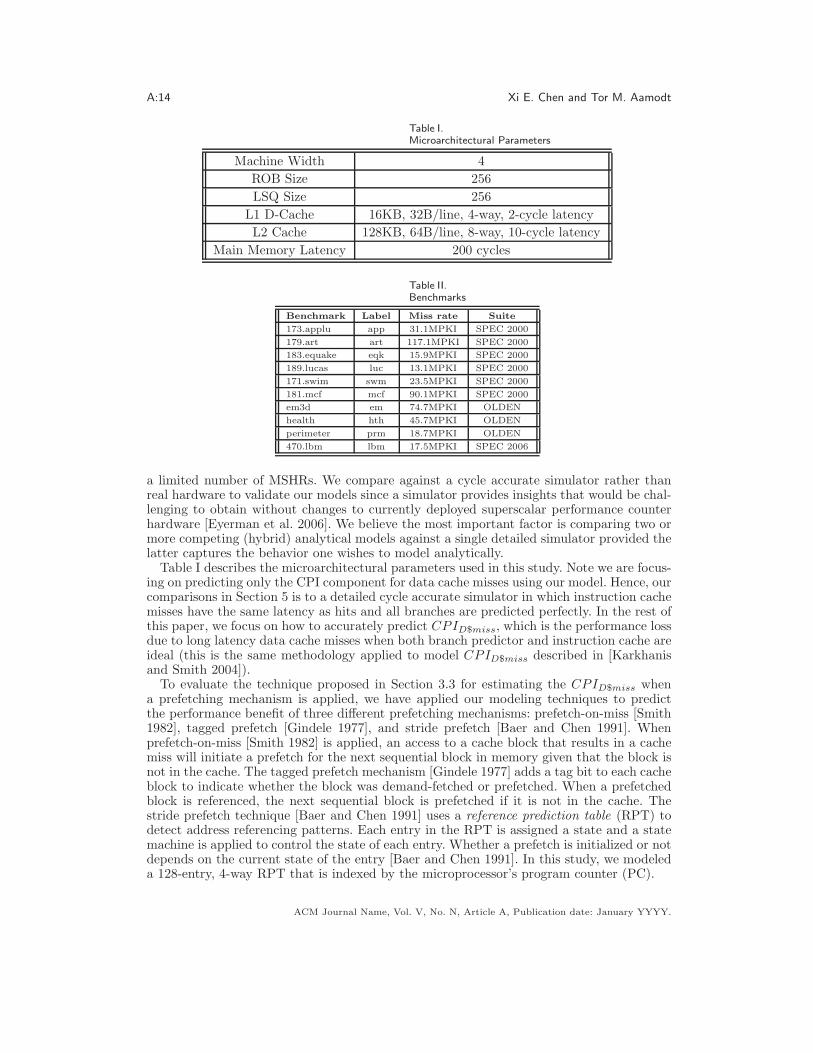
Table I.
Microarchitectural Parameters
Machine Width 4
ROB Size 256
LSQ Size 256
L1 D-Cache 16KB, 32B/line, 4-way, 2-cycle latency
L2 Cache 128KB, 64B/line, 8-way, 10-cycle latency
Main Memory Latency 200 cycles
Table II.
Benchmarks
Benchmark Label Miss rate Suite
173.applu app 31.1MPKI SPEC 2000
179.art art 117.1MPKI SPEC 2000
183.equake eqk 15.9MPKI SPEC 2000
189.lucas luc 13.1MPKI SPEC 2000
171.swim swm 23.5MPKI SPEC 2000
181.mcf mcf 90.1MPKI SPEC 2000
em3d em 74.7MPKI OLDEN
health hth 45.7MPKI OLDEN
perimeter prm 18.7MPKI OLDEN
470.lbm lbm 17.5MPKI SPEC 2006
a limited number of MSHRs. We compare against a cycle accurate simulator rather thanreal hardware to validate our models since a simulator provides insights that would be chal-lenging to obtain without changes to currently deployed superscalar performance counterhardware [Eyerman et al. 2006]. We believe the most important factor is comparing two ormore competing (hybrid) analytical models against a single detailed simulator provided thelatter captures the behavior one wishes to model analytically.
Table I describes the microarchitectural parameters used in this study. Note we are focus-ing on predicting only the CPI component for data cache misses using our model. Hence, ourcomparisons in Section 5 is to a detailed cycle accurate simulator in which instruction cachemisses have the same latency as hits and all branches are predicted perfectly. In the rest ofthis paper, we focus on how to accurately predict CPID$miss, which is the performance lossdue to long latency data cache misses when both branch predictor and instruction cache areideal (this is the same methodology applied to model CPID$miss described in [Karkhanisand Smith 2004]).
To evaluate the technique proposed in Section 3.3 for estimating the CPID$miss whena prefetching mechanism is applied, we have applied our modeling techniques to predictthe performance benefit of three different prefetching mechanisms: prefetch-on-miss [Smith1982], tagged prefetch [Gindele 1977], and stride prefetch [Baer and Chen 1991]. Whenprefetch-on-miss [Smith 1982] is applied, an access to a cache block that results in a cachemiss will initiate a prefetch for the next sequential block in memory given that the block isnot in the cache. The tagged prefetch mechanism [Gindele 1977] adds a tag bit to each cacheblock to indicate whether the block was demand-fetched or prefetched. When a prefetchedblock is referenced, the next sequential block is prefetched if it is not in the cache. Thestride prefetch technique [Baer and Chen 1991] uses a reference prediction table (RPT) todetect address referencing patterns. Each entry in the RPT is assigned a state and a statemachine is applied to control the state of each entry. Whether a prefetch is initialized or notdepends on the current state of the entry [Baer and Chen 1991]. In this study, we modeleda 128-entry, 4-way RPT that is indexed by the microprocessor’s program counter (PC).
ACM Journal Name, Vol. V, No. N, Article A, Publication date: January YYYY.
Hybrid Analytical Modeling of Pending Cache Hits, Data Prefetching, and MSHRs A:15
To stress our model, we simulate a relatively small L2 cache compared to contemporarymicroprocessors. We note that the size of the L2 cache that we simulated is close in sizeto those employed in microprocessors shipped at the time when those benchmarks we usewere released. The benchmarks chosen are ones from SPEC 2000 [Standard PerformanceEvaluation Corporation ] and OLDEN [Carlisle 1996] that have at least 10 long latency datacache misses for every 1000 instructions simulated (10MPKI). Table II illustrates the missrates of these benchmarks and the labels used to represent them in figures. Moreover, foreach benchmark, we select 100M representative instructions to simulate using the Sim-Pointtoolkit [Sherwood et al. 2002].
In this paper, we use arithmetic mean of the absolute error to validate the accuracy of ananalytical model, which we argue is the correct measure since it always reports the largesterror numbers and is thus conservative in not overstating the case for improved accuracy.Note that we are interested in averaging the error of the CPI prediction on different bench-marks, not the average CPI predicted for an entire benchmark suite, which often allowserrors on individual benchmarks to “cancel out” in a way that suggests the modeling tech-nique is more accurate than it really is. We also report the geometric mean and harmonicmean of the absolute error to allay any concerns that these numbers might lead to differ-ent conclusions. In all cases the improvements resulting from applying our new modelingtechniques are robust enough that the selection of averaging technique does not impact ourconclusions.
5. RESULTS
This section summarizes our experimental results.
5.1. Modeling Pending Data Cache Hits
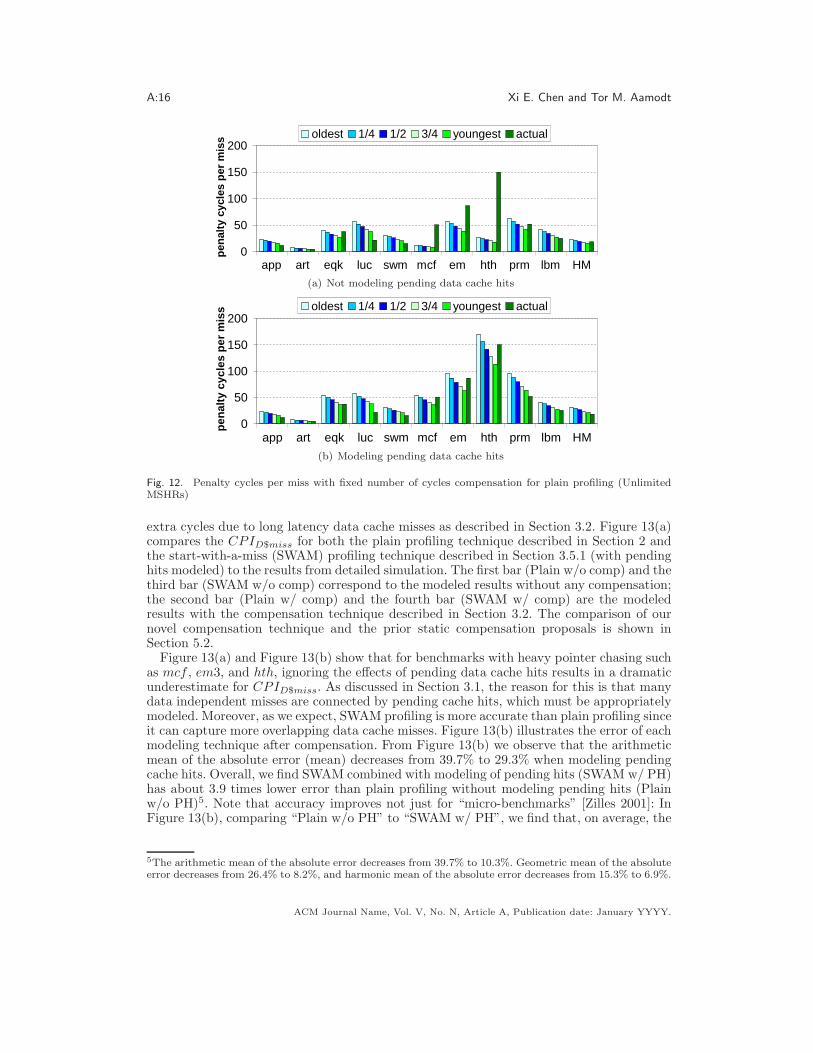
Section 2 describes prior proposals for compensating for the overestimation of modeledpenalty cycles per serialized miss using a fixed number of cycles. Figure 12(a) and Fig-ure 12(b) illustrate the modeled results after compensation with constant cycles both with-out, and with the pending hit compensation technique described in Section 3.1, respectively.In these two figures, we show results using five different constant compensation factors. Thefirst bar (oldest) corresponds to the assumption that an instruction that misses in thecache is always the oldest one in the instruction window when it issues (accesses the firstlevel cache). The second bar (1/4) corresponds to the assumption that there are always14ROBsize = 64 in-flight instructions older than a cache miss when it issues and it is sim-
ilar to the next two bars, (1/2) and (3/4). The fifth bar (youngest) corresponds to theassumption that there are always ROBsize − 1 older instructions in the window when theinstruction issues (i.e., the instruction is always the youngest one in the window when itissues). The last bar (actual) shows the simulated penalty cycles per cache miss from cycleaccurate simulation.
From this data, we observe that there is no one fixed cycle compensation method thatperformed consistently the best for all of the benchmarks we studied. For example, inFigure 12(a) we observe that error is minimized using “youngest” for app, art, luc, swm,and lbm, but minimized using “oldest” for em, mcf, and hth, while, eqk and prm requiressomething in-between. The harmonic mean for each fixed cycle compensation method isalso shown and we notice that, due to the fact that positive and negative errors cancel out,the harmonic means of some fixed cycle compensation methods appear close to the detailedsimulation results. However, it is important to recognize that their accuracy on individualbenchmarks is quite poor. By using the fixed cycle compensation method, we find that thesmallest arithmetic mean of absolute error is 43.5% when not modeling pending hits and26.9% when modeling pending hits, resulting when employing “youngest” compensation.
To account for the distinct behavior of each benchmark, we use the average distancebetween two consecutive cache misses to compensate for the overestimation of the modeled
ACM Journal Name, Vol. V, No. N, Article A, Publication date: January YYYY.
A:16 Xi E. Chen and Tor M. Aamodt
0
50
100
150
200
app art eqk luc swm mcf em hth prm lbm HM
pen
alty
cyc
les
per
mis
s oldest 1/4 1/2 3/4 youngest actual
(a) Not modeling pending data cache hits
0
50
100
150
200
app art eqk luc swm mcf em hth prm lbm HM
pen
alty
cyc
les
per
mis
s oldest 1/4 1/2 3/4 youngest actual
(b) Modeling pending data cache hits
Fig. 12. Penalty cycles per miss with fixed number of cycles compensation for plain profiling (UnlimitedMSHRs)
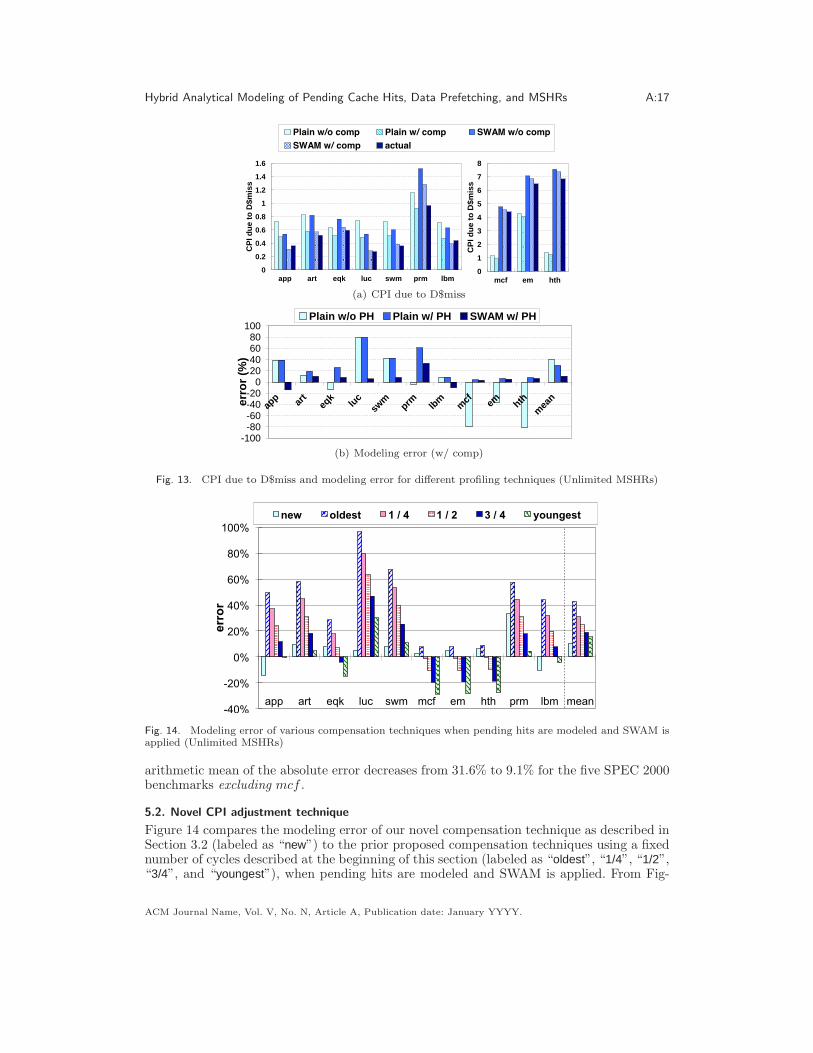
extra cycles due to long latency data cache misses as described in Section 3.2. Figure 13(a)compares the CPID$miss for both the plain profiling technique described in Section 2 andthe start-with-a-miss (SWAM) profiling technique described in Section 3.5.1 (with pendinghits modeled) to the results from detailed simulation. The first bar (Plain w/o comp) and thethird bar (SWAM w/o comp) correspond to the modeled results without any compensation;the second bar (Plain w/ comp) and the fourth bar (SWAM w/ comp) are the modeledresults with the compensation technique described in Section 3.2. The comparison of ournovel compensation technique and the prior static compensation proposals is shown inSection 5.2.
Figure 13(a) and Figure 13(b) show that for benchmarks with heavy pointer chasing suchas mcf , em3, and hth, ignoring the effects of pending data cache hits results in a dramaticunderestimate for CPID$miss. As discussed in Section 3.1, the reason for this is that manydata independent misses are connected by pending cache hits, which must be appropriatelymodeled. Moreover, as we expect, SWAM profiling is more accurate than plain profiling sinceit can capture more overlapping data cache misses. Figure 13(b) illustrates the error of eachmodeling technique after compensation. From Figure 13(b) we observe that the arithmeticmean of the absolute error (mean) decreases from 39.7% to 29.3% when modeling pendingcache hits. Overall, we find SWAM combined with modeling of pending hits (SWAM w/ PH)has about 3.9 times lower error than plain profiling without modeling pending hits (Plainw/o PH)5. Note that accuracy improves not just for “micro-benchmarks” [Zilles 2001]: InFigure 13(b), comparing “Plain w/o PH” to “SWAM w/ PH”, we find that, on average, the
5The arithmetic mean of the absolute error decreases from 39.7% to 10.3%. Geometric mean of the absoluteerror decreases from 26.4% to 8.2%, and harmonic mean of the absolute error decreases from 15.3% to 6.9%.
ACM Journal Name, Vol. V, No. N, Article A, Publication date: January YYYY.
Hybrid Analytical Modeling of Pending Cache Hits, Data Prefetching, and MSHRs A:17
0
0.2
0.4
0.6
0.8
1
1.2
1.4
1.6
app art eqk luc swm prm lbm
CP
I du
e to
D$m
iss
0
1
2
3
4
5
6
7
8
mcf em hth
CP
I du
e to
D$m
iss
(a) CPI due to D$miss
-100-80-60-40-20
020406080
100
app ar
teq
klu
csw
mprm lb
mm
cf em hthm
eaner
ror
(%)
Plain w/o PH Plain w/ PH SWAM w/ PH
(b) Modeling error (w/ comp)
Fig. 13. CPI due to D$miss and modeling error for different profiling techniques (Unlimited MSHRs)
-40%
-20%
0%
20%
40%
60%
80%
100%
app art eqk luc swm mcf em hth prm lbm mean
err
or
new oldest 1 / 4 1 / 2 3 / 4 youngest
Fig. 14. Modeling error of various compensation techniques when pending hits are modeled and SWAM isapplied (Unlimited MSHRs)
arithmetic mean of the absolute error decreases from 31.6% to 9.1% for the five SPEC 2000benchmarks excluding mcf .
5.2. Novel CPI adjustment technique
Figure 14 compares the modeling error of our novel compensation technique as described inSection 3.2 (labeled as “new”) to the prior proposed compensation techniques using a fixednumber of cycles described at the beginning of this section (labeled as “oldest”, “1/4”, “1/2”,“3/4”, and “youngest”), when pending hits are modeled and SWAM is applied. From Fig-
ACM Journal Name, Vol. V, No. N, Article A, Publication date: January YYYY.
A:18 Xi E. Chen and Tor M. Aamodt
0
0.2
0.4
0.6
0.8
1
1.2
1.4
app art eqk luc swm prm lbm
CP
I du
e to
D$m
iss
0
1
2
3
4
5
6
7
8
mcf em hth
CP
I du
e to
D$m
iss
(a) CPI due to D$miss with different prefetching techniques
-100-80-60-40-20
020406080
100
erro
r (%
)
POM_model w/ PH POM_model w/o PH Tag_model w/ PHTag_model w/o PH Stride_model w/ PH Stride_model w/o PH
app art eqk luc swm mc em hthprm lbm mean
(b) Modeling error with different prefetching techniques
Fig. 15. CPI due to D$miss and modeling error while prefetch-on-miss (POM), tagged prefetch (Tag), orstride prefetch (Stride) technique is applied.
ure 14 we observe that, when applying fixed cycle compensation techniques, for applicationssuch as mcf, em, and hth, 1/4 (i.e., assuming that an instruction that misses in the datacache is always younger than 1
4ROBsize in-flight instructions in the instruction window)
minimizes the error; for applications such as app, art, luc, swm, prm, and lbm, youngest(i.e., assuming that an instruction that misses in the data cache is always the youngest onein the instruction window) minimizes the error; for eqk, the lowest error is achieved at “3/4”(i.e., somewhere in-between). On average, the optimal fixed cycle compensation techniqueis youngest. However, rather than curve-fitting the actual result, our new compensationtechnique takes into account of the individual program characteristics and improves theaccuracy of the best fixed cycle compensation technique (youngest) by 33.9%, reducing thearithmetic mean of absolute error from 15.5% to 10.3%.
5.3. Modeling Different Prefetching Techniques
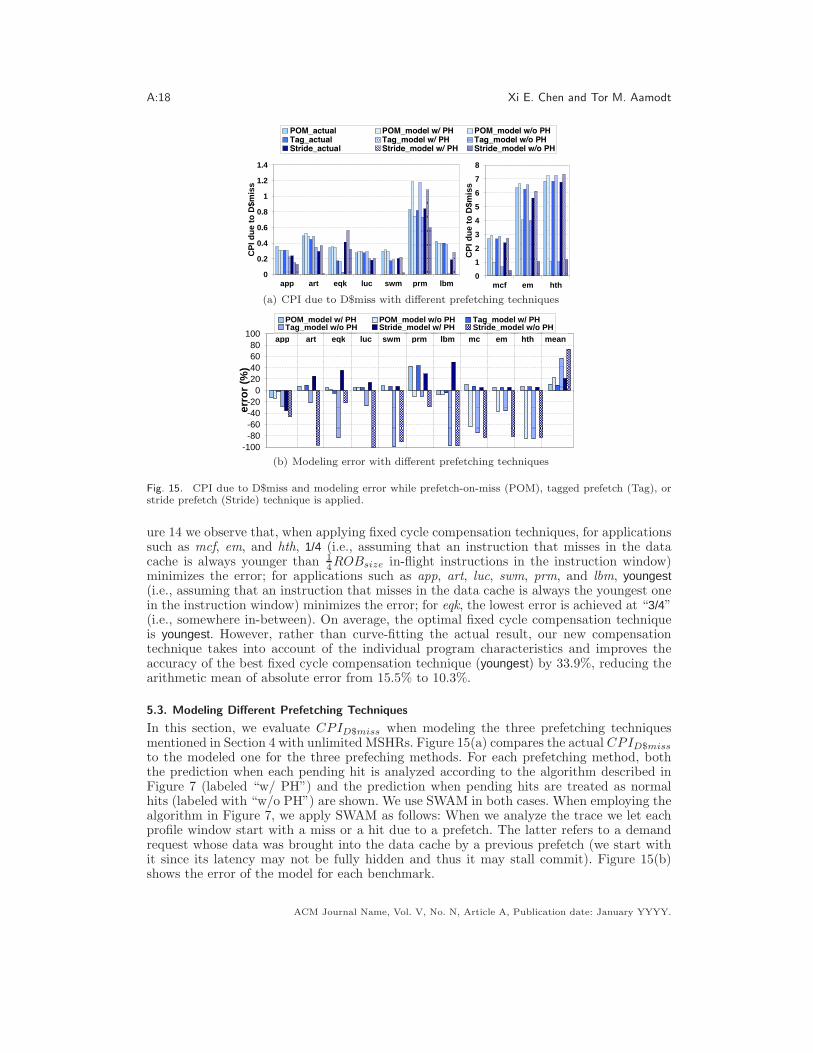
In this section, we evaluate CPID$miss when modeling the three prefetching techniquesmentioned in Section 4 with unlimited MSHRs. Figure 15(a) compares the actual CPID$miss
to the modeled one for the three prefeching methods. For each prefetching method, boththe prediction when each pending hit is analyzed according to the algorithm described inFigure 7 (labeled “w/ PH”) and the prediction when pending hits are treated as normalhits (labeled with “w/o PH”) are shown. We use SWAM in both cases. When employing thealgorithm in Figure 7, we apply SWAM as follows: When we analyze the trace we let eachprofile window start with a miss or a hit due to a prefetch. The latter refers to a demandrequest whose data was brought into the data cache by a previous prefetch (we start withit since its latency may not be fully hidden and thus it may stall commit). Figure 15(b)shows the error of the model for each benchmark.
ACM Journal Name, Vol. V, No. N, Article A, Publication date: January YYYY.

Hybrid Analytical Modeling of Pending Cache Hits, Data Prefetching, and MSHRs A:19
From Figure 15(b) we observe that if pending hits are not appropriately modeled (i.e., apending hit is simply treated as a hit and not analyzed based upon the algorithm in Fig-ure 7), the modeled CPID$miss always underestimates the actual CPID$miss. The reasonis that with a prefetching technique applied, a large fraction of the misses occurring whenthere is no prefetching become pending hits since prefetches generated by that prefetch-ing technique cannot fully hide the memory access latency of those misses. By using themethod of analyzing pending hits that we propose in Section 3.3 to model prefetching, thearithmetic mean of the absolute error decreases from 22.2% to 10.7% for prefetch-on-miss,from 56.4% to 9.4% for tagged prefetch, and from 72.9% to 21.3% for stride prefetch (i.e.,the arithmetic mean of the absolute error decreases from 50.5% to 13.8% overall for thethree data prefetching techniques modeled).
5.4. Modeling Limited Number of MSHRs
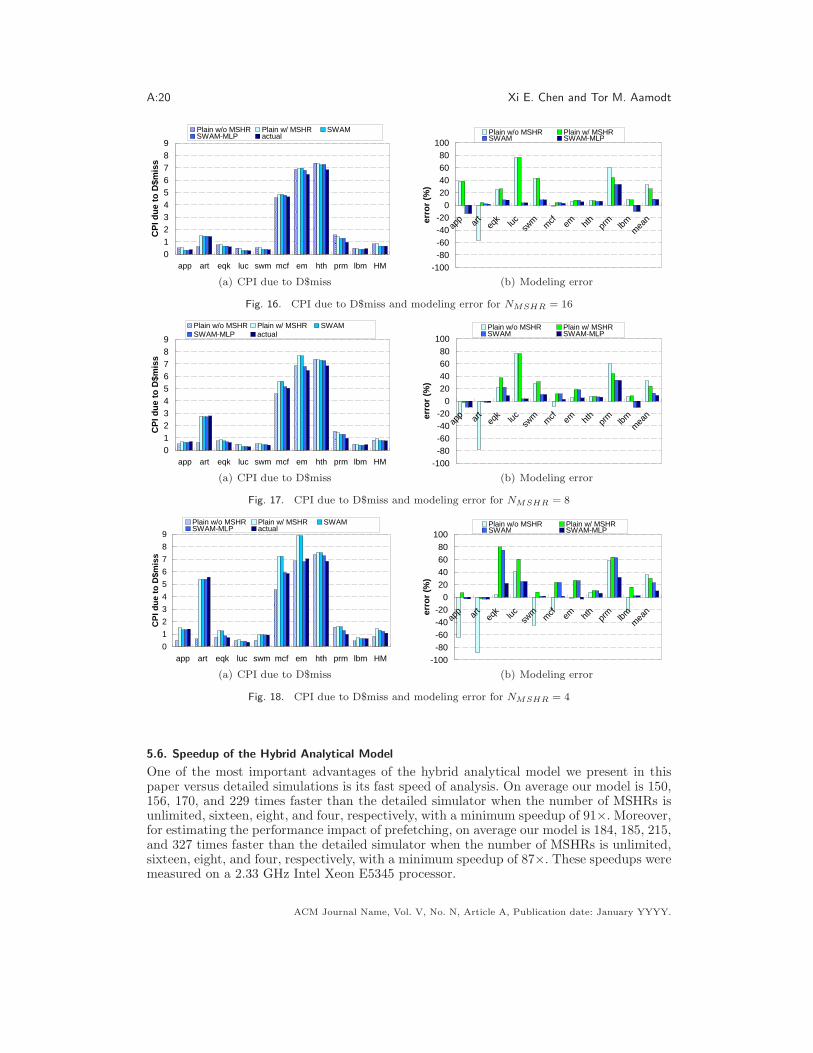
All of the results that we have seen thus far are for modeling a processor with an unlimitednumber of MSHRs. This section compares modeled CPID$miss when the number of availableMSHRs is limited. Figure 16(a), 17(a), and 18(a) compare the modeled CPID$miss to thesimulated results when the maximum number of MSHRs in a processor is sixteen, eight,and four, respectively. We show data for eight MSHRs and four MSHRs since we notethat Prescott has only eight MSHRs [Boggs et al. 2004] and Williamette has only fourMSHRs [Hinton et al. 2001]. For each benchmark, the first bar (Plain w/o MSHR) showsthe modeled CPID$miss from plain profiling (i.e., it is not aware that there are a limitednumber of MSHRs and always provides the same result for a given benchmark) and thesecond bar (Plain w/ MSHR) shows the modeled CPID$miss from plain profiling withthe technique of modeling a limited number of MSHRs (Section 3.4) included. The thirdand the fourth bar illustrates the modeled CPID$miss from SWAM (Section 3.5.1) andSWAM-MLP (Section 3.5.2), respectively. For these four profiling techniques, pending hitsare modeled using the method described in Section 3.1. The modeling error based on thedata in Figure 16(a)–18(a) is illustrated in Figure 16(b)–18(b).
SWAM-MLP is consistently better than SWAM. We observe that as the total numberof MSHRs decreases, the advantage of SWAM-MLP over SWAM becomes significant, espe-cially for eqk, mcf , em, and hth, for which it is more likely to have data dependence amongcache misses thus affecting the size of the profiling window that SWAM-MLP chooses.SWAM decreases the arithmetic mean of the absolute error from 32.6% (Plain w/o MSHR)to 9.8%, from 32.4% to 12.8%, and from 35.8% to 23.2%, when the number of MSHRs is six-teen, eight, and four, respectively6. SWAM-MLP further decreases the error to 9.3%, 9.2%,and 9.9%7 (i.e., SWAM-MLP decreases the error of plain profiling (Plain w/o MSHR) from33.6% to 9.5% when the number of MSHRs is limited). For the SPEC 2000 benchmarksexcluding mcf , average error reduces from 48.1% to 7.0% comparing Plain w/o MSHR toSWAM-MLP.
5.5. Putting It All Together
We also evaluated the combination of the techniques for modeling prefetching (Section 3.3)and SWAM-MLP to model the performance of the three prefetching methods with limitedMSHRs. On average, the error of modeling prefetching is 15.2%, 17.7%, and 20.5%, whenthe number of MSHRs is sixteen, eight, and four, respectively (average of 17.8% across allthree prefetch methods).
6 Geometric mean is reduced from 19.4% to 7.4%, from 21.5% to 9.7%, and from 21.8% to 10.9%; harmonicmean is reduced from 8.5% to 5.8%, from 14.5% to 7.0%, and from 10.2% to 5.1%7 Geometric mean of the absolute error is 6.5%, 6.7%, 5.2%, and harmonic mean of the absolute error is4.6%, 5.2%, 3.3%, when the number of MSHRs is sixteen, eight, and four, respectively.
ACM Journal Name, Vol. V, No. N, Article A, Publication date: January YYYY.
A:20 Xi E. Chen and Tor M. Aamodt
0123456789
app art eqk luc swm mcf em hth prm lbm HM
CP
I du
e to
D$m
iss
Plain w/o MSHR Plain w/ MSHR SWAMSWAM-MLP actual
(a) CPI due to D$miss
-100-80-60-40-20
020406080
100
app ar
teq
k luc swm m
cf em hth
prm lbm
mea
nerro
r (%
)
Plain w/o MSHR Plain w/ MSHRSWAM SWAM-MLP
(b) Modeling error
Fig. 16. CPI due to D$miss and modeling error for NMSHR = 16
0123456789
app art eqk luc swm mcf em hth prm lbm HM
CP
I du
e to
D$m
iss
Plain w/o MSHR Plain w/ MSHR SWAMSWAM-MLP actual
(a) CPI due to D$miss
-100-80-60-40-20
020406080
100
app ar
teq
k luc swm m
cf em hth
prm lbm
mea
nerro
r (%
)
Plain w/o MSHR Plain w/ MSHRSWAM SWAM-MLP
(b) Modeling error
Fig. 17. CPI due to D$miss and modeling error for NMSHR = 8
0
1
2
3
4
5
6
7
8
9
app art eqk luc swm mcf em hth prm lbm HM
CP
I du
e to
D$m
iss
Plain w/o MSHR Plain w/ MSHR SWAMSWAM-MLP actual
(a) CPI due to D$miss
-100-80-60-40-20
020406080
100
app ar
teq
k luc swm m
cf em hth
prm lbm
mea
nerro
r (%
)
Plain w/o MSHR Plain w/ MSHRSWAM SWAM-MLP
(b) Modeling error
Fig. 18. CPI due to D$miss and modeling error for NMSHR = 4
5.6. Speedup of the Hybrid Analytical Model
One of the most important advantages of the hybrid analytical model we present in thispaper versus detailed simulations is its fast speed of analysis. On average our model is 150,156, 170, and 229 times faster than the detailed simulator when the number of MSHRs isunlimited, sixteen, eight, and four, respectively, with a minimum speedup of 91×. Moreover,for estimating the performance impact of prefetching, on average our model is 184, 185, 215,and 327 times faster than the detailed simulator when the number of MSHRs is unlimited,sixteen, eight, and four, respectively, with a minimum speedup of 87×. These speedups weremeasured on a 2.33 GHz Intel Xeon E5345 processor.
ACM Journal Name, Vol. V, No. N, Article A, Publication date: January YYYY.
Hybrid Analytical Modeling of Pending Cache Hits, Data Prefetching, and MSHRs A:21
0
5
10
15
20
25
30
35
0 5 10 15 20 25 30 35actual CPI due to D$miss
pre
dic
ted
CP
I du
e to
D$m
iss
app art eqk luc swm mcf em hth prm lbm
(a) Unlimited MSHRs
0
5
10
15
20
25
30
35
0 5 10 15 20 25 30 35actual CPI due to D$miss
pre
dic
ted
CP
I du
e to
D$m
iss
app art eqk luc swm mcf em hth prm lbm
(b) sixteen MSHRs
0
5
10
15
20
25
30
35
0 5 10 15 20 25 30 35actual CPI due to D$miss
pre
dic
ted
CP
I du
e to
D$m
iss
app art eqk luc swm mcf em hth prm lbm
(c) eight MSHRs
0
5
10
15
20
25
30
35
0 5 10 15 20 25 30 35actual CPI due to D$miss
pre
dic
ted
CP
I du
e to
D$m
iss
app art eqk luc swm mcf em hth prm lbm
(d) four MSHRs
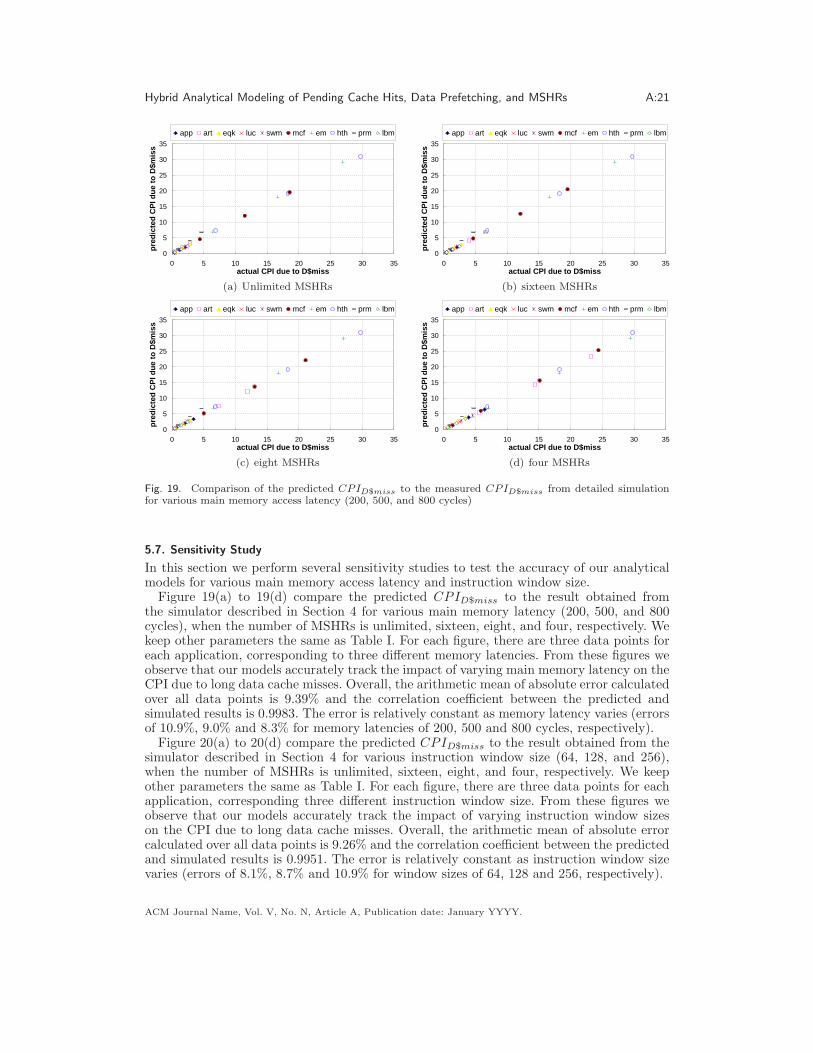
Fig. 19. Comparison of the predicted CPID$miss to the measured CPID$miss from detailed simulationfor various main memory access latency (200, 500, and 800 cycles)
5.7. Sensitivity Study
In this section we perform several sensitivity studies to test the accuracy of our analyticalmodels for various main memory access latency and instruction window size.
Figure 19(a) to 19(d) compare the predicted CPID$miss to the result obtained fromthe simulator described in Section 4 for various main memory latency (200, 500, and 800cycles), when the number of MSHRs is unlimited, sixteen, eight, and four, respectively. Wekeep other parameters the same as Table I. For each figure, there are three data points foreach application, corresponding to three different memory latencies. From these figures weobserve that our models accurately track the impact of varying main memory latency on theCPI due to long data cache misses. Overall, the arithmetic mean of absolute error calculatedover all data points is 9.39% and the correlation coefficient between the predicted andsimulated results is 0.9983. The error is relatively constant as memory latency varies (errorsof 10.9%, 9.0% and 8.3% for memory latencies of 200, 500 and 800 cycles, respectively).
Figure 20(a) to 20(d) compare the predicted CPID$miss to the result obtained from thesimulator described in Section 4 for various instruction window size (64, 128, and 256),when the number of MSHRs is unlimited, sixteen, eight, and four, respectively. We keepother parameters the same as Table I. For each figure, there are three data points for eachapplication, corresponding three different instruction window size. From these figures weobserve that our models accurately track the impact of varying instruction window sizeson the CPI due to long data cache misses. Overall, the arithmetic mean of absolute errorcalculated over all data points is 9.26% and the correlation coefficient between the predictedand simulated results is 0.9951. The error is relatively constant as instruction window sizevaries (errors of 8.1%, 8.7% and 10.9% for window sizes of 64, 128 and 256, respectively).
ACM Journal Name, Vol. V, No. N, Article A, Publication date: January YYYY.
A:22 Xi E. Chen and Tor M. Aamodt
0
1
2
3
4
5
6
7
8
9
0 1 2 3 4 5 6 7 8 9actual CPI due to D$miss
pre
dic
ted
CP
I du
e to
D$m
iss
app art eqk luc swm mcf em hth prm lbm
(a) Unlimited MSHRs
0
1
2
3
4
5
6
7
8
9
0 1 2 3 4 5 6 7 8 9actual CPI due to D$miss
pre
dic
ted
CP
I du
e to
D$m
iss
app art eqk luc swm mcf em hth prm lbm
(b) sixteen MSHRs
0
1
2
3
4
5
6
7
8
9
0 1 2 3 4 5 6 7 8 9actual CPI due to D$miss
pre
dic
ted
CP
I du
e to
D$m
iss
app art eqk luc swm mcf em hth prm lbm
(c) eight MSHRs
0
1
2
3
4
5
6
7
8
9
0 1 2 3 4 5 6 7 8 9actual CPI due to D$miss
pre
dic
ted
CP
I du
e to
D$m
iss
app art eqk luc swm mcf em hth prm lbm
(d) four MSHRs
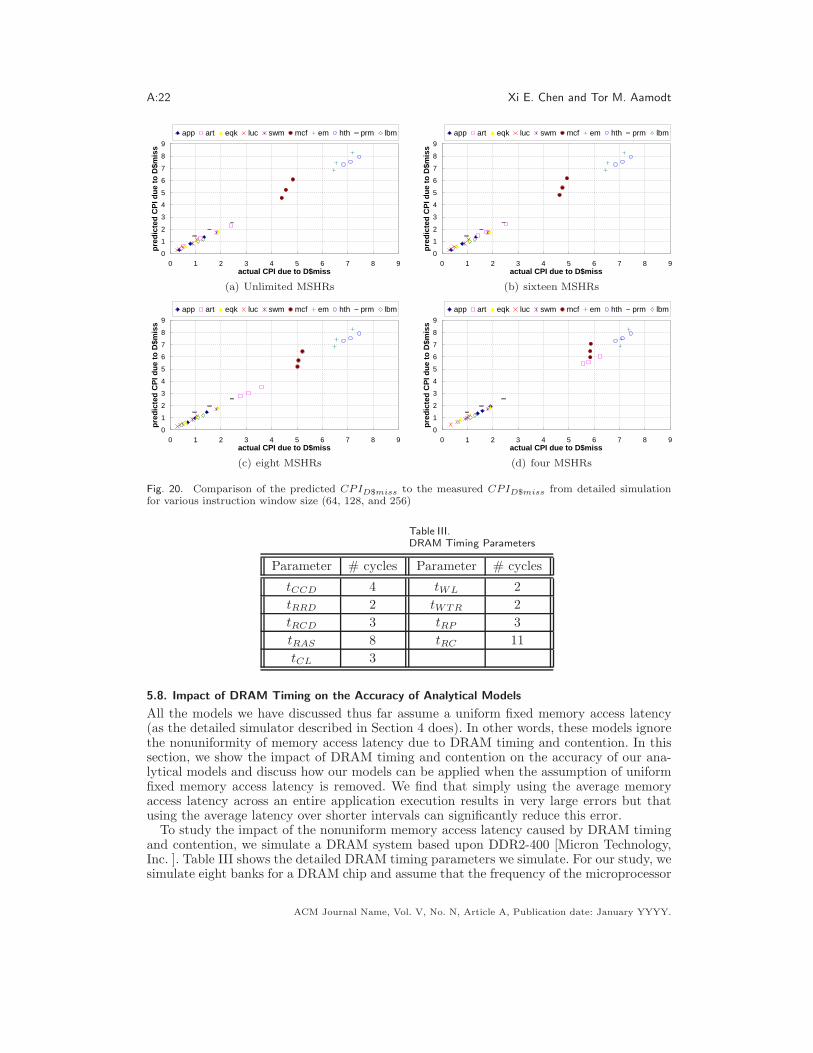
Fig. 20. Comparison of the predicted CPID$miss to the measured CPID$miss from detailed simulationfor various instruction window size (64, 128, and 256)
Table III.
DRAM Timing Parameters
Parameter # cycles Parameter # cycles
tCCD 4 tWL 2
tRRD 2 tWTR 2
tRCD 3 tRP 3
tRAS 8 tRC 11
tCL 3
5.8. Impact of DRAM Timing on the Accuracy of Analytical Models
All the models we have discussed thus far assume a uniform fixed memory access latency(as the detailed simulator described in Section 4 does). In other words, these models ignorethe nonuniformity of memory access latency due to DRAM timing and contention. In thissection, we show the impact of DRAM timing and contention on the accuracy of our ana-lytical models and discuss how our models can be applied when the assumption of uniformfixed memory access latency is removed. We find that simply using the average memoryaccess latency across an entire application execution results in very large errors but thatusing the average latency over shorter intervals can significantly reduce this error.
To study the impact of the nonuniform memory access latency caused by DRAM timingand contention, we simulate a DRAM system based upon DDR2-400 [Micron Technology,Inc. ]. Table III shows the detailed DRAM timing parameters we simulate. For our study, wesimulate eight banks for a DRAM chip and assume that the frequency of the microprocessor
ACM Journal Name, Vol. V, No. N, Article A, Publication date: January YYYY.
Hybrid Analytical Modeling of Pending Cache Hits, Data Prefetching, and MSHRs A:23
0
1
2
3
4
5
6
7
app art eqk luc swm mcf em hth prm lbm
CP
I du
e to
D$m
iss
actual
SWAM_avg_all_inst
SWAM_avg_1024_inst
26.8
(a) CPI due to D$miss
-50%
0%
50%
100%
150%
200%
app art eqk luc swm mcf em hth prm lbm mean
erro
r
SWAM_avg_all_inst
SWAM_avg_1024_inst
675%
(b) Modeling error
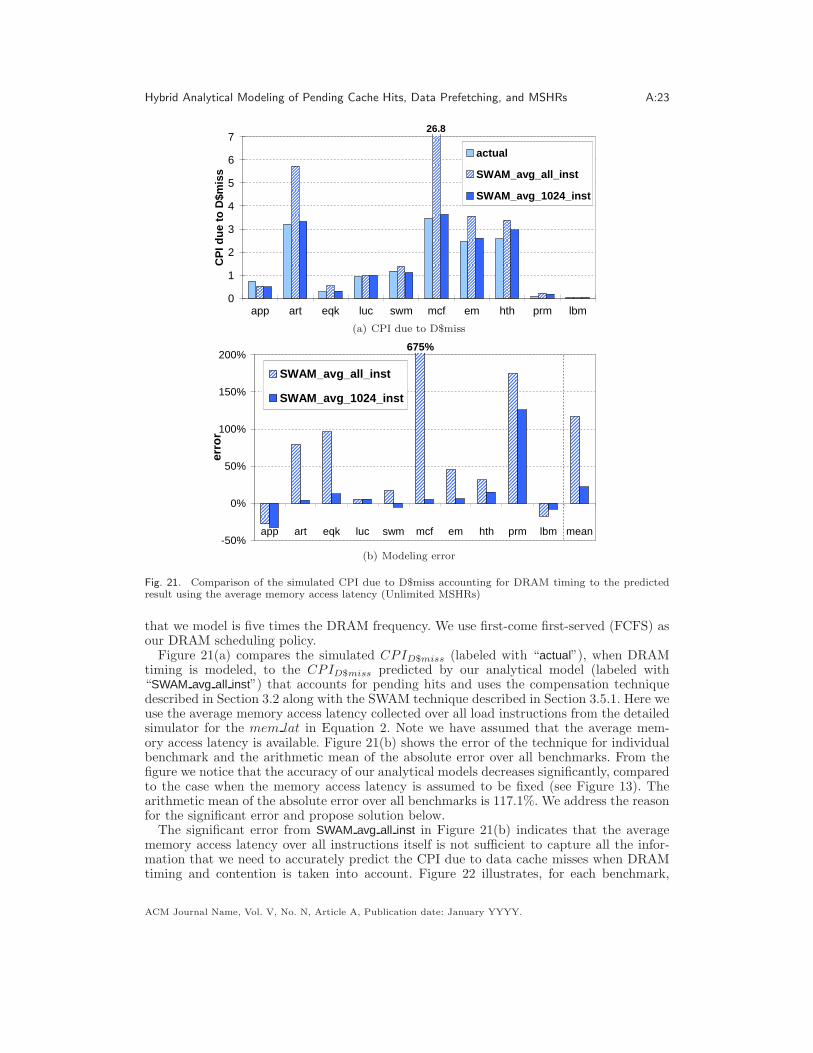
Fig. 21. Comparison of the simulated CPI due to D$miss accounting for DRAM timing to the predictedresult using the average memory access latency (Unlimited MSHRs)
that we model is five times the DRAM frequency. We use first-come first-served (FCFS) asour DRAM scheduling policy.
Figure 21(a) compares the simulated CPID$miss (labeled with “actual”), when DRAMtiming is modeled, to the CPID$miss predicted by our analytical model (labeled with“SWAM avg all inst”) that accounts for pending hits and uses the compensation techniquedescribed in Section 3.2 along with the SWAM technique described in Section 3.5.1. Here weuse the average memory access latency collected over all load instructions from the detailedsimulator for the mem lat in Equation 2. Note we have assumed that the average mem-ory access latency is available. Figure 21(b) shows the error of the technique for individualbenchmark and the arithmetic mean of the absolute error over all benchmarks. From thefigure we notice that the accuracy of our analytical models decreases significantly, comparedto the case when the memory access latency is assumed to be fixed (see Figure 13). Thearithmetic mean of the absolute error over all benchmarks is 117.1%. We address the reasonfor the significant error and propose solution below.
The significant error from SWAM avg all inst in Figure 21(b) indicates that the averagememory access latency over all instructions itself is not sufficient to capture all the infor-mation that we need to accurately predict the CPI due to data cache misses when DRAMtiming and contention is taken into account. Figure 22 illustrates, for each benchmark,
ACM Journal Name, Vol. V, No. N, Article A, Publication date: January YYYY.

A:24 Xi E. Chen and Tor M. Aamodt
0 2500 5000 7500 100000
200
400
600
800
1000
1200
# 1024 instructions
late
ncy
(cy
cle)
(a) app
0 2500 5000 7500 100000
500
1000
1500
2000
2500
3000
3500
# 1024 instructions
late
ncy
(cy
cle)
(b) art
0 2500 5000 7500 100000
50
100
150
200
250
300
# 1024 instructions
late
ncy
(cy
cle)
(c) eqk
0 2500 5000 7500 100000
100
200
300
400
500
600
700
# 1024 instructions
late
ncy
(cy
cle)
(d) luc
0 2500 5000 7500 100000
500
1000
1500
2000
2500
# 1024 instructions
late
ncy
(cy
cle)
(e) swm
0 2500 5000 7500 100000
1000
2000
3000
4000
5000
# 1024 instructions
late
ncy
(cy
cle)
(f) mcf
0 2500 5000 7500 100000
500
1000
1500
2000
2500
3000
# 1024 instructions
late
ncy
(cy
cle)
(g) em
0 2500 5000 7500 100000
500
1000
1500
2000
2500
# 1024 instructions
late
ncy
(cy
cle)
(h) hth
0 2500 5000 7500 1000040
50
60
70
80
90
# 1024 instructions
late
ncy
(cy
cle)
(i) prm
0 2500 5000 7500 100000
200
400
600
800
1000
1200
1400
# 1024 instructions
late
ncy
(cy
cle)
(j) lbm
Fig. 22. Average memory access latency of loads calculated every 1024 instructions. Horizontal lines showthe average memory access latency calculated over all instructions.
the average memory access latency of load instructions calculated every 1024 instructions8.Moreover, Figure 22 shows, by horizontal lines, the average memory access latency calcu-lated over all instructions that is used to predict the result from SWAM avg all inst as shownin Figure 21(a). We notice that the average memory access latency calculated over all in-structions is not a good metric capturing the nonuniformity of memory access latency overtime. As Figure 22(f) illustrates, although the average memory access latency for mcf isquite high, the fraction of instructions experiencing a very high latency is relatively low.On average, during 9373 groups out of the 10000 groups of 1024 instructions shown in Fig-
8 Note we only show the first 10000 groups of 1024 instructions per benchmark for clarity of figures.
ACM Journal Name, Vol. V, No. N, Article A, Publication date: January YYYY.

Hybrid Analytical Modeling of Pending Cache Hits, Data Prefetching, and MSHRs A:25
ure 22(f), the average memory access latency is significantly lower than the global average(i.e., the horizontal line), resulting in a 7.7× overestimate for the actual CPID$miss whenusing the average latency calculated over all instructions, as shown in Figure 21(a).
To better account for the impact of the nonuniform memory latency on the performance,we use the average memory access latency collected every 1024 instructions, rather than theaverage over all instructions, for the mem lat in Equation 2, while corresponding predictedCPID$miss and modeling error is shown in Figure 21(a) and Figure 21(b) (labeled with“SWAM avg 1024 inst”), respectively. Here we assume that an analytical model is availableto predict the average memory access latency during a certain number of instructions givenan instruction trace. The detail of such a model is beyond the scope of this work and isleft as our future work. We notice that, by using the fine-grained average for a group ofinstructions to better take into account the nonuniform behavior of memory access latency,SWAM avg 1024 inst improves the accuracy of SWAM avg all inst by a factor of 5.3, reducingthe average error from 117% to 22%. This compares favorably to the 10.3% error obtainedin Section 5.1 when comparing to a detailed simulator using a fixed memory latency.
Recently, many proposals have been put forward for more aggressive memory con-trollers [Rixner et al. 2000; Nesbit et al. 2006; Mutlu and Moscibroda 2008; Kim et al. 2010]including some that intelligently prioritize demand versus prefetch memory requests [Leeet al. 2008]. Such memory controllers can create wider distributions in memory access la-tency while increasing effective memory bandwidth. Given the increase in modeling errorwe observe when using a relatively simple FCFS memory controller we believe developingaccurate analytical models for DRAM memory access is an important area for future work.
6. RELATED WORK
There exist many analytical models proposed for superscalar microprocessors [Noonburg andShen 1994; Ofelt 1999; Michaud et al. 1999; 2001]. A common limitation of early modelsis that they assume a perfect data cache. As the gap between memory and microprocessorspeed increases, data cache misses must be properly modeled to achieve reasonable accuracy.
Agarwal et al. [Agarwal et al. 1989] present an analytical cache model estimating cachemiss rate given cache parameters. However, in a superscalar, out-of-order execution micro-processor, the cache miss rate itself is not enough to predict the real performance of theprogram analyzed. Jacob et al. [Jacob et al. 1996] propose an analytical memory modelthat applies a variational calculus approach to determine a memory hierarchy optimizedfor the average access time given a fixed hardware budget with an (implicit) assumptionthat memory level parallelism does not occur. Noonburg and Shen present a superscalarmicroprocessor Markov chain model [Noonburg and Shen 1997] that does not model longmemory latency. The first-order model proposed by Karkhanis and Smith [Karkhanis andSmith 2004] is the first to attempt to account for long latency data cache misses. Our ana-lytical model improves the accuracy of our re-implementation of their technique describedin Section 2 (based upon details available in the literature) by modeling pending data cachehits, and extends it to estimate the performance impact of data prefetching techniques anda limited number of outstanding cache misses.
More recently, Eyerman et al. [Eyerman et al. 2009] proposed a modification to the first-order model simplifying the analysis by examining the impact of miss events at the dispatchrather than issue stage. This formulation is useful in examining scaling relationships betweendifferent pipeline parameters and can be used to show that optimal performance is achievedat points where the pipeline depth times the square root of the pipeline width is a constant.The focus on pending hits, prefetching and miss status holding registers in this article isorthogonal. The use of SWAM profiling may capture benefits similar to profiling individualmiss intervals.
Some earlier work has investigated the performance impact increasing the number ofMSHRs using detailed simulations [Farkas et al. 1995; Belayneh and Kaeli 1996]. The hybrid
ACM Journal Name, Vol. V, No. N, Article A, Publication date: January YYYY.
A:26 Xi E. Chen and Tor M. Aamodt
analytical model that we propose can be used to estimate the performance impact of alimited number of MSHRs without requiring a detailed simulator.
Concurrent with our work, Eyerman proposed an approach similar to SWAM described inSection 3.5.1, except that the profile window slides to begin with each successive long latencymiss [Eyerman 2008]. Reportedly, a pending hit compensation mechanism was used [LievenEeckhout ].
7. CONCLUSIONS
In this paper, several improvements to an existing analytical performance model for super-scalar processors are proposed and evaluated. A proposed technique for modeling pendingdata cache hits reduces error from 39.7% to 29.3% while a technique for selecting the be-ginning of profile windows reduces error further to 10.7%. Accounting for the impact ofprogram characteristics on the overlap of computation and memory access error reduces er-ror by 33.9% compared to fixed compensation techniques. The basic model can be extendedto estimate the performance of a microprocessor when an arbitrary data prefetching methodis applied. Moreover, a technique to quantify the impacts of a limited number of MSHRsis proposed. The average error is 13.8% when modeling several prefetching strategies and9.5% when modeling a limited number of supported outstanding cache misses. This paperalso explores the sensitivity of the modeling technique. As memory access latency and in-struction window size varies the model achieves correlation coefficient of 0.9983 and 0.9951,respectively. Finally, the large impact of realistic memory access latencies (accounting forDRAM timing and contention) on the data memory access component of CPI is quantifiedand it is shown that a windowed average of memory latency can significantly reduce error.The later results suggest that future work should explore mechanisms to analytical modelthe impact of memory controllers on memory access latency.
ACKNOWLEDGMENTS
We would like to thank Tejas Karkhanis, Lieven Eeckhout, Ali Bakhoda, Wilson Fung, Johnny Kuan,Andrew Turner, Henry Wong, George Yuan, and the anonymous reviewers for their valuable comments onearlier versions of this paper. This work was partly supported by the Natural Sciences and EngineeringResearch Council of Canada.
REFERENCES
Agarwal, A., Horowitz, M., and Hennessy, J. 1989. An Analytical Cache Model. TOCS 7, 2, 184–215.
Baer, J.-L. and Chen, T.-F. 1991. An Effective On-chip Preloading Scheme to Reduce Data Access Penalty.In SC. 176–186.
Belayneh, S. and Kaeli, D. R. 1996. A discussion on non-blocking/lockup-free caches. SIGARCH Comput.Archit. News 24, 3, 18–25.
Boggs, D., Baktha, A., Hawkins, J., Marr, D. T., Miller, J. A., Roussel, P., Singhal, R., Toll, B.,and Venkatraman, K. 2004. The Microarchitecture of the Intel R© PentiumR© 4 Processor on 90nmTechnology. IntelR© Technology Journal 8, 1.
Burger, D. and Austin, T. M. 1997. The SimpleScalar Tool Set, Version 2.0. SIGARCH Computer Ar-chitecture News 25, 3, 13–25.
Carlisle, M. C. 1996. Olden: Parallelizing Programs with Dynamic Data Structures on Distributed-Memory Machines. Ph.D. thesis, Princeton University.
Chen, X. E. and Aamodt, T. M. 2008. Hybrid Analytical Modeling of Pending Cache Hits, Data Prefetch-ing, and MSHRs. In MICRO-41. 59–70.
Chow, C. K. 1974. On Optimization of Memory Hierarchies. IBM J. Res. Dev. 2, 194–203.
Cristal, A., Santana, O., Valero, M., and Mart́ınez, J. F. 2004. Toward Kilo-instruction Processors.ACM TACO 1, 4, 389–417.
Emer, J., Ahuja, P., Borch, E., Klauser, A., Luk, C.-K., Manne, S., Mukherjee, S. S., Patil, H.,Wallace, S., Binkert, N., Espasa, R., and Juan, T. 2002. Asim: A Performance Model Framework.IEEE Computer 35, 2, 68–76.
ACM Journal Name, Vol. V, No. N, Article A, Publication date: January YYYY.

Hybrid Analytical Modeling of Pending Cache Hits, Data Prefetching, and MSHRs A:27
Eyerman, S. 2008. Analytical Performance Analysis and Modeling of Superscalar and Multi-threaded Pro-cessors. Ph.D. thesis, Ghent.
Eyerman, S., Eeckhout, L., Karkhanis, T., and Smith, J. E. 2009. A Mechanistic Performance Modelfor Superscalar Out-of-Order Processors. ACM Trans. Comput. Syst. 27, 3:1–3:37.
Eyerman, S., Eeckhout, L., Karkhanis, T. S., and Smith, J. E. 2006. A Performance Counter Architec-ture for Computing Accurate CPI Components. In ASPLOS-XII. 175–184.
Farkas, K. I., Jouppi, N. P., and Chow, P. 1995. How useful are non-blocking loads, stream buffers andspeculative execution in multiple issue processors? In HPCA-1. 78.
Gindele, J. D. 1977. Buffer Block Prefetching Method. IBM Technical Disclosure Bulletin 20, 2, 696–697.
Hinton, G., Sager, D., Upton, M., Boggs, D., Carmean, D., Kyker, A., and Roussel, P. 2001. TheMicroarchitecture of the PentiumR© 4 Processor. IntelR© Technology Journal 5, 1.
Jacob, B. L., Chen, P. M., Silverman, S. R., and Mudge, T. N. 1996. An Analytical Model for DesigningMemory Hierarchies. IEEE Trans. Computer 45, 10, 1180–1194.
Jouppi, N. P. 1990. Improving Direct-mapped Cache Performance by the Addition of a Small Fully-associative Cache and Prefetch Buffers. In ISCA-17. 364–373.
Karkhanis, T. S. 2006. Automated Design of Application-specific Superscalar Processors. Ph.D. thesis,University of Wisconsin.
Karkhanis, T. S. and Smith, J. E. 2004. A First-order Superscalar Processor Model. In ISCA-31. 338–349.
Karkhanis, T. S. and Smith, J. E. 2007. Automated Design of Application Specific Superscalar Processors:An Analytical Approach. In ISCA-34. 402–411.
Kim, Y., Papamichael, M., Mutlu, O., and Harchol-Balter, M. 2010. Thread cluster memory schedul-ing: Exploiting differences in memory access behavior. In Proc. 43rd Int’l Symp. on Microarchitecture.65–76.
Kroft, D. 1981. Lockup-free Instruction Fetch/Prefetch Cache Organization. In ISCA-8. 81–87.
Lee, C. J., Mutlu, O., Narasiman, V., and Patt, Y. N. 2008. Prefetch-aware dram controllers. In Proc.41st Int’l Symp. on Microarchitecture. 200–209.
Lieven Eeckhout. Personal Communication. Sept, 2008.
MacDonald, J. E. and Sigworth, K. L. 1975. Storage Hierarchy Optimization Procedure. IBM J. Res.Dev. 19, 2, 133–140.
Michaud, P., Seznec, A., and Jourdan, S. 1999. Exploring Instruction-Fetch Bandwidth Requirement inWide-issue Superscalar Processors. In PACT. 2–10.
Michaud, P., Seznec, A., and Jourdan, S. 2001. An Exploration of Instruction Fetch Requirement inOut-of-Order Superscalar Processors. Int’l Journal of Parallel Programming 29, 1, 35–38.
Micron Technology, Inc. 2Gb DDR2 SDRAM Component : MT47H128M16HG-25.http://download.micron.com/pdf/datasheets/dram/ddr2/2gbddr2.pdf.
Mutlu, O. and Moscibroda, T. 2008. Parallelism-aware batch scheduling: Enhancing both performanceand fairness of shared dram systems. In Proc. 35th Int’l Symp. on Computer Architecture. 63–74.
Nesbit, K. J., Aggarwal, N., Laudon, J., and Smith, J. E. 2006. Fair queuing memory systems. In Proc.39th IEEE/ACM Int’l Symp. on Microarchitecture. 208–222.
Noonburg, D. B. and Shen, J. P. 1994. Theoretical Modeling of Superscalar Processor Performance. InMICRO-27. 52–62.
Noonburg, D. B. and Shen, J. P. 1997. A Framework for Statistical Modeling of Superscalar ProcessorPerformance. In HPCA-3. 298–309.
Ofelt, D. J. 1999. Efficient Performance Prediction for Modern Microprocessors. Ph.D. thesis, StanfordUniversity.
Rixner, S., Dally, W. J., Kapasi, U. J., Mattson, P., and Owens, J. D. 2000. Memory access scheduling.In Proc. 27th Int’l Symp. on Computer Architecture. 128–138.
Sherwood, T., Perelman, E., Hamerly, G., and Calder, B. 2002. Automatically Characterizing LargeScale Program Behavior. In ASPLOS-X. 45–57.
Smith, A. J. 1982. Cache Memories. ACM Computing Surveys 14, 3, 473–530.
Standard Performance Evaluation Corporation. SPEC CPU2000 benchmarks. http://www.spec.org.
Tejas S. Karkhanis. Personal Communication. Sept., 2008.
Tuck, J., Ceze, L., and Torrellas, J. 2006. Scalable Cache Miss Handling for High Memory-Level Par-allelism. In MICRO-39. 409–422.
Vachharajani, M., Vachharajani, N., Penry, D. A., Blome, J. A., and August, D. I. 2002. Microar-chitectural Exploration with Liberty. In MICRO-35. 271–282.
ACM Journal Name, Vol. V, No. N, Article A, Publication date: January YYYY.
A:28 Xi E. Chen and Tor M. Aamodt
Wunderlich, R. E., Wenisch, T. F., Falsafi, B., and Hoe, J. C. 2003. SMARTS: Accelerating Microar-chitecture Simulation via Rigorous Statistical Sampling. In ISCA-30. 84–97.
Yi, J. J., Eeckhout, L., Lilja, D. J., Calder, B., John, L. K., and Smith, J. E. 2006. The Future ofSimulation: A Field of Dreams. Computer 39, 11, 22–29.
Zilles, C. B. 2001. Benchmark health considered harmful. SIGARCH Comput. Archit. News 29, 3, 4–5.
ACM Journal Name, Vol. V, No. N, Article A, Publication date: January YYYY.