Embed Size (px)
Citation preview
A hub-attachment based method to detect functional modules from
confidence-scored protein interactions and expression profiles
Authors: Chia-Hao Chin1,4, Shu-Hwa Chen1, Chin-Wen Ho4, Ming-Tat Ko1,5, Chung-Yen Lin1,2,3,5
1. Institute of Information Science, Academia Sinica, Taiwan2. Division of Biostatistics and Bioinformatics, National Health Research Institutes, Taiwan3. Institute of Fishery Science, College of Life Science, National Taiwan University, Taiwan 4. Department of Computer Science and Information Engineering, National Central University, Taiwan5. Research Center of Information Technology Innovation, Academia Sinica, Taiwan
Outline
• Goal
• Method
• Experiment results
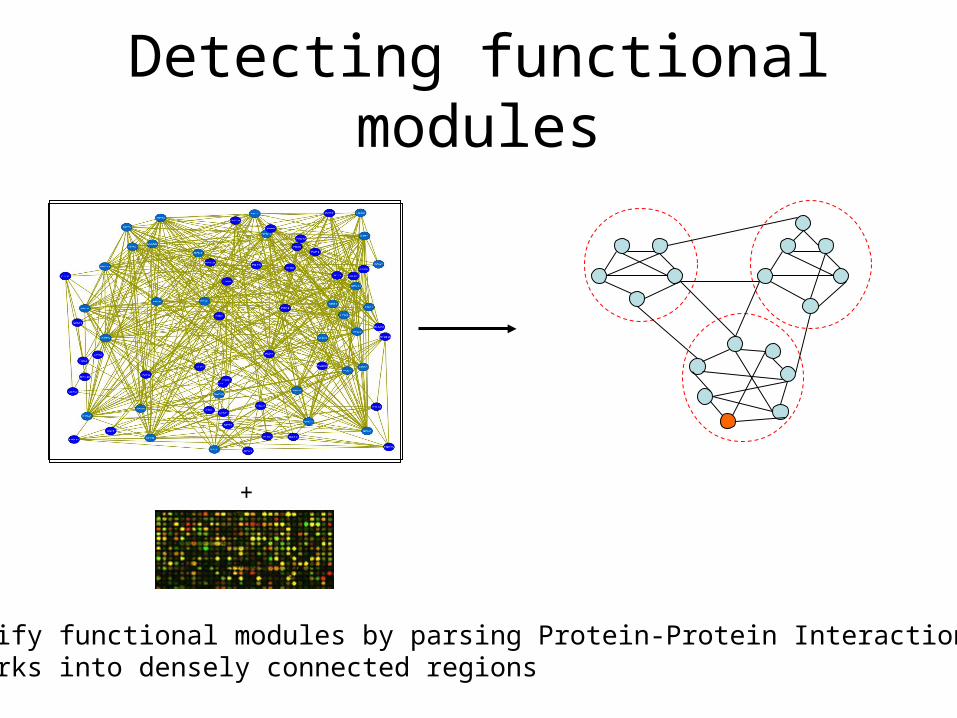
Detecting functional modules
Identify functional modules by parsing Protein-Protein Interaction (PPI) networks into densely connected regions
+
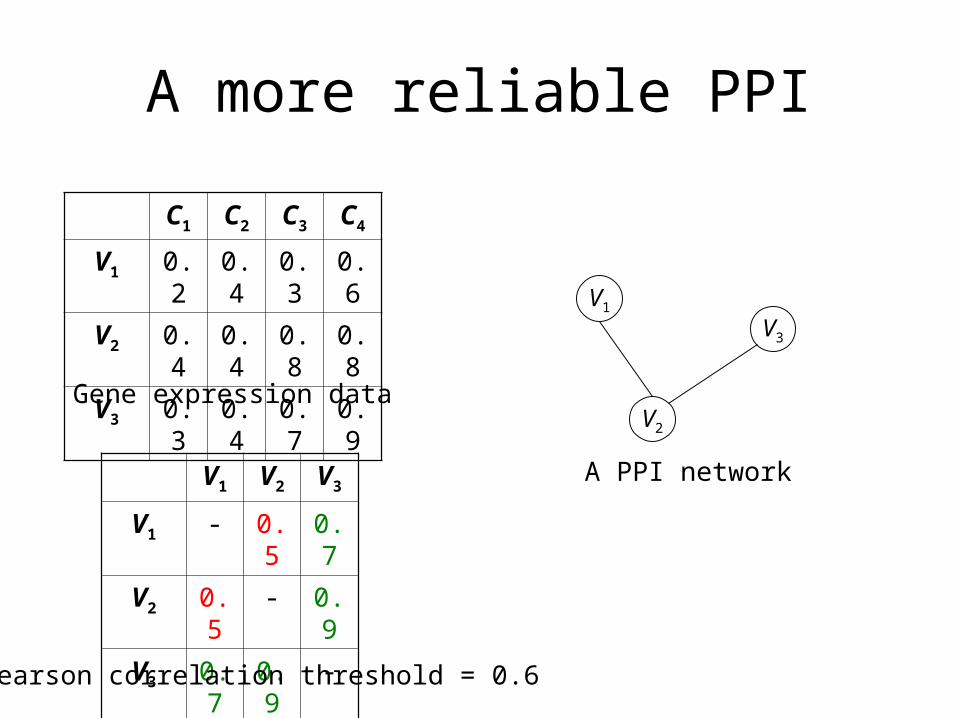
A more reliable PPI
C1 C2 C3 C4
V1 0.2 0.4 0.3 0.6
V2 0.4 0.4 0.8 0.8
V3 0.3 0.4 0.7 0.9
V1
V2
V3
V1 V2 V3
V1 - 0.5 0.7
V2 0.5 - 0.9
V3 0.7 0.9 -
Pearson correlation threshold = 0.6
Gene expression data
A PPI network
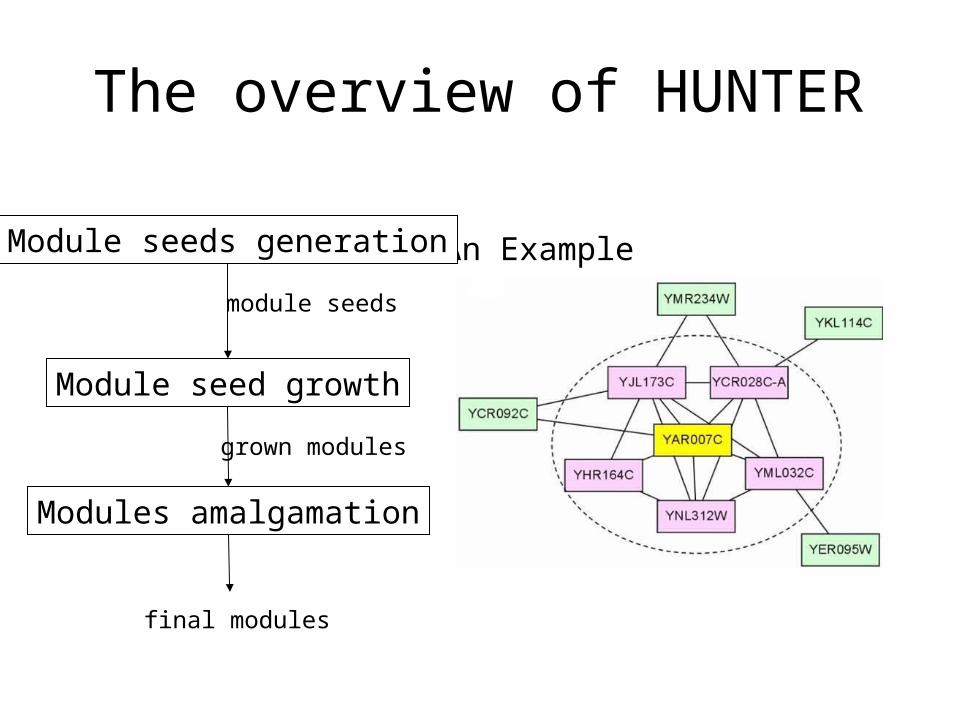
The overview of HUNTER
An ExampleModule seeds generation
Modules amalgamation
Module seed growth
module seeds
grown modules
final modules
Module seed generation
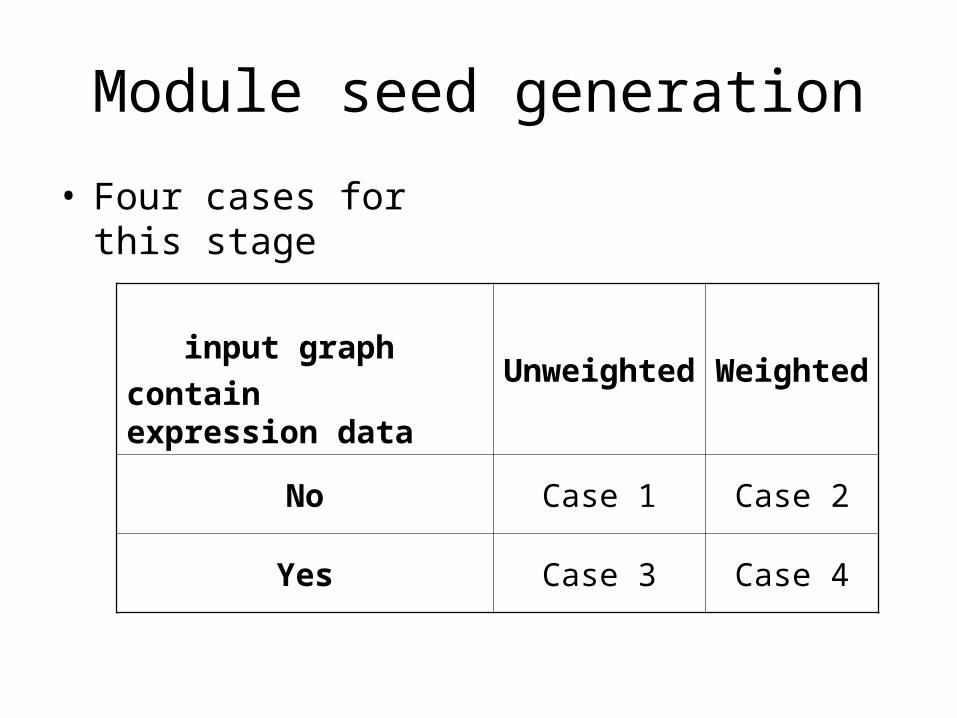
• Four cases for this stage
input graph
contain expression data
Unweighted Weighted
No Case 1 Case 2
Yes Case 3 Case 4
Module seed generation(1/4)
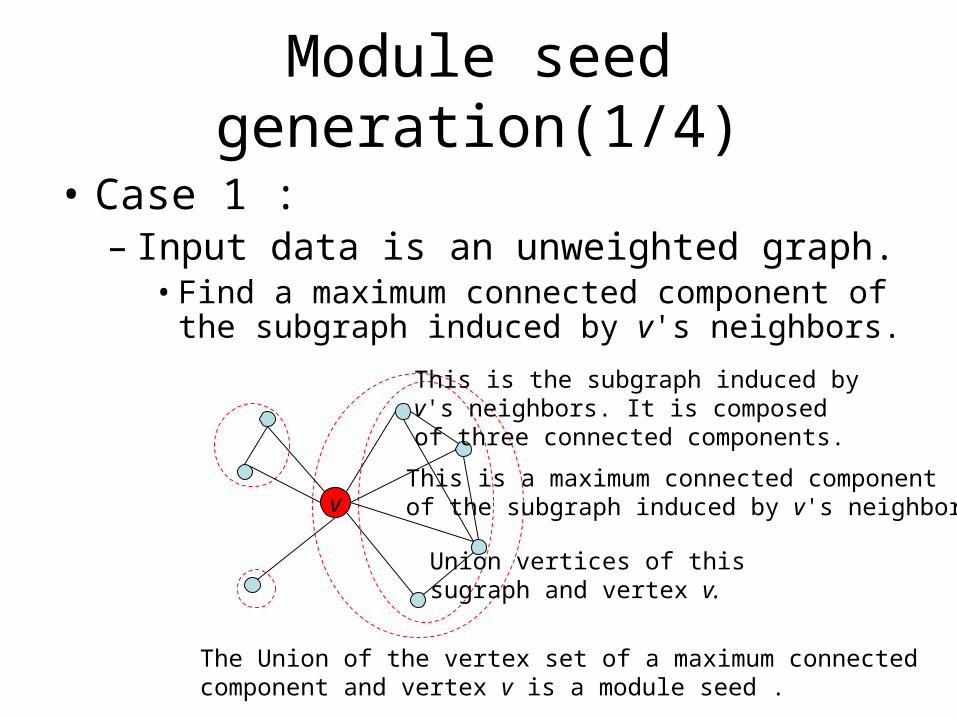
• Case 1 : – Input data is an unweighted graph.
• Find a maximum connected component of the subgraph induced by v's neighbors.
v
The Union of the vertex set of a maximum connected component and vertex v is a module seed .
Union vertices of this sugraph and vertex v.
This is a maximum connected component of the subgraph induced by v's neighbors.
This is the subgraph induced by v's neighbors. It is composed of three connected components.
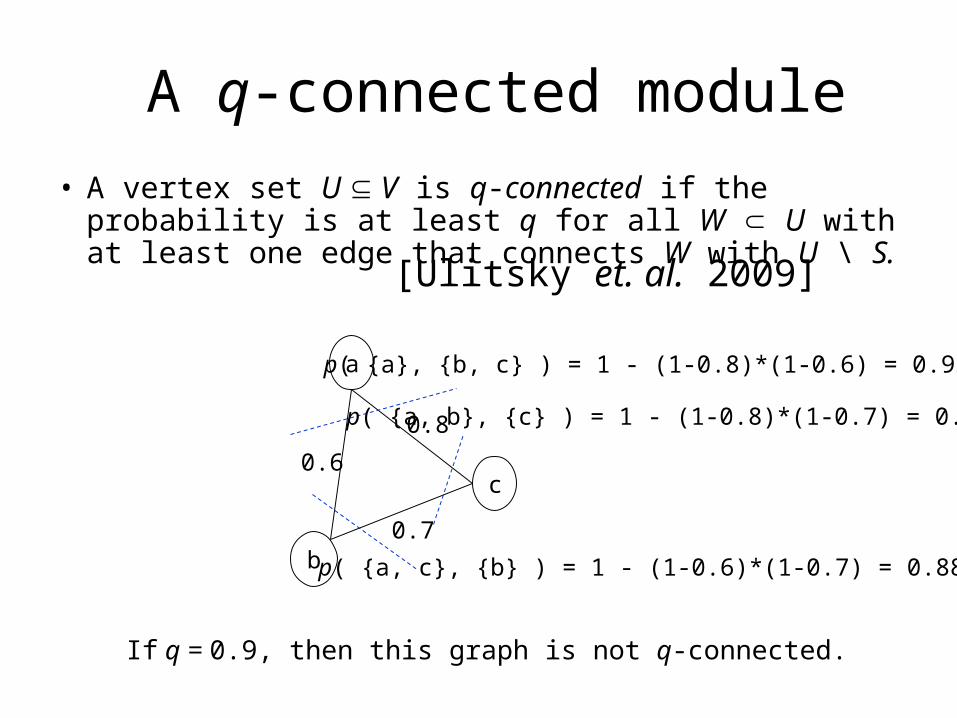
A q-connected module
• A vertex set U V is q-connected if the probability is at least q for all W U with at least one edge that connects W with U \ S. [Ulitsky et. al. 2009]
a
b
c
0.8
0.6
0.7
p( {a}, {b, c} ) = 1 - (1-0.8)*(1-0.6) = 0.92
p( {a, b}, {c} ) = 1 - (1-0.8)*(1-0.7) = 0.94
p( {a, c}, {b} ) = 1 - (1-0.6)*(1-0.7) = 0.88
If q = 0.9, then this graph is not q-connected.
Module seed generation(2/4)
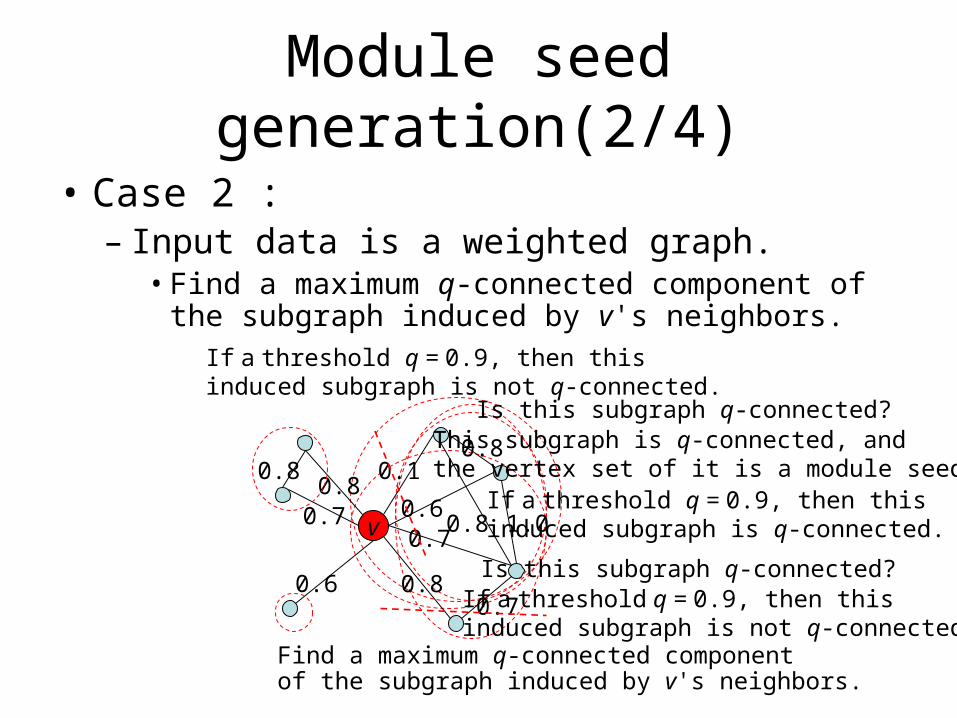
• Case 2 : – Input data is a weighted graph.
• Find a maximum q-connected component of the subgraph induced by v's neighbors.
v
This subgraph is q-connected, and the vertex set of it is a module seed.0.1
0.8
0.8
0.7
0.60.7
1.0
0.6
0.80.7
0.8
0.8
If a threshold q = 0.9, then this induced subgraph is not q-connected.
If a threshold q = 0.9, then this induced subgraph is q-connected.
If a threshold q = 0.9, then this induced subgraph is not q-connected.
Is this subgraph q-connected?
Is this subgraph q-connected?
Find a maximum q-connected component of the subgraph induced by v's neighbors.
Module seed generation(3/4)
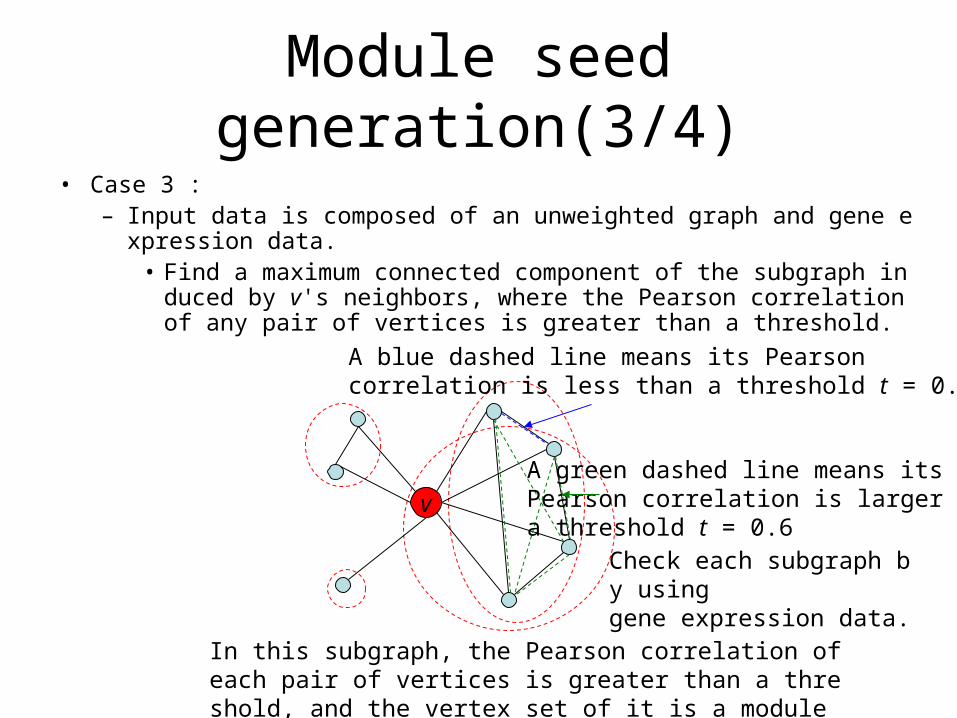
• Case 3 : – Input data is composed of an unweighted graph and gene expression dat
a.• Find a maximum connected component of the subgraph induced by
v's neighbors, where the Pearson correlation of any pair of vertices is greater than a threshold.
v
In this subgraph, the Pearson correlation of each pair of vertices is greater than a threshold, and the vertex set of it is a module seed
A blue dashed line means its Pearson correlation is less than a threshold t = 0.6
A green dashed line means itsPearson correlation is larger thana threshold t = 0.6
Check each subgraph by usinggene expression data.
Module seed generation(4/4)
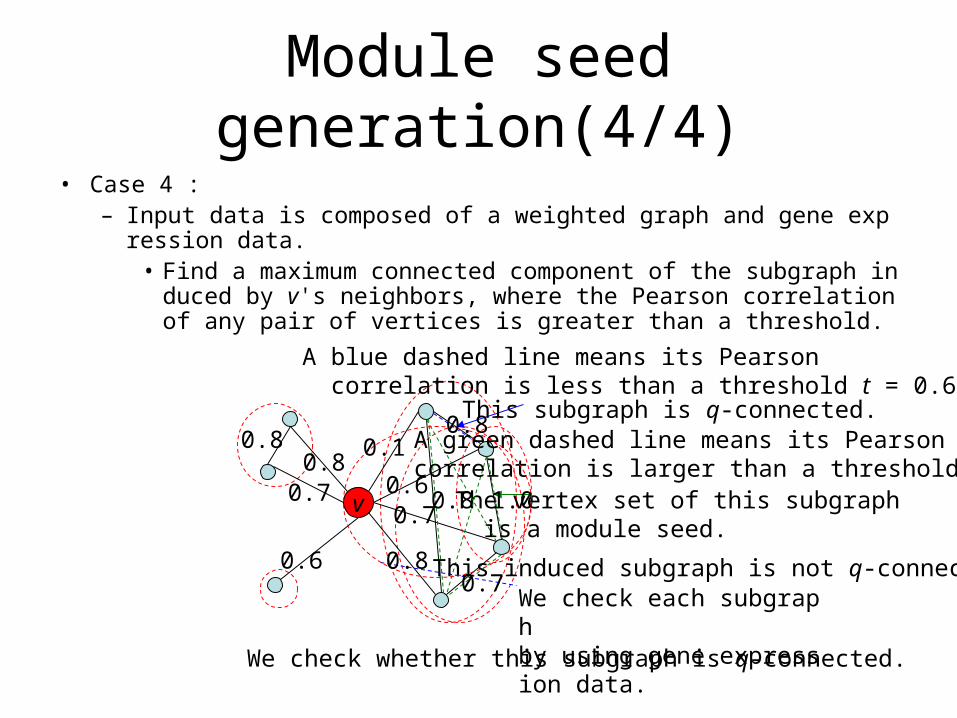
• Case 4 : – Input data is composed of a weighted graph and gene expression data.
• Find a maximum connected component of the subgraph induced by v's neighbors, where the Pearson correlation of any pair of vertices is greater than a threshold.
v The vertex set of this subgraph is a module seed.
A blue dashed line means its Pearson correlation is less than a threshold t = 0.6
A green dashed line means its Pearson correlation is larger than a threshold t = 0.6
This induced subgraph is not q-connected.
0.8 0.1
0.8
0.8
0.7
0.60.7
1.0
0.6
0.80.7 0.8
We check whether this subgraph is q-connected.
We check each subgraph by using gene expression data.
This subgraph is q-connected.
Module growth
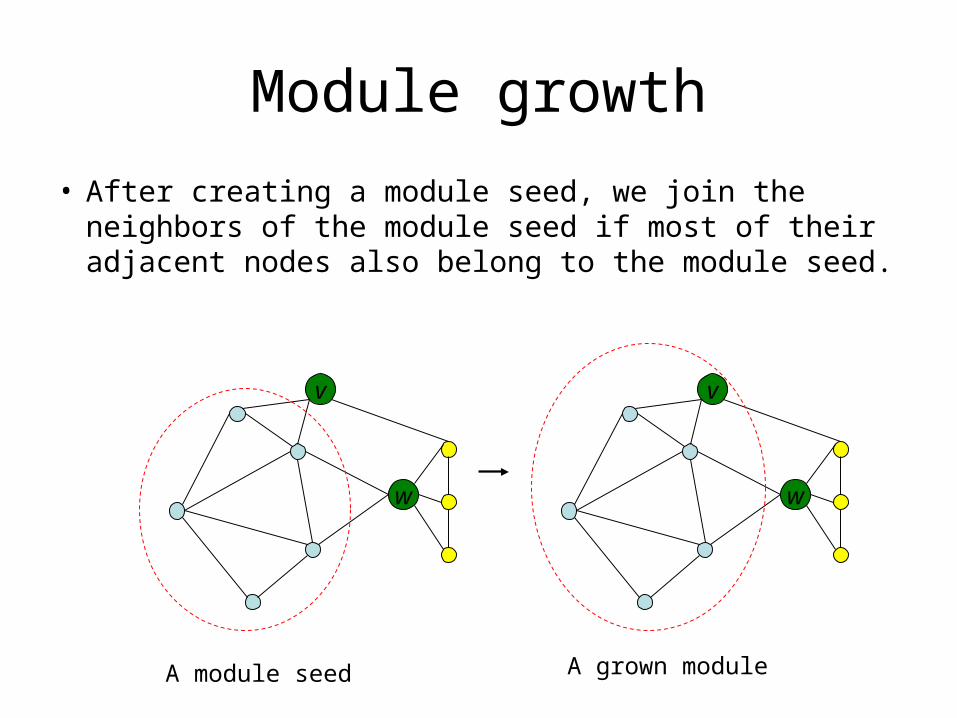
• After creating a module seed, we join the neighbors of the module seed if most of their adjacent nodes also belong to the module seed.
v
w
A module seed
v
w
A grown module
Module amalgamation
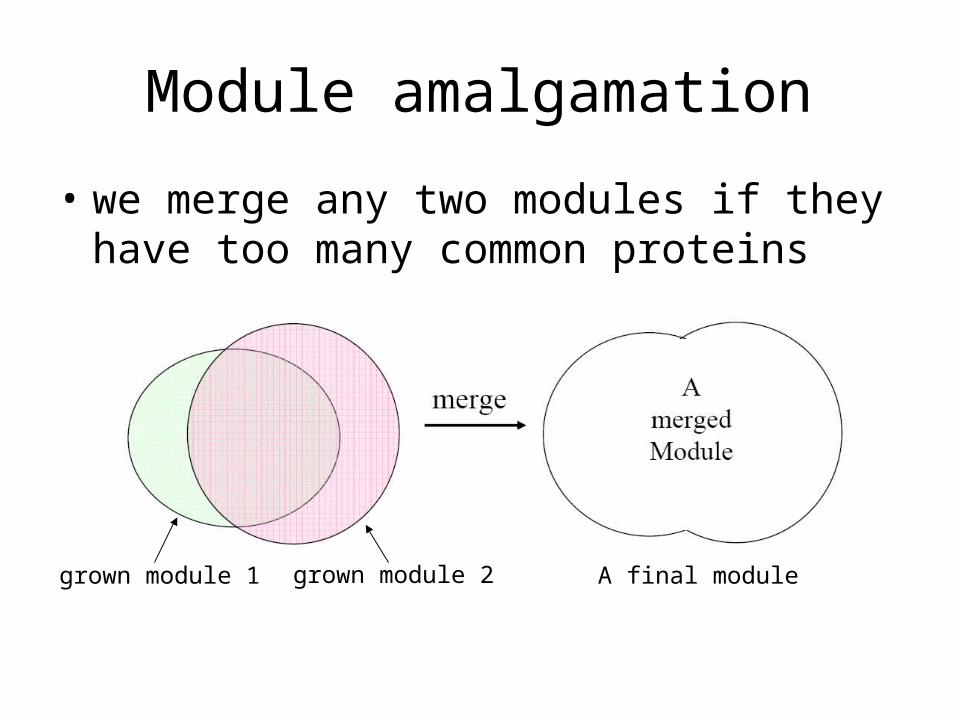
• we merge any two modules if they have too many common proteins
grown module 1 grown module 2 A final module
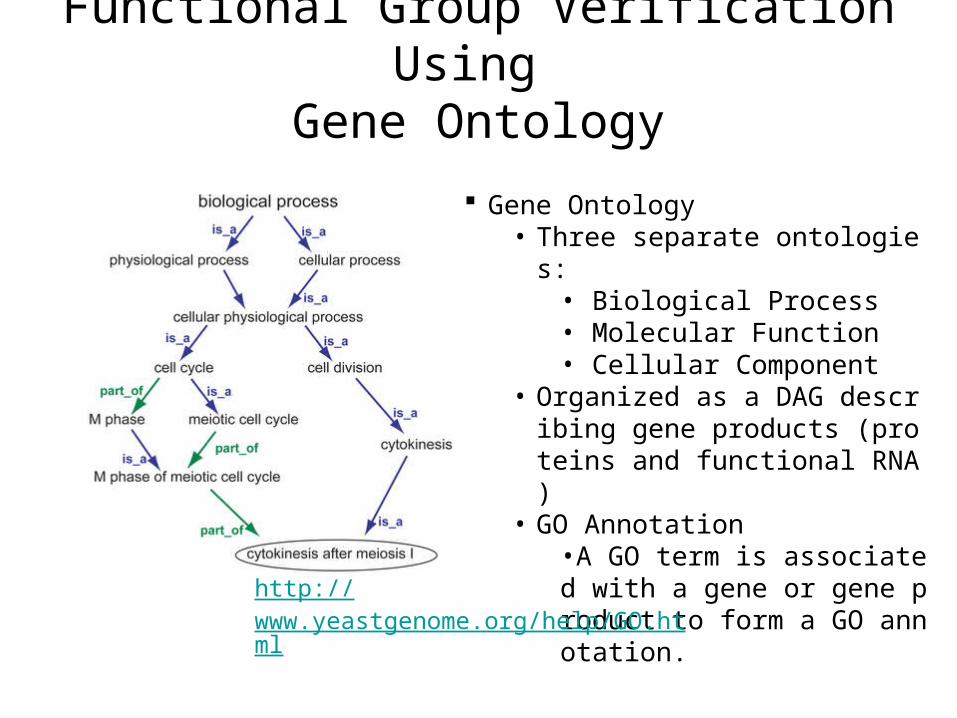
Functional Group Verification Using Gene Ontology
Gene Ontology• Three separate ontologies:
• Biological Process• Molecular Function• Cellular Component
• Organized as a DAG describing gene products (proteins and functional RNA)
• GO Annotation•A GO term is associated with a gene or gene product to form a GO annotation.
http://www.yeastgenome.org/help/GO.html
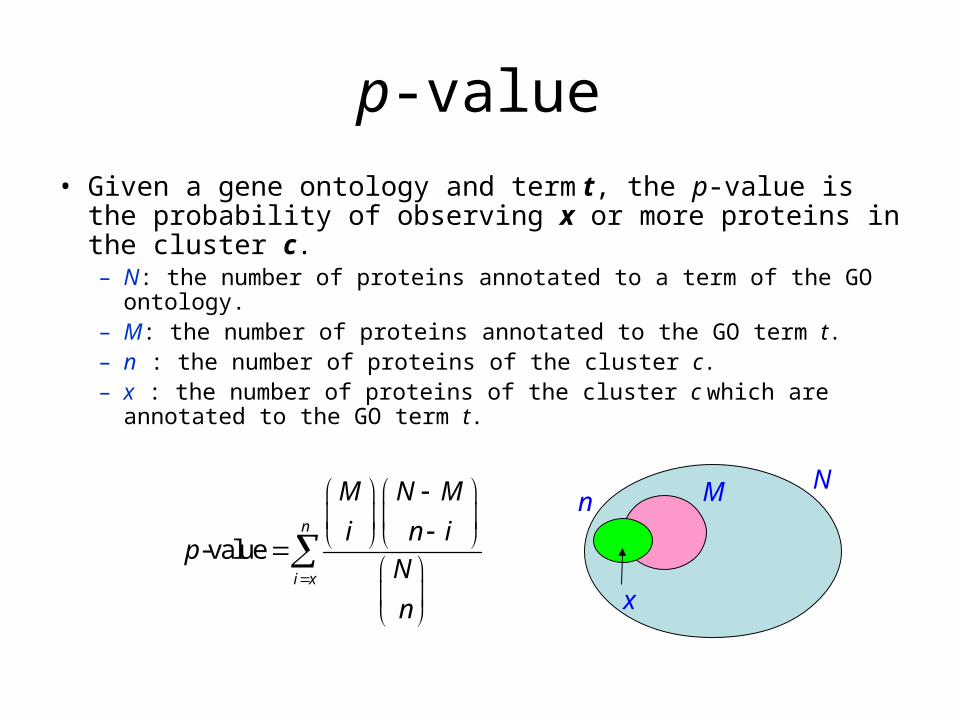
p-value
• Given a gene ontology and term t, the p-value is the probability of observing x or more proteins in the cluster c.– N: the number of proteins annotated to a term of the GO ontology.– M: the number of proteins annotated to the GO term t.– n : the number of proteins of the cluster c.– x : the number of proteins of the cluster c which are annotated to the
GO term t.
-value
n
i x
M N M
i n ip
N
n
NMn
x
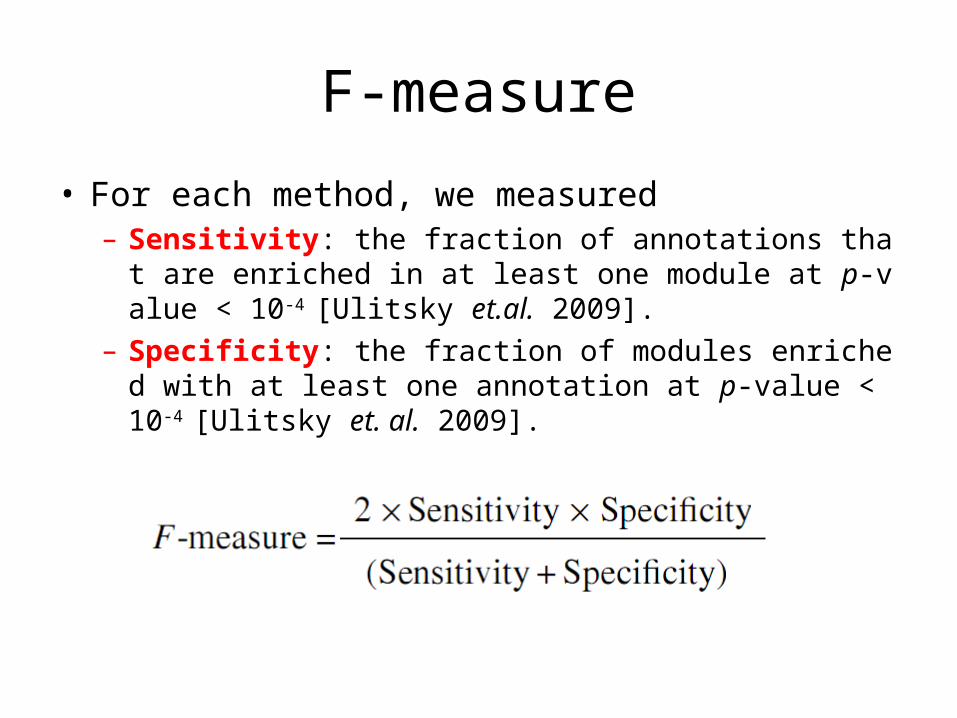
F-measure
• For each method, we measured– Sensitivity: the fraction of annotations that are enriched in
at least one module at p-value < 10-4 [Ulitsky et.al. 2009].
– Specificity: the fraction of modules enriched with at least one annotation at p-value < 10-4 [Ulitsky et. al. 2009].
We compare our method with three newly developed methods
• CEZANNA [Ulitsky et. al. 2009]
• CMC [Liu et. al. 2009]
• Core [Leung et. al. 2009]
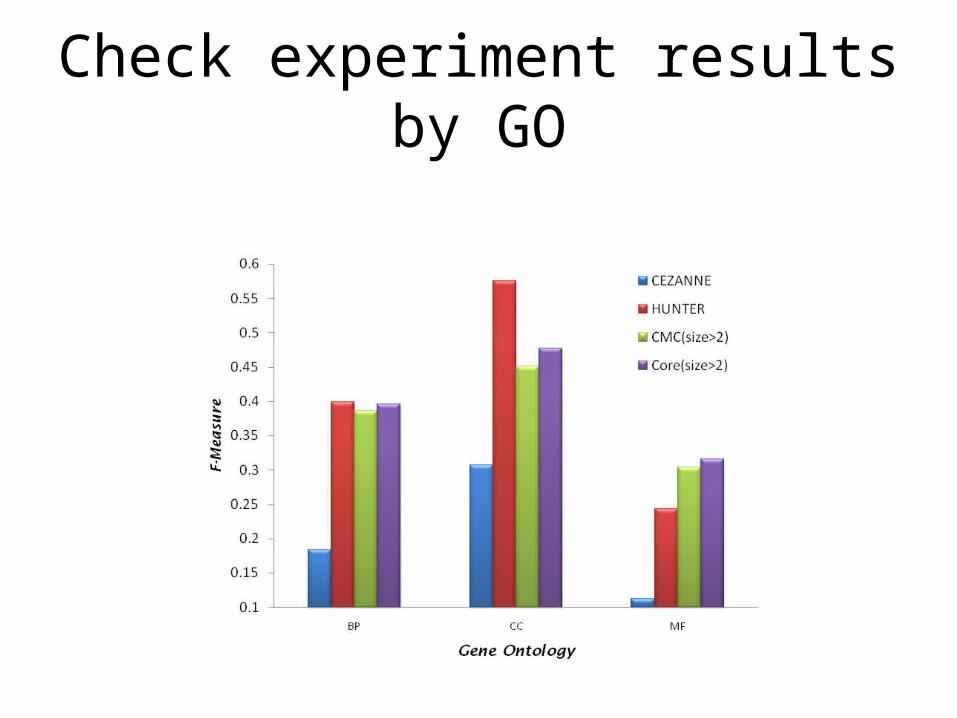
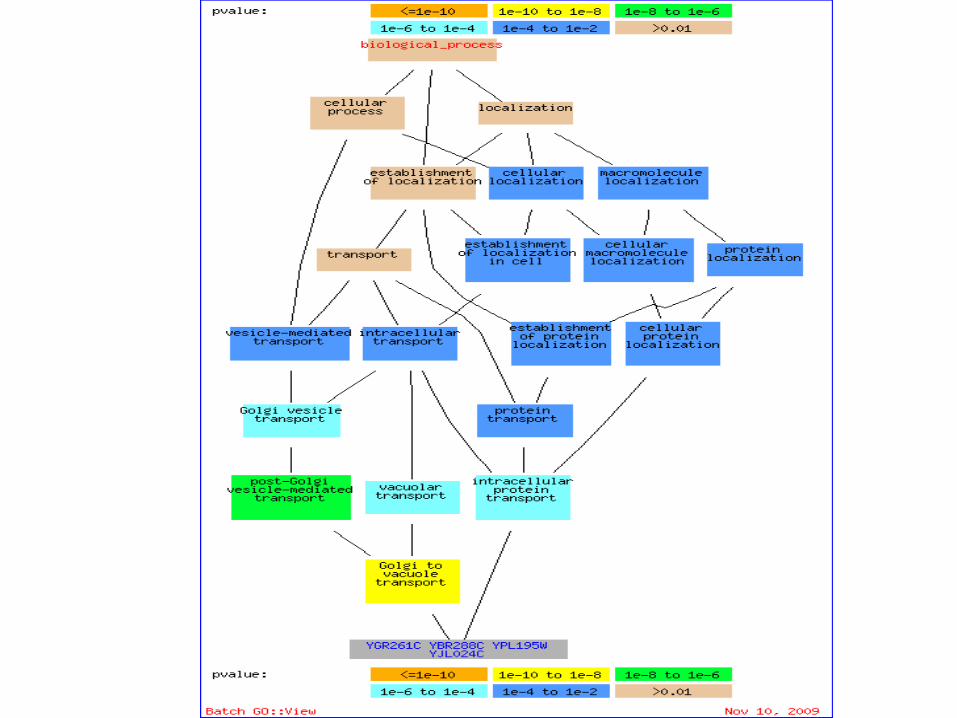
Check experiment results by GO
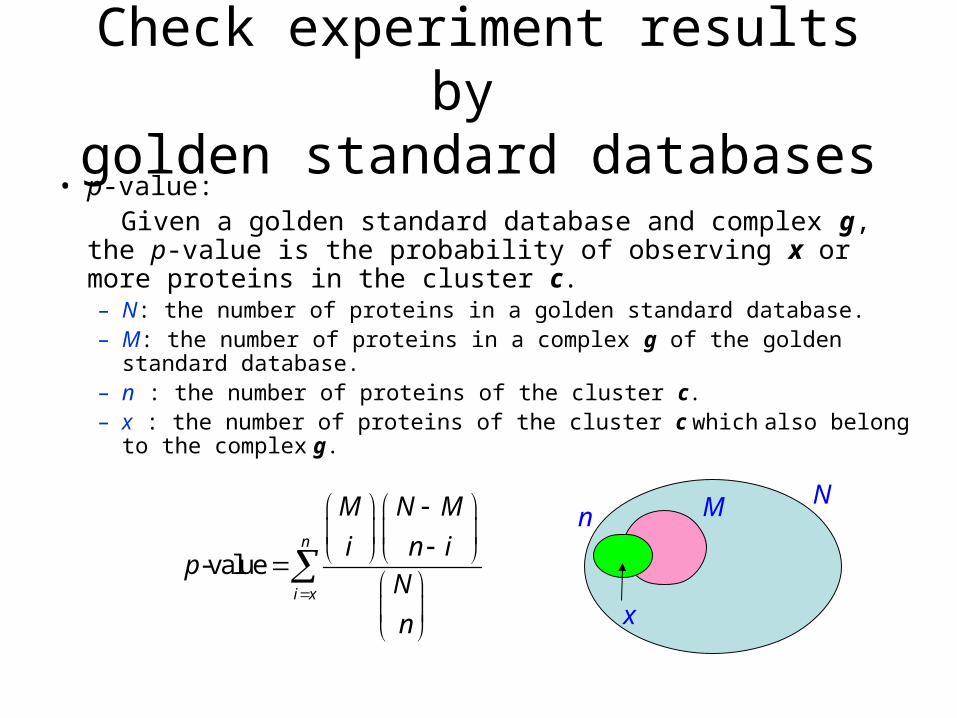
Check experiment results by golden standard databases
• p-value: Given a golden standard database and complex g, the p-value is
the probability of observing x or more proteins in the cluster c.– N: the number of proteins in a golden standard database.– M: the number of proteins in a complex g of the golden standard database.– n : the number of proteins of the cluster c.– x : the number of proteins of the cluster c which also belong to the
complex g.
-value
n
i x
M N M
i n ip
N
n
NMn
x
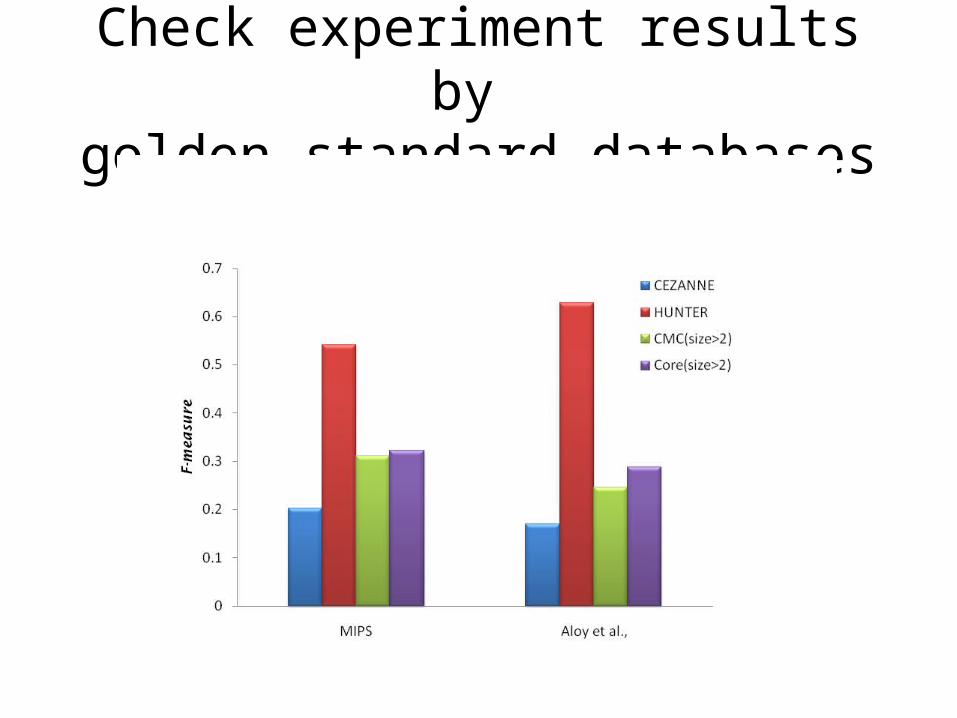
Check experiment results by golden standard databases
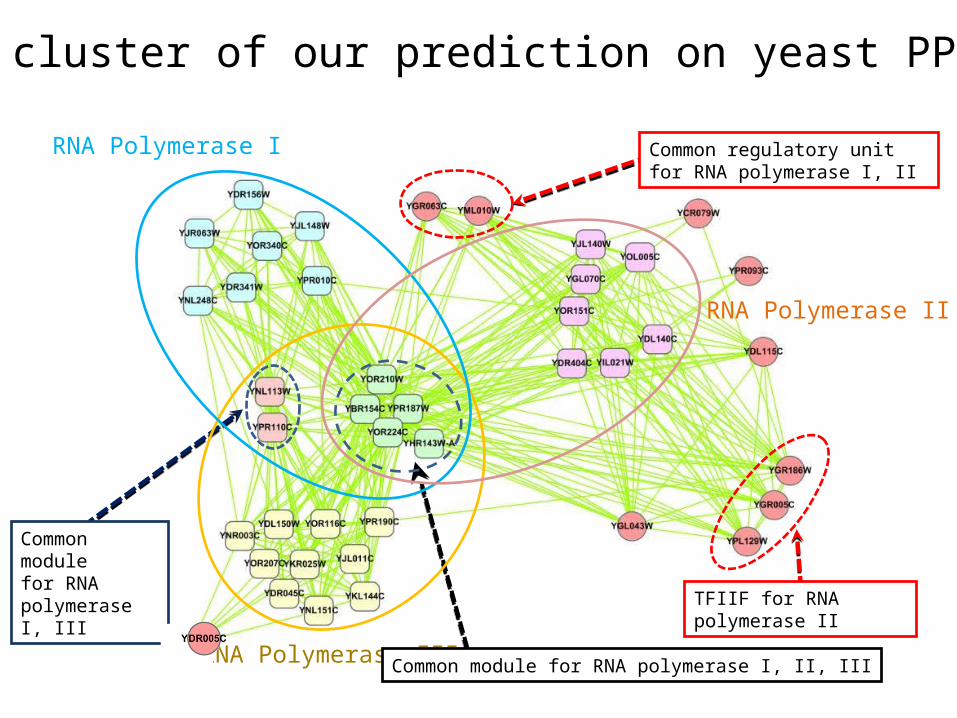
RNA Polymerase I
RNA Polymerase III
RNA Polymerase II
Common module for RNA polymerase I, II, III
Common module for RNA polymerase I, III
Common regulatory unit for RNA polymerase I, II
TFIIF for RNA polymerase II
A cluster of our prediction on yeast PPI
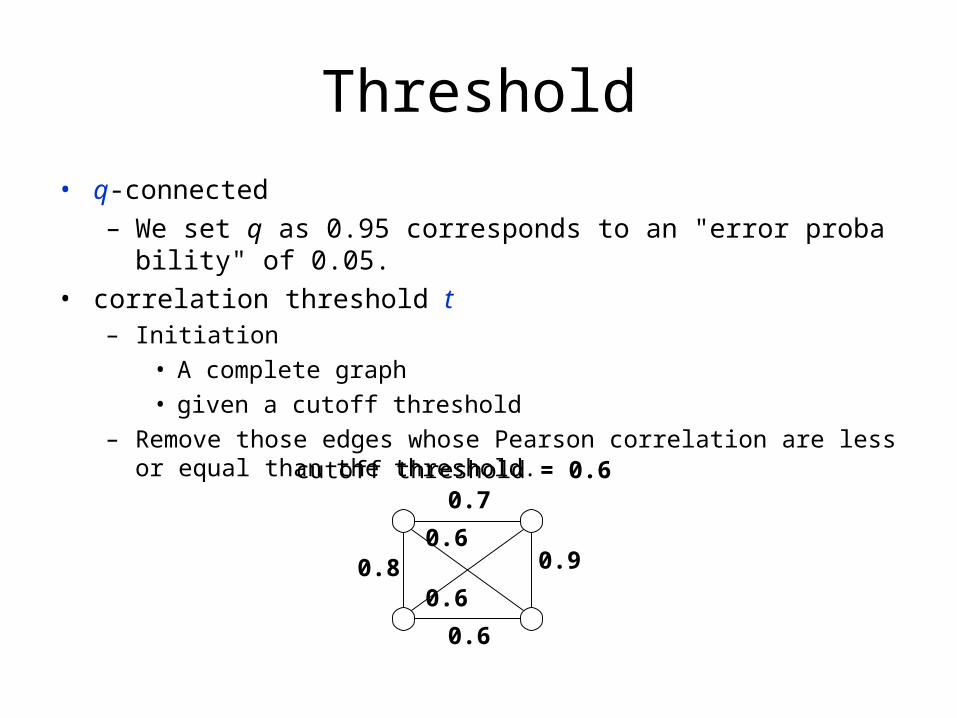
Threshold
• q-connected
– We set q as 0.95 corresponds to an "error probability" of 0.05.
• correlation threshold t – Initiation
• A complete graph
• given a cutoff threshold
– Remove those edges whose Pearson correlation are less or equal than the threshold.
0.7
0.9
0.6
0.80.6
0.6
cutoff threshold = 0.6
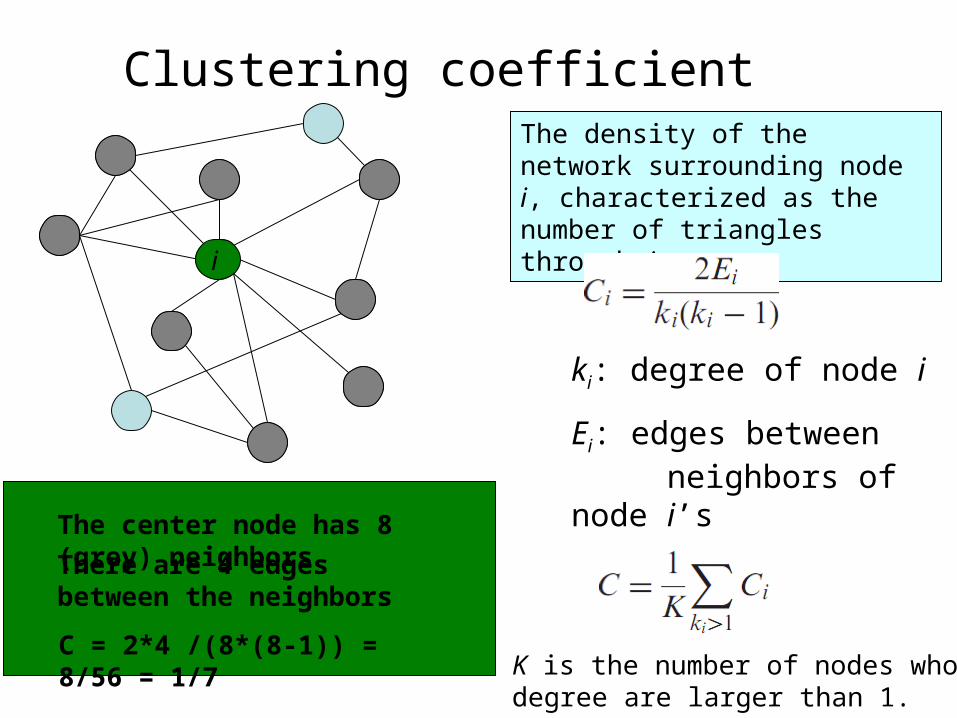
Clustering coefficient
ki: degree of node i
Ei: edges between neighbors of node i’s
The density of the network surrounding node i, characterized as the number of triangles through i.
i
The center node has 8 (grey) neighborsThere are 4 edges between the neighbors
C = 2*4 /(8*(8-1)) = 8/56 = 1/7K is the number of nodes whose degree are larger than 1.
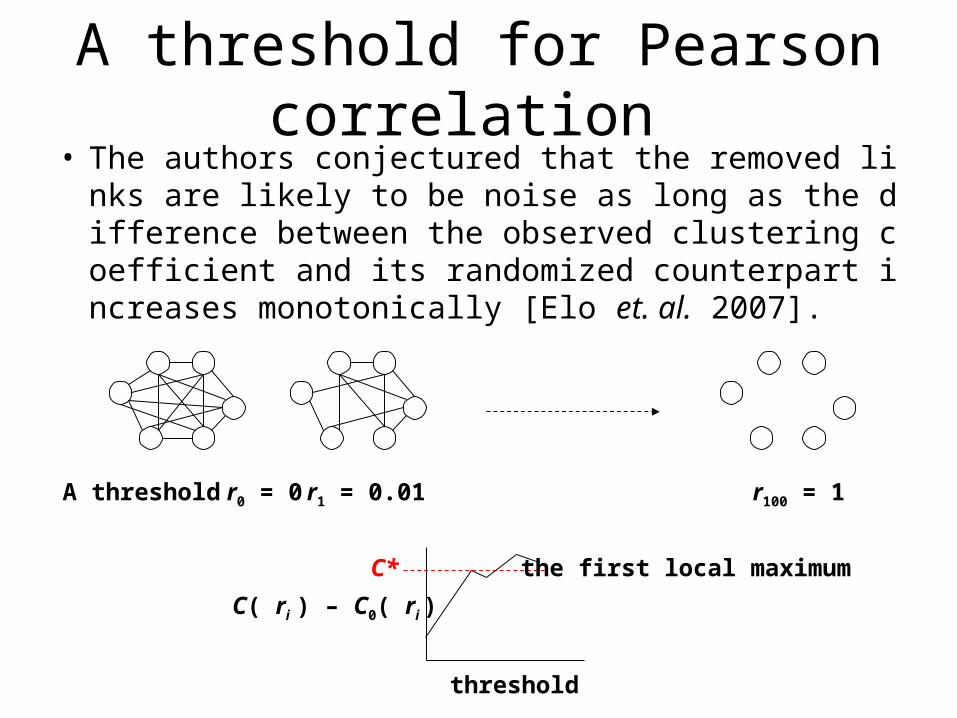
A threshold for Pearson correlation • The authors conjectured that the removed links are lik
ely to be noise as long as the difference between the observed clustering coefficient and its randomized counterpart increases monotonically [Elo et. al. 2007].
A threshold r0 = 0 r1 = 0.01 r100 = 1
threshold
C( ri ) – C0( ri )
the first local maximumC*
References
• Elo LL, Jarvenpaa H, Oresic M, Lahesmaa R, Aittokallio T: Systematic construction of gene coexpression networks with applications to human T helper cell differentiation process. Bioinformatics 2007, 23(16):2096-2103.
• Liu G, Wong L, Chua HN: Complex discovery from weighted PPI networks. Bioinformatics 2009, 25(15):1891-1897.
• Leung HC, Xiang Q, Yiu SM, Chin FY: Predicting protein complexes from PPI data: a core-attachment approach. J Comput Biol 2009, 16(2):133-144.
• Ulitsky I, Shamir R: Identifying functional modules using expression profiles and confidence-scored protein interactions. Bioinformatics 2009, 25(9):1158-1164.

Thank you for your attention!


![Untitled-1 [] · 2018. 3. 27. · Hatve Yüksekligi 1,4/ / l, 4/ / l, 4/ 1,6/ / l, 4/ / 1,4/ / l, 4/ 1,611 / 1,4/ 1,4/ / Kod 55300500 55300600 55300700 55300800 55300900 55301000](https://img.pdfslide.us/doc/110x75/60c24b180629fe1226743c36/untitled-1-2018-3-27-hatve-yksekligi-14-l-4-l-4-16-l-4.jpg)