Embed Size (px)
Citation preview

A holistic study on smart grids and a business case study
of an energy management service provider
Krishna Reddy
Thesis to obtain the Master of Science Degree in
Energy Engineering and Management
Supervisors: Prof Carlos Augusto Santor Silva
Mr. Stefan Lodeweyckx
Examination Committee
Chairperson: Prof Duarte de Mesquita e Sousa
Supervisor: Prof Carlos Augusto Santos Silva
Member of the Committee: Prof José Manuel Costa Dias de Figueiredo
November 2016

ii
ACKNOWLEDGEMENT
I would like to thank my thesis advisor at Enervalis, Mr. Stefan Lodeweyckx. He has steered me
in the right direction whenever he thought I needed it. I am grateful for all the knowledge shared with
me during my stay at Enervalis and I have learnt a great deal about Smart grids during the 6 months.
I would also like to acknowledge Prof. Carlos Silva of the Dept. of Mechanical Engineering at IST,
Lisbon for his valuable insights and I am gratefully indebted to his constructive comments on this thesis.
Finally, I must express my very profound gratitude to my colleagues of ENTECH at KIC InnoEnergy
mater School for providing me with unfailing support and continuous encouragement throughout my
Master’s program. This accomplishment would not have been possible without them. Thank you.
Author
Krishna reddy

iii
Resumo O objective desta tesa é desenvolver um estudo holístico relativamente ao tópico das Redes
Inteligentes e a partir desse estudo propor uma análise de mercado e um plano de negócios para a
empresa Enervalis,de forma a que esta possa identificar futuras oportunidades e modelos de negócio.
Com o aumento da utilização de energias de origem renovável, leva a que as empresas de serviços de
energia olhem para as oportunidades relativamente à gestão entre a oferta e a procura em tempo real,
a partir da gestão activa de consumos. Estes serviços permitem aos utilizadores monitorizar e controlar
os fluxos de energia no seu sistema, mas é necessário desenvolver mais serviços, com a participação
de outros actores. Este estudo procura assim identificar quais poderão ser esses actores e quais os
mecanismos de remuneração que devem ser desenvolvidos para os envolver, originando novos
serviços de energia.
Para responder a estas questões, foi desenvolvido um estudo sobre a evolução das redes inteligentes,
uma caracterização das tecnologias que permitem a sua implementação e uma identificação dos
potenciais actores. Com base no caso de estudo da empresa Enervalis, foi identificado que para
desenvolver mais o modelo de negócio, é necessário olhar para a estrutura dos tarifários e para as
oportunidades oferecidas pelos mercados de capacidade e reserva. Foi ainda identificado que estas
empresas devem ter um portfolio alargado de soluções para serem sustentáveis.
As recomendações deste estudo foram utilizados pela Enervalis para alterar a sua estratégia de
negócio.
Keywords: Redes Inteligentes, Análise de Competidores, Análise SWOT, diagrama do Modelo de
negócios.

iv
ABSTRACT
The subject of this thesis concerns the holistic study of Smart grids and to conduct a business case
study and market analysis of Enervalis to determine its future business models.
Rise of renewables and its intermittencies has given rise to Energy management service companies
which balance the load-generation in real-time using demand response actions. Such services enable
the user to monitor and control the energy flow in their system. But are these services enough? Can
there be other stakeholders involved? If so, who are they? And what kind of remuneration mechanisms
exist to help develop new services?
To answer the above questions, the evolution of smart grids, enabling technologies and various stake-
holders were studied. Using a case study of Enervalis, its solutions were thoroughly examined. A
Business Model Canvas helped develop the company’s profile.
Enervalis participates in the electricity market by offering grid stability services through capacity reserves
and demand response actions. Hence it’s imperative to study electricity tariffs and cost structures of
Capacity and Demand response markets to find out the possible business models.
During the research, it was determined that energy management service companies cannot operate on
single business model but rather need multiple business models to sustain. Hence, all possible business
models with all stakeholders were researched and explained.
Furthermore, mechanisms to analyse the competitors of Enervalis and to determine its current position
in the market were created. The results of these helped develop recommendations for the development
of Enervalis.
Keywords: Smart Grids, Capacity Markets, Demand Response markets, Remuneration mechanisms,
SmartPowerSuiteÒ, Enervalis, Competitors analysis
TABLE OF CONTENTS
1. Introduction..............................................................................................................1
1.1 ObjectivesandMethodology.............................................................................................2
1.2 StructureofThesis.............................................................................................................3
2. Smartgrids...............................................................................................................5
2.1 Evolutionofsmartgrids.....................................................................................................5
2.2 Enablingtechnologies........................................................................................................6
2.2.1 Distributedgeneration(DG):.............................................................................................6
2.2.2 Energystoragetechnologies.............................................................................................7
2.2.3 Powerelectronics..............................................................................................................7
2.2.4 Control,AutomationandMonitoring................................................................................8
2.2.5 Distributedautomationandprotection..........................................................................10
2.2.6 Communication...............................................................................................................10
2.3 Stakeholders....................................................................................................................11
2.3.1 Endusers.........................................................................................................................11
2.3.2 Electricitynetworkowners..............................................................................................11
2.3.3 Energyservicecompanies...............................................................................................11
2.3.4 Technologyproviders......................................................................................................12
2.3.5 Researchers.....................................................................................................................12
2.3.6 Traders.............................................................................................................................12
2.3.7 Generators.......................................................................................................................12
2.3.8 Regulators........................................................................................................................12
2.3.9 Governmentalagencies...................................................................................................12
2.3.10 Adequateworkforceandcontinuouseducation.............................................................13
2.3.11 Advancedenergymanagementserviceproviders..........................................................13
2.4 Barriers............................................................................................................................13
2.5 Thefuture........................................................................................................................13
3. EnergymanagementtoolofEnervalis.....................................................................15
3.1 SmartPowerSuiteÒ..........................................................................................................16
3.1.1 CharacteristicsofSmartPowerSuiteÒ.............................................................................16
3.1.2 SmartEVcharging............................................................................................................17
3.1.3 SmartBuildings................................................................................................................18
3.1.4 Smartmicrogrids.............................................................................................................20
vi
3.1.5 Thegateway....................................................................................................................21
3.2 Systemarchitecture.........................................................................................................22
3.2.1 Fieldlayer........................................................................................................................23
3.2.2 Controllayer....................................................................................................................23
3.2.3 Visuallayer......................................................................................................................23
3.2.4 Interfacelayer..................................................................................................................23
3.2.5 Securitylayer...................................................................................................................24
3.3 ThePortal........................................................................................................................24
4. Marketanalysis.......................................................................................................29
4.1 BusinessmodelcanvasofEnervalis.................................................................................29
4.2 Aboutthemarket............................................................................................................34
4.3 Industrycoststructure.....................................................................................................34
4.3.1 Networktariffstructures.................................................................................................37
4.3.2 Capacitypricing...............................................................................................................39
4.3.3 Demandresponsemarkets..............................................................................................40
4.4 FutureBusinessmodels...................................................................................................42
4.4.1 EnergyEfficiency(EE)businessmodels...........................................................................43
4.4.2 DemandresponsebusinessmodelswithregardtoSystemoperation...........................44
4.4.3 DemandresponsebusinessmodelsrelatedtoGeneration.............................................50
4.4.4 Businessmodelsinvolvingthetransmission/distributionstakeholder...........................52
4.4.5 Demandresponsebusinessmodelsinvolvingenergyretailingandloadsegments........53
4.4.6 BusinessmodelsinvolvingLoad......................................................................................55
5. Competitoranalysis................................................................................................58
5.1 SmartEVcharging............................................................................................................58
5.1.1 Productfeaturecomparison............................................................................................58
5.1.2 Companycomparison......................................................................................................59
5.1.3 Competitivescoring.........................................................................................................59
5.1.4 Results.............................................................................................................................60
5.2 SmartBuildings................................................................................................................61
5.2.1 Results.............................................................................................................................61
5.3 SmartMicro-grids............................................................................................................63
5.3.1 CompetitiveScoring.........................................................................................................64

vii
5.3.2 Results.............................................................................................................................64
5.4 Toolstoupdatecompetitoranalysis................................................................................66
6. ConclusionsandRecommendations........................................................................70
7. BIBLIOGRAPHY........................................................................................................73
8. APPENDIX...............................................................................................................78

viii
LIST OF FIGURES
FIGURE1:FUTURESMARTGRIDS[9]......................................................................................................................6FIGURE2:COMPARISONOFDISCHARGEDURATIONVERSUSRATEDPOWERFORGRIDENERGYSTORAGE
TECHNOLOGIES[12]........................................................................................................................................7FIGURE3:INTELLIGENCE-BASEDCONTROLSTRUCTUREFORPOWERELECTRONICSINSMARTGRIDS[12]..........9FIGURE4:CHARACTERISTICSOFSOMEWIRELESSCOMMUNICATIONTECHNOLOGIES:BANDWIDTHVS.
TRANSMISSIONRANGE[12]...........................................................................................................................11FIGURE5:PROPOSEDSOLUTIONOFENERVALIS...................................................................................................15FIGURE6:CHARACTERISTICSOFSMARTPOWERSUITE.........................................................................................16FIGURE7:MAPOFEVREGISTRATIONSPEREUMEMBERSTATE.[27]..................................................................17FIGURE8:SHAREOFTOTALEUENERGYCONSUMPTION[30].............................................................................19FIGURE9:PROJECTRENNOVATES[35].................................................................................................................20FIGURE10:OVERVIEWOFSYSTEMARCHITECTURE..............................................................................................22FIGURE11:LOGICLAYERSOFSMARTPOWERSUITEÒ...........................................................................................22FIGURE12:SYSTEMOVERVIEWASVIEWEDIN‘THEPORTAL’..............................................................................24FIGURE13:ANALYSISOFSECTIONCOFPORTAL..................................................................................................25FIGURE15:ENERGYUSAGEDURINGTHEDAY......................................................................................................26FIGURE16:ANALYSISOFHEATPUMP–POWER..................................................................................................26FIGURE17:ANALYSISOFHEATPUMP–TEMPERATURE.......................................................................................27FIGURE18:ELECTRICITYDAYAHEADANDINTRADAYIMBALANCEPRICECHART................................................27FIGURE19:KEYPARTNERS,KEYACTIVITIES,ANDKEYRESOURCES.......................................................................29FIGURE20:CUSTOMERSEGMENTS,CUSTOMERRELATIONSHIPSANDCHANNELS.............................................31FIGURE21:VALUEPROPOSITION..........................................................................................................................32FIGURE22:COSTSTRUCTUREANDREVENUESTREAMS.......................................................................................33FIGURE23:AVERAGEELECTRICITYPRICESFORPRIVATECUSTOMERS[43]..........................................................35FIGURE24:AVERAGEELECTRICITYPRICESFORINDUSTRIALCUSTOMERS[43]...................................................35FIGURE25:VARIOUSCOMPONENTSOFELECTRICITYTARIFFS.............................................................................36FIGURE26:DISTRIBUTIONOFCOSTFACTORSWITHINRETAILELECTRICITYPRICES[44].....................................37FIGURE27:STATEOFCRMINEUROPE[45]...........................................................................................................40FIGURE28:DEMANDRESPONSEACTIONS.[44]....................................................................................................40FIGURE29:DEMANDRESPONSEMAPFOREUROPE2013-14[46].......................................................................42FIGURE30:ELECTRICITYMARKETRELATEDDSMBUSINESSMODELS..................................................................43FIGURE31:SYSTEMOPERATIONSEGMENTRELATEDDRBUSINESSMODELS......................................................44FIGURE32:OVERVIEWOFGENERATIONSEGMENTDRBUSINESSMODELS.........................................................50FIGURE33:TRANSMISSION/DISTRIBUTIONRELATEDDRBUSINESSMODELS......................................................52FIGURE34:ENERGYRETAILINGSEGMENTDRMODELS........................................................................................53

ix
FIGURE35:LOADSEGMENTRELATEDDRBUSINESSMODELS..............................................................................55FIGURE36:COMPETITIVESCORING–SMARTEVCHARGING...............................................................................60FIGURE37:INDIVIDUALCOMPETITIVEANALYSIS–SMARTEVCHARGING..........................................................60FIGURE38:TOTALCOMPETITIVESCORE–SMARTBUILDINGS.............................................................................61FIGURE39:INDIVIDUALCOMPETITIVEANALYSIS–SMARTBUILDINGS...............................................................62FIGURE40:TOTALCOMPETITIVESCORE–SMARTMICROGRIDS........................................................................64FIGURE41:INDIVIDUALCOMPETITIVEANALYSIS–SMARTMICROGRIDS...........................................................65FIGURE42:PRICINGSCHEMESOFCBINSIGHTS....................................................................................................68FIGURE43:PRICINGSCHEMESOFDEALROOM.....................................................................................................68

x
LIST OF TABLES
TABLE1:FEATURESOFFIELDLAYER.....................................................................................................................23TABLE2:FEATURESOFCONTROLLAYER..............................................................................................................23TABLE3:SWOTANALYSISOFENERVALIS........................................................ERROR!BOOKMARKNOTDEFINED.TABLE4:ELECTRICITYNETWORKTARIFFSTRUCTURES.........................................................................................38TABLE5:COMPARISONOFEXISTINGCRMINTERMSOFCAPACITYPRICING.......................................................39TABLE6:STATUSQUOOFDEMANDRESPONSEACTIVITY....................................................................................42TABLE7:CHARACTERISTICSOFANCILLARYSERVICEMARKETPARTICIPATIONBUSINESSMODEL.......................45TABLE8:CHARACTERISTICSOFCONTRACT-BASEDRELIABILITYENHANCEMENTSERVICEBUSINESSMODEL.....47TABLE9:CHARACTERISTICSOFFREQUENCYREGULATIONBUSINESSMODEL.....................................................48TABLE10:CHARACTERISTICSOFCAPACITYPROVISIONBUSINESSMODEL..........................................................48TABLE11:CHARACTERISTICSOFMARKETEFFICIENCYENHANCEMENTBUSINESSMODEL.................................49TABLE12:CHARACTERISTICSOFREDUCINGVGUINTERMITTENCYCOSTREDUCTIONMODEL...........................51TABLE13:CHARACTERISTICSOFGENERATIONLOADBALANCINGSERVICEBUSINESSMODEL...........................51TABLE14:CHARACTERISTICSOFCONGESTIONMANAGEMENTBUSINESSMODEL.............................................52TABLE15:CHARACTERISTICSOFENERGYPROCUREMENTIMPROVEMENTRELATEDBUSINESSMODEL............54TABLE16:CHARACTERISTICSOFCAPACITYMANAGEMENTBUSINESSMODELS..................................................54TABLE17:CHARACTERISTICSOFPRICE-BASEDBEHAVIOURALDRBUSINESSMODEL..........................................55TABLE18:CHARACTERISTICSOFGRIDCOSTREDUCTIONBUSINESSMODEL.......................................................56TABLE19:CHARACTERISTICSOFGRIDINDEPENDENCEBUSINESSMODEL..........................................................57
xi
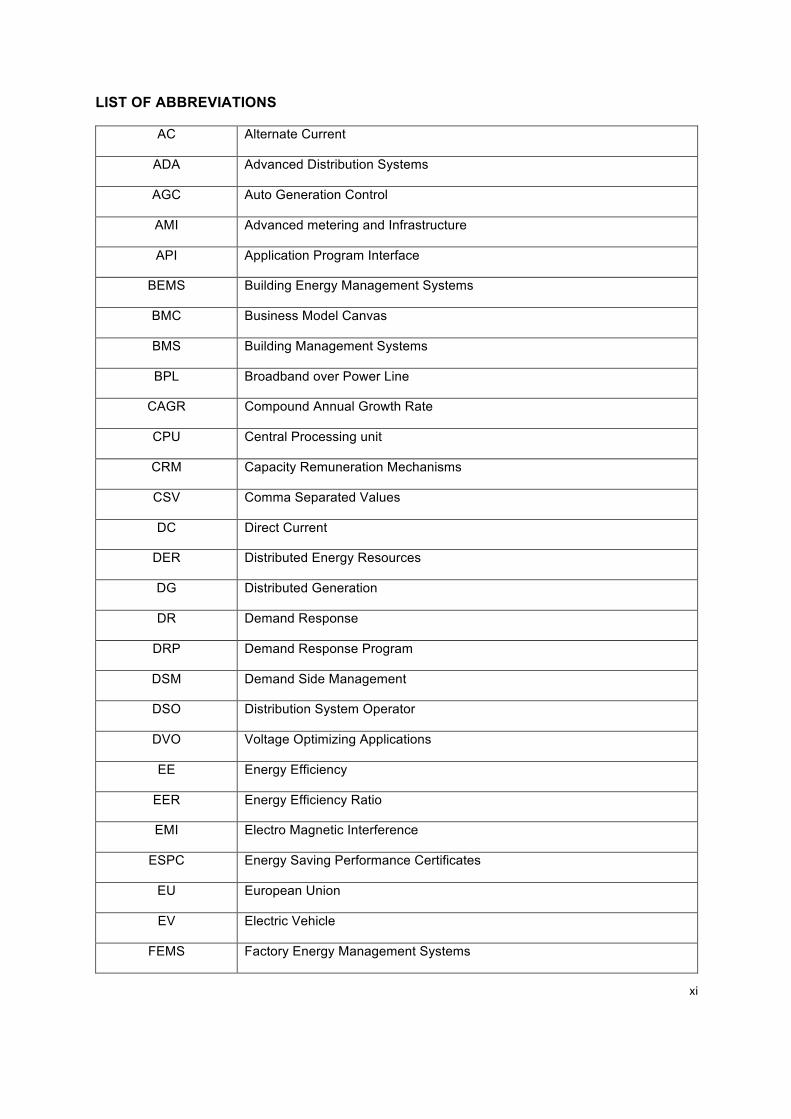
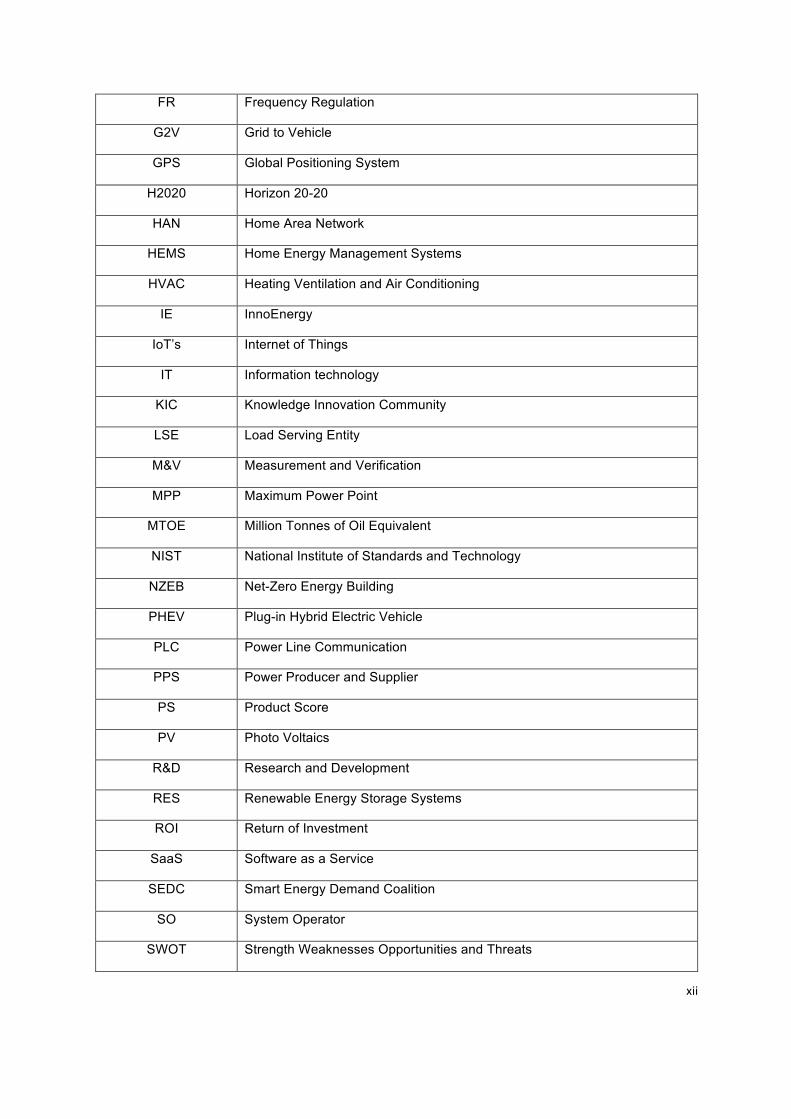
LIST OF ABBREVIATIONS
AC Alternate Current
ADA Advanced Distribution Systems
AGC Auto Generation Control
AMI Advanced metering and Infrastructure
API Application Program Interface
BEMS Building Energy Management Systems
BMC Business Model Canvas
BMS Building Management Systems
BPL Broadband over Power Line
CAGR Compound Annual Growth Rate
CPU Central Processing unit
CRM Capacity Remuneration Mechanisms
CSV Comma Separated Values
DC Direct Current
DER Distributed Energy Resources
DG Distributed Generation
DR Demand Response
DRP Demand Response Program
DSM Demand Side Management
DSO Distribution System Operator
DVO Voltage Optimizing Applications
EE Energy Efficiency
EER Energy Efficiency Ratio
EMI Electro Magnetic Interference
ESPC Energy Saving Performance Certificates
EU European Union
EV Electric Vehicle
FEMS Factory Energy Management Systems
xii
FR Frequency Regulation
G2V Grid to Vehicle
GPS Global Positioning System
H2020 Horizon 20-20
HAN Home Area Network
HEMS Home Energy Management Systems
HVAC Heating Ventilation and Air Conditioning
IE InnoEnergy
IoT’s Internet of Things
IT Information technology
KIC Knowledge Innovation Community
LSE Load Serving Entity
M&V Measurement and Verification
MPP Maximum Power Point
MTOE Million Tonnes of Oil Equivalent
NIST National Institute of Standards and Technology
NZEB Net-Zero Energy Building
PHEV Plug-in Hybrid Electric Vehicle
PLC Power Line Communication
PPS Power Producer and Supplier
PS Product Score
PV Photo Voltaics
R&D Research and Development
RES Renewable Energy Storage Systems
ROI Return of Investment
SaaS Software as a Service
SEDC Smart Energy Demand Coalition
SO System Operator
SWOT Strength Weaknesses Opportunities and Threats

xiii
TEDS Transduced Electronic Data Sheet
TOU Time Of Use
TSO Transmission System Operator
UFR Under Frequency Relay
V2B Vehicle to Building
V2G Vehicle to Grid
VAT Value Added taxes
VC Venture Capital
VGU Variable Generation Units
VPP Virtual Power Plant
VSG Virtual Synchronous Generators
ZOM Zero-on-Meter
1
1. Introduction
The fundamental requirements for survival and development of a community were listed as access to
food, shelter and clothing until 2 centuries ago. Today we add one more resource to it i.e. the need for
energy. We are surrounded by the necessities to power our devices, instruments and machines we are
dependent on. The energy consumption today compared to a century ago is staggering high. We have
come a long way from energy consumption of around 5000 MTOE (Million tonnes oil equivalent) to
13147MTOE in 2015.[1] The type of energy consumption varies from residential, commercial to
industrial consumers. About 40% of the final energy consumption is in the form of electricity[2]. While a
large portion of industries consume resources like petroleum, natural gas, coal directly, the residential
and commercial users consume energy mostly in the form of electricity; its global use increased by 54%
between 1990 and 2005 [3]. This brings us to the question ‘How important is our electric grid? ‘
An electric grid is the lifeline for the development of the country/region. Similar to the roads and highways
as they ensure a smooth flow of vehicular traffic, there is a need for a stable and efficient electric grid to
ensure there is an unobstructed flow of electricity is the requirement of the future. In Europe alone, the
approximate length of all the power lines established is around 10 million km [4]. If you lay all these
cables in a single stretch, we will be able to reach moon and back a staggering 13 times. The electric
distribution system in Europe is very diverse. It varies accordingly with size of its operational area,
number of customers and the network characteristics. The production and distribution of electricity has
had a top-down approach for several decades until now. It is a one-way energy flow channel, from the
power stations, via the transmission and distribution systems, to the final customer. There is little or no
customer participation or end-to-end communications. This approach worked well for many years, and
was responsible for the growth of industrial nations by making electricity omnipresent, but is now
showing its age.
With the introduction of Renewable energy into the grid, it is no longer a one-way street. Distribution
grids have become active and are operating under bi-directional power flows including multi
stakeholders. The European electricity systems have moved to a market model where the generators
are dispatched reacting to the market forces and the grid control centre undertakes the supervisory role
performing actions such as active power balancing, voltage stability etc. Higher grid control, automation
and new technology has initiated the possibility to reduce the dependency from the grid. But does this
make things easier?
2
‘Renewables (including biofuels) increase almost four-fold from1990 to 2005 (+285%). They account for
a quarter of primary energy growth out to 2035, Can the existing grid sustain such growth?’ [3]. The
threat of climate change together with near extinction of fossil fuels has resulted in increased social
responsibility and disinvestment from high carbon emitting sources. Renewable energy sources have
paved their way through an ageing infrastructure. However, Influx of Renewable energy brings a lot of
interaction within the grid. As these sources are intermittent and their availability changes along with the
weather and several factors, our existing infrastructure is not built to handle such interaction and hence
the necessity for an upgradation. There is an urgent need to alleviate grid congestion and improve power
balancing capability. Current policies are not adequate to handle the high demands and price volatility.
To address these problems, the electric grid needs a reform. It is imperative to move from a centralized
generation approach towards a distributed generation and user centric approach. It needs real-time data
analysis, forecasting models, demand response actions to stabilise the grid at any given moment to
protect it from overloading or underloading. Energy management service companies currently cater to
provide these solutions at various levels. A lot of research needs to be done to find solutions to optimise
the system. Better frameworks and legislations need to be put in place to make way for efficient
interaction within the grids. Remuneration schemes need to be figured out to allow these companies to
thrive. An innovative approach to energy industry is required to create new business models. The future
of these companies will determine the effectiveness of our grid. One thing’s for certain, the future electric
grid needs to be smart and sophisticated to handle all kinds of discrepancies while ensuring a stable
and secure grid.
1.1 Objectives and Methodology
In an attempt to put this into context, a detailed study on Evolution of Smart grids is needed. The possible
technological upgradation required needs to be classified and listed. Furthermore, the current grids
consist several stakeholders and hence their role in the grid is imperative to understand.
Using Enervalis as a Business case study, its proposed solutions are need to be studied in detail. A
Business model of the company should throw light on the different stakeholders, key resources,
activities, value proposition etc. Furthermore, a SWOT analysis of the company will present the
company’s strengths and weaknesses.
To develop a sustainable business model for a company like Enervalis, it is important to understand the
existing remuneration mechanisms. As Enervalis participates in the electricity market, it is important to
know electricity tariffs and cost structures of countries across the EU. Enervalis participates in providing
capacity reserves and provides demand response actions to the user, transmission operators and other
stakeholders of the grid. Its services help maintains the stability of the grid and help in increasing the
3
share of renewables. Hence, further research is conducted to analyse capacity markets and demand
response markets of various countries.
Furthermore, as the electricity market involves several stakeholders, Enervalis can participate in the
market with each of these players providing specified services directed towards reducing the operating
costs and maintaining the stability of the grid. Here, several possible services and the business models
revolving around them are needed to be described in detail.
Finally, a growing demand for sustainable energy on the grid has resulted in formation of several
companies to cater to these demands. It is extremely vital to study the range of companies present in
the market and their proposed solutions to identify the growing trends of the market. A competitor
analysis is central to developing unique solutions that have a far-reaching impact on the industry. A
competitor study will help sketch the current scenario of the market and the existing players.
1.2 Structure of Thesis
The thesis starts with a detailed study on the evolution of smart grids and its enabling technologies in
section 2. They are classified into different categories. Furthermore, all the possible stakeholders of an
energy industry are listed and their roles explained in brief. The existing barriers for the development
and the future outlook is also presented.
In section 3, the proposed solutions of Enervalis is studied and explained. The solution
SmartPowerSuiteÒ is carefully analysed and its system architecture and characteristics are described.
The functionalities of SmartPowerSuiteÒ are divided into three market segments; Smart Buildings,
Smart EV charging and Smart Micro-grids. The online Portal which is responsible for displaying all the
relevant information to its users is also elucidated in detail.
Moving further, section 4 begins with a Business model canvas and a SWOT analysis of Enervalis.
Here, its key activities, partners, customer channels, income and revenue streams and other parameters
are individually discussed. It then moves on to study the industry cost structure, analysing the electricity
tariff structures of several countries. They are classified further as; Capacity markets and demand
response markets. The remuneration mechanisms of these markets in different countries are found out
and favourable countries for Enervalis are listed.
Section 4.5 moves towards answering one of the key questions of the thesis. It enlightens about the
possible business models an Energy management service companies can have in the current markets
with respect to all the stakeholders involved. They are further classified into Energy efficiency and
Demand response models. As Enervalis is more qualified for conducting Demand response actions,
various possible models involving system operator, transmission and generation, energy retailing and
load segments are explained in detail. This section also illuminates the current standing of Enervalis in
the market and its future possibilities.

4
Section 5 describes the competitor analysis mechanism and analyses different competitors according
to the aforementioned market segments; Smart buildings, Smart EV charging and Smart micro grids.
The results and its analysis are presented here. Furthermore, possible tools to analyses competitor data
for the future are also discussed. In section 6, the resulting conclusions and recommendations are
written down.
5
2. Smart grids
2.1 Evolution of smart grids
The definition of smart grid as defined by ABB is ‘A smart grid is an evolved grid system that manages
electricity demand in a sustainable, reliable and economic manner, built on advanced infrastructure and
tuned to facilitate the integration of all involved’.[5]
The concept towards an intelligent interaction grid emerged in the 80’s allowing to more renewable
sources to enter the grid. The term was first coined in 2005 with the article by Amin and Wallenberg
titled “Toward a smart grid: power delivery for the 21st century”[6]
During the last decade, the world was presented with new challenges arising from liberalization of
markets and various technical breakthroughs which called for innovative thinking. It resulted in open
access to transmission and distribution grids. The transmission lines which connected various loads
with the generation sources have been updated with automation and human monitoring over past
decades. The current electricity market which operates in a way where the end user node is simply a
‘sink’ for electricity underwent a makeover resulting in rapidly growing distributed generation
technologies some of it in the form of Renewable energy storage systems (RES). This enabled the user
to participate as a source in the system and not just as a sink.
The formation of European union helped immensely in developing new policies providing various
frameworks for the establishment of smart grids. The EU recognizes smart grids as the key infrastructure
for the energy modernization of Europe. To develop this, a vision ‘smart grids 2020’ [7]emerged and
‘smart grids task force’ was created in 2009 which involved the European commission officials, policy
makers, experts from industries, research centres and academia. In February 2015, European
commission adopted the Energy union strategy dedicated to research, innovation and competitiveness.
An integrated SET-plan was developed to accelerate the energy system transformation [8].
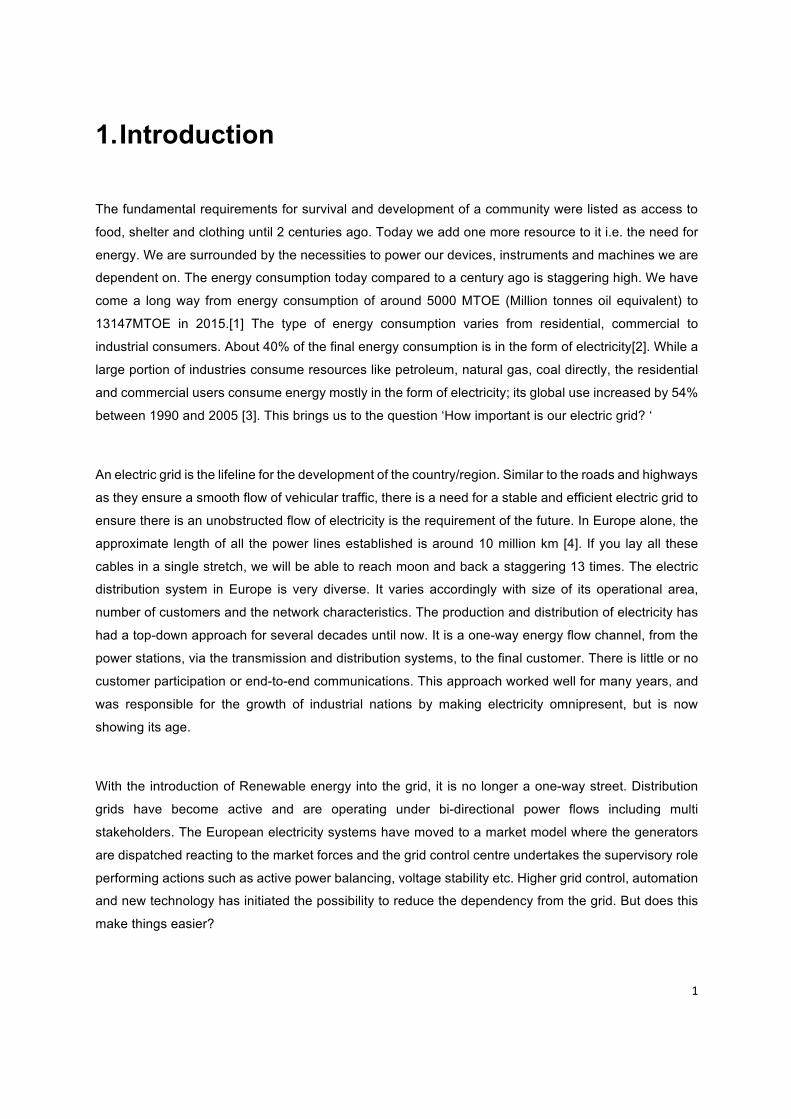
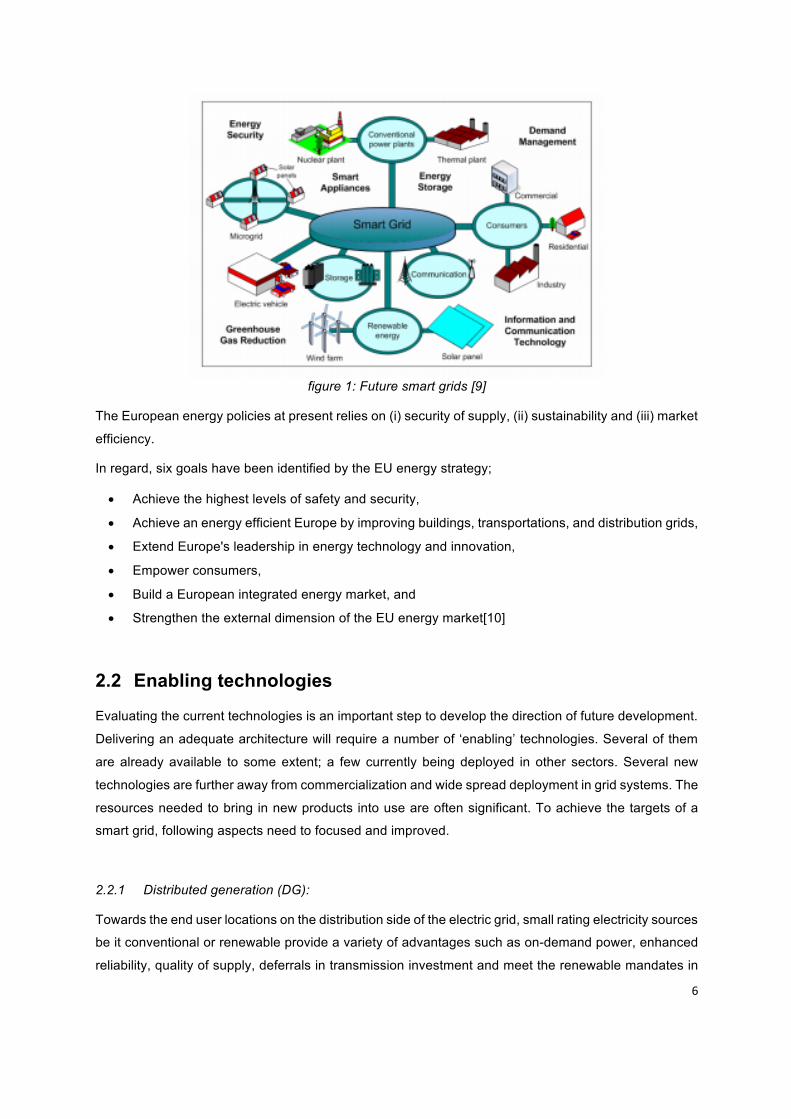
In figure 1, National institute of standards and technology (NIST) establishes a concept model for smart
grids by listing the seven domains of smart grids i.e. Power generation, transmission, distribution,
customer, service provider, operations and energy markets [9].
6
figure 1: Future smart grids [9]
The European energy policies at present relies on (i) security of supply, (ii) sustainability and (iii) market
efficiency.
In regard, six goals have been identified by the EU energy strategy;
• Achieve the highest levels of safety and security,
• Achieve an energy efficient Europe by improving buildings, transportations, and distribution grids,
• Extend Europe's leadership in energy technology and innovation,
• Empower consumers,
• Build a European integrated energy market, and
• Strengthen the external dimension of the EU energy market[10]
2.2 Enabling technologies
Evaluating the current technologies is an important step to develop the direction of future development.
Delivering an adequate architecture will require a number of ‘enabling’ technologies. Several of them
are already available to some extent; a few currently being deployed in other sectors. Several new
technologies are further away from commercialization and wide spread deployment in grid systems. The
resources needed to bring in new products into use are often significant. To achieve the targets of a
smart grid, following aspects need to focused and improved.
2.2.1 Distributed generation (DG):
Towards the end user locations on the distribution side of the electric grid, small rating electricity sources
be it conventional or renewable provide a variety of advantages such as on-demand power, enhanced
reliability, quality of supply, deferrals in transmission investment and meet the renewable mandates in
7
times of increasing disinvestments from transmission assets. It should cater to the philosophy of bi-
directional flows of information and electricity[11].
2.2.2 Energy storage technologies
The current technologies do not facilitate electricity storage in large quantities. It needs to be converted
to other forms of energy such as mechanical or electrochemical energy. Storage technologies form the
backbone of a smart grid. These provisions help in (i) making the grid smarter and more efficient (ii) it
enables load levelling and peak shaving and replaces spinning reserve (iii) improves grid reliability and
stability (iv) Enables supplementary services like providing reactive power for voltage regulation and (v)
supports transmission and distribution deferring.
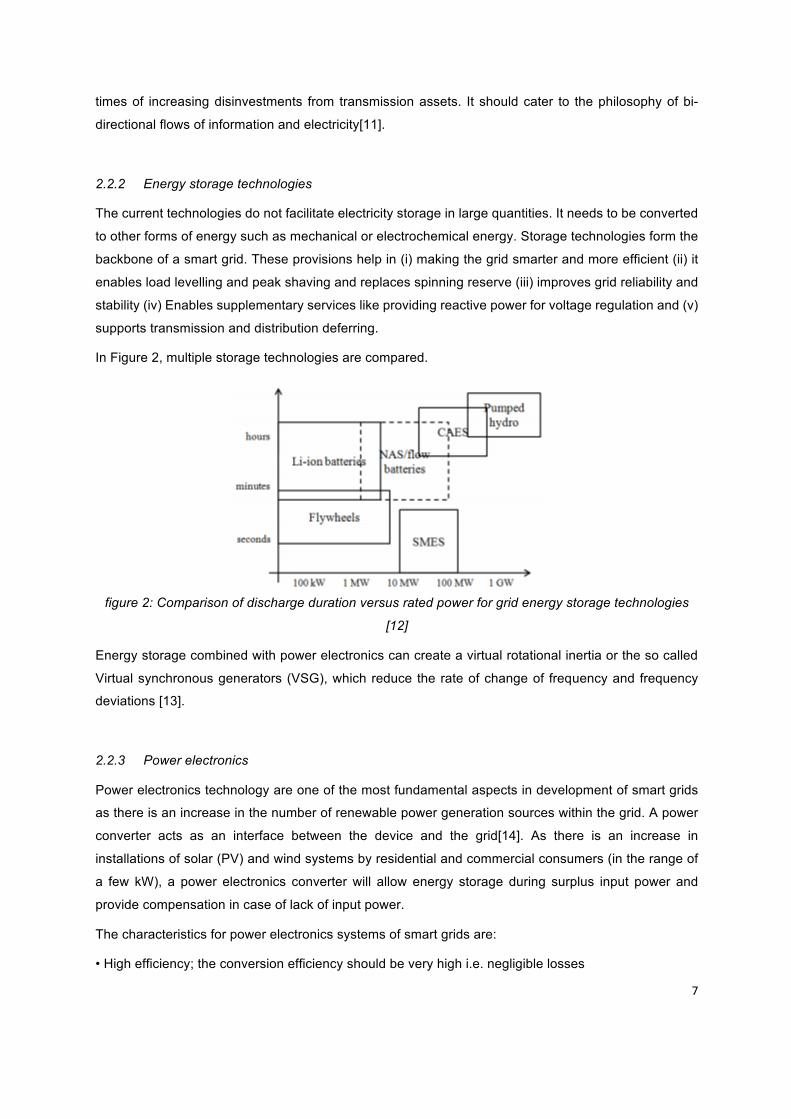
In Figure 2, multiple storage technologies are compared.
figure 2: Comparison of discharge duration versus rated power for grid energy storage technologies
[12]
Energy storage combined with power electronics can create a virtual rotational inertia or the so called
Virtual synchronous generators (VSG), which reduce the rate of change of frequency and frequency
deviations [13].
2.2.3 Power electronics
Power electronics technology are one of the most fundamental aspects in development of smart grids
as there is an increase in the number of renewable power generation sources within the grid. A power
converter acts as an interface between the device and the grid[14]. As there is an increase in
installations of solar (PV) and wind systems by residential and commercial consumers (in the range of
a few kW), a power electronics converter will allow energy storage during surplus input power and
provide compensation in case of lack of input power.
The characteristics for power electronics systems of smart grids are:
• High efficiency; the conversion efficiency should be very high i.e. negligible losses

8
• Optimal energy transfer; As renewable energy sources are constrained; algorithms are needed to
achieve the maximum power point (MPP) which must be considered in the design of the interface.
• Bidirectional power flow; Flow of energy should be both to the load as well as the grid when needed.
• Reliability; The system should never fail to deliver especially in case of emergencies.
• Synchronization capabilities; All power sources connected should be synchronized with the grid to
ensure high efficiency and reducing chances of failures. Standards such as IEEE 1547 should be
incorporated in all power electronics interfaces[15].
• Electromagnetic interference filtering (EMI); The energy fed into the grid generated by different sources
should comply with the electromagnetic(EMC) standards.
• Smart meter; A smart meter must be capable of tracking the energy flow to the load or to the grid.
• Billing; For an automatic billing system, there needs to be a real time flow of information of all
parameters such as energy bought/sold thus informing the end users of their pricing parameters.
• Communication; For an intelligent smart grid, the functioning depends on the grid capability to transmit
information along with the power flow in the systems.
• Fault tolerance; A built-in ability to detect and avoid failures of nodes and also recover when needed.
This should be incorporated with monitoring, communication and reconfiguration features of power
electronic systems.
2.2.4 Control, Automation and Monitoring
The difference between an existing grid and a smart grid is the existence of artificial intelligence. A smart
grid is very complex, nonlinear dynamic network by nature that needs capabilities for monitoring and
control which gives the ability of self-healing (to isolate faults and correct), self-organizing, and self-
configuration. Compared to earlier decades, higher sophistication in sensing, monitoring and control is
necessary [16]. It can be achieved by a combination of power electronics and agent based control
techniques which create a complex yet flexible interface between different elements of the grid like
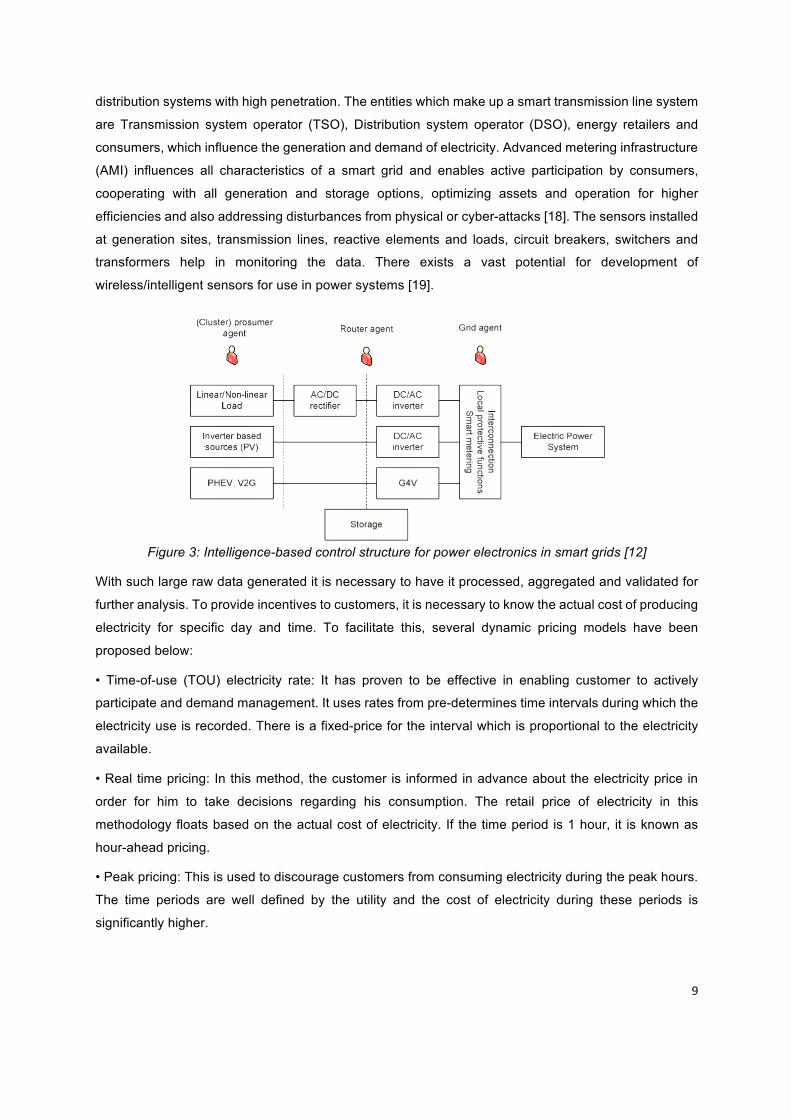
consumers, storage, network areas etc. In Figure 3 the different power electronics layers can be seen
which are used to integrate a group of prosumers into the public grid.
Modern communication protocols such as Wi-Fi, ZigBee etc. ensure smart meters acts as the interface
between energy management systems, consumers and utilities to control a various appliances
depending on signals such as the price of electricity etc.[17]
Currently, various utility companies use the information generated by sensors located throughout the
distribution system to correct anomalies such as phase and load imbalances. It is also used to improve
the stability of the grid using voltage optimizing applications (DVO) and ensure maximum protection for
9
distribution systems with high penetration. The entities which make up a smart transmission line system
are Transmission system operator (TSO), Distribution system operator (DSO), energy retailers and
consumers, which influence the generation and demand of electricity. Advanced metering infrastructure
(AMI) influences all characteristics of a smart grid and enables active participation by consumers,
cooperating with all generation and storage options, optimizing assets and operation for higher
efficiencies and also addressing disturbances from physical or cyber-attacks [18]. The sensors installed
at generation sites, transmission lines, reactive elements and loads, circuit breakers, switchers and
transformers help in monitoring the data. There exists a vast potential for development of
wireless/intelligent sensors for use in power systems [19].
Figure 3: Intelligence-based control structure for power electronics in smart grids [12]
With such large raw data generated it is necessary to have it processed, aggregated and validated for
further analysis. To provide incentives to customers, it is necessary to know the actual cost of producing
electricity for specific day and time. To facilitate this, several dynamic pricing models have been
proposed below:
• Time-of-use (TOU) electricity rate: It has proven to be effective in enabling customer to actively
participate and demand management. It uses rates from pre-determines time intervals during which the
electricity use is recorded. There is a fixed-price for the interval which is proportional to the electricity
available.
• Real time pricing: In this method, the customer is informed in advance about the electricity price in
order for him to take decisions regarding his consumption. The retail price of electricity in this
methodology floats based on the actual cost of electricity. If the time period is 1 hour, it is known as
hour-ahead pricing.
• Peak pricing: This is used to discourage customers from consuming electricity during the peak hours.
The time periods are well defined by the utility and the cost of electricity during these periods is
significantly higher.
10
• Peak time rebate: It operates under a similar concept as peak pricing. Here instead of a penalty, the
conscious customer receives a reward for his role in reducing their consumption below the baseline to
reduce the demand. If the customer consumes more than the baseline, no penalty is imposed.
2.2.5 Distributed automation and protection
For the distribution grid to achieve continuity, reliability and security of supply is necessary to design
applications such as self-healing and protection mechanisms using the advanced distribution systems
(ADA). It deals with detection and clearing of abnormal anomalies such as faults and overloads.
As the complexity and interactions between several market players increase so does the risk of large
scale failures. Self-healing mechanisms have been incorporated into the systems to prevent such
situations. For an island operation, there is a less intense rate of amount of a data exchange and
computing facilities. An intelligent decentralised grid accommodates the load and generation in a reliable
and efficient way. Local controllers ensure that each island grid will operate within its security while
safeguarding the electricity supply[20]. A smart self-healing system should incorporate a wide variety of
sensors over a large area and should be able to sync with each other through the global positioning
service (GPS)[21].
2.2.6 Communication
The signals obtained from sensors be it in a digital/analog format can be used by the controllers to
enable the self-healing of the system in times of anomalies. Despite the signals emanating from different
networks, they may be used by a single centralized controller [22]. IEEE standard 1451.4 [23] advises
analog sensors to have a transducer electronic data sheet (TEDS) to provide the required calibration
information to the data acquisition system.[24]
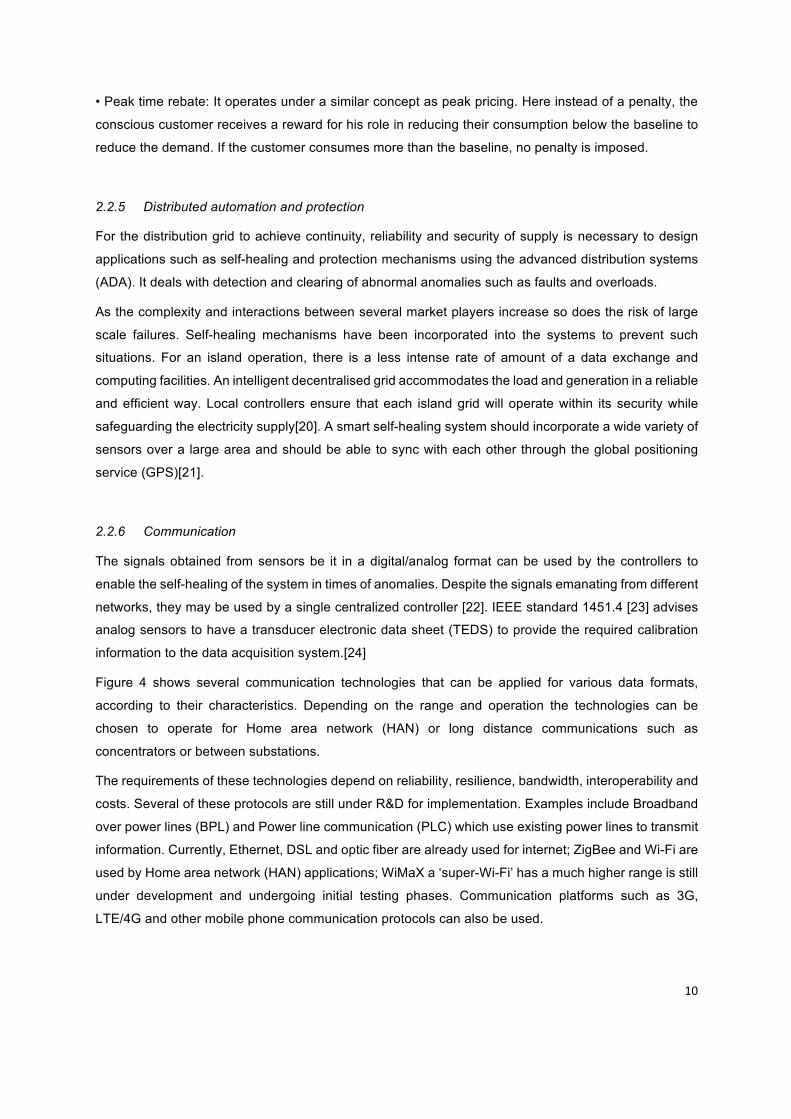
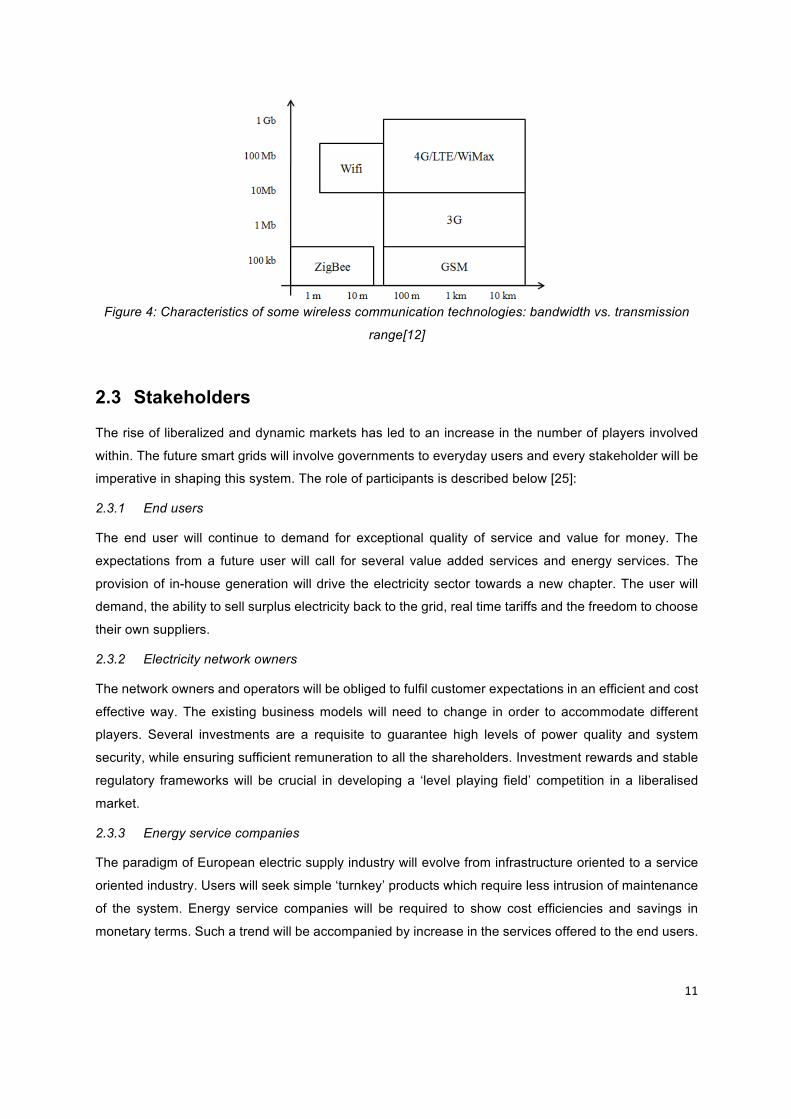
Figure 4 shows several communication technologies that can be applied for various data formats,
according to their characteristics. Depending on the range and operation the technologies can be
chosen to operate for Home area network (HAN) or long distance communications such as
concentrators or between substations.
The requirements of these technologies depend on reliability, resilience, bandwidth, interoperability and
costs. Several of these protocols are still under R&D for implementation. Examples include Broadband
over power lines (BPL) and Power line communication (PLC) which use existing power lines to transmit
information. Currently, Ethernet, DSL and optic fiber are already used for internet; ZigBee and Wi-Fi are
used by Home area network (HAN) applications; WiMaX a ‘super-Wi-Fi’ has a much higher range is still
under development and undergoing initial testing phases. Communication platforms such as 3G,
LTE/4G and other mobile phone communication protocols can also be used.
11
Figure 4: Characteristics of some wireless communication technologies: bandwidth vs. transmission
range[12]
2.3 Stakeholders
The rise of liberalized and dynamic markets has led to an increase in the number of players involved
within. The future smart grids will involve governments to everyday users and every stakeholder will be
imperative in shaping this system. The role of participants is described below [25]:
2.3.1 End users
The end user will continue to demand for exceptional quality of service and value for money. The
expectations from a future user will call for several value added services and energy services. The
provision of in-house generation will drive the electricity sector towards a new chapter. The user will
demand, the ability to sell surplus electricity back to the grid, real time tariffs and the freedom to choose
their own suppliers.
2.3.2 Electricity network owners
The network owners and operators will be obliged to fulfil customer expectations in an efficient and cost
effective way. The existing business models will need to change in order to accommodate different
players. Several investments are a requisite to guarantee high levels of power quality and system
security, while ensuring sufficient remuneration to all the shareholders. Investment rewards and stable
regulatory frameworks will be crucial in developing a ‘level playing field’ competition in a liberalised
market.
2.3.3 Energy service companies
The paradigm of European electric supply industry will evolve from infrastructure oriented to a service
oriented industry. Users will seek simple ‘turnkey’ products which require less intrusion of maintenance
of the system. Energy service companies will be required to show cost efficiencies and savings in
monetary terms. Such a trend will be accompanied by increase in the services offered to the end users.

12
2.3.4 Technology providers
Technology will play a significant role in developing innovative solutions with revolutionary business
models to achieve efficient deployment of working with the grid companies. The grid companies will be
expected to take key investment decisions regarding the technologies they adapt. A shared vision is
necessary to develop sound strategic developments to ensure open access, long term value and
integration. Innovation will be needed in relation to networks, demand and for generation, both
centralised and distributed, as grid system operational characteristics change.
2.3.5 Researchers
Without sufficient research there shall be no innovation which is the key to development. Universities,
research centres, utilities, manufacturers, regulators and legislators must develop cooperation for the
successful deployment of new technologies
2.3.6 Traders
Free trade across Europe will be expedited by open markets, harmonised rules and transparent trading
procedures. For a fully integrated European market, congestion management and reserve power
capacities need to be resolved. The benefits will be passed on to the customer by allowing to choose
the energy supplier that best suits their requirements.
2.3.7 Generators
Current electricity grids are complex integrated systems with profound interactions between generators,
grid systems and the energy demands. It will be imperative to maintain such interfaces between new
generators, characteristics of their equipment and their operational dynamics.
2.3.8 Regulators
The European market for energy and related services should be maintained with stable and clear
regulatory frameworks, well established and harmonised rules across Europe. Regulatory frameworks
should cultivate aligned incentives with increasingly open access and clear investment remunerations
to keep the transmission and distribution costs as low as possible. Effective and efficient innovation
should be aptly rewarded.
2.3.9 Governmental agencies
The governments will have to bear the responsibilities to prepare new legislations by taking various
contradictory goals into account. Increase in competition will keep a downward pressure on energy
prices while environmentally friendly energy mix may present more challenges. Legislations will be
affected by innovative technologies, the evolution of grid organisations, requirement for greater
flexibility, increased cross-border trading and by the need to ensure economic development, greater
competitiveness, job creation and high quality security of supply in the EU.
13
2.3.10 Adequate workforce and continuous education
Power engineering is professed to be old fashioned. Special attention will be necessary to address the
shortage of skilled staff with manufacturers, grid operators, regulators etc. A multidisciplinary
methodology (engineering, economic, regulatory legislation) has to be envisioned.
2.3.11 Advanced energy management service providers
Modern businesses will provide solutions in maximising utilisation of on-site generation including sale
of surplus to the grid. They will also have to provide demand side response products and services to
the grid. Their decisions will be influenced by market price changes. Thus businesses will be seeking to
deploy wider range of solutions than currently available.
2.4 Barriers
There are several barriers to the development of smart grids. Firstly, due to financing. Stimulus plans in
2009 introduced funding for several dozens of projects. However, over the next years, austerity
measures taken by governments; funding was reduced to increase investment by private entities. This
raises the question of real interests of many smart grid players, such as electric utility companies. As
the cost to modernize the grid gets higher, utilities may wonder if the benefits outweigh the costs. A
major barrier to smart grids is the need for utilities to change a major part of their business plans, as
reducing demand is contradictory to their current business models. Regulators are needed to come into
play to balance the costs of each entity with an acceptable ratio between costs and the return on
investments. Dynamic electricity pricing will help decrease overall electricity consumption through peak
shaving and demand-response. A large public consensus is also needed to accept smart meters into
their homes. There is also the case of technological maturity and availability especially regarding
Distributed energy resources (DER) integration and control. Operating security is also a major concern
as shown in the case of Stuxnet [26]. It is of prime importance to establish certain specific standards for
the establishment of smart grids. These standards will define true interoperability between products from
various companies. American national institute of standards and technology (NIST), IEEE, IEC and
various other organisations have been influential by working on several draft standards.
2.5 The future
‘European networks will need an estimated investment of €600 billion by 2020. Out of which two-thirds
of it will need to be spent on upgrading the distribution grids[4]’.
European market has been influenced by the concerns arising from the diversity and evolution of power
grids across the countries. It is expected to increase security and to achieve growth for increasing
demand in the long term. As the technologies grow, it will be applied to a global world. Distribution
networks are expected to undergo a major change while the energy storage solutions become widely

14
available to compensate for the intermittent nature of renewables. Communication and user interfaces
will be pervasive and the integration with IoT’s (Internet of things) allow home and business users to
control and operate their appliances anywhere in the world. Power distribution will be controllable and
will have automation systems that allow users to participate and connect with others in the grid. The use
of information technology will develop a deeper understanding of the vulnerability of the ecosystem. It
is important to recognize the complexity of the electric grid, its multi-disciplinary and multi-dimension
nature to understand the orchestrated behaviour prompted by the new structure and the interaction of
agents via the transmission and distribution systems. As it is virtually impossible to consider fully the
complexity of the system, several studies are needed that focus on reduced realities. Engineers need
to constantly question the models in order to restore information and integrate lost aspects back into the
overall design.
15
3. Energy management tool of Enervalis
“We create the operating system of the future energy grid for mass market energy service adoption” –
Stefan L.
Enervalis is a Belgian company founded in 2013 by Stefan Lodeweyckx. It builds Cloud-based SaaS
(Software as a Service) enabling electricity producers, storage providers & consumers to save or make
money by optimizing energy flexibility. It currently has projects in Belgium, Netherlands, Spain and USA
in various stages ranging form partnerships, prospecting, funding EU projects to commercialisation.
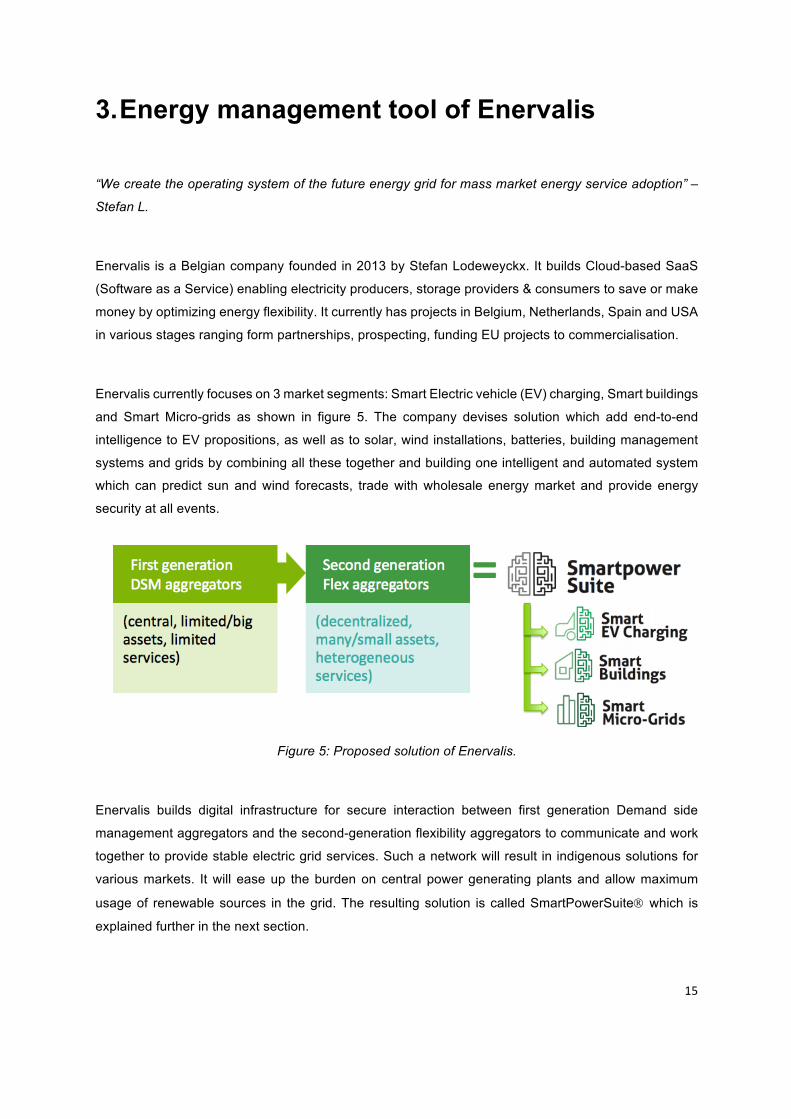
Enervalis currently focuses on 3 market segments: Smart Electric vehicle (EV) charging, Smart buildings
and Smart Micro-grids as shown in figure 5. The company devises solution which add end-to-end
intelligence to EV propositions, as well as to solar, wind installations, batteries, building management
systems and grids by combining all these together and building one intelligent and automated system
which can predict sun and wind forecasts, trade with wholesale energy market and provide energy
security at all events.
Figure 5: Proposed solution of Enervalis.
Enervalis builds digital infrastructure for secure interaction between first generation Demand side
management aggregators and the second-generation flexibility aggregators to communicate and work
together to provide stable electric grid services. Such a network will result in indigenous solutions for
various markets. It will ease up the burden on central power generating plants and allow maximum
usage of renewable sources in the grid. The resulting solution is called SmartPowerSuiteÒ which is
explained further in the next section.
16
3.1 SmartPowerSuiteÒ
Enervalis builds the artificial intelligence (SmartPowerSuite®) of the future energy systems for the mass
markets to enable maximum green energy within the system. As a part of this, it includes features of
Smart Buildings and Smart EV charging. It is a single, comprehensive hardware agnostic system for
HVAC, EV charging and other systems. In simple words ‘It is an energy management software for your
home/building/locality’.
Its core element is ‘Internet of Energy’, which by design has the same key values as of internet;
resilience, redundancy, security and low-barrier enablement for mass market service adoption. It has
the power to transform the energy sector the same way internet transformed the world.
Application of SmartPowerSuite® benefits the user in providing better indoor comfort, reduced energy
bills, energy efficiency, and a smarter management of devices under one system. It also supports
efficient functional system integration with existing Building management systems (BMS) and provides
maximum flexibility to support any future changes in building use.
The feature elements of SmartPowerSuite are:
• Energy monitoring
• Forecasting of availability and usage
• Data visualisation of all systems
• Heating Ventilation and Air Conditioning (HVAC)
• Flexibility control
• Energy trading
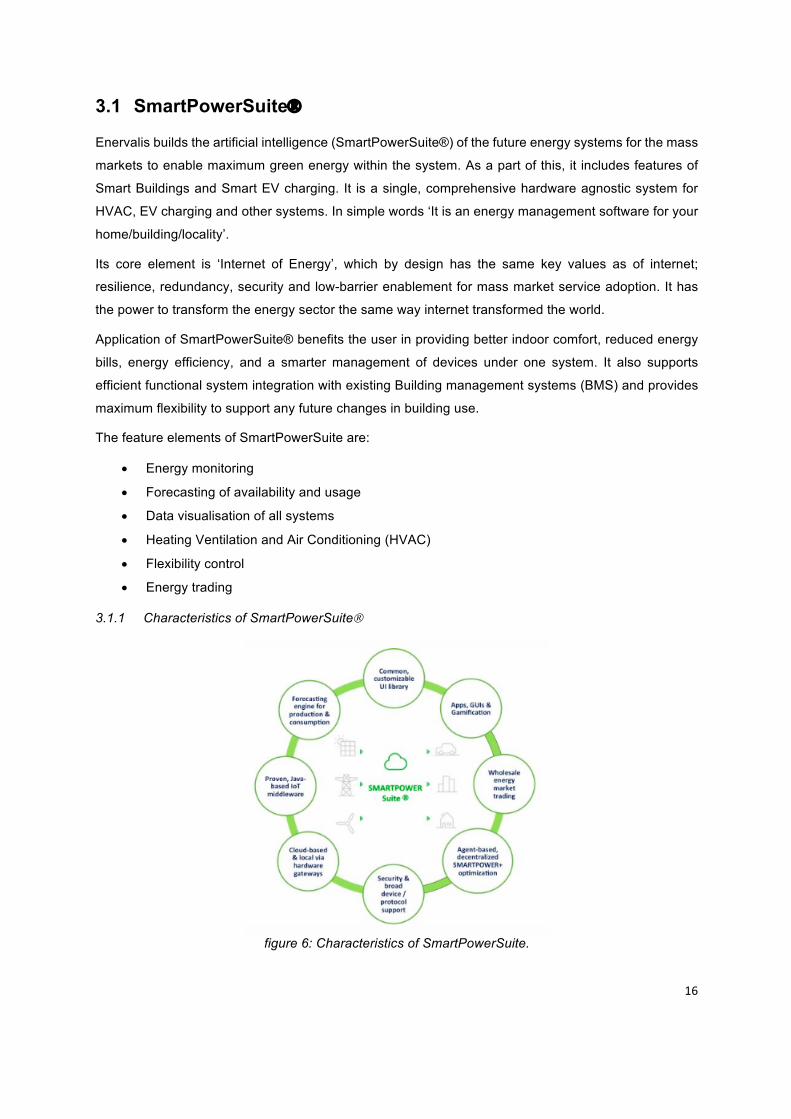
3.1.1 Characteristics of SmartPowerSuiteÒ
figure 6: Characteristics of SmartPowerSuite.
17
The functioning of this software is depicted in figure 6. It is carried out firstly by capturing information
from different kinds of sensory data such as electrical, thermal, climatic, human, energy market etc.
which are then analysed by the algorithms. These complex algorithms process these varied data to
predict the production, consumption guided by the market prices and flexibility market which in turn
proceeds as control actions. These actions can be modified suitable for different profiles such as to
maximize self-consumption, to minimize capacity constraints at substation level on the low/mid voltage
networks or to reduce energy prices by trading on energy market. All these functionalities are designed
on a distributed software architecture that supports lightweight, cost-effective mass market energy
services. The revenues are linked as Software as a service (SaaS) model. Detailed analysis of the
different market segments (figure 5) is presented below:
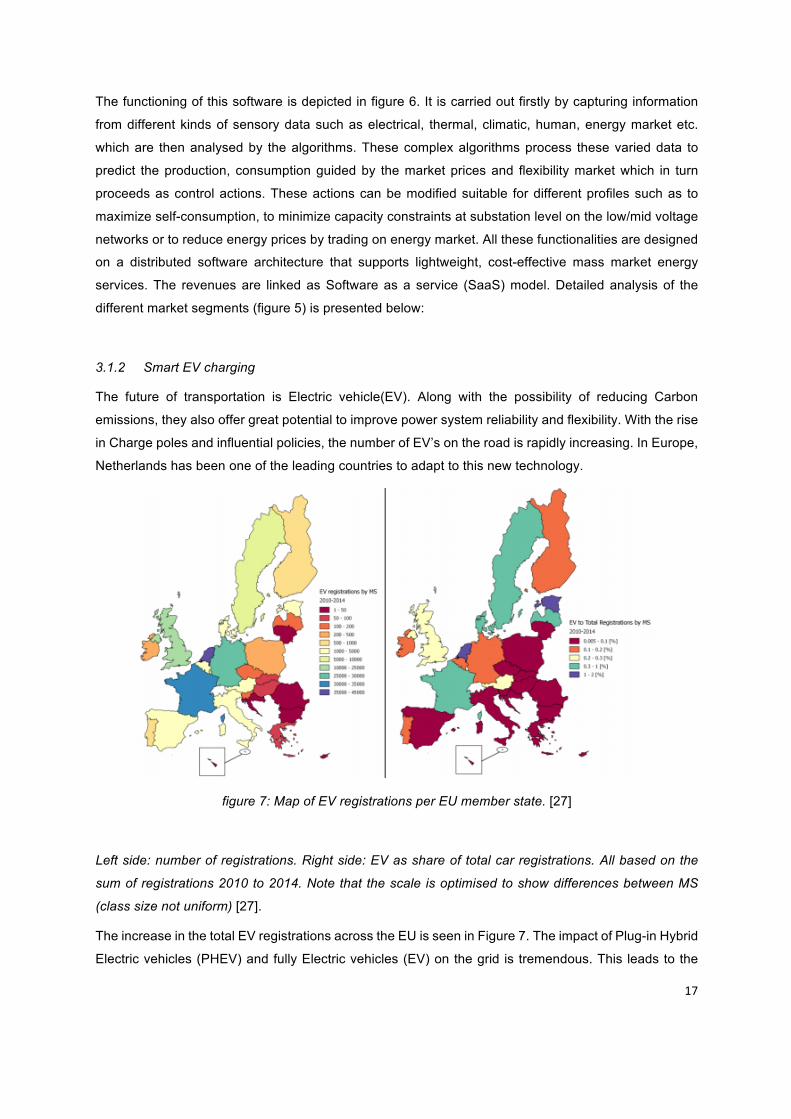
3.1.2 Smart EV charging
The future of transportation is Electric vehicle(EV). Along with the possibility of reducing Carbon
emissions, they also offer great potential to improve power system reliability and flexibility. With the rise
in Charge poles and influential policies, the number of EV’s on the road is rapidly increasing. In Europe,
Netherlands has been one of the leading countries to adapt to this new technology.
figure 7: Map of EV registrations per EU member state. [27]
Left side: number of registrations. Right side: EV as share of total car registrations. All based on the
sum of registrations 2010 to 2014. Note that the scale is optimised to show differences between MS
(class size not uniform) [27].
The increase in the total EV registrations across the EU is seen in Figure 7. The impact of Plug-in Hybrid
Electric vehicles (PHEV) and fully Electric vehicles (EV) on the grid is tremendous. This leads to the
18
charging loads of these vehicles affecting the grid negatively and can give rise to voltage and power
congestion problems. To achieve a successful smart grid, the rise of EV’s need to be accommodated
within the grid as an advantage. Several theoretical concepts are proposed which involve both charging
and discharging of EV’s, also known as vehicle-to-grid (V2G) concepts. Several business models can
be built using this theory. As an example, the potential of EV’s as ancillary services on the main island
of Azores is shown in [28].
Electric vehicles can be used for a wide range of services in the electricity generation chain. Services
such as load regulation, backup power and peak shifting. As EV’s are connected to the grid most of the
time (apart from the transportation time) the energy stored in the batteries is very significant and can
bridge the crucial mismatch of supply and demand of energy. These solutions will have to be
accompanied by supporting technologies. To utilize the full potential of Electric vehicles there is the
need to forecast the consumption and generation of energy in real time. These solutions form the
backbone of a smart grid infrastructure. Electric vehicles together can act as an aggregator and
participate in the electricity market to reduce the burden on DSO’s and also generating revenue for the
end user.
Enervalis develops solutions to use EV as potential electrical storage/flexibility for renewable energies.
EV’s can provide operating reserve capability with the time limit of 5-10 min. Enervalis builds models for
forecasting consumption and generation of energy to help make better real time decisions. In one of its
projects with the city council of Den Hague[29], it is currently monitoring 400 charging stations to analyse
the consumption profiles of various customers to optimise charging solutions. The SmartPowerSuiteÒ
analyses this data and predicts the consumption profile, which in return help the aggregator in providing
smart solutions to the grid using actions such as Vehicle-to-grid (V2G) or Vehicle-to-building (V2B).
Enervalis understands the true potential of an Electric vehicle and it builds solutions for maximum
utilisation of EV’s into a Smart grid.
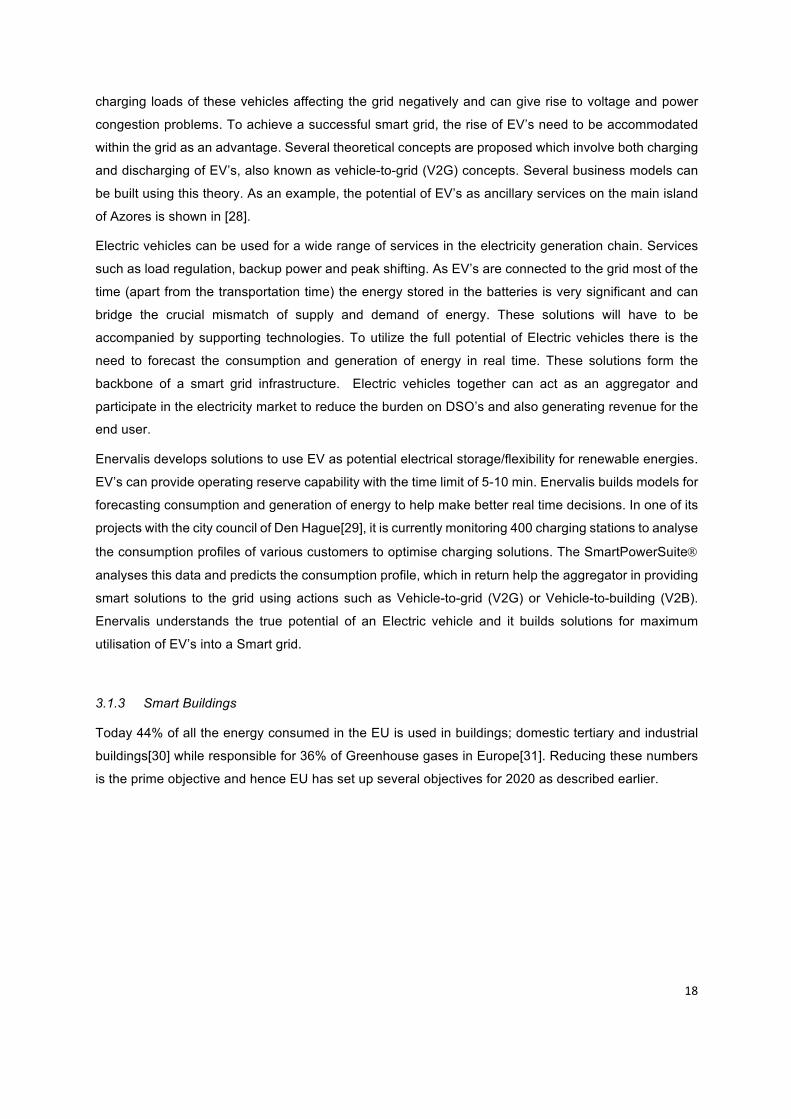
3.1.3 Smart Buildings
Today 44% of all the energy consumed in the EU is used in buildings; domestic tertiary and industrial
buildings[30] while responsible for 36% of Greenhouse gases in Europe[31]. Reducing these numbers
is the prime objective and hence EU has set up several objectives for 2020 as described earlier.
19
figure 8 : Share of total EU energy consumption [30]
In figure 8, the building sector offers the largest potential for cost effective energy savings as it is one of
the largest sectors of energy consumption as seen Most of the buildings we occupy today were built
during a time when energy efficiency was not a concern and as a result a lot of energy is consumed in
heating, cooling and lighting. The rate of replacement of such buildings is at 1.2%[32] per annum and
hence a greater emphasis on the existing buildings is necessary. While retro-fitting existing buildings
offer the greatest potential, one has to address the new buildings as well as they will shape the sector
for the next 25 years and beyond. Taking climate change into consideration, new buildings should aim
to achieve a carbon neutral life cycle. This is a very high priority for the EU and on April 23,2009 the EU
parliament requested all new buildings by 2019 to confirm with a zero or negative net energy
consumption[33].
The objective of Net-zero energy building (NZEB) is to have a reduced demand of energy for heating
and electrical supply and this reduced demand to be met by renewable energy supply. This can be
integrated as a renewable power supply into the building footprint or it can be generated locally. It also
implies that when there is excess power generation, the power will be exported to the grid. This concept
is a progression from passive sustainable design.
The energy savings in a building can be implemented by several passive design methods such as
Improvement of the building fabric, i.e. improvement of insulation, increase of thermal mass, cooling
materials, phase change materials, innovative shading devices etc. From technology side: Incorporation
of high efficiency heating and cooling equipment, e.g. AC equipment with higher Energy efficiency ratio
(EER), heat pumps combined with geothermal energy or solar collectors, solar air-conditioning, etc. Use
of renewables (solar thermal systems, buildings’ integrated photovoltaics, hybrid systems, etc.).
Apart from just upgrading the technology and using better design methods, the need of the hour is to
implement “intelligent” energy management systems. These systems improve the efficiency of buildings

20
while maintaining the user parameters. The control actions are such as efficient operation of lighting
and HVAC systems; controlling the indoor climate on ‘weather basis’; shifting peak loads when the
prices are high through load management; preferring locally generated/stored energy rather than the
energy from the grid and various other functions[34]. This requires a real time interaction with the grid
and the devices installed in the house/building. Such actions are a result of advanced analysis and
forecasting of the energy demand and supply of the building by the algorithms and optimization
strategies developed by Enervalis. In a real-time operation of NZEB the coupling mechanism of energy
production and energy requirements can yield significant benefits to the user.
In one of the projects by the European Commission, Enervalis is currently working on the BAM
REnnovates project[35]. The project was developed as an expansion of an innovation programme ‘De
Stroomversnelling’ to retrofit the old Dutch housing stock to energy neutral houses. The whole project
is estimated to cover 111,000 houses[36]. The REnnovates project covers 200 of these houses.
Enervalis is involved in providing the Energy management system and developing strategies for
maximising localised energy consumption. In this project old outdated buildings are aligned with modern
facilities and comfort levels increasing the lifetime of the buildings by another 50 years while maintaining
higher tenant satisfaction. Here the buildings are fitted with modern insulation systems and solar panels
to generate energy locally as depicted in figure 9. This project is a part of developing smart buildings of
future.
The network operator Stedin is also one of the project partners. The households will only be using
electricity in this project. During excess input of energy form solar panels, the energy is supplied back
to the grid. Such a forecast and operation will allow Stedin to avoid costly investments in acquiring more
capacity on the electricity market. Thus Enervalis develops solutions to achieve a smart and energy
efficient buildings.
Figure 9: Project REnnovates[35].
3.1.4 Smart micro grids
Smart grids are the way of future. The need for such solutions has been explained earlier. The
development of smart grids follows certain key objectives such as [7];

21
Ø To create a toolbox of solutions that can be deployed rapidly in a cost-effective manner which
will enable the existing grids to integrate power injections from all energy resources.
Ø Harmonising regulatory and commercial frameworks within EU to facilitate cross-border
trading of power and grid services, ensuring accommodation of a wide range of solutions.
Ø To establish technical standards and protocols which enables open access and deployment
of equipment from all kinds of manufacturers.
Ø To develop information, computing and telecommunication systems which will enable
business to utilise innovative service arrangements to increase the efficiency and service to
customers.
Ø Ensuring smooth interfacing of old and new grid designs for interoperability of automation and
control arrangements.
A smart grid has a broad range of stakeholders. They are Users, Electricity network companies, Energy
service companies, Technology providers, researchers, traders, Generators, regulators and
Governmental agencies.
For a truly operable smart grid, it needs to have smart houses/buildings which can communicate with
each other and work together as an aggregator providing flexibility options on the market. The solutions
at Enervalis keep in mind these stakeholders along with the objectives to develop solutions for the mass
market. The individual solutions of Smart EV and Smart buildings in a community combine together to
operate as one true smart grid.
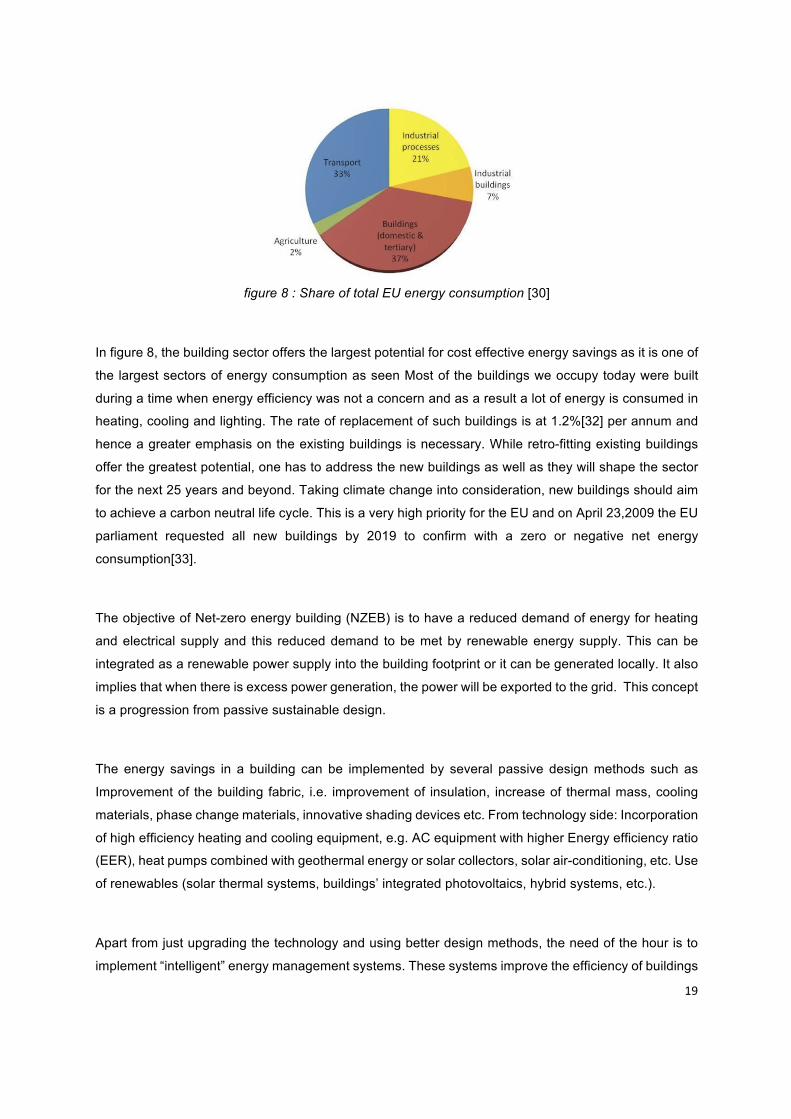
3.1.5 The gateway
The SmartPowerSuite is installed on a physical router. It is a node (router) in a computer network, a key
stopping point for data on its way to or from other networks. It is similar to the internet router in your
home/office. It interacts with various devices such as storage devices, heat pumps, sensors etc. and
performs control actions as and when necessary. It is connected to the servers of Enervalis using
existing internet solutions such as Wi-Fi or 3G. It communicates with devices in the building using other
protocols such as ZigBee, Z-wave, Modbus, BACnet depending on the type of device. The gateway is
also capable of operating independently without interference from master controllers or management
applications. It supports distributed intelligence and centralised systems alike. It is possible to distribute
the gateway at electrical switchboards or cabinets close to the control system to minimize cabling. An
overall outlook of the system is presented in figure 10.
22
Figure 10: Overview of system architecture
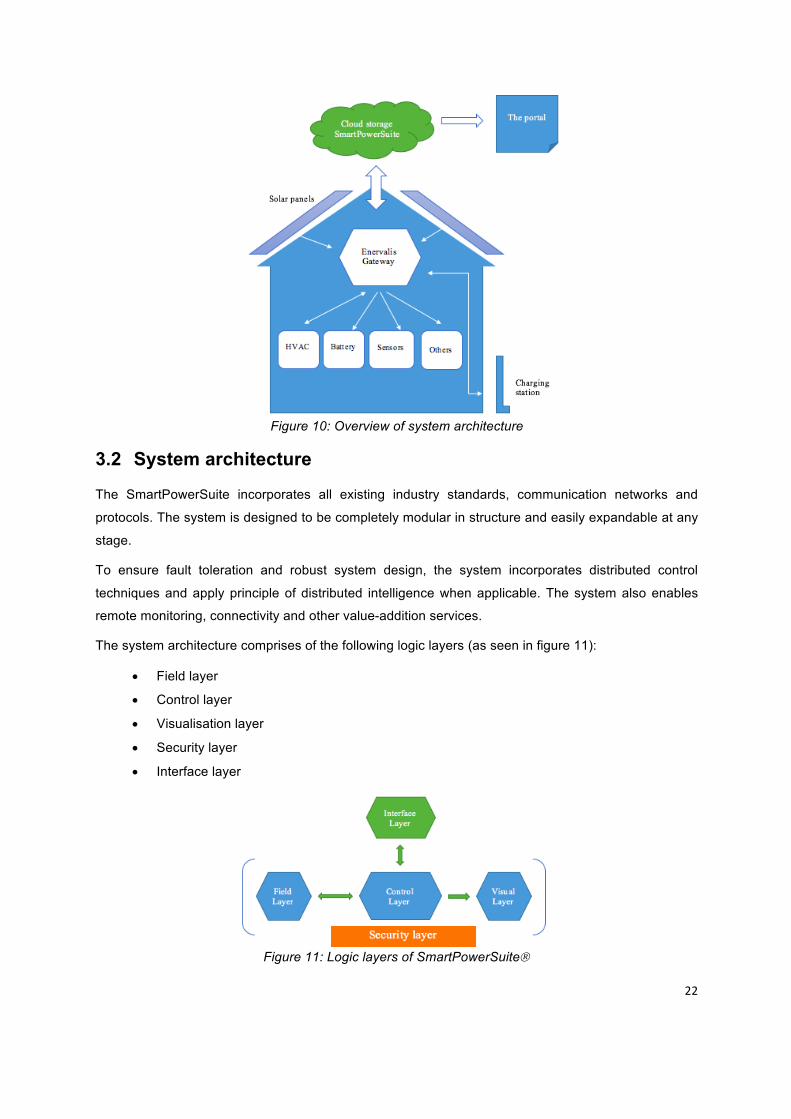
3.2 System architecture
The SmartPowerSuite incorporates all existing industry standards, communication networks and
protocols. The system is designed to be completely modular in structure and easily expandable at any
stage.
To ensure fault toleration and robust system design, the system incorporates distributed control
techniques and apply principle of distributed intelligence when applicable. The system also enables
remote monitoring, connectivity and other value-addition services.
The system architecture comprises of the following logic layers (as seen in figure 11):
• Field layer
• Control layer
• Visualisation layer
• Security layer
• Interface layer
Figure 11: Logic layers of SmartPowerSuiteÒ
23
3.2.1 Field layer
It includes all the physical elements that represent the system. Various devices installed within he
environment such as inverters, Smart meters, solar panels, building management systems comes under
its purview.
Table 1 represents the kind of devices connected to a home energy management system and the
communication links they are accessed on.
Table 1: Features of Field layer 3.2.2 Control layer
The algorithms needed to monitor and analyse the data form a part of this layer. This is the CPU of the
system and is responsible for data handling, storage, processing and control. Table 2 represents the
services and transactions carried out nu the control layer.
Service Energy autonomy, DSM, Energy forecasting, nomination, Self-consumption,
Smart charging…
Transaction Control, data gathering, data storage, 3rd party interfacing (market, wind-forecast,
network etc.)
Table 2: Features of Control layer
3.2.3 Visual layer
The end user information is displayed in a web base interface called ‘The Portal’. It gives a detailed
outlook of the system. The importance of visual graphics is unparalleled and it determines the way the
user connects and interacts with the system. Visual representation of data gives a better overview of
the system. The features of Portal are explained in detail in the next section.
3.2.4 Interface layer
To take smart decisions, the SmartPowerSuite needs to include the data of weather forecasts, energy
market prices etc. The interface layer enables third party applications to communicate with the system,
which ultimately lead to better control decisions. By integrating other sources, the SmartPowerSuite gets
a complete understanding of the surroundings. These applications/component may include geo-location
on your smartphone to keep a track of your arrival/departure from the building to optimise the heat
pumps. It is also used to control the indoor weather of the system space by ensuring it is as per the
Network Energy service gateway (hard core controller) and cloud services via IP.
Link BMS Charge
management
Inverter Controller Smart
meter
Physical Batteries Charge
station
PV Air-
conditioning
DC
net
Heat
pump
Electric
grid
24
parameters when the user arrives and thus reducing manual user inputs at every occasion. This layer
is also responsible for integrating several sensors into the system which keep a track of the indoor
surroundings.
3.2.5 Security layer
The most vital part of an energy management software is the security layer. The European commission
strongly advises to implement the best procedures to protect the data of its citizens. The security layer
necessitates the encryption of data at every level and ensures there is least possibility of data theft. For
the successful implementation of micro-grids, the security of the system is of utmost importance and
hence it is one of the most important part of the system.
3.3 The Portal
The portal is a graphical interface of the SmartPowerSuite® developed by Enervalis. It is a transparent
platform where all relevant data are imaged. It can be accessed from any computer, tablet or a
smartphone. It serves the same structure and function to all clients, differing only in the data given
access to the user by SmartPowerSuiteÒ.
Below is a snippet of representation of a system overview.
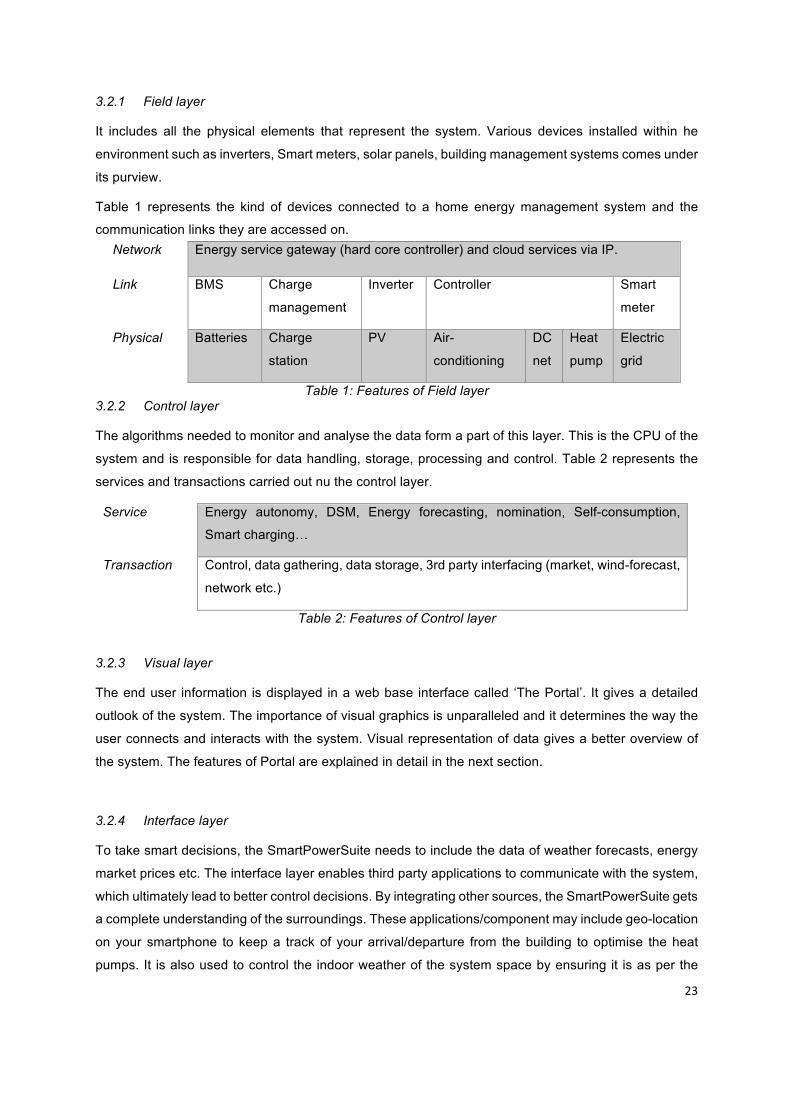
figure 12: System overview as viewed in ‘The Portal’.
Figure 12, Section A represents the direction of flow of energy in the system. It gives a quick outlook to
the end user of the current state of the system. Section B displays the location of the end user. Section
C represents factual information such as the amount of energy generated through renewable sources
in kWh and the amount of money saved through renewables and the earnings through participation in
flexibility market. Figure 13 represents the functionalities present in section C.
25
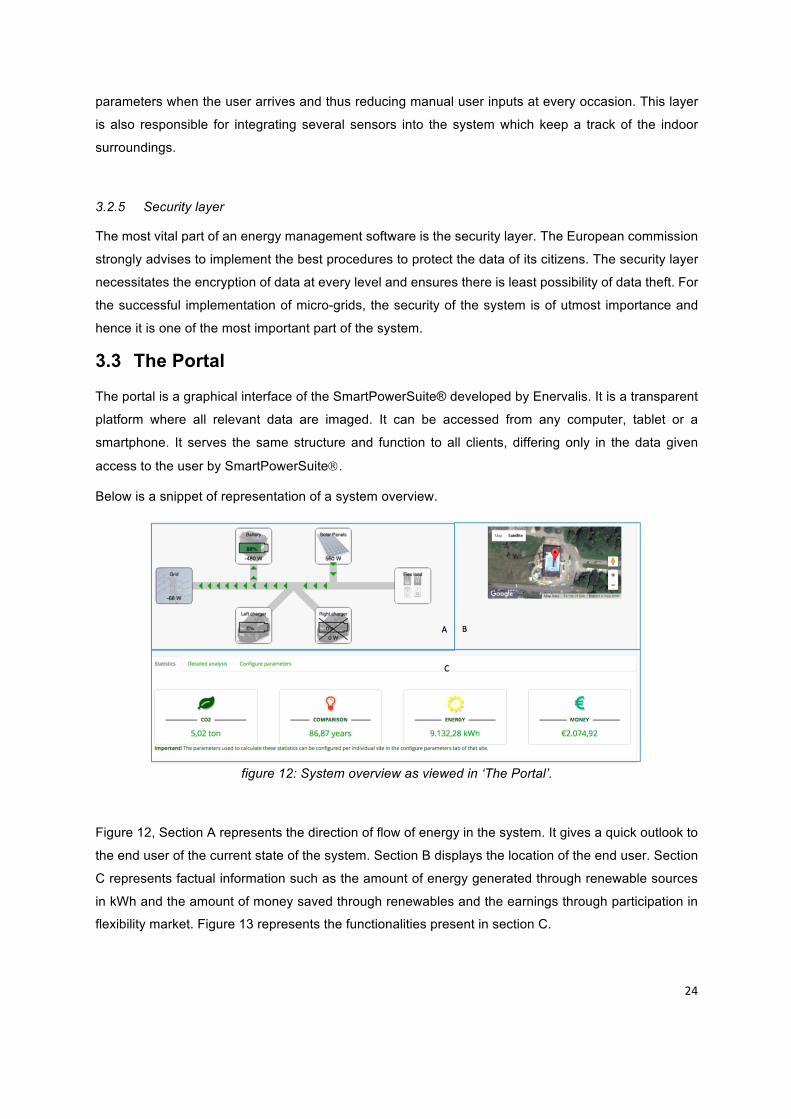
figure 13: Analysis of Section C of Portal
The Portal also displays the performance of device controlled by the system. It gives information relating
to the energy consumed including the share of renewables and the energy from the grid in easy-to-
understand graphs for the end user. The user can input the timeline as needed and the relevant data
pertaining to it shall be displayed. With the detailed analysis one can view the behaviour of each of the
components in the energy setup.
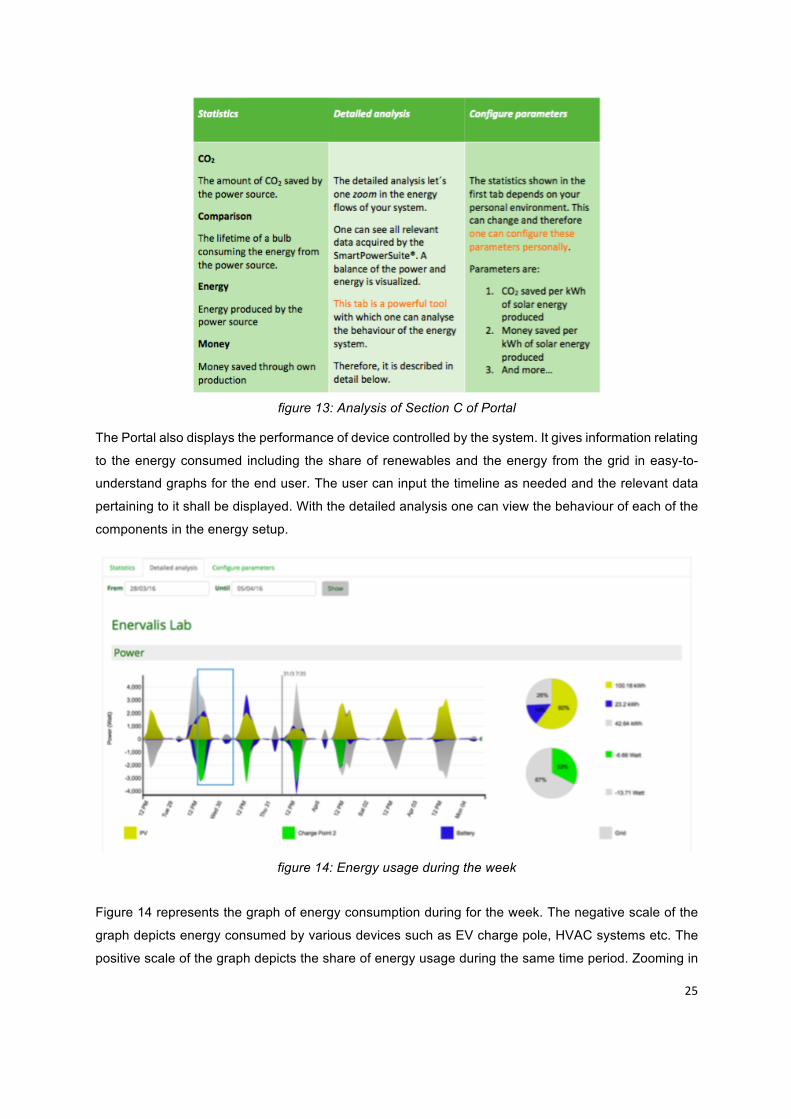
figure 14: Energy usage during the week
Figure 14 represents the graph of energy consumption during for the week. The negative scale of the
graph depicts energy consumed by various devices such as EV charge pole, HVAC systems etc. The
positive scale of the graph depicts the share of energy usage during the same time period. Zooming in
26
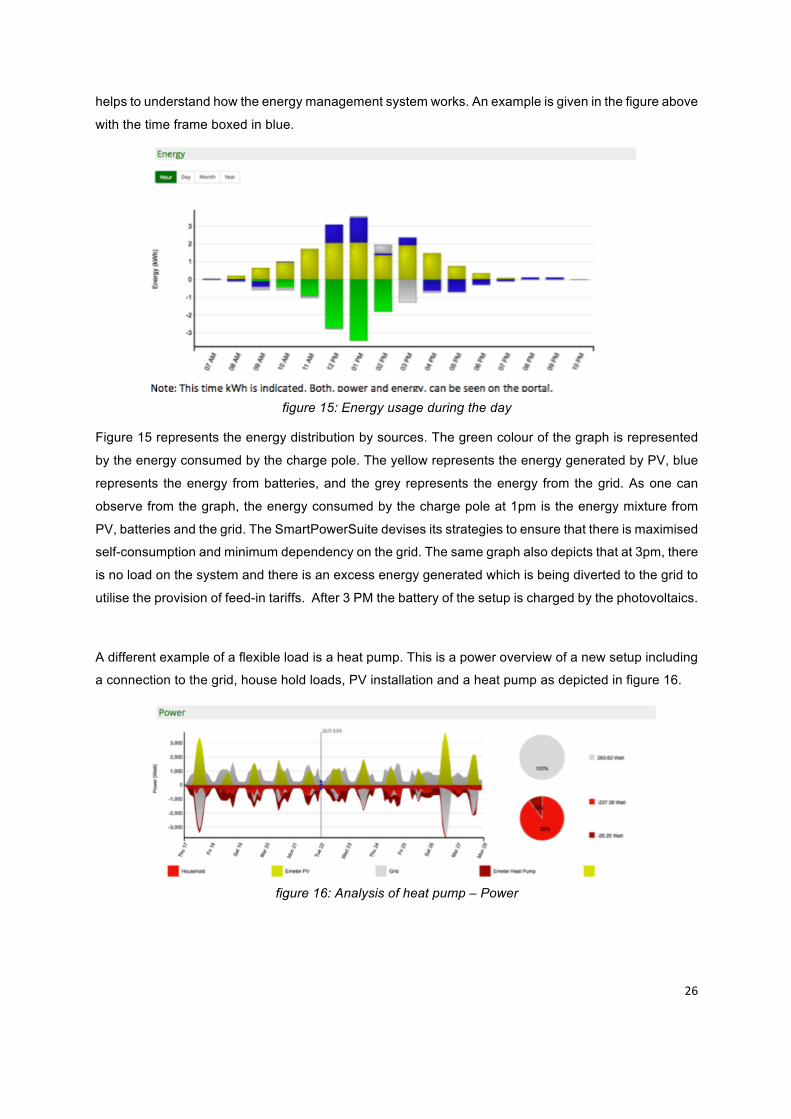
helps to understand how the energy management system works. An example is given in the figure above
with the time frame boxed in blue.
figure 15: Energy usage during the day
Figure 15 represents the energy distribution by sources. The green colour of the graph is represented
by the energy consumed by the charge pole. The yellow represents the energy generated by PV, blue
represents the energy from batteries, and the grey represents the energy from the grid. As one can
observe from the graph, the energy consumed by the charge pole at 1pm is the energy mixture from
PV, batteries and the grid. The SmartPowerSuite devises its strategies to ensure that there is maximised
self-consumption and minimum dependency on the grid. The same graph also depicts that at 3pm, there
is no load on the system and there is an excess energy generated which is being diverted to the grid to
utilise the provision of feed-in tariffs. After 3 PM the battery of the setup is charged by the photovoltaics.
A different example of a flexible load is a heat pump. This is a power overview of a new setup including
a connection to the grid, house hold loads, PV installation and a heat pump as depicted in figure 16.
figure 16: Analysis of heat pump – Power
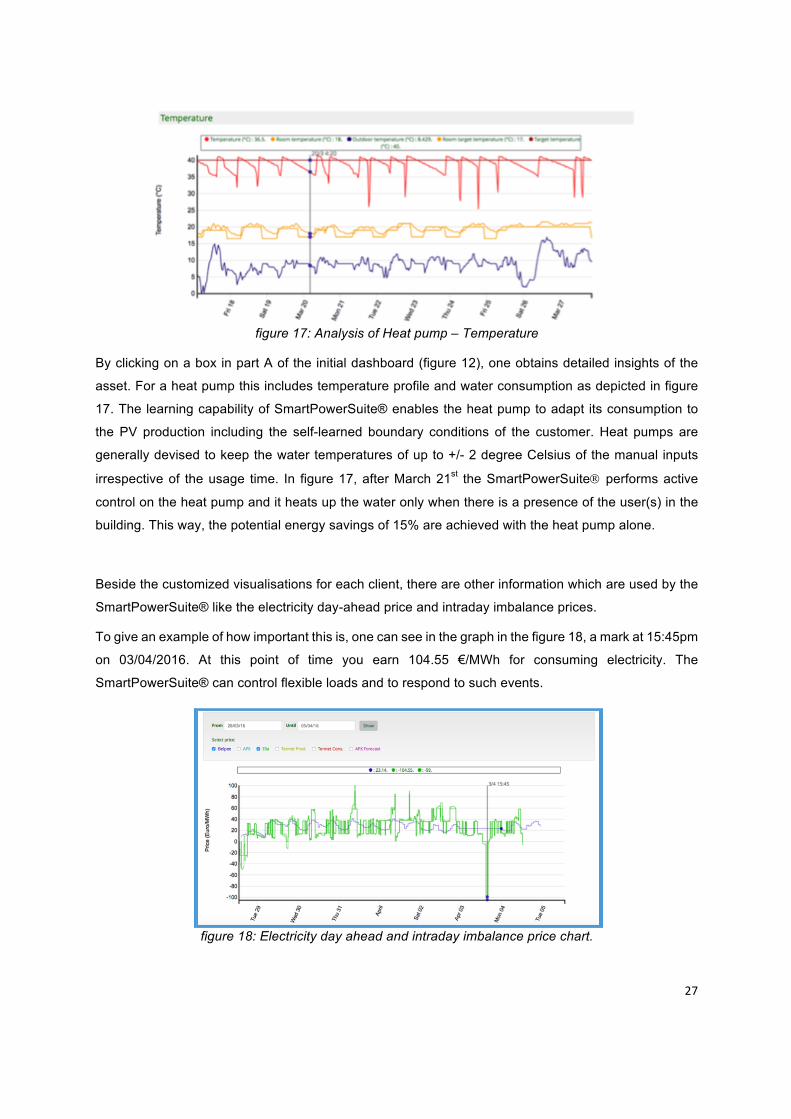
27
figure 17: Analysis of Heat pump – Temperature
By clicking on a box in part A of the initial dashboard (figure 12), one obtains detailed insights of the
asset. For a heat pump this includes temperature profile and water consumption as depicted in figure
17. The learning capability of SmartPowerSuite® enables the heat pump to adapt its consumption to
the PV production including the self-learned boundary conditions of the customer. Heat pumps are
generally devised to keep the water temperatures of up to +/- 2 degree Celsius of the manual inputs
irrespective of the usage time. In figure 17, after March 21st the SmartPowerSuiteÒ performs active
control on the heat pump and it heats up the water only when there is a presence of the user(s) in the
building. This way, the potential energy savings of 15% are achieved with the heat pump alone.
Beside the customized visualisations for each client, there are other information which are used by the
SmartPowerSuite® like the electricity day-ahead price and intraday imbalance prices.
To give an example of how important this is, one can see in the graph in the figure 18, a mark at 15:45pm
on 03/04/2016. At this point of time you earn 104.55 €/MWh for consuming electricity. The
SmartPowerSuite® can control flexible loads and to respond to such events.
figure 18: Electricity day ahead and intraday imbalance price chart.

28
The Portal overall is a very powerful agent in the system. It allows to view all the relevant data either in
macro or micro perspective, in real time or from the past. It is a powerful visualization tool to understand
the energy management system.
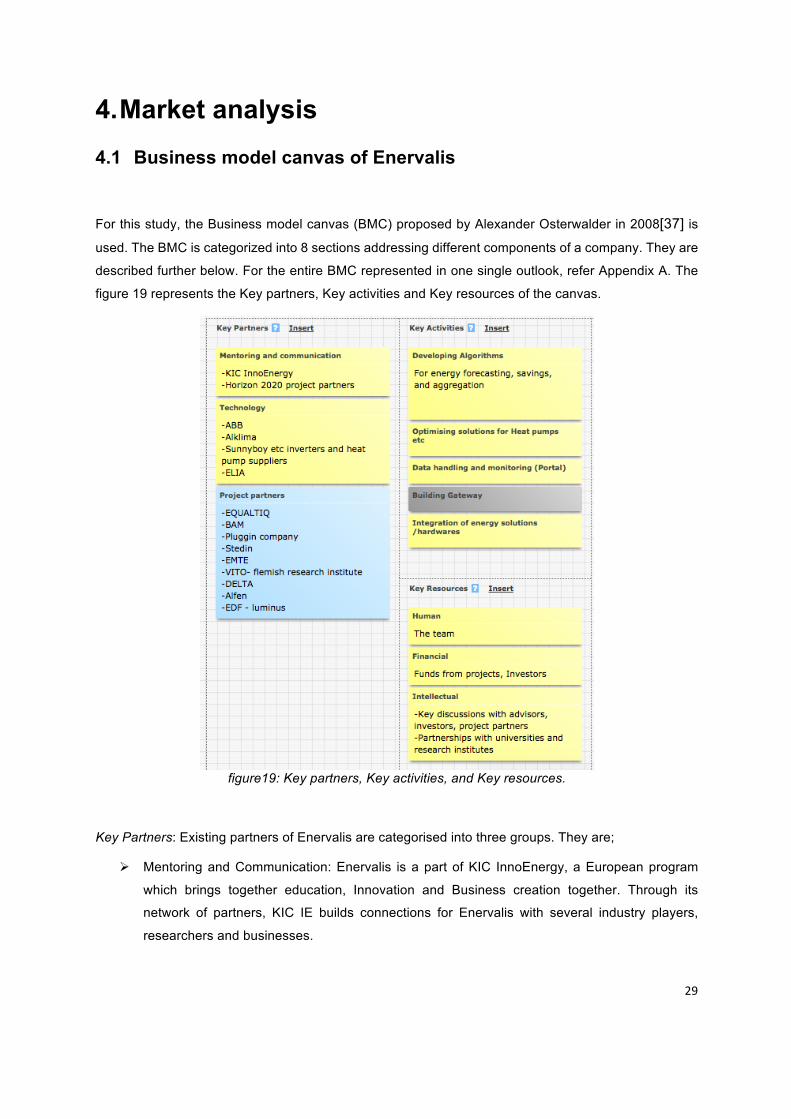
29
4. Market analysis 4.1 Business model canvas of Enervalis
For this study, the Business model canvas (BMC) proposed by Alexander Osterwalder in 2008[37] is
used. The BMC is categorized into 8 sections addressing different components of a company. They are
described further below. For the entire BMC represented in one single outlook, refer Appendix A. The
figure 19 represents the Key partners, Key activities and Key resources of the canvas.
figure19: Key partners, Key activities, and Key resources.
Key Partners: Existing partners of Enervalis are categorised into three groups. They are;
Ø Mentoring and Communication: Enervalis is a part of KIC InnoEnergy, a European program
which brings together education, Innovation and Business creation together. Through its
network of partners, KIC IE builds connections for Enervalis with several industry players,
researchers and businesses.

30
Ø Technology: Having major industry players as your partner aids in bridging the gap for sharing
of information to develop key technologies.
Ø Project partners: Enervalis is currently part of several projects with several different entities.
They range from research institutes, to construction companies, Electricity providers et., as the
solutions benefit several different markets (see Customer segments) together.
Key Activities: The SmartPowerSuiteÒ is still under development with new features being added every
month. Its learning capabilities are increasing exponentially. The key activity for the team of Enervalis
is to develop algorithms for energy forecasting, energy saving and energy aggregation mechanisms.
The SmartPowerSuiteÒ needs to communicate with all the devices part of a Building management
system and interact with them to perform control actions and adding these New devices to the list of
compatible devices is an important task for the team. Regarding Portal, there also needs to be constant
data monitoring and upgradation of its interface as it has proven to be of high potential.
Key Resources: Resources essential for the company are categorised into three sections:
Ø Human Element: The team of Enervalis is the most important asset of the company. Engineers,
data scientists, project managers, interns etc. work together to develop the SmartPowerSuiteÒ
into a complete solution for Smart micro grids.
Ø Financial: For any research and development activity, the flow of funds constitutes the pace of
the work. As further new companies will continue to invest in building the team and organising
new projects, the development of the SmartPowerSuiteÒ will be at a faster rate.
Ø Intellectual: One of the Key partners and resources for Enervalis is the support from several
academia and research institutes. Currently, members of the board who are part of universities
continue to guide towards developing new solutions. Interactions with project partners,
technology partners help in understanding the market in a better way.
Customer Segments: The SmartPowerSuiteÒ brings value to several players of the market and hence
addresses several different market segments. Following are the classification.
• Mass market: The SmartPowerSuiteÒ can be implemented to any home/office/building or a specific
charge pole. It can be customised to increase your savings and optimise your energy consumption.
• Niche market: SmartPowerSuiteÒ works well with communities looking for energy savings as a
whole. It can also use the flexibility the community offers and act as an aggregator and trade with
the Distribution system operator (DSO)/Transmission system operator (TSO). It can work with EV
charge pole companies to optimise the energy consumption using energy forecasting techniques.
It is utmost beneficial for off-grid communities who are looking to implement renewable generation
in their energy sources.
• Diversified market: It is a market that serves multiple customer segments together by combining
the niche market with its next level of users. To understand it better, let’s use the example of project
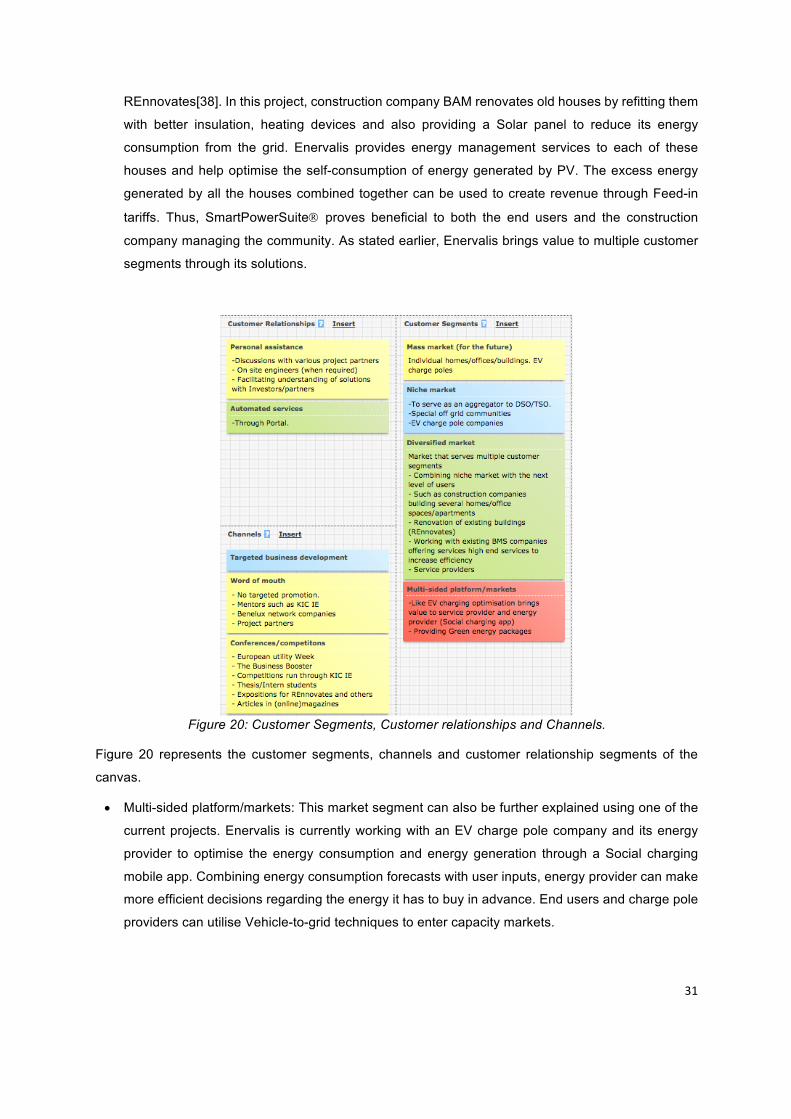
31
REnnovates[38]. In this project, construction company BAM renovates old houses by refitting them
with better insulation, heating devices and also providing a Solar panel to reduce its energy
consumption from the grid. Enervalis provides energy management services to each of these
houses and help optimise the self-consumption of energy generated by PV. The excess energy
generated by all the houses combined together can be used to create revenue through Feed-in
tariffs. Thus, SmartPowerSuiteÒ proves beneficial to both the end users and the construction
company managing the community. As stated earlier, Enervalis brings value to multiple customer
segments through its solutions.
Figure 20: Customer Segments, Customer relationships and Channels.
Figure 20 represents the customer segments, channels and customer relationship segments of the
canvas.
• Multi-sided platform/markets: This market segment can also be further explained using one of the
current projects. Enervalis is currently working with an EV charge pole company and its energy
provider to optimise the energy consumption and energy generation through a Social charging
mobile app. Combining energy consumption forecasts with user inputs, energy provider can make
more efficient decisions regarding the energy it has to buy in advance. End users and charge pole
providers can utilise Vehicle-to-grid techniques to enter capacity markets.
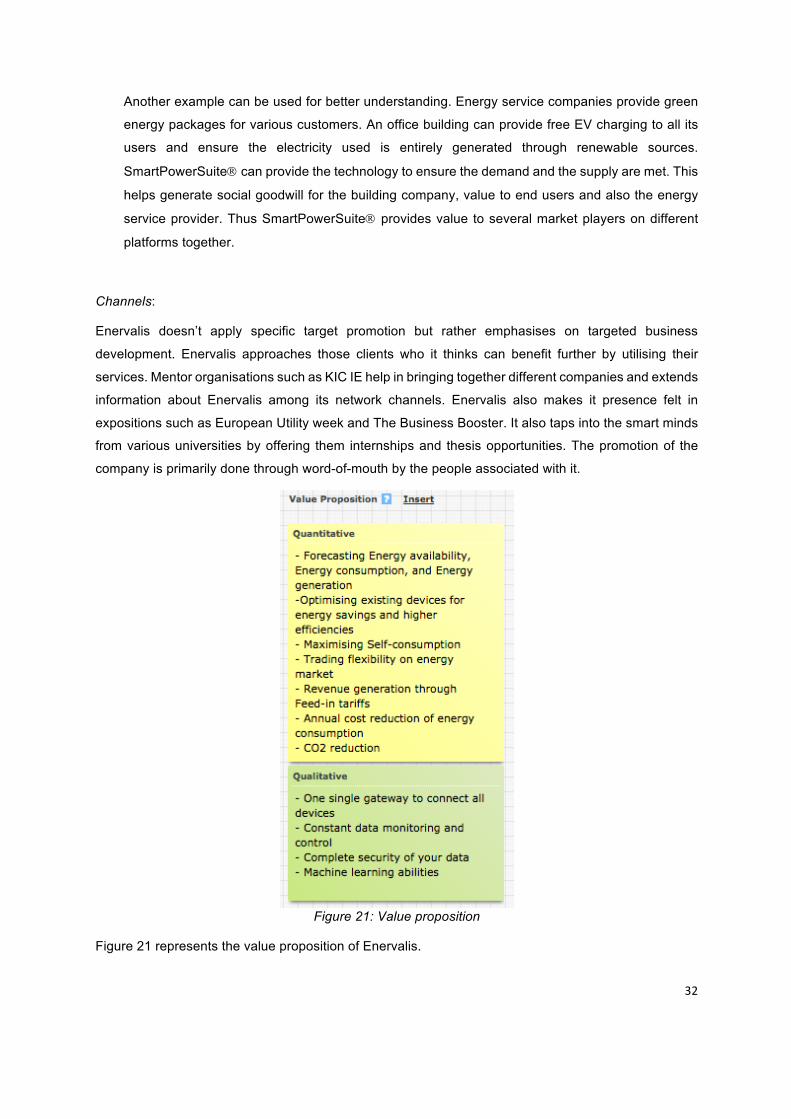
32
Another example can be used for better understanding. Energy service companies provide green
energy packages for various customers. An office building can provide free EV charging to all its
users and ensure the electricity used is entirely generated through renewable sources.
SmartPowerSuiteÒ can provide the technology to ensure the demand and the supply are met. This
helps generate social goodwill for the building company, value to end users and also the energy
service provider. Thus SmartPowerSuiteÒ provides value to several market players on different
platforms together.
Channels:
Enervalis doesn’t apply specific target promotion but rather emphasises on targeted business
development. Enervalis approaches those clients who it thinks can benefit further by utilising their
services. Mentor organisations such as KIC IE help in bringing together different companies and extends
information about Enervalis among its network channels. Enervalis also makes it presence felt in
expositions such as European Utility week and The Business Booster. It also taps into the smart minds
from various universities by offering them internships and thesis opportunities. The promotion of the
company is primarily done through word-of-mouth by the people associated with it.
Figure 21: Value proposition
Figure 21 represents the value proposition of Enervalis.

33
Value proposition: Enervalis brings to the table its capability of forecasting energy availability,
consumption patterns and Energy generation. Its algorithms monitor the current conditions and devise
methods to save energy on existing devices without compromising on its performance. It communicates
with several sensors, weather data and other parameters to maintain indoor climate with the least use
of energy. It allows maximised self-consumption of energy generated through PV or other sources. It
keeps a track on energy prices and uses load shifting and flexibility options to reduce energy bills. By
participating in energy market it creates a source of revenue. All these control actions are quantitative
and its affects can be seen in terms of monetary values.
In terms of equipment hardware required to establish these solutions, Enervalis offers one simple
gateway which can communicate with several devices over different communication protocols. The data
is gathered and monitored constantly at short time intervals and any incumbencies are quickly reported
by the system and corrected. Security of the data is of utmost importance and it provides encryption
layers at every step.
Figure 22: Cost structure and Revenue streams.
Figure 22 represents the financial aspects of the canvas.
Cost structure: Enervalis is Value driven company and it is reflected in their goal to create value for
everyone. The fixed costs are similar to other companies in terms of employee salaries, logistics and
travel expenditures. Certain variable costs arise time to time such as costs incurred to apply for patents,
legislations, bureaucratic procedures. Costs also arise to buy components to build gateway. Apart from
these, there are also employee and holiday bonuses.
Revenues: Enervalis receives its funding from several projects sanctioned by the European commission.
It is a part of H2020 program focused on building solutions for tomorrows smart grids. It also conducts
several Pilot projects. As the SmartPowerSuiteÒ becomes more definite several commercial projects
are getting on board. Apart from these, several companies have also invested in Enervalis.
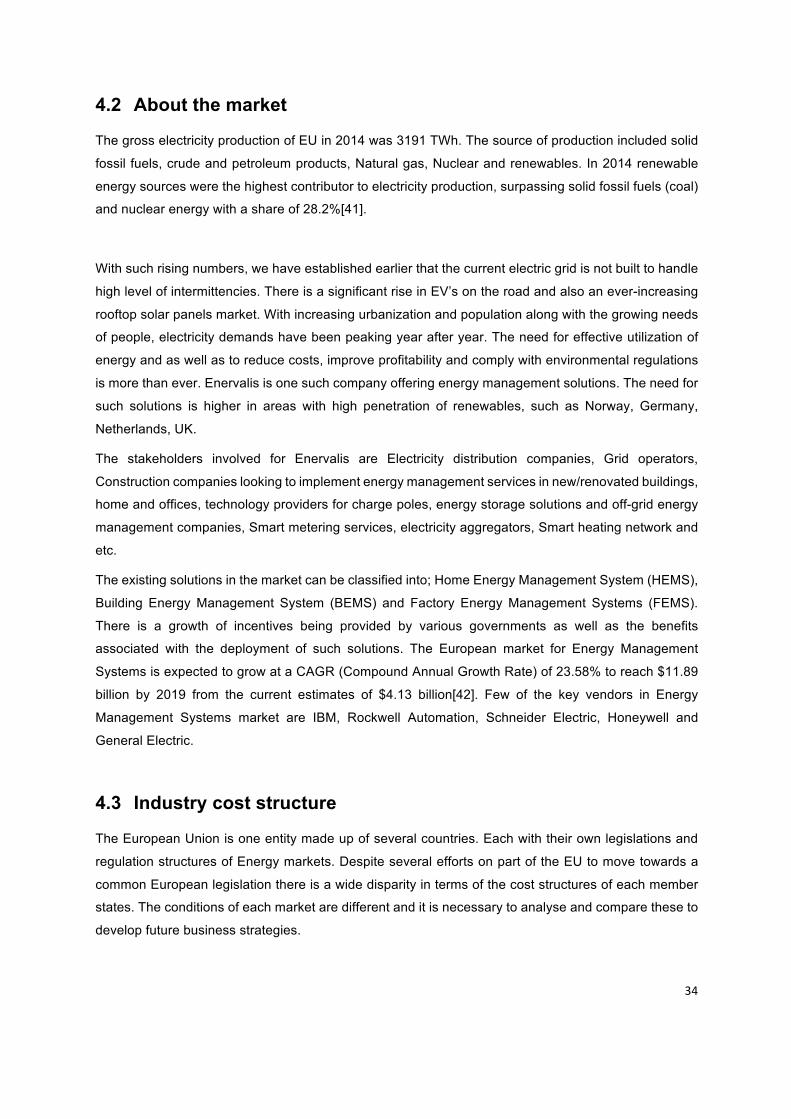
34
4.2 About the market
The gross electricity production of EU in 2014 was 3191 TWh. The source of production included solid
fossil fuels, crude and petroleum products, Natural gas, Nuclear and renewables. In 2014 renewable
energy sources were the highest contributor to electricity production, surpassing solid fossil fuels (coal)
and nuclear energy with a share of 28.2%[41].
With such rising numbers, we have established earlier that the current electric grid is not built to handle
high level of intermittencies. There is a significant rise in EV’s on the road and also an ever-increasing
rooftop solar panels market. With increasing urbanization and population along with the growing needs
of people, electricity demands have been peaking year after year. The need for effective utilization of
energy and as well as to reduce costs, improve profitability and comply with environmental regulations
is more than ever. Enervalis is one such company offering energy management solutions. The need for
such solutions is higher in areas with high penetration of renewables, such as Norway, Germany,
Netherlands, UK.
The stakeholders involved for Enervalis are Electricity distribution companies, Grid operators,
Construction companies looking to implement energy management services in new/renovated buildings,
home and offices, technology providers for charge poles, energy storage solutions and off-grid energy
management companies, Smart metering services, electricity aggregators, Smart heating network and
etc.
The existing solutions in the market can be classified into; Home Energy Management System (HEMS),
Building Energy Management System (BEMS) and Factory Energy Management Systems (FEMS).
There is a growth of incentives being provided by various governments as well as the benefits
associated with the deployment of such solutions. The European market for Energy Management
Systems is expected to grow at a CAGR (Compound Annual Growth Rate) of 23.58% to reach $11.89
billion by 2019 from the current estimates of $4.13 billion[42]. Few of the key vendors in Energy
Management Systems market are IBM, Rockwell Automation, Schneider Electric, Honeywell and
General Electric.
4.3 Industry cost structure
The European Union is one entity made up of several countries. Each with their own legislations and
regulation structures of Energy markets. Despite several efforts on part of the EU to move towards a
common European legislation there is a wide disparity in terms of the cost structures of each member
states. The conditions of each market are different and it is necessary to analyse and compare these to
develop future business strategies.
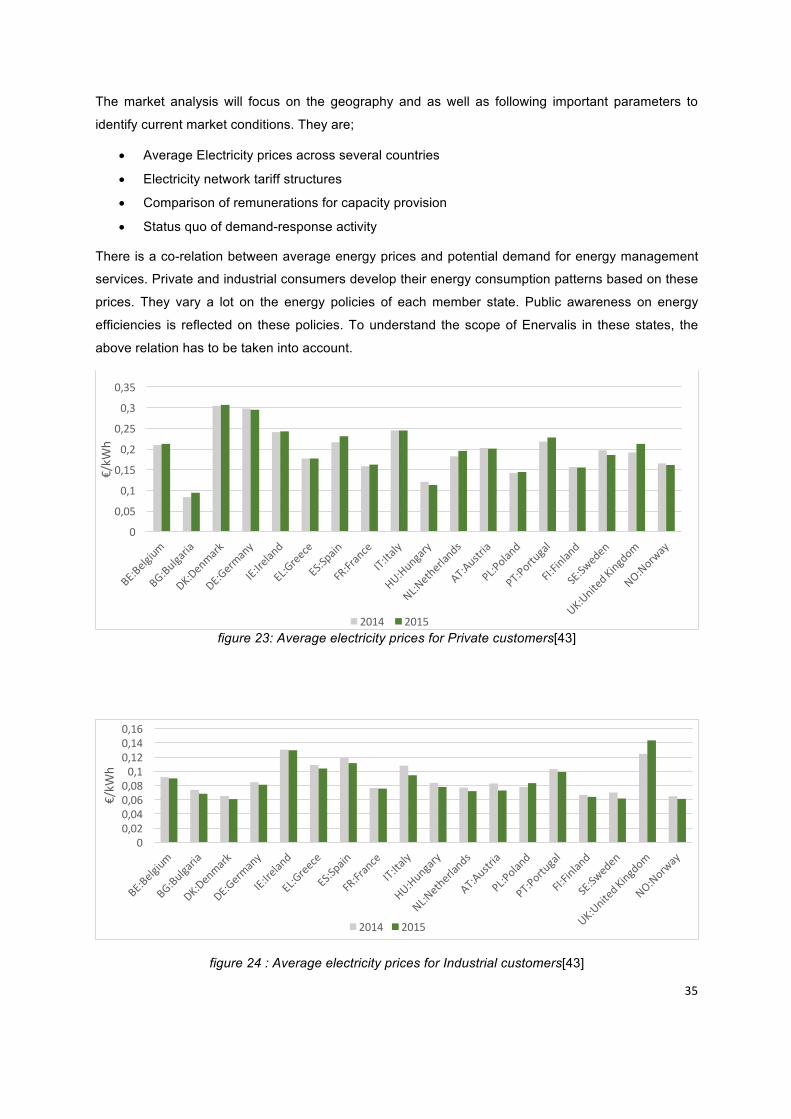
35
The market analysis will focus on the geography and as well as following important parameters to
identify current market conditions. They are;
• Average Electricity prices across several countries
• Electricity network tariff structures
• Comparison of remunerations for capacity provision
• Status quo of demand-response activity
There is a co-relation between average energy prices and potential demand for energy management
services. Private and industrial consumers develop their energy consumption patterns based on these
prices. They vary a lot on the energy policies of each member state. Public awareness on energy
efficiencies is reflected on these policies. To understand the scope of Enervalis in these states, the
above relation has to be taken into account.
figure 23: Average electricity prices for Private customers[43]
figure 24 : Average electricity prices for Industrial customers[43]
0
0,05
0,1
0,15
0,2
0,25
0,3
0,35
€/kW
h
2014 2015
00,020,040,060,080,10,120,140,16
€/kW
h
2014 2015
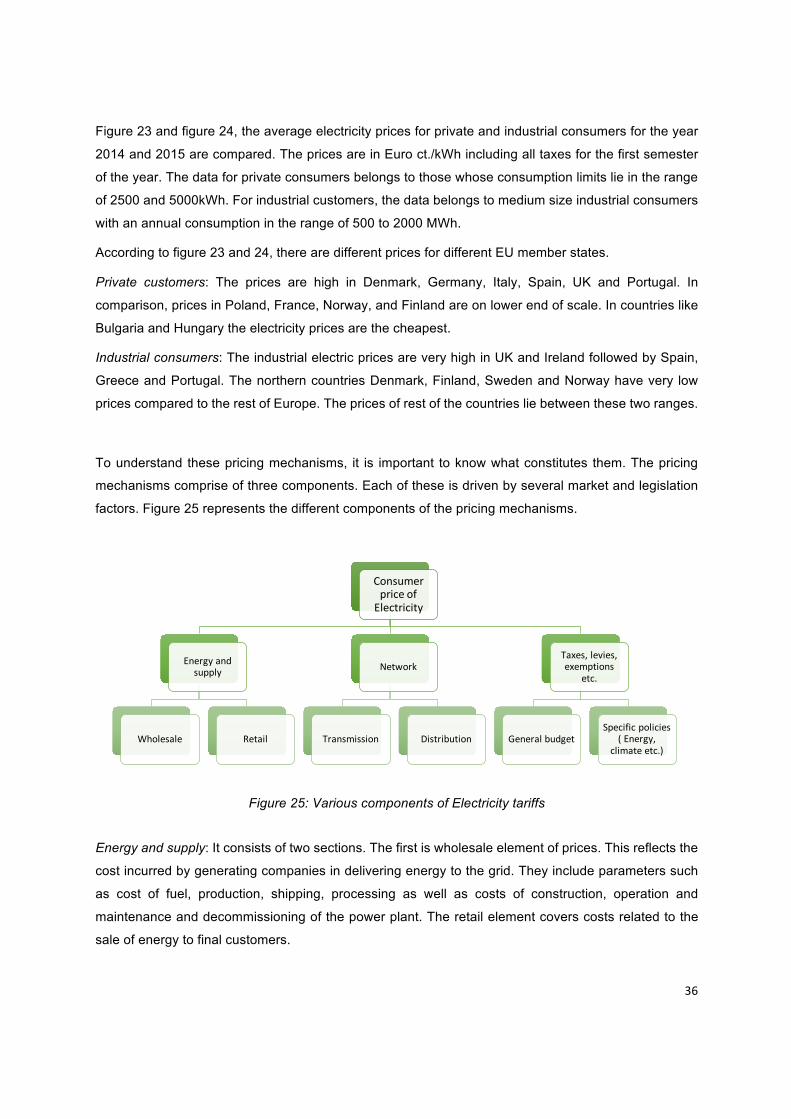
36
Figure 23 and figure 24, the average electricity prices for private and industrial consumers for the year
2014 and 2015 are compared. The prices are in Euro ct./kWh including all taxes for the first semester
of the year. The data for private consumers belongs to those whose consumption limits lie in the range
of 2500 and 5000kWh. For industrial customers, the data belongs to medium size industrial consumers
with an annual consumption in the range of 500 to 2000 MWh.
According to figure 23 and 24, there are different prices for different EU member states.
Private customers: The prices are high in Denmark, Germany, Italy, Spain, UK and Portugal. In
comparison, prices in Poland, France, Norway, and Finland are on lower end of scale. In countries like
Bulgaria and Hungary the electricity prices are the cheapest.
Industrial consumers: The industrial electric prices are very high in UK and Ireland followed by Spain,
Greece and Portugal. The northern countries Denmark, Finland, Sweden and Norway have very low
prices compared to the rest of Europe. The prices of rest of the countries lie between these two ranges.
To understand these pricing mechanisms, it is important to know what constitutes them. The pricing
mechanisms comprise of three components. Each of these is driven by several market and legislation
factors. Figure 25 represents the different components of the pricing mechanisms.
Figure 25: Various components of Electricity tariffs
Energy and supply: It consists of two sections. The first is wholesale element of prices. This reflects the
cost incurred by generating companies in delivering energy to the grid. They include parameters such
as cost of fuel, production, shipping, processing as well as costs of construction, operation and
maintenance and decommissioning of the power plant. The retail element covers costs related to the
sale of energy to final customers.
ConsumerpriceofElectricity
Energyandsupply
Wholesale Retail
Network
Transmission Distribution
Taxes,levies,exemptions
etc.
GeneralbudgetSpecificpolicies
(Energy,climateetc.)
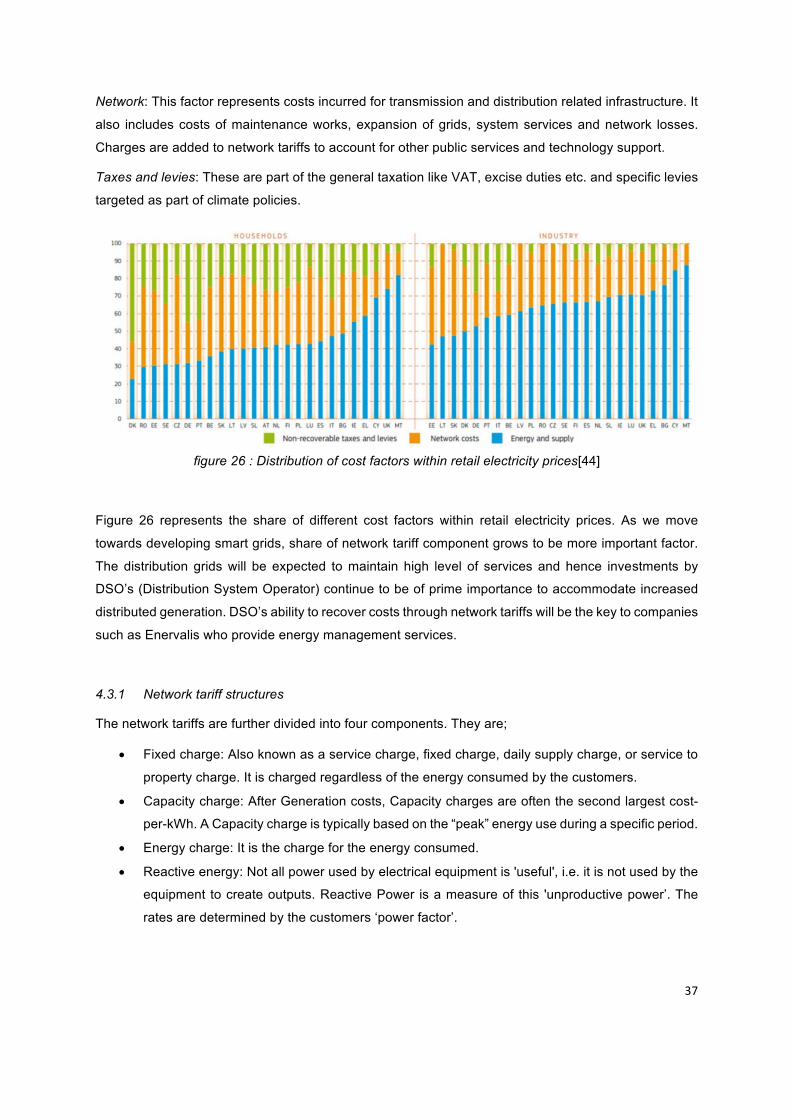
37
Network: This factor represents costs incurred for transmission and distribution related infrastructure. It
also includes costs of maintenance works, expansion of grids, system services and network losses.
Charges are added to network tariffs to account for other public services and technology support.
Taxes and levies: These are part of the general taxation like VAT, excise duties etc. and specific levies
targeted as part of climate policies.
figure 26 : Distribution of cost factors within retail electricity prices[44]
Figure 26 represents the share of different cost factors within retail electricity prices. As we move
towards developing smart grids, share of network tariff component grows to be more important factor.
The distribution grids will be expected to maintain high level of services and hence investments by
DSO’s (Distribution System Operator) continue to be of prime importance to accommodate increased
distributed generation. DSO’s ability to recover costs through network tariffs will be the key to companies
such as Enervalis who provide energy management services.
4.3.1 Network tariff structures
The network tariffs are further divided into four components. They are;
• Fixed charge: Also known as a service charge, fixed charge, daily supply charge, or service to
property charge. It is charged regardless of the energy consumed by the customers.
• Capacity charge: After Generation costs, Capacity charges are often the second largest cost-
per-kWh. A Capacity charge is typically based on the “peak” energy use during a specific period.
• Energy charge: It is the charge for the energy consumed.
• Reactive energy: Not all power used by electrical equipment is 'useful', i.e. it is not used by the
equipment to create outputs. Reactive Power is a measure of this 'unproductive power’. The
rates are determined by the customers ‘power factor’.
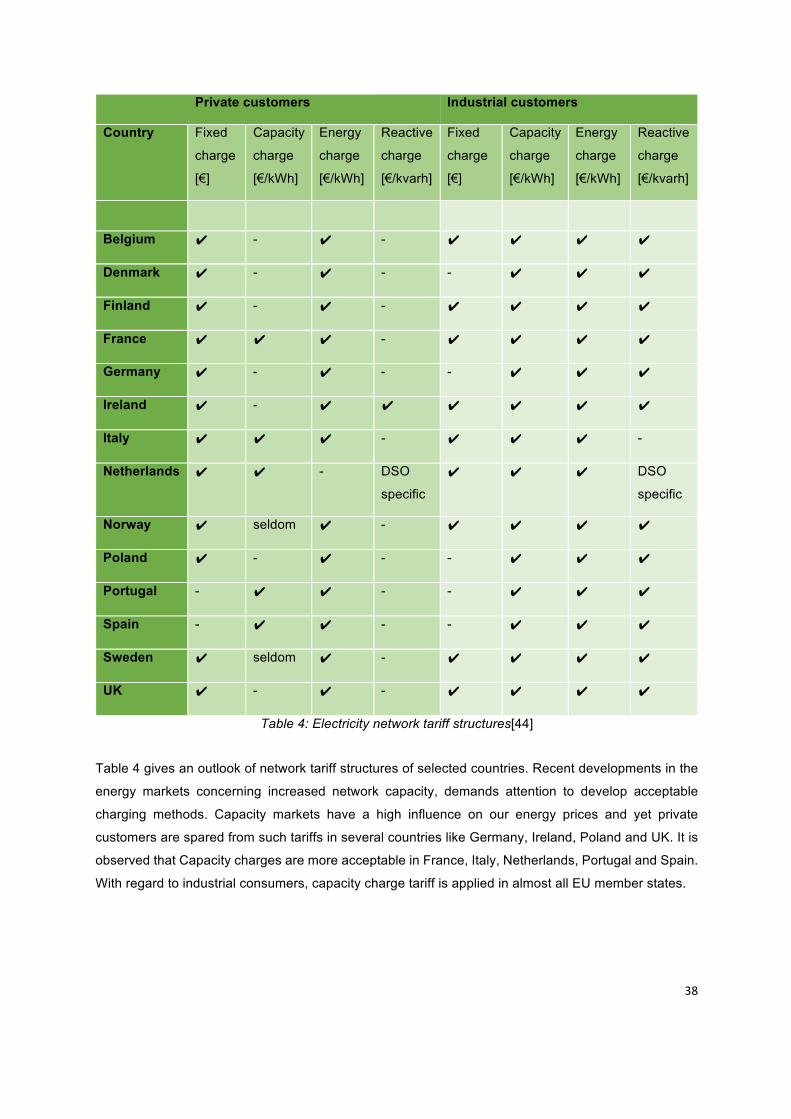
38
Private customers Industrial customers
Country Fixed
charge
[€]
Capacity
charge
[€/kWh]
Energy
charge
[€/kWh]
Reactive
charge
[€/kvarh]
Fixed
charge
[€]
Capacity
charge
[€/kWh]
Energy
charge
[€/kWh]
Reactive
charge
[€/kvarh]
Belgium ✔ - ✔ - ✔ ✔ ✔ ✔
Denmark ✔ - ✔ - - ✔ ✔ ✔
Finland ✔ - ✔ - ✔ ✔ ✔ ✔
France ✔ ✔ ✔ - ✔ ✔ ✔ ✔
Germany ✔ - ✔ - - ✔ ✔ ✔
Ireland ✔ - ✔ ✔ ✔ ✔ ✔ ✔
Italy ✔ ✔ ✔ - ✔ ✔ ✔ -
Netherlands ✔ ✔ - DSO
specific ✔ ✔ ✔ DSO
specific
Norway ✔ seldom ✔ - ✔ ✔ ✔ ✔
Poland ✔ - ✔ - - ✔ ✔ ✔
Portugal - ✔ ✔ - - ✔ ✔ ✔
Spain - ✔ ✔ - - ✔ ✔ ✔
Sweden ✔ seldom ✔ - ✔ ✔ ✔ ✔
UK ✔ - ✔ - ✔ ✔ ✔ ✔
Table 4: Electricity network tariff structures[44]
Table 4 gives an outlook of network tariff structures of selected countries. Recent developments in the
energy markets concerning increased network capacity, demands attention to develop acceptable
charging methods. Capacity markets have a high influence on our energy prices and yet private
customers are spared from such tariffs in several countries like Germany, Ireland, Poland and UK. It is
observed that Capacity charges are more acceptable in France, Italy, Netherlands, Portugal and Spain.
With regard to industrial consumers, capacity charge tariff is applied in almost all EU member states.
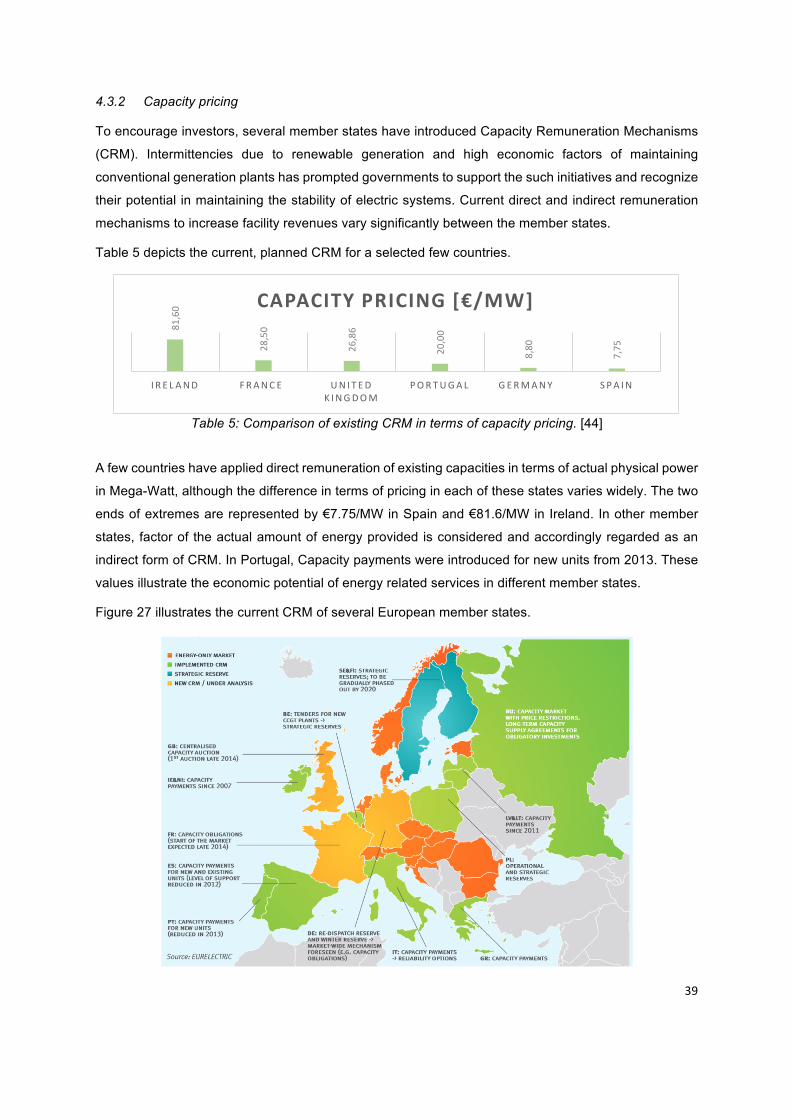
39
4.3.2 Capacity pricing
To encourage investors, several member states have introduced Capacity Remuneration Mechanisms
(CRM). Intermittencies due to renewable generation and high economic factors of maintaining
conventional generation plants has prompted governments to support the such initiatives and recognize
their potential in maintaining the stability of electric systems. Current direct and indirect remuneration
mechanisms to increase facility revenues vary significantly between the member states.
Table 5 depicts the current, planned CRM for a selected few countries.
Table 5: Comparison of existing CRM in terms of capacity pricing. [44]
A few countries have applied direct remuneration of existing capacities in terms of actual physical power
in Mega-Watt, although the difference in terms of pricing in each of these states varies widely. The two
ends of extremes are represented by €7.75/MW in Spain and €81.6/MW in Ireland. In other member
states, factor of the actual amount of energy provided is considered and accordingly regarded as an
indirect form of CRM. In Portugal, Capacity payments were introduced for new units from 2013. These
values illustrate the economic potential of energy related services in different member states.
Figure 27 illustrates the current CRM of several European member states.
81,60
28,50
26,86
20,00
8,80
7,75
I R E L AND FRANC E UN I T ED K INGDOM
PORTUGAL GERMANY S PA IN
CAPACITYPRICING[€/MW]
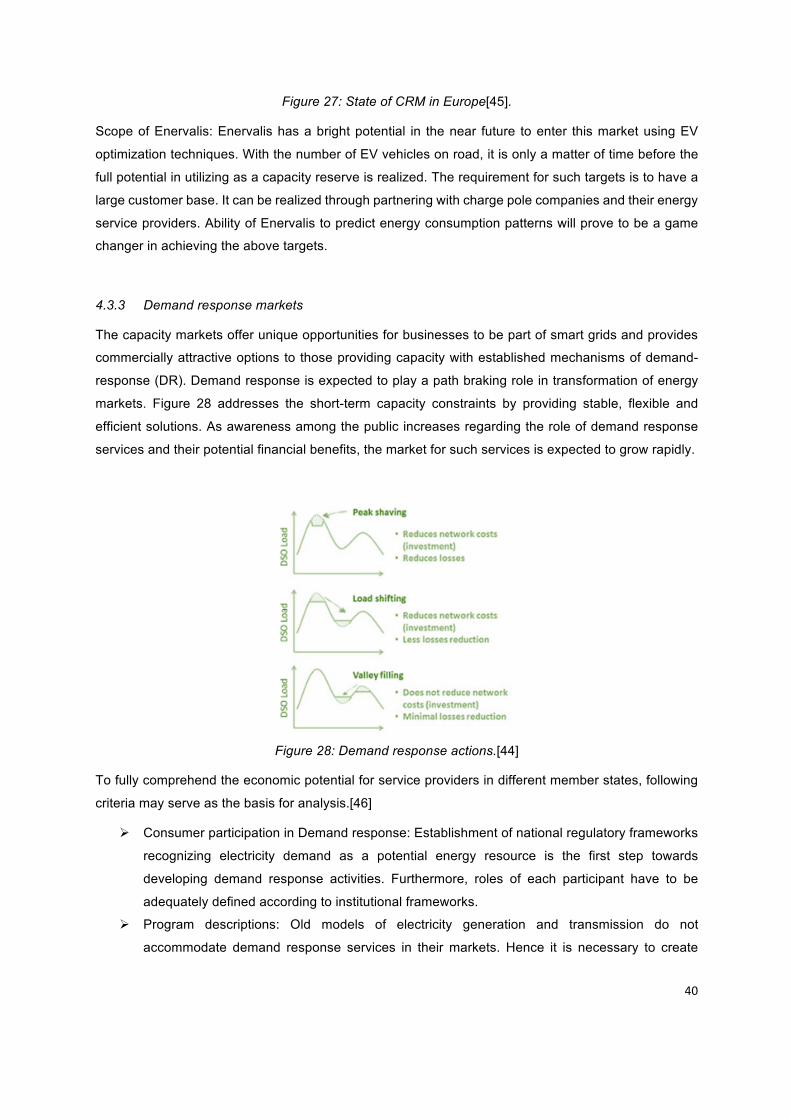
40
Figure 27: State of CRM in Europe[45].
Scope of Enervalis: Enervalis has a bright potential in the near future to enter this market using EV
optimization techniques. With the number of EV vehicles on road, it is only a matter of time before the
full potential in utilizing as a capacity reserve is realized. The requirement for such targets is to have a
large customer base. It can be realized through partnering with charge pole companies and their energy
service providers. Ability of Enervalis to predict energy consumption patterns will prove to be a game
changer in achieving the above targets.
4.3.3 Demand response markets
The capacity markets offer unique opportunities for businesses to be part of smart grids and provides
commercially attractive options to those providing capacity with established mechanisms of demand-
response (DR). Demand response is expected to play a path braking role in transformation of energy
markets. Figure 28 addresses the short-term capacity constraints by providing stable, flexible and
efficient solutions. As awareness among the public increases regarding the role of demand response
services and their potential financial benefits, the market for such services is expected to grow rapidly.
Figure 28: Demand response actions.[44]
To fully comprehend the economic potential for service providers in different member states, following
criteria may serve as the basis for analysis.[46]
Ø Consumer participation in Demand response: Establishment of national regulatory frameworks
recognizing electricity demand as a potential energy resource is the first step towards
developing demand response activities. Furthermore, roles of each participant have to be
adequately defined according to institutional frameworks.
Ø Program descriptions: Old models of electricity generation and transmission do not
accommodate demand response services in their markets. Hence it is necessary to create
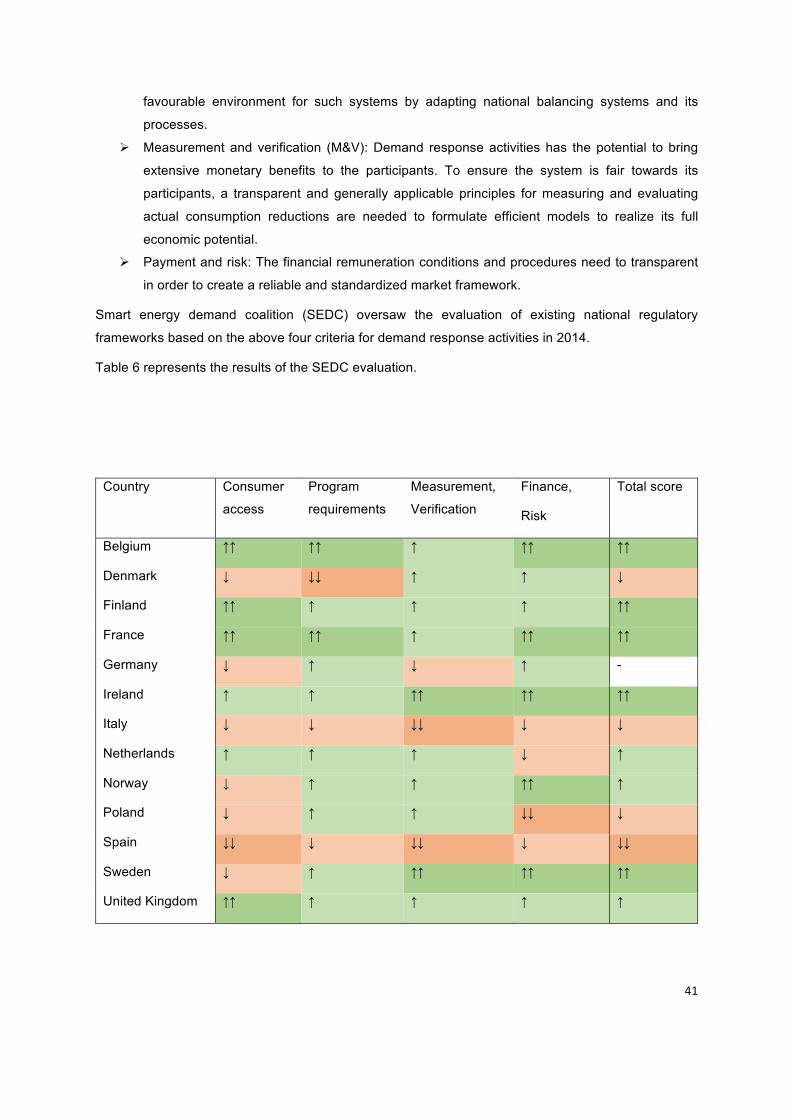
41
favourable environment for such systems by adapting national balancing systems and its
processes.
Ø Measurement and verification (M&V): Demand response activities has the potential to bring
extensive monetary benefits to the participants. To ensure the system is fair towards its
participants, a transparent and generally applicable principles for measuring and evaluating
actual consumption reductions are needed to formulate efficient models to realize its full
economic potential.
Ø Payment and risk: The financial remuneration conditions and procedures need to transparent
in order to create a reliable and standardized market framework.
Smart energy demand coalition (SEDC) oversaw the evaluation of existing national regulatory
frameworks based on the above four criteria for demand response activities in 2014.
Table 6 represents the results of the SEDC evaluation.
Country Consumer
access
Program
requirements
Measurement,
Verification
Finance,
Risk
Total score
Belgium ↑↑ ↑↑ ↑ ↑↑ ↑↑
Denmark ↓ ↓↓ ↑ ↑ ↓
Finland ↑↑ ↑ ↑ ↑ ↑↑
France ↑↑ ↑↑ ↑ ↑↑ ↑↑
Germany ↓ ↑ ↓ ↑ -
Ireland ↑ ↑ ↑↑ ↑↑ ↑↑
Italy ↓ ↓ ↓↓ ↓ ↓
Netherlands ↑ ↑ ↑ ↓ ↑
Norway ↓ ↑ ↑ ↑↑ ↑
Poland ↓ ↑ ↑ ↓↓ ↓
Spain ↓↓ ↓ ↓↓ ↓ ↓↓
Sweden ↓ ↑ ↑↑ ↑↑ ↑↑
United Kingdom ↑↑ ↑ ↑ ↑ ↑
42
↑↑ 4-5
↑ 3
↓ 1-2
↓↓ 0
Table 6: Status Quo of Demand Response Activity[46]
Figure 29: Demand response map for Europe 2013-14 [46]
Figure 29 represents the Demand response market activity of various countries for the year 2013-14.
From the results of the SEDC evaluation, favourable conditions can be found in Belgium, Finland,
France, Ireland, Sweden and United Kingdom. Market environments in Denmark, Italy, Poland and
Spain is rather deterring for services of Enervalis. For Portugal, SEDC could not conduct a thorough
review of the development. Conditions in Germany are both favourable and unfavourable depending on
specific criteria’s.
Various Business models can be adopted as a Demand response program (DRP) in the market. They
are further discussed in the next section.
4.4 Future Business models
Demand Side Management activities (DSM) are organized into ‘Energy efficient’ (EE) and ‘Demand
response’ (DR) business models as seen in figure 30. These are increasingly becoming popular due to
technological advances in smart girds and electricity market deregulation. To ensure DSM activities, it
requires sustainable business models. They are influenced by factors such as market regulation,
mechanisms, distributed generation, renewable energy sources and storage devices. Enervalis is one
such player in the market with the capabilities of providing advanced energy efficiency and demand
response solutions.
The analysis of each business model is divided into three types of DSM characteristics:
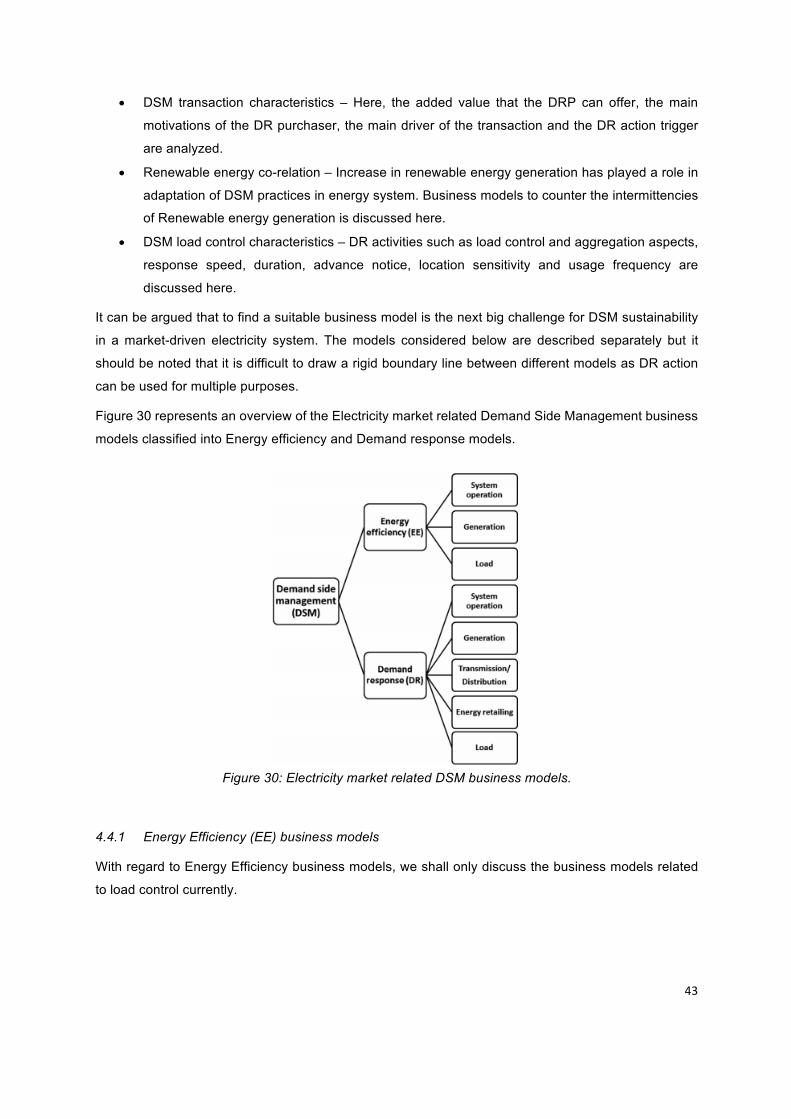
43
• DSM transaction characteristics – Here, the added value that the DRP can offer, the main
motivations of the DR purchaser, the main driver of the transaction and the DR action trigger
are analyzed.
• Renewable energy co-relation – Increase in renewable energy generation has played a role in
adaptation of DSM practices in energy system. Business models to counter the intermittencies
of Renewable energy generation is discussed here.
• DSM load control characteristics – DR activities such as load control and aggregation aspects,
response speed, duration, advance notice, location sensitivity and usage frequency are
discussed here.
It can be argued that to find a suitable business model is the next big challenge for DSM sustainability
in a market-driven electricity system. The models considered below are described separately but it
should be noted that it is difficult to draw a rigid boundary line between different models as DR action
can be used for multiple purposes.
Figure 30 represents an overview of the Electricity market related Demand Side Management business
models classified into Energy efficiency and Demand response models.
Figure 30: Electricity market related DSM business models.
4.4.1 Energy Efficiency (EE) business models
With regard to Energy Efficiency business models, we shall only discuss the business models related
to load control currently.
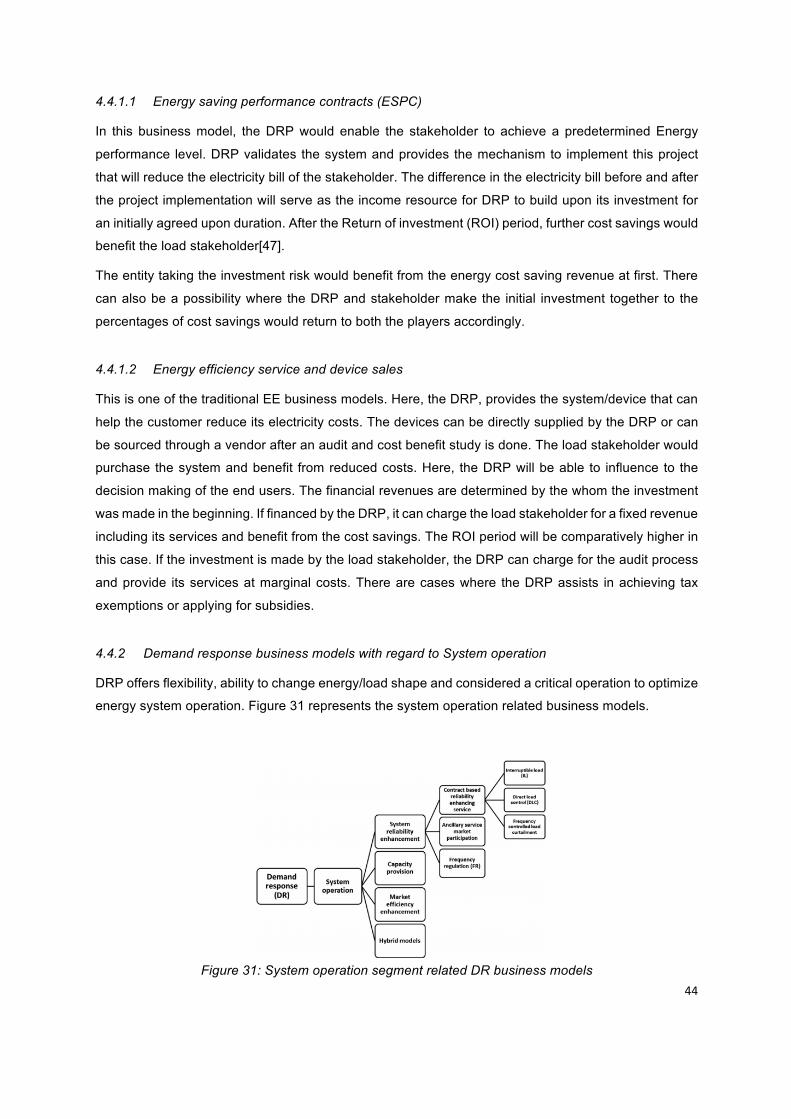
44
4.4.1.1 Energy saving performance contracts (ESPC)
In this business model, the DRP would enable the stakeholder to achieve a predetermined Energy
performance level. DRP validates the system and provides the mechanism to implement this project
that will reduce the electricity bill of the stakeholder. The difference in the electricity bill before and after
the project implementation will serve as the income resource for DRP to build upon its investment for
an initially agreed upon duration. After the Return of investment (ROI) period, further cost savings would
benefit the load stakeholder[47].
The entity taking the investment risk would benefit from the energy cost saving revenue at first. There
can also be a possibility where the DRP and stakeholder make the initial investment together to the
percentages of cost savings would return to both the players accordingly.
4.4.1.2 Energy efficiency service and device sales
This is one of the traditional EE business models. Here, the DRP, provides the system/device that can
help the customer reduce its electricity costs. The devices can be directly supplied by the DRP or can
be sourced through a vendor after an audit and cost benefit study is done. The load stakeholder would
purchase the system and benefit from reduced costs. Here, the DRP will be able to influence to the
decision making of the end users. The financial revenues are determined by the whom the investment
was made in the beginning. If financed by the DRP, it can charge the load stakeholder for a fixed revenue
including its services and benefit from the cost savings. The ROI period will be comparatively higher in
this case. If the investment is made by the load stakeholder, the DRP can charge for the audit process
and provide its services at marginal costs. There are cases where the DRP assists in achieving tax
exemptions or applying for subsidies.
4.4.2 Demand response business models with regard to System operation
DRP offers flexibility, ability to change energy/load shape and considered a critical operation to optimize
energy system operation. Figure 31 represents the system operation related business models.
Figure 31: System operation segment related DR business models
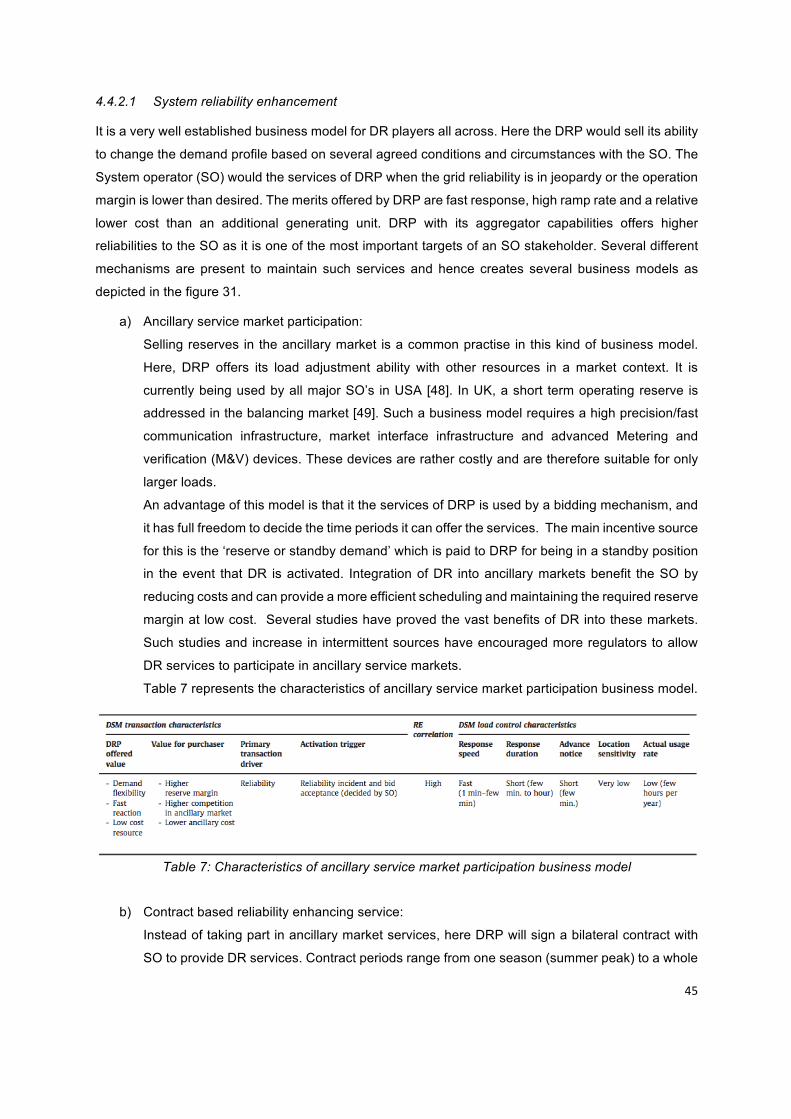
45
4.4.2.1 System reliability enhancement
It is a very well established business model for DR players all across. Here the DRP would sell its ability
to change the demand profile based on several agreed conditions and circumstances with the SO. The
System operator (SO) would the services of DRP when the grid reliability is in jeopardy or the operation
margin is lower than desired. The merits offered by DRP are fast response, high ramp rate and a relative
lower cost than an additional generating unit. DRP with its aggregator capabilities offers higher
reliabilities to the SO as it is one of the most important targets of an SO stakeholder. Several different
mechanisms are present to maintain such services and hence creates several business models as
depicted in the figure 31.
a) Ancillary service market participation:
Selling reserves in the ancillary market is a common practise in this kind of business model.
Here, DRP offers its load adjustment ability with other resources in a market context. It is
currently being used by all major SO’s in USA [48]. In UK, a short term operating reserve is
addressed in the balancing market [49]. Such a business model requires a high precision/fast
communication infrastructure, market interface infrastructure and advanced Metering and
verification (M&V) devices. These devices are rather costly and are therefore suitable for only
larger loads.
An advantage of this model is that it the services of DRP is used by a bidding mechanism, and
it has full freedom to decide the time periods it can offer the services. The main incentive source
for this is the ‘reserve or standby demand’ which is paid to DRP for being in a standby position
in the event that DR is activated. Integration of DR into ancillary markets benefit the SO by
reducing costs and can provide a more efficient scheduling and maintaining the required reserve
margin at low cost. Several studies have proved the vast benefits of DR into these markets.
Such studies and increase in intermittent sources have encouraged more regulators to allow
DR services to participate in ancillary service markets.
Table 7 represents the characteristics of ancillary service market participation business model.
Table 7: Characteristics of ancillary service market participation business model
b) Contract based reliability enhancing service:
Instead of taking part in ancillary market services, here DRP will sign a bilateral contract with
SO to provide DR services. Contract periods range from one season (summer peak) to a whole
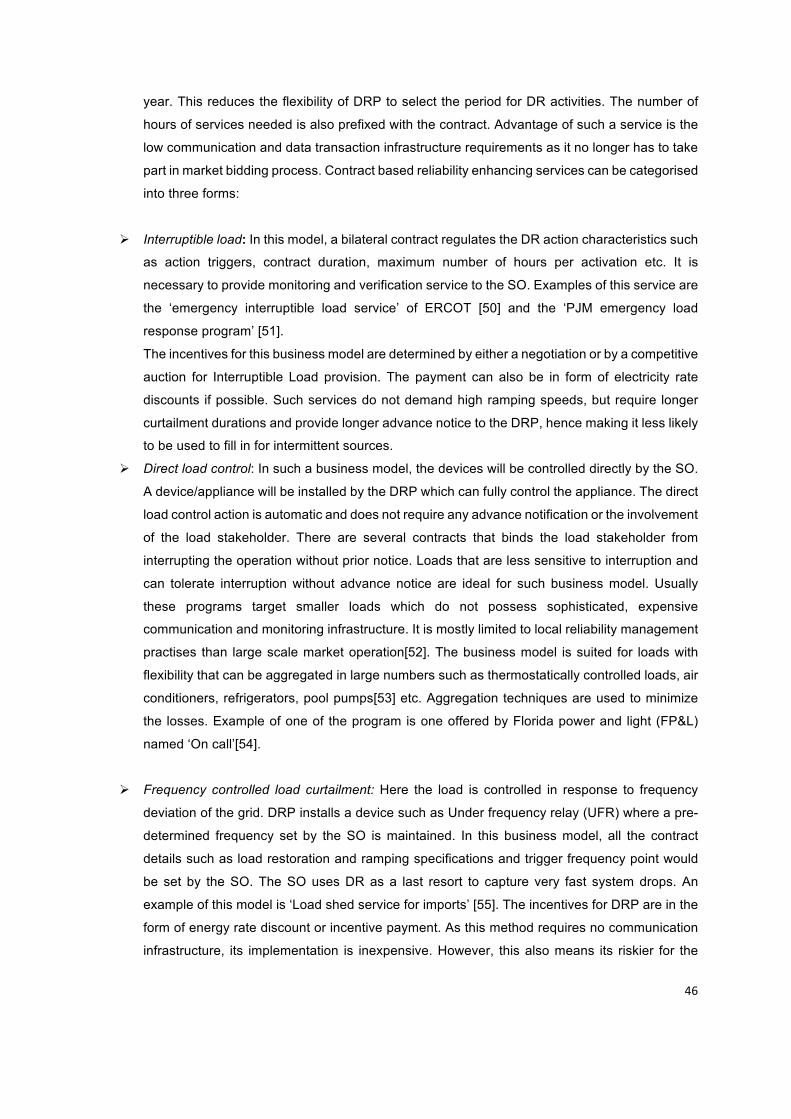
46
year. This reduces the flexibility of DRP to select the period for DR activities. The number of
hours of services needed is also prefixed with the contract. Advantage of such a service is the
low communication and data transaction infrastructure requirements as it no longer has to take
part in market bidding process. Contract based reliability enhancing services can be categorised
into three forms:
Ø Interruptible load: In this model, a bilateral contract regulates the DR action characteristics such
as action triggers, contract duration, maximum number of hours per activation etc. It is
necessary to provide monitoring and verification service to the SO. Examples of this service are
the ‘emergency interruptible load service’ of ERCOT [50] and the ‘PJM emergency load
response program’ [51].
The incentives for this business model are determined by either a negotiation or by a competitive
auction for Interruptible Load provision. The payment can also be in form of electricity rate
discounts if possible. Such services do not demand high ramping speeds, but require longer
curtailment durations and provide longer advance notice to the DRP, hence making it less likely
to be used to fill in for intermittent sources.
Ø Direct load control: In such a business model, the devices will be controlled directly by the SO.
A device/appliance will be installed by the DRP which can fully control the appliance. The direct
load control action is automatic and does not require any advance notification or the involvement
of the load stakeholder. There are several contracts that binds the load stakeholder from
interrupting the operation without prior notice. Loads that are less sensitive to interruption and
can tolerate interruption without advance notice are ideal for such business model. Usually
these programs target smaller loads which do not possess sophisticated, expensive
communication and monitoring infrastructure. It is mostly limited to local reliability management
practises than large scale market operation[52]. The business model is suited for loads with
flexibility that can be aggregated in large numbers such as thermostatically controlled loads, air
conditioners, refrigerators, pool pumps[53] etc. Aggregation techniques are used to minimize
the losses. Example of one of the program is one offered by Florida power and light (FP&L)
named ‘On call’[54].
Ø Frequency controlled load curtailment: Here the load is controlled in response to frequency
deviation of the grid. DRP installs a device such as Under frequency relay (UFR) where a pre-
determined frequency set by the SO is maintained. In this business model, all the contract
details such as load restoration and ramping specifications and trigger frequency point would
be set by the SO. The SO uses DR as a last resort to capture very fast system drops. An
example of this model is ‘Load shed service for imports’ [55]. The incentives for DRP are in the
form of energy rate discount or incentive payment. As this method requires no communication
infrastructure, its implementation is inexpensive. However, this also means its riskier for the
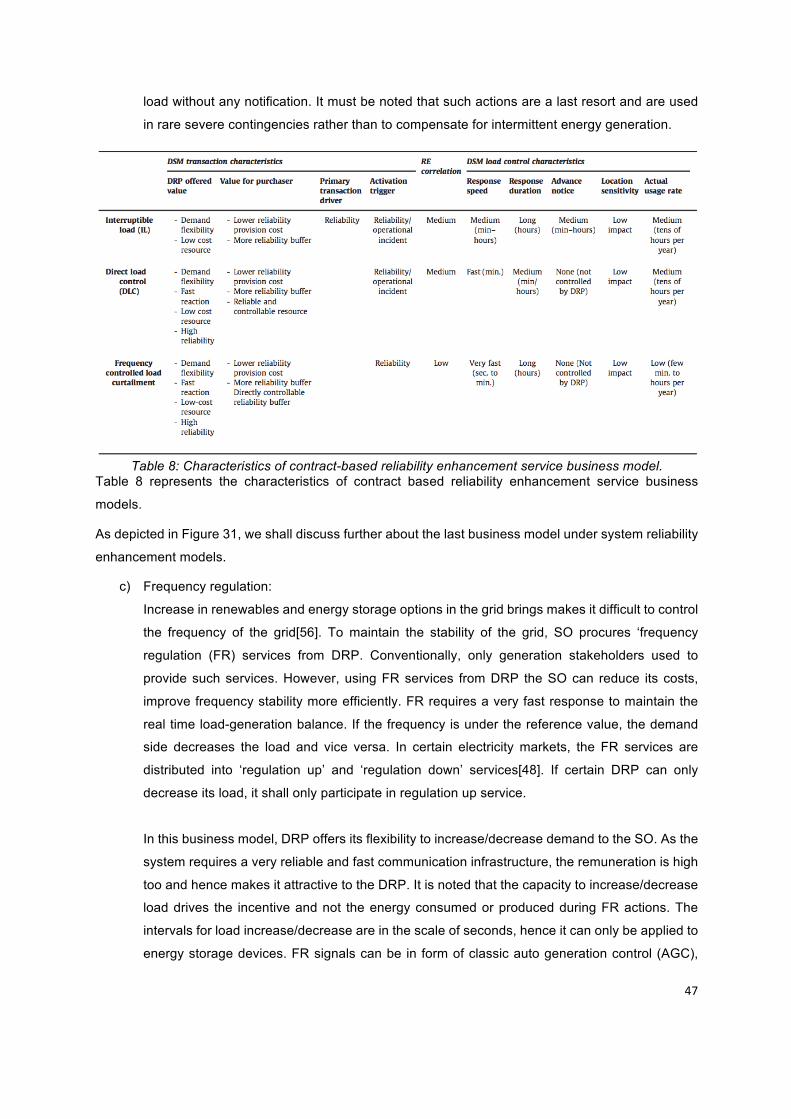
47
load without any notification. It must be noted that such actions are a last resort and are used
in rare severe contingencies rather than to compensate for intermittent energy generation.
Table 8: Characteristics of contract-based reliability enhancement service business model.
Table 8 represents the characteristics of contract based reliability enhancement service business
models.
As depicted in Figure 31, we shall discuss further about the last business model under system reliability
enhancement models.
c) Frequency regulation:
Increase in renewables and energy storage options in the grid brings makes it difficult to control
the frequency of the grid[56]. To maintain the stability of the grid, SO procures ‘frequency
regulation (FR) services from DRP. Conventionally, only generation stakeholders used to
provide such services. However, using FR services from DRP the SO can reduce its costs,
improve frequency stability more efficiently. FR requires a very fast response to maintain the
real time load-generation balance. If the frequency is under the reference value, the demand
side decreases the load and vice versa. In certain electricity markets, the FR services are
distributed into ‘regulation up’ and ‘regulation down’ services[48]. If certain DRP can only
decrease its load, it shall only participate in regulation up service.
In this business model, DRP offers its flexibility to increase/decrease demand to the SO. As the
system requires a very reliable and fast communication infrastructure, the remuneration is high
too and hence makes it attractive to the DRP. It is noted that the capacity to increase/decrease
load drives the incentive and not the energy consumed or produced during FR actions. The
intervals for load increase/decrease are in the scale of seconds, hence it can only be applied to
energy storage devices. FR signals can be in form of classic auto generation control (AGC),
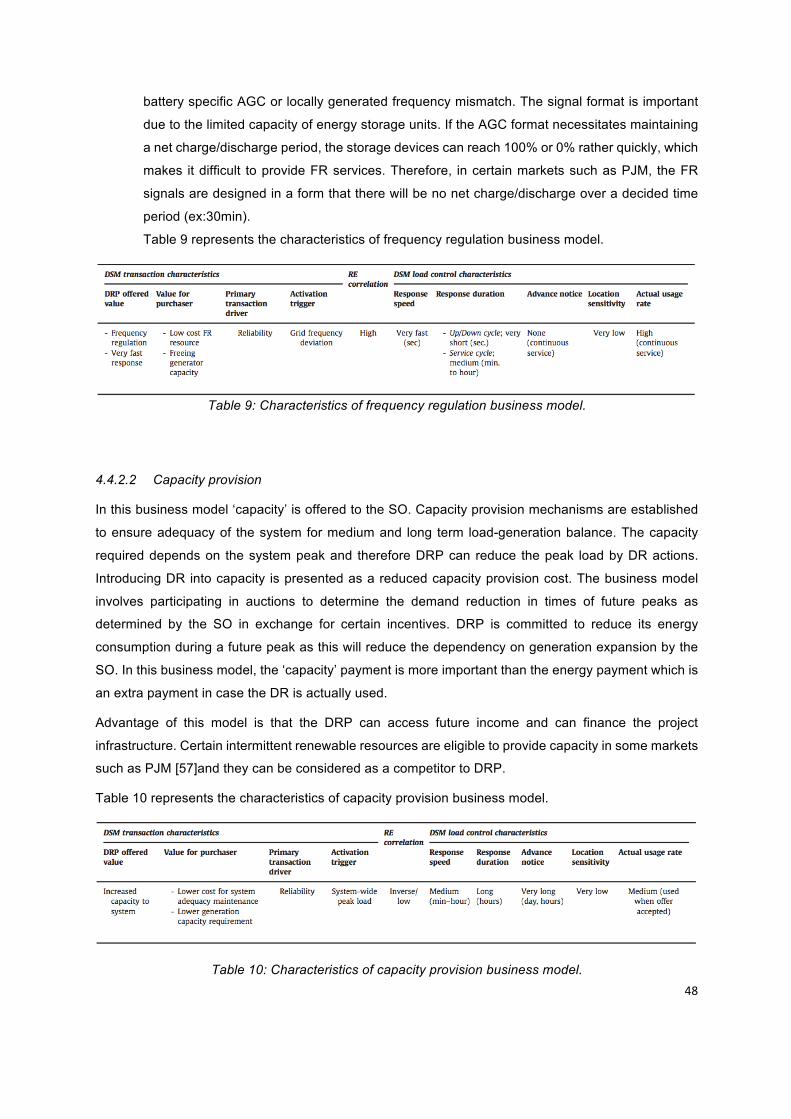
48
battery specific AGC or locally generated frequency mismatch. The signal format is important
due to the limited capacity of energy storage units. If the AGC format necessitates maintaining
a net charge/discharge period, the storage devices can reach 100% or 0% rather quickly, which
makes it difficult to provide FR services. Therefore, in certain markets such as PJM, the FR
signals are designed in a form that there will be no net charge/discharge over a decided time
period (ex:30min).
Table 9 represents the characteristics of frequency regulation business model.
Table 9: Characteristics of frequency regulation business model.
4.4.2.2 Capacity provision
In this business model ‘capacity’ is offered to the SO. Capacity provision mechanisms are established
to ensure adequacy of the system for medium and long term load-generation balance. The capacity
required depends on the system peak and therefore DRP can reduce the peak load by DR actions.
Introducing DR into capacity is presented as a reduced capacity provision cost. The business model
involves participating in auctions to determine the demand reduction in times of future peaks as
determined by the SO in exchange for certain incentives. DRP is committed to reduce its energy
consumption during a future peak as this will reduce the dependency on generation expansion by the
SO. In this business model, the ‘capacity’ payment is more important than the energy payment which is
an extra payment in case the DR is actually used.
Advantage of this model is that the DRP can access future income and can finance the project
infrastructure. Certain intermittent renewable resources are eligible to provide capacity in some markets
such as PJM [57]and they can be considered as a competitor to DRP.
Table 10 represents the characteristics of capacity provision business model.
Table 10: Characteristics of capacity provision business model.
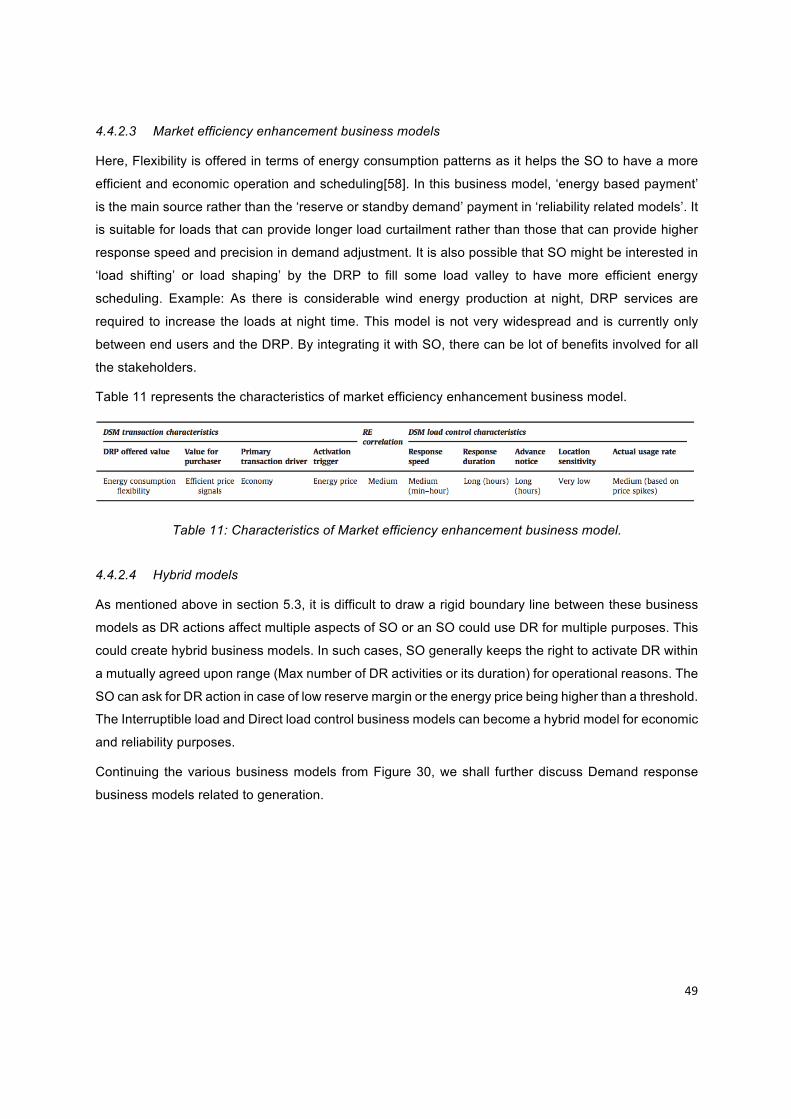
49
4.4.2.3 Market efficiency enhancement business models
Here, Flexibility is offered in terms of energy consumption patterns as it helps the SO to have a more
efficient and economic operation and scheduling[58]. In this business model, ‘energy based payment’
is the main source rather than the ‘reserve or standby demand’ payment in ‘reliability related models’. It
is suitable for loads that can provide longer load curtailment rather than those that can provide higher
response speed and precision in demand adjustment. It is also possible that SO might be interested in
‘load shifting’ or load shaping’ by the DRP to fill some load valley to have more efficient energy
scheduling. Example: As there is considerable wind energy production at night, DRP services are
required to increase the loads at night time. This model is not very widespread and is currently only
between end users and the DRP. By integrating it with SO, there can be lot of benefits involved for all
the stakeholders.
Table 11 represents the characteristics of market efficiency enhancement business model.
Table 11: Characteristics of Market efficiency enhancement business model.
4.4.2.4 Hybrid models
As mentioned above in section 5.3, it is difficult to draw a rigid boundary line between these business
models as DR actions affect multiple aspects of SO or an SO could use DR for multiple purposes. This
could create hybrid business models. In such cases, SO generally keeps the right to activate DR within
a mutually agreed upon range (Max number of DR activities or its duration) for operational reasons. The
SO can ask for DR action in case of low reserve margin or the energy price being higher than a threshold.
The Interruptible load and Direct load control business models can become a hybrid model for economic
and reliability purposes.
Continuing the various business models from Figure 30, we shall further discuss Demand response
business models related to generation.
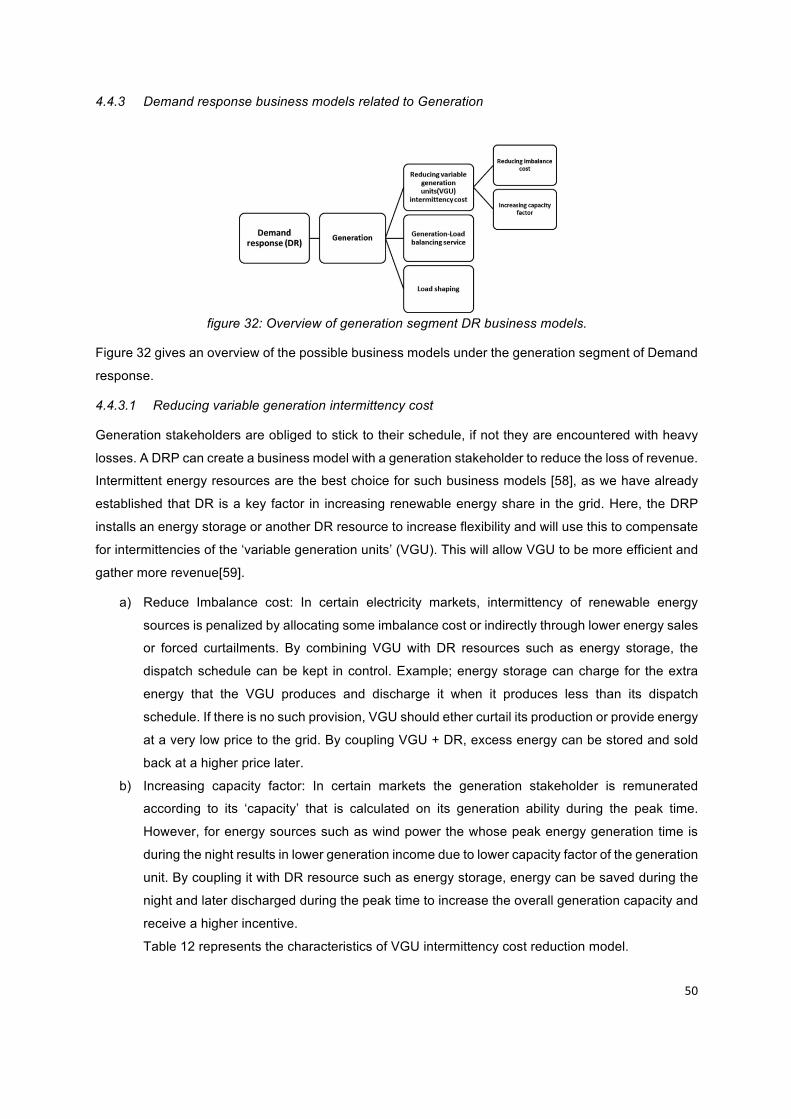
50
4.4.3 Demand response business models related to Generation
figure 32: Overview of generation segment DR business models.
Figure 32 gives an overview of the possible business models under the generation segment of Demand
response.
4.4.3.1 Reducing variable generation intermittency cost
Generation stakeholders are obliged to stick to their schedule, if not they are encountered with heavy
losses. A DRP can create a business model with a generation stakeholder to reduce the loss of revenue.
Intermittent energy resources are the best choice for such business models [58], as we have already
established that DR is a key factor in increasing renewable energy share in the grid. Here, the DRP
installs an energy storage or another DR resource to increase flexibility and will use this to compensate
for intermittencies of the ‘variable generation units’ (VGU). This will allow VGU to be more efficient and
gather more revenue[59].
a) Reduce Imbalance cost: In certain electricity markets, intermittency of renewable energy
sources is penalized by allocating some imbalance cost or indirectly through lower energy sales
or forced curtailments. By combining VGU with DR resources such as energy storage, the
dispatch schedule can be kept in control. Example; energy storage can charge for the extra
energy that the VGU produces and discharge it when it produces less than its dispatch
schedule. If there is no such provision, VGU should ether curtail its production or provide energy
at a very low price to the grid. By coupling VGU + DR, excess energy can be stored and sold
back at a higher price later.
b) Increasing capacity factor: In certain markets the generation stakeholder is remunerated
according to its ‘capacity’ that is calculated on its generation ability during the peak time.
However, for energy sources such as wind power the whose peak energy generation time is
during the night results in lower generation income due to lower capacity factor of the generation
unit. By coupling it with DR resource such as energy storage, energy can be saved during the
night and later discharged during the peak time to increase the overall generation capacity and
receive a higher incentive.
Table 12 represents the characteristics of VGU intermittency cost reduction model.
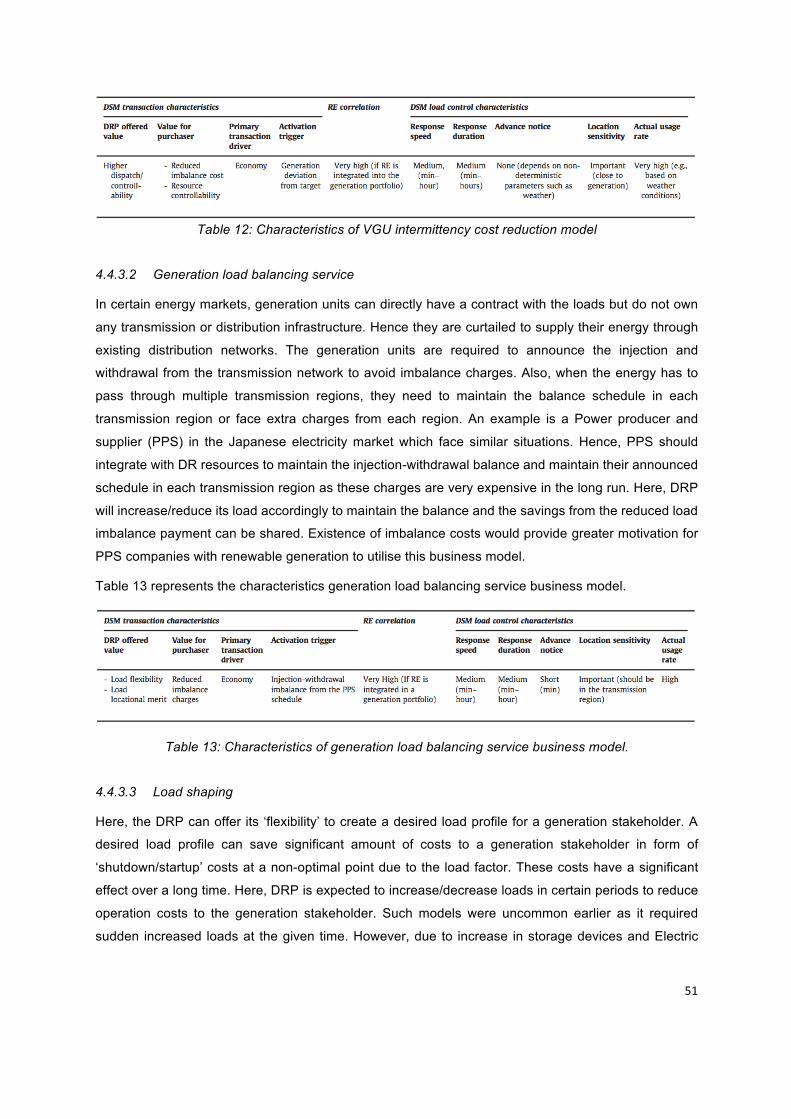
51
Table 12: Characteristics of VGU intermittency cost reduction model
4.4.3.2 Generation load balancing service
In certain energy markets, generation units can directly have a contract with the loads but do not own
any transmission or distribution infrastructure. Hence they are curtailed to supply their energy through
existing distribution networks. The generation units are required to announce the injection and
withdrawal from the transmission network to avoid imbalance charges. Also, when the energy has to
pass through multiple transmission regions, they need to maintain the balance schedule in each
transmission region or face extra charges from each region. An example is a Power producer and
supplier (PPS) in the Japanese electricity market which face similar situations. Hence, PPS should
integrate with DR resources to maintain the injection-withdrawal balance and maintain their announced
schedule in each transmission region as these charges are very expensive in the long run. Here, DRP
will increase/reduce its load accordingly to maintain the balance and the savings from the reduced load
imbalance payment can be shared. Existence of imbalance costs would provide greater motivation for
PPS companies with renewable generation to utilise this business model.
Table 13 represents the characteristics generation load balancing service business model.
Table 13: Characteristics of generation load balancing service business model.
4.4.3.3 Load shaping
Here, the DRP can offer its ‘flexibility’ to create a desired load profile for a generation stakeholder. A
desired load profile can save significant amount of costs to a generation stakeholder in form of
‘shutdown/startup’ costs at a non-optimal point due to the load factor. These costs have a significant
effect over a long time. Here, DRP is expected to increase/decrease loads in certain periods to reduce
operation costs to the generation stakeholder. Such models were uncommon earlier as it required
sudden increased loads at the given time. However, due to increase in storage devices and Electric
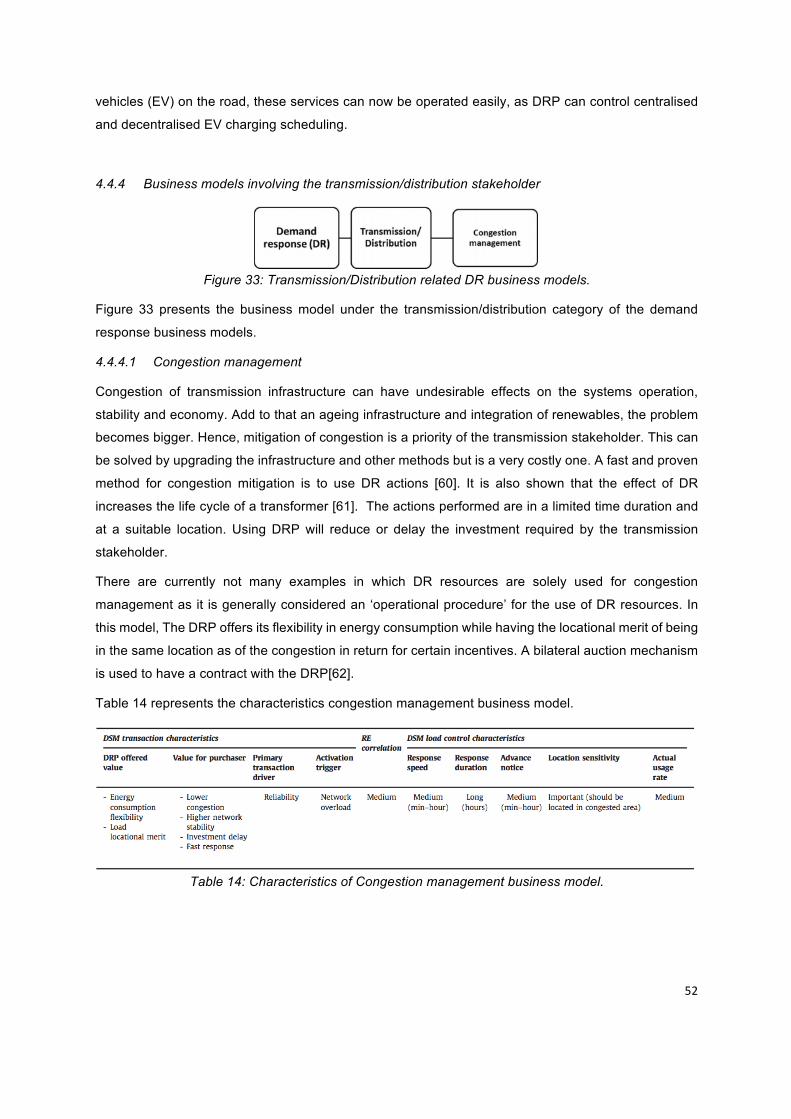
52
vehicles (EV) on the road, these services can now be operated easily, as DRP can control centralised
and decentralised EV charging scheduling.
4.4.4 Business models involving the transmission/distribution stakeholder
Figure 33: Transmission/Distribution related DR business models.
Figure 33 presents the business model under the transmission/distribution category of the demand
response business models.
4.4.4.1 Congestion management
Congestion of transmission infrastructure can have undesirable effects on the systems operation,
stability and economy. Add to that an ageing infrastructure and integration of renewables, the problem
becomes bigger. Hence, mitigation of congestion is a priority of the transmission stakeholder. This can
be solved by upgrading the infrastructure and other methods but is a very costly one. A fast and proven
method for congestion mitigation is to use DR actions [60]. It is also shown that the effect of DR
increases the life cycle of a transformer [61]. The actions performed are in a limited time duration and
at a suitable location. Using DRP will reduce or delay the investment required by the transmission
stakeholder.
There are currently not many examples in which DR resources are solely used for congestion
management as it is generally considered an ‘operational procedure’ for the use of DR resources. In
this model, The DRP offers its flexibility in energy consumption while having the locational merit of being
in the same location as of the congestion in return for certain incentives. A bilateral auction mechanism
is used to have a contract with the DRP[62].
Table 14 represents the characteristics congestion management business model.
Table 14: Characteristics of Congestion management business model.
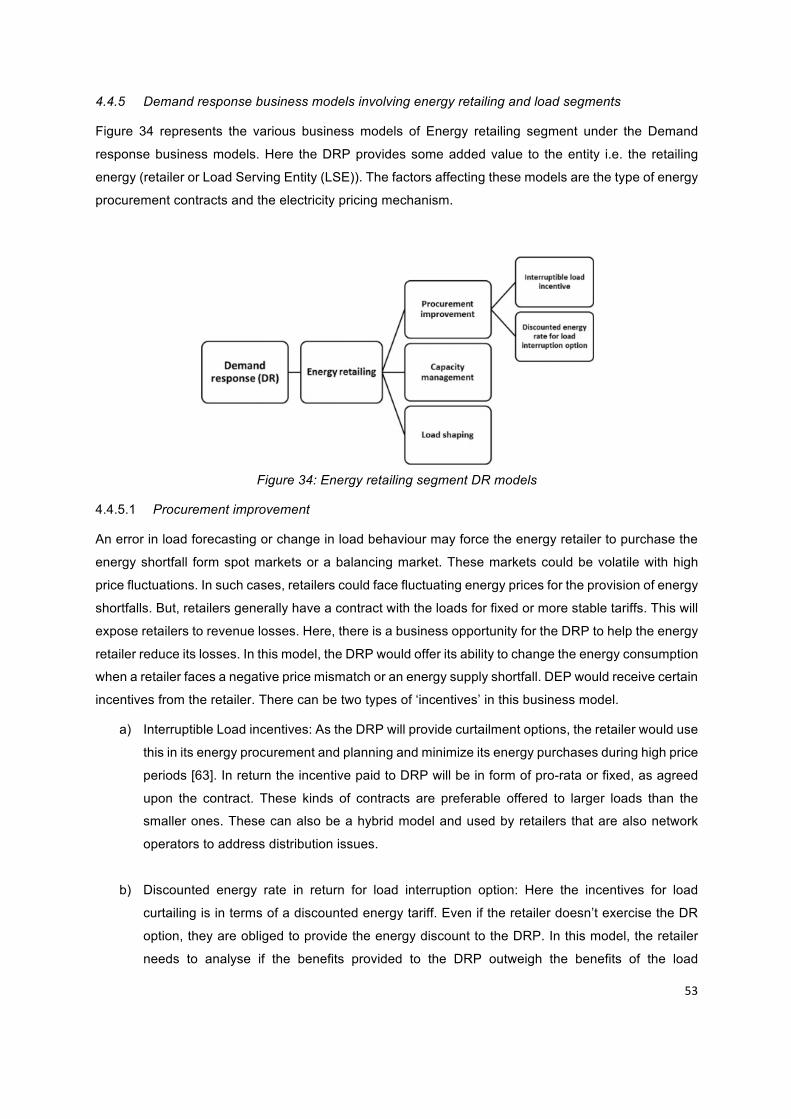
53
4.4.5 Demand response business models involving energy retailing and load segments
Figure 34 represents the various business models of Energy retailing segment under the Demand
response business models. Here the DRP provides some added value to the entity i.e. the retailing
energy (retailer or Load Serving Entity (LSE)). The factors affecting these models are the type of energy
procurement contracts and the electricity pricing mechanism.
Figure 34: Energy retailing segment DR models
4.4.5.1 Procurement improvement
An error in load forecasting or change in load behaviour may force the energy retailer to purchase the
energy shortfall form spot markets or a balancing market. These markets could be volatile with high
price fluctuations. In such cases, retailers could face fluctuating energy prices for the provision of energy
shortfalls. But, retailers generally have a contract with the loads for fixed or more stable tariffs. This will
expose retailers to revenue losses. Here, there is a business opportunity for the DRP to help the energy
retailer reduce its losses. In this model, the DRP would offer its ability to change the energy consumption
when a retailer faces a negative price mismatch or an energy supply shortfall. DEP would receive certain
incentives from the retailer. There can be two types of ‘incentives’ in this business model.
a) Interruptible Load incentives: As the DRP will provide curtailment options, the retailer would use
this in its energy procurement and planning and minimize its energy purchases during high price
periods [63]. In return the incentive paid to DRP will be in form of pro-rata or fixed, as agreed
upon the contract. These kinds of contracts are preferable offered to larger loads than the
smaller ones. These can also be a hybrid model and used by retailers that are also network
operators to address distribution issues.
b) Discounted energy rate in return for load interruption option: Here the incentives for load
curtailing is in terms of a discounted energy tariff. Even if the retailer doesn’t exercise the DR
option, they are obliged to provide the energy discount to the DRP. In this model, the retailer
needs to analyse if the benefits provided to the DRP outweigh the benefits of the load
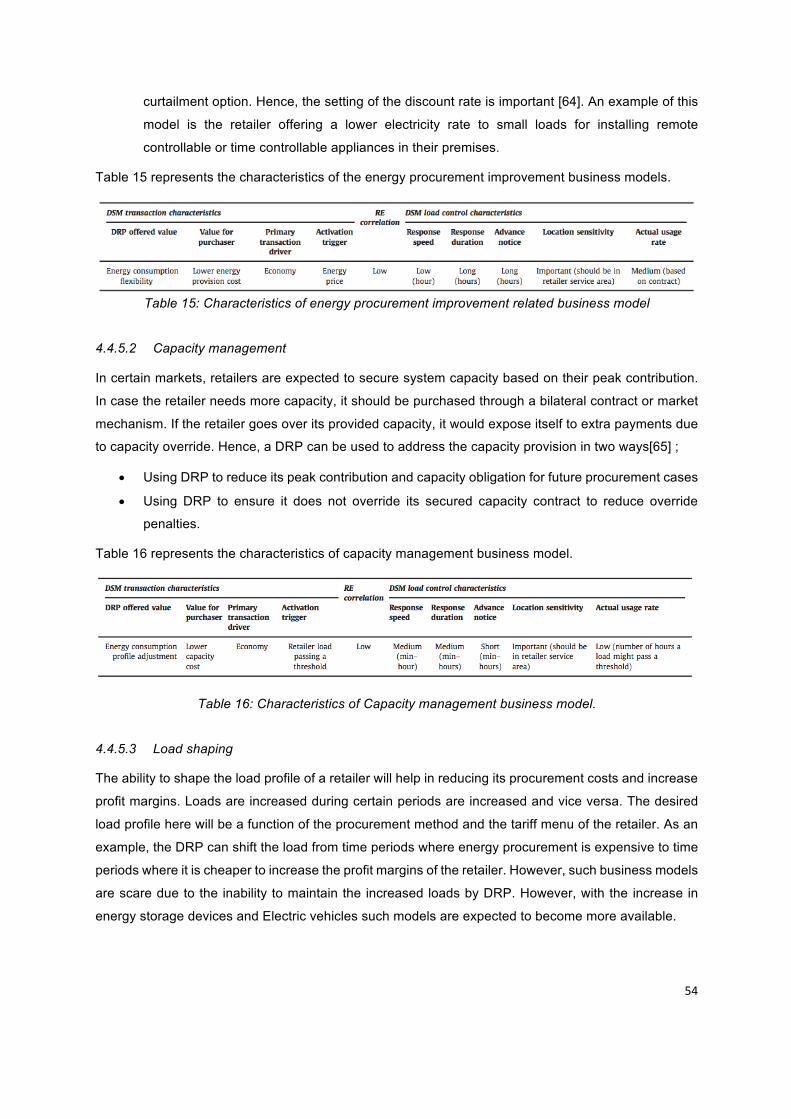
54
curtailment option. Hence, the setting of the discount rate is important [64]. An example of this
model is the retailer offering a lower electricity rate to small loads for installing remote
controllable or time controllable appliances in their premises.
Table 15 represents the characteristics of the energy procurement improvement business models.
Table 15: Characteristics of energy procurement improvement related business model
4.4.5.2 Capacity management
In certain markets, retailers are expected to secure system capacity based on their peak contribution.
In case the retailer needs more capacity, it should be purchased through a bilateral contract or market
mechanism. If the retailer goes over its provided capacity, it would expose itself to extra payments due
to capacity override. Hence, a DRP can be used to address the capacity provision in two ways[65] ;
• Using DRP to reduce its peak contribution and capacity obligation for future procurement cases
• Using DRP to ensure it does not override its secured capacity contract to reduce override
penalties.
Table 16 represents the characteristics of capacity management business model.
Table 16: Characteristics of Capacity management business model.
4.4.5.3 Load shaping
The ability to shape the load profile of a retailer will help in reducing its procurement costs and increase
profit margins. Loads are increased during certain periods are increased and vice versa. The desired
load profile here will be a function of the procurement method and the tariff menu of the retailer. As an
example, the DRP can shift the load from time periods where energy procurement is expensive to time
periods where it is cheaper to increase the profit margins of the retailer. However, such business models
are scare due to the inability to maintain the increased loads by DRP. However, with the increase in
energy storage devices and Electric vehicles such models are expected to become more available.
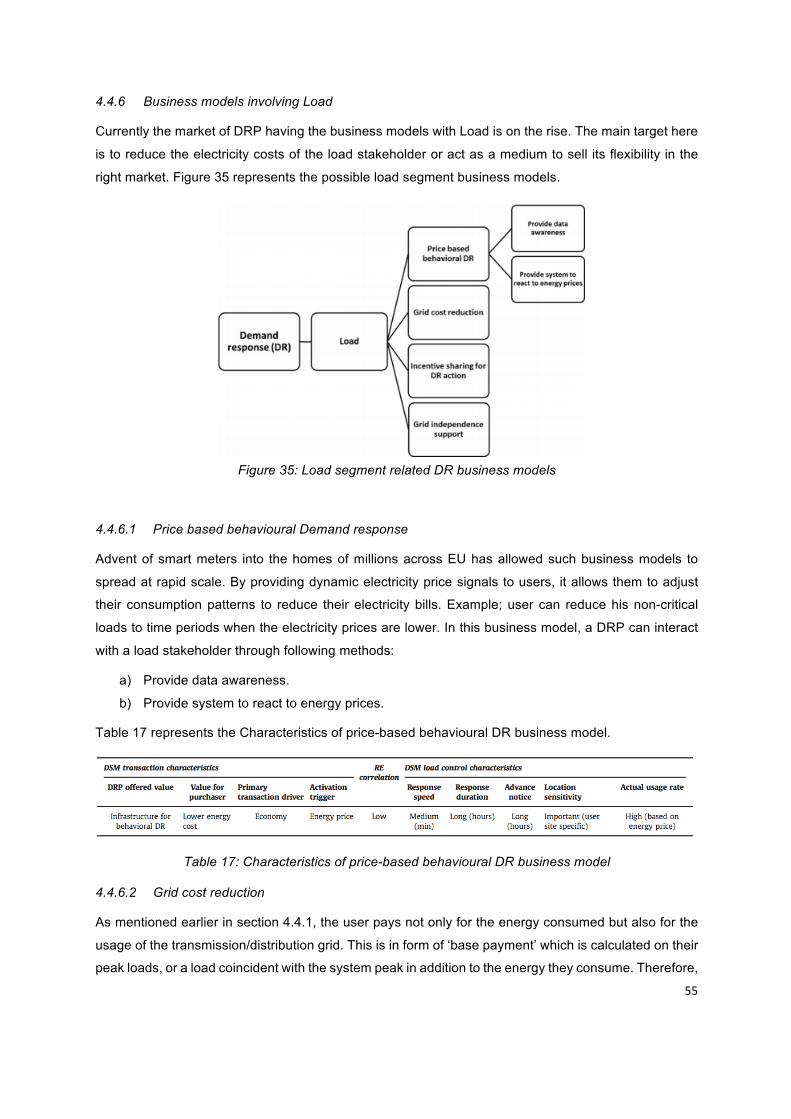
55
4.4.6 Business models involving Load
Currently the market of DRP having the business models with Load is on the rise. The main target here
is to reduce the electricity costs of the load stakeholder or act as a medium to sell its flexibility in the
right market. Figure 35 represents the possible load segment business models.
Figure 35: Load segment related DR business models
4.4.6.1 Price based behavioural Demand response
Advent of smart meters into the homes of millions across EU has allowed such business models to
spread at rapid scale. By providing dynamic electricity price signals to users, it allows them to adjust
their consumption patterns to reduce their electricity bills. Example; user can reduce his non-critical
loads to time periods when the electricity prices are lower. In this business model, a DRP can interact
with a load stakeholder through following methods:
a) Provide data awareness.
b) Provide system to react to energy prices.
Table 17 represents the Characteristics of price-based behavioural DR business model.
Table 17: Characteristics of price-based behavioural DR business model
4.4.6.2 Grid cost reduction
As mentioned earlier in section 4.4.1, the user pays not only for the energy consumed but also for the
usage of the transmission/distribution grid. This is in form of ‘base payment’ which is calculated on their
peak loads, or a load coincident with the system peak in addition to the energy they consume. Therefore,
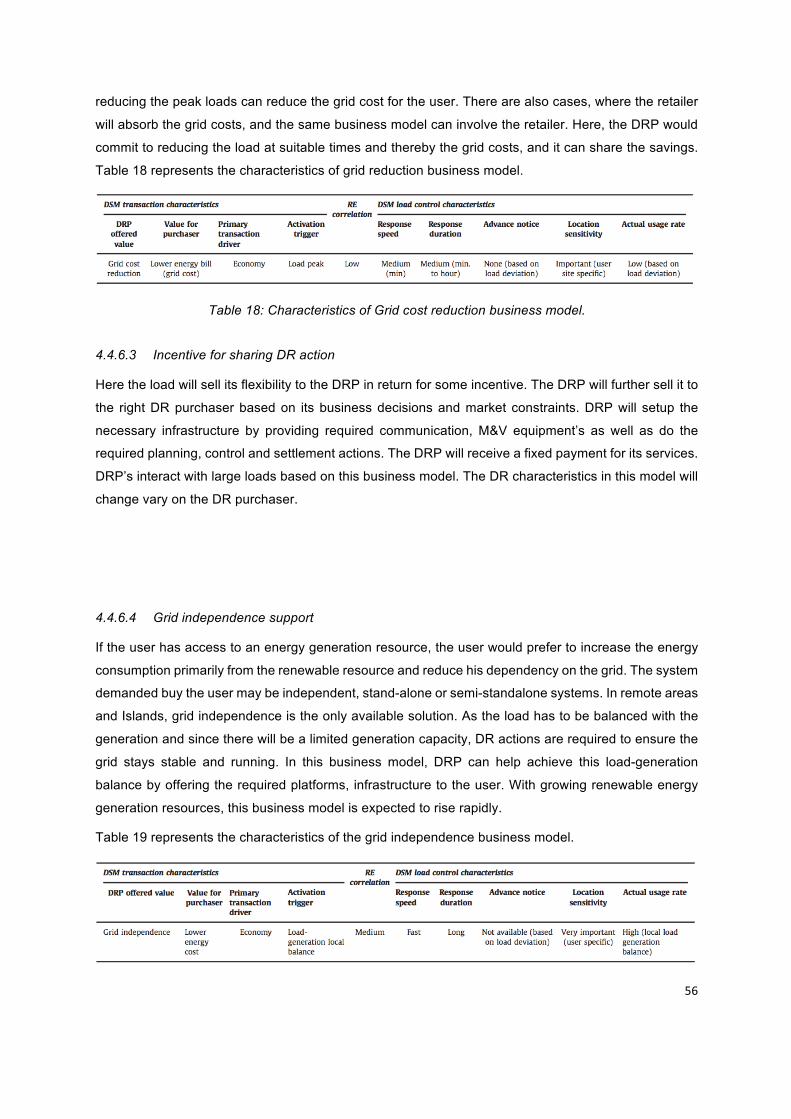
56
reducing the peak loads can reduce the grid cost for the user. There are also cases, where the retailer
will absorb the grid costs, and the same business model can involve the retailer. Here, the DRP would
commit to reducing the load at suitable times and thereby the grid costs, and it can share the savings.
Table 18 represents the characteristics of grid reduction business model.
Table 18: Characteristics of Grid cost reduction business model.
4.4.6.3 Incentive for sharing DR action
Here the load will sell its flexibility to the DRP in return for some incentive. The DRP will further sell it to
the right DR purchaser based on its business decisions and market constraints. DRP will setup the
necessary infrastructure by providing required communication, M&V equipment’s as well as do the
required planning, control and settlement actions. The DRP will receive a fixed payment for its services.
DRP’s interact with large loads based on this business model. The DR characteristics in this model will
change vary on the DR purchaser.
4.4.6.4 Grid independence support
If the user has access to an energy generation resource, the user would prefer to increase the energy
consumption primarily from the renewable resource and reduce his dependency on the grid. The system
demanded buy the user may be independent, stand-alone or semi-standalone systems. In remote areas
and Islands, grid independence is the only available solution. As the load has to be balanced with the
generation and since there will be a limited generation capacity, DR actions are required to ensure the
grid stays stable and running. In this business model, DRP can help achieve this load-generation
balance by offering the required platforms, infrastructure to the user. With growing renewable energy
generation resources, this business model is expected to rise rapidly.
Table 19 represents the characteristics of the grid independence business model.

57
Table 19: Characteristics of grid independence business model In this section, several possible business models for Demand side management (DSM) providers that
can be adopted relative to different electricity markets are discussed. As DSM resources are divided
into Energy efficiency (EE) and Demand response (DR) resources, the electricity market is segmented
into system operation, generation, transmission and distribution, retailing and load segments. It can be
seen that the DR has more business opportunities than EE. It is also observed that there are higher
number of business models involving the system operator segment or retailer/load segment than
generation/transmission segments. All these business models have a positive correlation with the
renewable energy penetration. Enervalis is currently offering DR services related to the load segment
and currently several of other projects have business models which are a mix of several mentioned
above
.

58
5. Competitor analysis The primary objective of competitor analysis to identify existing companies according to specific criteria
who could be potential competitors or future partners. A detailed comparison regarding the company
and their products/solutions was done with Enervalis to provide useful insights for its further
development. The competitive analysis was distributed among three market segments as described in
Section 3.1
5.1 Smart EV charging
In the following section, 8 companies were investigated. Detailed Product feature comparison and
Company comparison were accomplished and scored to generate a total competitive score.
5.1.1 Product feature comparison
In the Product feature comparison, the following parameters were taken into account:
• Hardware offering:
1. Capability to offer its own charging equipment. Provision of different charge poles depending
on the requirement such as Home charging, Public charging, Community charging etc.
2. Compatibility of the software with charge poles of other vendors. Also, to analyse if the
communication protocols used by the software are of current industry standards.
• EV driver features:
1. Find/Book charging station; Ability of the software to detect, and guide towards nearby
charging stations using real time availability data, considering user preferences.
2. Billing system; An automated billing service with clear indicators of tariff structures. Type of
unique user ID the service employees, such as; through smartphone, RFID cards, NFC chips
etc.
3. Driver support; Availability of a 24/7 customer support through call/mail actions.
• Charging station features:
1. Expandable with other systems; Integration of software with existing Building management
systems and to adapt with an existing virtual power plant. Provision to use the EV as an
energy storage, generation or a flexible consumption device.
2. End-to-end project development; includes analysing the right amount of equipment needed,
procuring, installation and maintenance for the customer. The charge poles could belong to
the project company or it could procure it from other vendors.
• Software offering:
1. Different charging strategies; Availability of different charging profiles; maximum green
consumption, reduction of total costs, maximum self-consumption, flexibility to DSO etc.
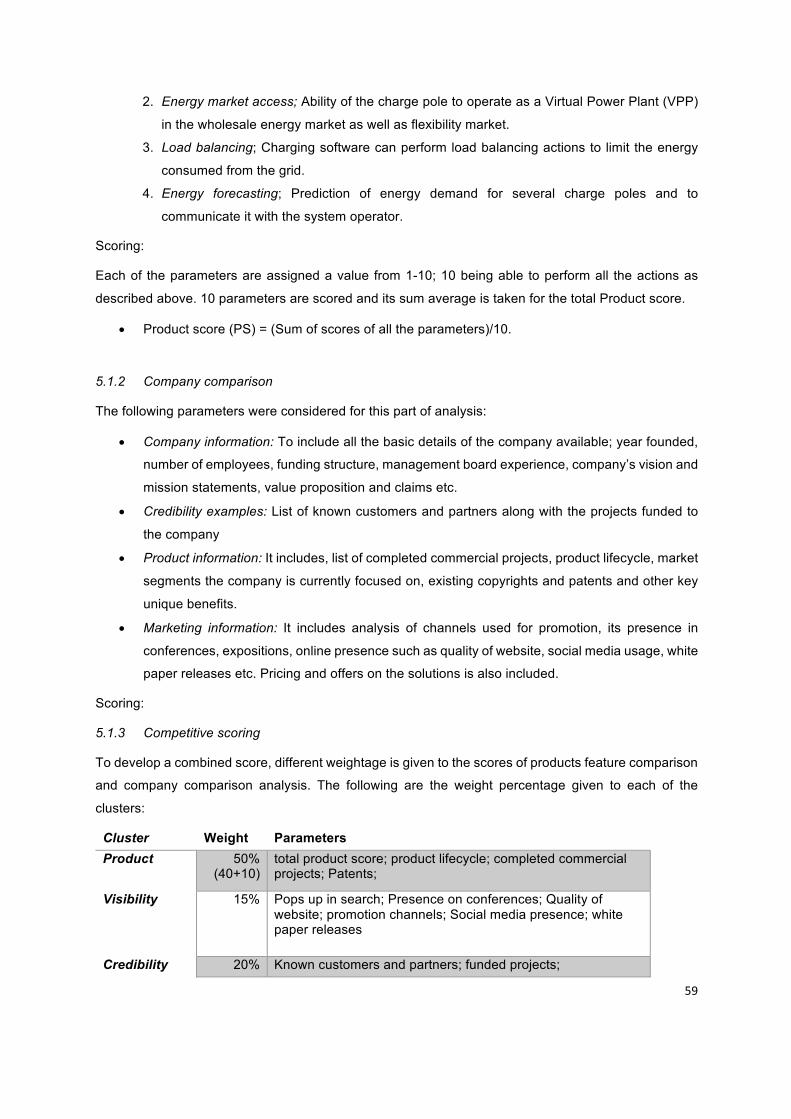
59
2. Energy market access; Ability of the charge pole to operate as a Virtual Power Plant (VPP)
in the wholesale energy market as well as flexibility market.
3. Load balancing; Charging software can perform load balancing actions to limit the energy
consumed from the grid.
4. Energy forecasting; Prediction of energy demand for several charge poles and to
communicate it with the system operator.
Scoring:
Each of the parameters are assigned a value from 1-10; 10 being able to perform all the actions as
described above. 10 parameters are scored and its sum average is taken for the total Product score.
• Product score (PS) = (Sum of scores of all the parameters)/10.
5.1.2 Company comparison
The following parameters were considered for this part of analysis:
• Company information: To include all the basic details of the company available; year founded,
number of employees, funding structure, management board experience, company’s vision and
mission statements, value proposition and claims etc.
• Credibility examples: List of known customers and partners along with the projects funded to
the company
• Product information: It includes, list of completed commercial projects, product lifecycle, market
segments the company is currently focused on, existing copyrights and patents and other key
unique benefits.
• Marketing information: It includes analysis of channels used for promotion, its presence in
conferences, expositions, online presence such as quality of website, social media usage, white
paper releases etc. Pricing and offers on the solutions is also included.
Scoring:
5.1.3 Competitive scoring
To develop a combined score, different weightage is given to the scores of products feature comparison
and company comparison analysis. The following are the weight percentage given to each of the
clusters:
Cluster Weight Parameters Product 50%
(40+10) total product score; product lifecycle; completed commercial projects; Patents;
Visibility 15% Pops up in search; Presence on conferences; Quality of website; promotion channels; Social media presence; white paper releases
Credibility 20% Known customers and partners; funded projects;
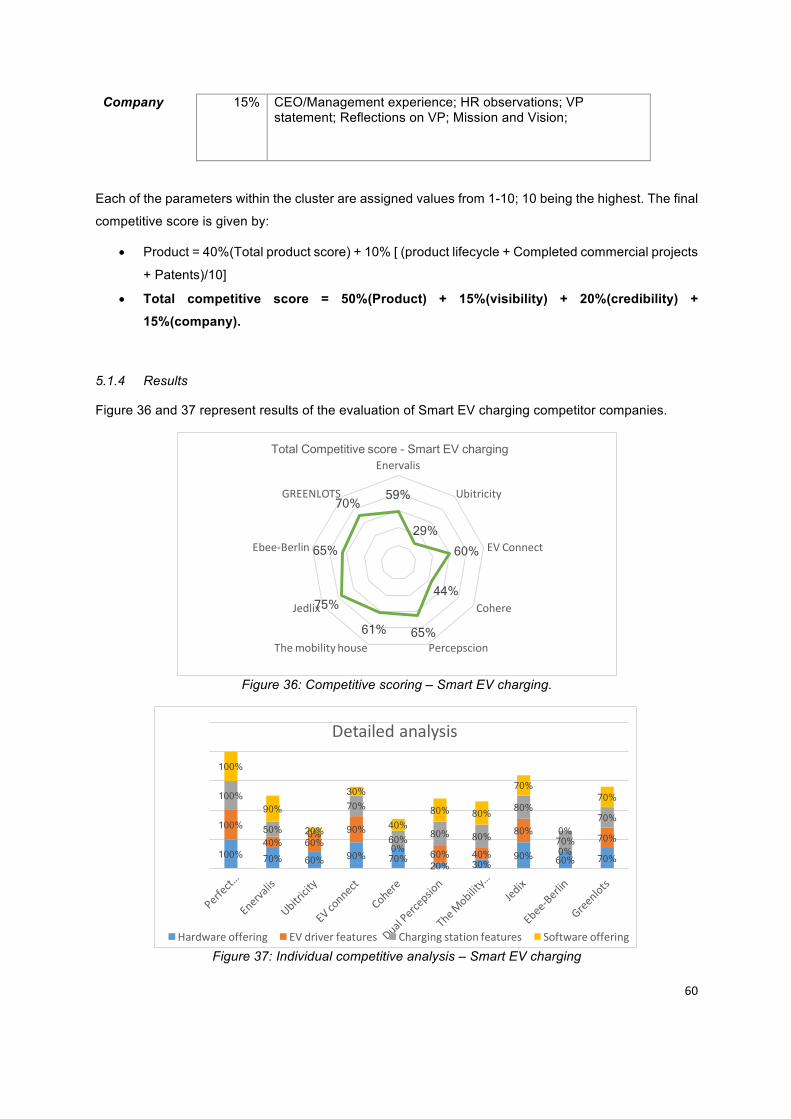
60
Company 15% CEO/Management experience; HR observations; VP statement; Reflections on VP; Mission and Vision;
Each of the parameters within the cluster are assigned values from 1-10; 10 being the highest. The final
competitive score is given by:
• Product = 40%(Total product score) + 10% [ (product lifecycle + Completed commercial projects
+ Patents)/10]
• Total competitive score = 50%(Product) + 15%(visibility) + 20%(credibility) + 15%(company).
5.1.4 Results
Figure 36 and 37 represent results of the evaluation of Smart EV charging competitor companies.
Figure 36: Competitive scoring – Smart EV charging.
Figure 37: Individual competitive analysis – Smart EV charging
59%
29% 60%
44%
65% 61%
75%
65%
70%
Enervalis
Ubitricity
EVConnect
Cohere
PercepscionThemobilityhouse
Jedlix
Ebee-Berlin
GREENLOTS
Total Competitive score - Smart EV charging
100% 70% 60% 90% 70% 20% 30%
90% 60% 70%
100%
40% 60% 90%
0% 60% 40%
80%
0% 70%
100%
50% 0%
70%
60% 80% 80%
80%
70%
70%
100%
90%
20%
30%
40% 80% 80%
70%
0%
70%
Detailedanalysis
Hardwareoffering EVdriverfeatures Chargingstationfeatures Softwareoffering
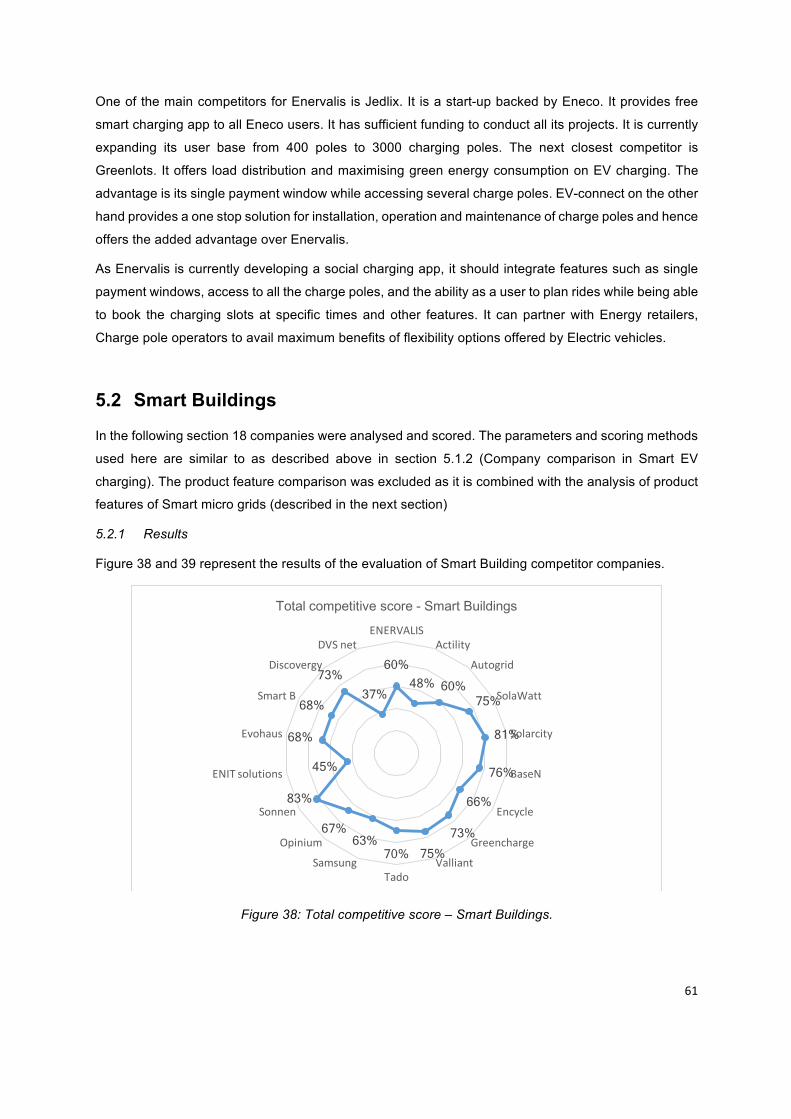
61
One of the main competitors for Enervalis is Jedlix. It is a start-up backed by Eneco. It provides free
smart charging app to all Eneco users. It has sufficient funding to conduct all its projects. It is currently
expanding its user base from 400 poles to 3000 charging poles. The next closest competitor is
Greenlots. It offers load distribution and maximising green energy consumption on EV charging. The
advantage is its single payment window while accessing several charge poles. EV-connect on the other
hand provides a one stop solution for installation, operation and maintenance of charge poles and hence
offers the added advantage over Enervalis.
As Enervalis is currently developing a social charging app, it should integrate features such as single
payment windows, access to all the charge poles, and the ability as a user to plan rides while being able
to book the charging slots at specific times and other features. It can partner with Energy retailers,
Charge pole operators to avail maximum benefits of flexibility options offered by Electric vehicles.
5.2 Smart Buildings
In the following section 18 companies were analysed and scored. The parameters and scoring methods
used here are similar to as described above in section 5.1.2 (Company comparison in Smart EV
charging). The product feature comparison was excluded as it is combined with the analysis of product
features of Smart micro grids (described in the next section)
5.2.1 Results
Figure 38 and 39 represent the results of the evaluation of Smart Building competitor companies.
Figure 38: Total competitive score – Smart Buildings.
60% 48% 60%
75%
81%
76%
66%
73% 75% 70%
63% 67%
83%
45%
68%
68%
73% 37%
ENERVALISActility
Autogrid
SolaWatt
Solarcity
BaseN
Encycle
Greencharge
ValliantTado
Samsung
Opinium
Sonnen
ENITsolutions
Evohaus
SmartB
Discovergy
DVSnet
Total competitive score - Smart Buildings
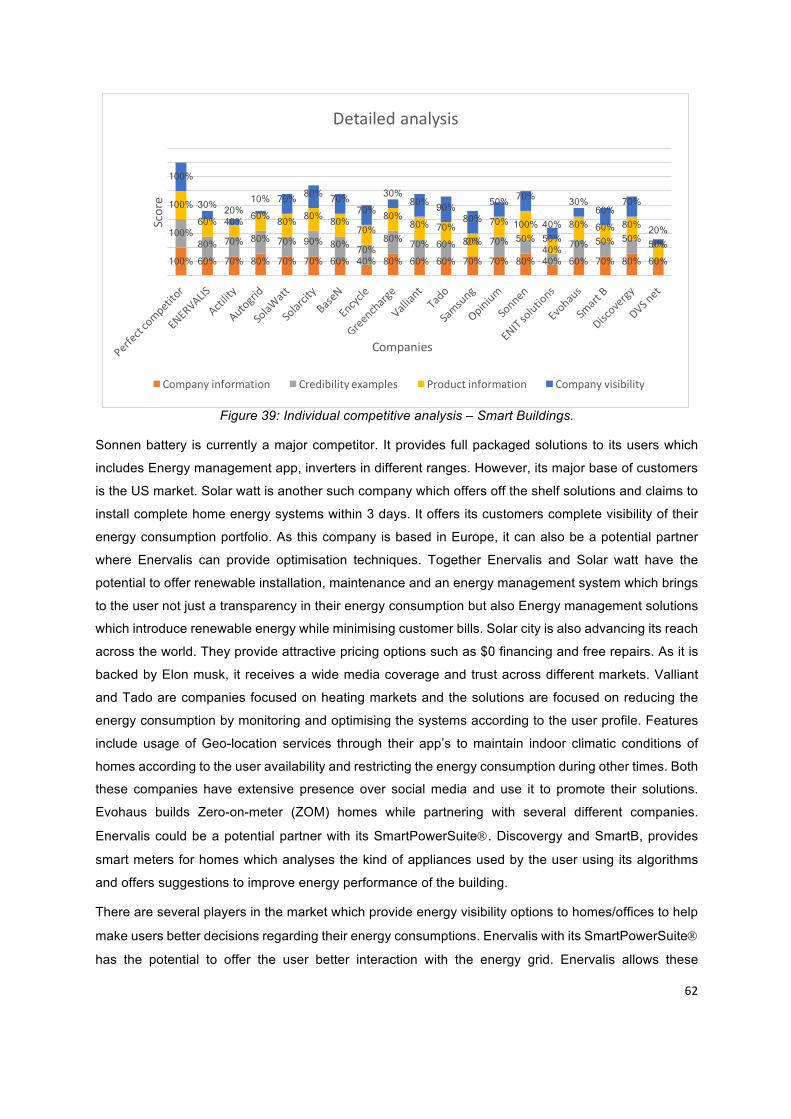
62
Figure 39: Individual competitive analysis – Smart Buildings.
Sonnen battery is currently a major competitor. It provides full packaged solutions to its users which
includes Energy management app, inverters in different ranges. However, its major base of customers
is the US market. Solar watt is another such company which offers off the shelf solutions and claims to
install complete home energy systems within 3 days. It offers its customers complete visibility of their
energy consumption portfolio. As this company is based in Europe, it can also be a potential partner
where Enervalis can provide optimisation techniques. Together Enervalis and Solar watt have the
potential to offer renewable installation, maintenance and an energy management system which brings
to the user not just a transparency in their energy consumption but also Energy management solutions
which introduce renewable energy while minimising customer bills. Solar city is also advancing its reach
across the world. They provide attractive pricing options such as $0 financing and free repairs. As it is
backed by Elon musk, it receives a wide media coverage and trust across different markets. Valliant
and Tado are companies focused on heating markets and the solutions are focused on reducing the
energy consumption by monitoring and optimising the systems according to the user profile. Features
include usage of Geo-location services through their app’s to maintain indoor climatic conditions of
homes according to the user availability and restricting the energy consumption during other times. Both
these companies have extensive presence over social media and use it to promote their solutions.
Evohaus builds Zero-on-meter (ZOM) homes while partnering with several different companies.
Enervalis could be a potential partner with its SmartPowerSuiteÒ. Discovergy and SmartB, provides
smart meters for homes which analyses the kind of appliances used by the user using its algorithms
and offers suggestions to improve energy performance of the building.
There are several players in the market which provide energy visibility options to homes/offices to help
make users better decisions regarding their energy consumptions. Enervalis with its SmartPowerSuiteÒ
has the potential to offer the user better interaction with the energy grid. Enervalis allows these
100% 60% 70% 80% 70% 70% 60% 40% 80% 60% 60% 70% 70% 80% 40% 60% 70% 80% 60%
100% 80% 70% 80% 70% 90% 80% 70%
80% 70% 60% 0% 70% 50% 40% 70% 50% 50% 0%
100% 60% 40% 60% 80% 80% 80%
70% 80%
80% 70% 80%
70% 100% 50%
80% 60% 80%
50%
100%
30% 20% 10% 70% 80% 70%
70% 30%
80% 90% 80%
50% 70%
40%
30% 60%
70%
20% Score
Companies
Detailedanalysis
Companyinformation Credibilityexamples Productinformation Companyvisibility
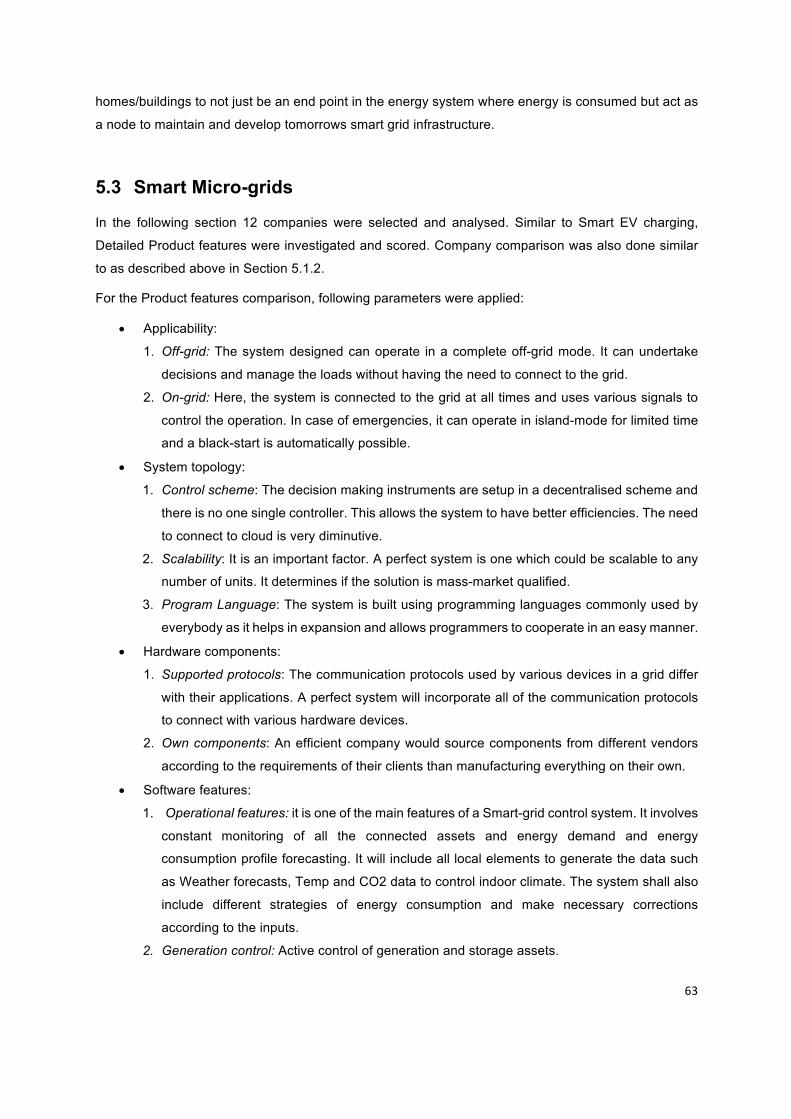
63
homes/buildings to not just be an end point in the energy system where energy is consumed but act as
a node to maintain and develop tomorrows smart grid infrastructure.
5.3 Smart Micro-grids
In the following section 12 companies were selected and analysed. Similar to Smart EV charging,
Detailed Product features were investigated and scored. Company comparison was also done similar
to as described above in Section 5.1.2.
For the Product features comparison, following parameters were applied:
• Applicability:
1. Off-grid: The system designed can operate in a complete off-grid mode. It can undertake
decisions and manage the loads without having the need to connect to the grid.
2. On-grid: Here, the system is connected to the grid at all times and uses various signals to
control the operation. In case of emergencies, it can operate in island-mode for limited time
and a black-start is automatically possible.
• System topology:
1. Control scheme: The decision making instruments are setup in a decentralised scheme and
there is no one single controller. This allows the system to have better efficiencies. The need
to connect to cloud is very diminutive.
2. Scalability: It is an important factor. A perfect system is one which could be scalable to any
number of units. It determines if the solution is mass-market qualified.
3. Program Language: The system is built using programming languages commonly used by
everybody as it helps in expansion and allows programmers to cooperate in an easy manner.
• Hardware components:
1. Supported protocols: The communication protocols used by various devices in a grid differ
with their applications. A perfect system will incorporate all of the communication protocols
to connect with various hardware devices.
2. Own components: An efficient company would source components from different vendors
according to the requirements of their clients than manufacturing everything on their own.
• Software features:
1. Operational features: it is one of the main features of a Smart-grid control system. It involves
constant monitoring of all the connected assets and energy demand and energy
consumption profile forecasting. It will include all local elements to generate the data such
as Weather forecasts, Temp and CO2 data to control indoor climate. The system shall also
include different strategies of energy consumption and make necessary corrections
according to the inputs.
2. Generation control: Active control of generation and storage assets.
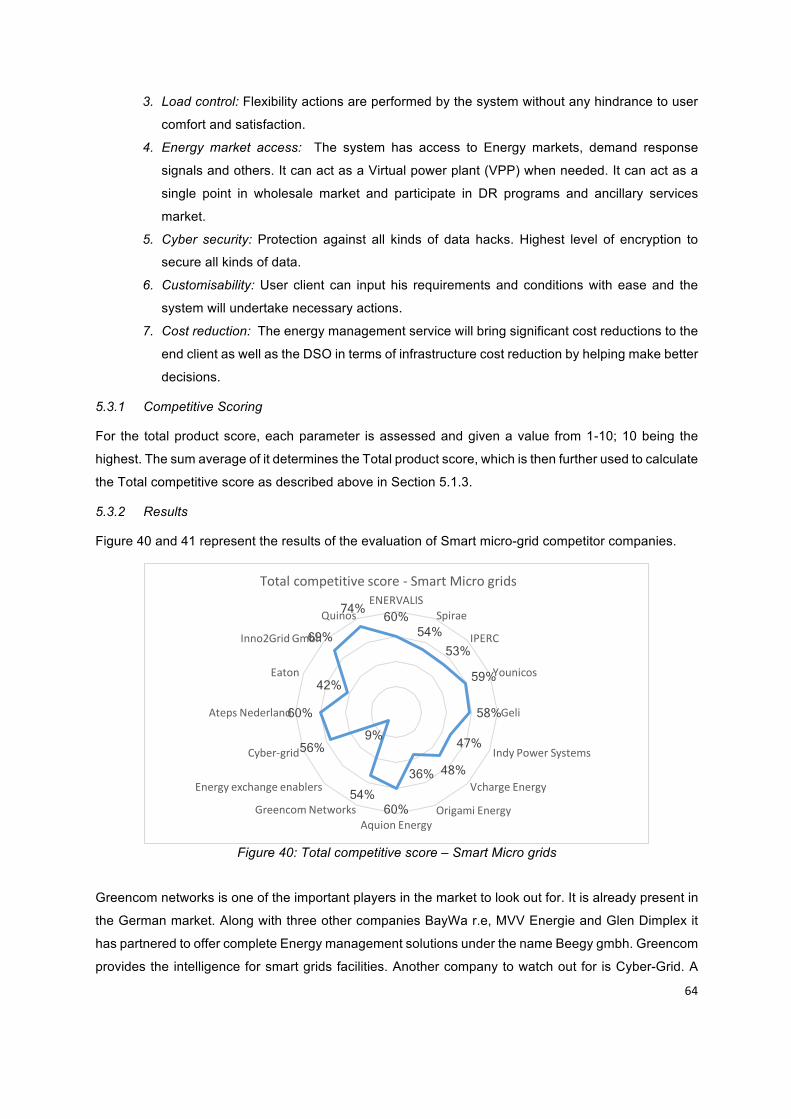
64
3. Load control: Flexibility actions are performed by the system without any hindrance to user
comfort and satisfaction.
4. Energy market access: The system has access to Energy markets, demand response
signals and others. It can act as a Virtual power plant (VPP) when needed. It can act as a
single point in wholesale market and participate in DR programs and ancillary services
market.
5. Cyber security: Protection against all kinds of data hacks. Highest level of encryption to
secure all kinds of data.
6. Customisability: User client can input his requirements and conditions with ease and the
system will undertake necessary actions.
7. Cost reduction: The energy management service will bring significant cost reductions to the
end client as well as the DSO in terms of infrastructure cost reduction by helping make better
decisions.
5.3.1 Competitive Scoring
For the total product score, each parameter is assessed and given a value from 1-10; 10 being the
highest. The sum average of it determines the Total product score, which is then further used to calculate
the Total competitive score as described above in Section 5.1.3.
5.3.2 Results
Figure 40 and 41 represent the results of the evaluation of Smart micro-grid competitor companies.
Figure 40: Total competitive score – Smart Micro grids
Greencom networks is one of the important players in the market to look out for. It is already present in
the German market. Along with three other companies BayWa r.e, MVV Energie and Glen Dimplex it
has partnered to offer complete Energy management solutions under the name Beegy gmbh. Greencom
provides the intelligence for smart grids facilities. Another company to watch out for is Cyber-Grid. A
60% 54%
53%
59%
58%
47%
48% 36%
60% 54%
9% 56%
60%
42%
69%
74% ENERVALIS Spirae
IPERC
Younicos
Geli
IndyPowerSystems
VchargeEnergy
OrigamiEnergy AquionEnergy
GreencomNetworks
Energyexchangeenablers
Cyber-grid
AtepsNederland
Eaton
Inno2GridGmbh
Quinos
Totalcompetitivescore- SmartMicrogrids
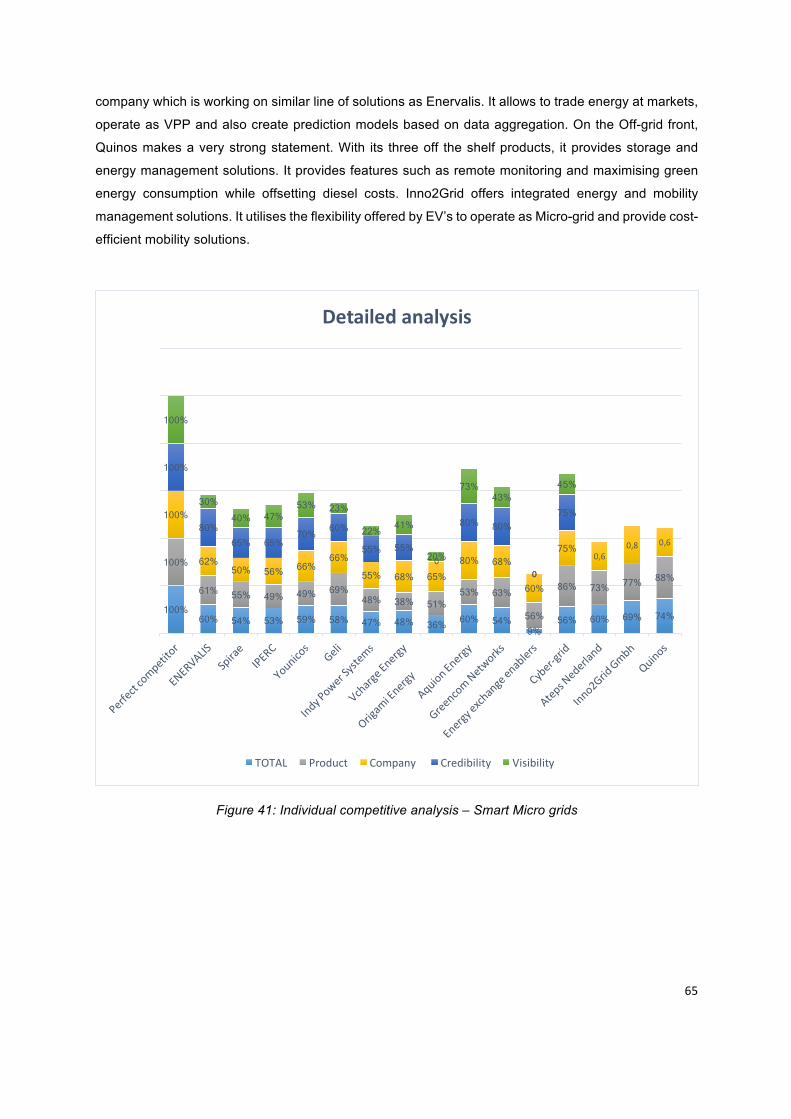
65
company which is working on similar line of solutions as Enervalis. It allows to trade energy at markets,
operate as VPP and also create prediction models based on data aggregation. On the Off-grid front,
Quinos makes a very strong statement. With its three off the shelf products, it provides storage and
energy management solutions. It provides features such as remote monitoring and maximising green
energy consumption while offsetting diesel costs. Inno2Grid offers integrated energy and mobility
management solutions. It utilises the flexibility offered by EV’s to operate as Micro-grid and provide cost-
efficient mobility solutions.
Figure 41: Individual competitive analysis – Smart Micro grids
100% 60% 54% 53% 59% 58% 47% 48% 36% 60% 54%
9% 56% 60% 69% 74%
100%
61% 55% 49% 49% 69% 48% 38% 51%
53% 63%
56%
86% 73% 77% 88%
100%
62% 50% 56% 66%
66%
55% 68% 65% 80% 68%
60%
75% 0,6
0,8 0,6
100%
80% 65% 65%
70% 60%
55% 55% 0
80% 80%
0
75%
100%
30% 40% 47%
53% 23%
22% 41%
20%
73% 43%
0
45%
Detailedanalysis
TOTAL Product Company Credibility Visibility
66
5.4 Tools to update competitor analysis
In today’s digital age, tracking a competitor is one of the key activities for a company. While developing
strategies of your own it is also important to keep an eye on upcoming companies, products and their
marketing strategies. There are several tools available online to assist in these tasks. A vast majority of
them help in comparing online traffic, referrals, visitor behaviour, keywords, search rankings, paid ads,
site by site social metrics and many more. These are classified as Marketing analysis. There also
competitor tools which assist in keeping an eye on upcoming companies, their funding structures etc.
These are classified as Market analysis.
In this section, we will be discussing several tools available online to support Enervalis by finding tools
for market analysis.
These tools help in discovering new companies to do businesses with, identify companies that are
moving quickly at the moment, find investors interested in your industry, understand your competitive
environment. A few of the tools available are discussed below along with their advantages and pricing
schemes.
1. Crunchbase.
Crunchbase allows users to discover industry trends, investments, acquisitions and news about
thousands of public and private companies globally. From start-ups to Fortune 500 companies,
Crunchbase provides in depth knowledge and its data is recognised as company intelligence.
It gives information on latest acquisitions, featured investments, Upcoming tech events tailored
to your industry.
There is a ‘free’ and a ‘pro’ version. The free version allows the user to manually track interested
companies and doesn’t offer customisation. The ‘pro’ version allows users to conduct dynamic
searches with multiple criteria’s, automated monitoring and email alerts, export results in CSV
format to conduct in-depth analysis, access trend lists quickly and etc. The pricing for ‘pro’
version is based at $29/month per user. Or $49/month for a team. It is billed annually. [66]
Crunchbase also provides extensive on-demand data updates, daily excel reports in CSV
format and real time access through their API. The search engine will curate information specific
to your demands and provide them at your behest. It provides access to its full database and
support to applications, automated marketing and prediction systems, data aggregation and
querying systems, sales prospect platforms, financial analysis tools and etc. It also provides a
dedicated client success manager and technical support. The pricing scheme for this service is
at $999/month.[67]

67
2. Startup Genome [68]
Startup Genome works together with Crunchbase and Global Entrepreneurship network that
provides information specifically targeted to Startup executives. It conducts its research on
10000+ start-ups annually. It has a network of leading para-governmental and private
organisations and is spread around six continents and more than 50 regions.
Its close ties with the above-mentioned companies and other selected accelerator programs
and other leading support organisations provide a collective understanding about startup
ecosystems. Startup Genome captures big data on the global startup ecosystem and pairs it
with quantifiable best practices for growth and success.
Currently the site is undergoing some changes and its pricing mechanisms could not be known.
3. CBInsights [69]
CBInsights aggregates and analyses big data and uses machine learning algorithms and data
visualisation to answer the following questions for the user:
• Which disruptive companies should we worry about?
• Which emerging trends could kill us?
• What new markets should we enter?
• What is our competitor's strategy?
• Who should we acquire?
• Who should we invest in?
• Who is our next customer?
• Who are the S&P 500 of tomorrow?
The company extracts information from patents, venture capital financings, M&A transactions, startup
and investor websites, news, social media and more. Their software analyses all the information to
provide information curated to the user.
The platforms provided are Reports and white paper, Blog, Webinars, Infographics and Podcasts. It
provides case studies of companies on demand. The functions of CBInsights is similar to Crunchbase
with added data visualisations. The various tools provided are: Training and support, syndicate
dashboard, Financing and exit data, Custom feeds, Funding flash, Chrome extension, Google apps
extension, Reminders, Bulk search, Alerts, rankings, Industry analytics, Customised search output,
Private list analytics, Private list collaboration, Newstand, Business Social graph, Company comparison
tool, Performance metrics, Technology stack analysis, Portfolio momentum dashboard, Board charts,
custom charts, Trends, Market mosaic, Mosaic ratings and more. The pricing schemes vary on the
amount of tools given access to. The different prices are given in the figure 42.

68
Figure 42: Pricing schemes of CBInsights.
4. Dealroom [70]
Dealroom provides a 360-degree view on technology landscape in Europe and beyond. It
provides rich data, analytics and forward looking insights about companies, investment
opportunities and market intelligence. It tracks currently 500,000 companies and nearly 10,000
investors from early stages to buyout, the data is gathered from multiple sources and is broken
down into four categories:
• User generated: Data crowdsourced from tens of thousands of contributors. These include
founders, VC’s, accelerators, governments, tech journalists etc.
• Automated: Data curated from social media, curated media, analytics providers, their own web
crawlers and etc.
• Manual curation: Data checked, curated, maintained by internal research team.
• Machine learning: Proprietary algorithms learns from inputs made by users and data analysts
team. The algorithms are applied to the set of ‘below the radar’ companies to predict activities
and growth. Machine learning is also used to identify new business categories.
It provides data access to its database of nearly 10,000+ investment funds, corporate angels
and investors. The pricing schemes are shown in the figure 43:
Figure 43: Pricing schemes of Dealroom.

69
Rise in Big data analytics has given rise to numerous companies which assist various companies on
information, trends, market overviews and various other factors. The pricing mechanisms usually vary
from $10000-$15000/annum for full range of services.
70
6. Conclusions and Recommendations
As we are moving towards integration of Renewable energy as our primary energy generation sources,
we have established the need for Smart grids in the second chapter. It needs to handle two way
interactions and hence the transition from fossil fuels to renewable needs to be carried out efficiently
and in a smart manner. The grids need to evolve and so does our technology.
To establish the smart grids of tomorrow, we need smarter technologies; devices which communicate
with each other. The importance of communication protocols has been established in the section 2.2.
Energy storage systems are needed to backup during critical times and the growth of Electric vehicles
has prompted industries to consider the huge potential of solutions they can offer to various stakeholders
of the grid. Enervalis as an energy management service will need to work with several of these stakeholders together to provide insights into the range of benefits an intelligent grid can offer.
A Business Model Canvas was used to analyse the key components of the company and determine its
strengths and weaknesses using a SWOT analysis. It was concluded that Enervalis is a value driven
company. The value proposition is unique and its solutions has the ability to cater to several
stakeholders while improving the grid. It was also its found out that different laws of the land are currently
delaying the entry of Enervalis into certain markets. However, as long as the European Union remains
one entity it is expected to receive support and direction with introduction of new legislations and
frameworks to bring their solutions to the forefront of energy markets.
Electricity prices and their components were discussed in detail in section 4.4.1. The role of network
tariffs in determining the success of Energy management companies has been realised. Capacity remuneration schemes of different countries have determined that the markets in Belgium, Ireland and France are supportive in terms of legal frameworks and public acceptance. The
incentives in Spanish market is comparatively lower but is expected to rise in the future given its rise in
share of renewables in the grid. Energy storage and aggregation techniques combined with wind and
solar are expected to provide the backbone for developing such solutions. In the Demand response market, Belgium, France, Finland, Sweden and UK provide maximum support to DRP’s. Germany scored favourable in terms of program requirements whereas the consumer access is very limited and hence is termed nether favourable nor unfavourable currently.
It has been upheld that one business model does not fit the growth of Enervalis. It is a challenging
task to develop business opportunities for sustainable growth of energy management services. Hence,

71
various business models for Demand response services in relation with System operator, Generation,
Transmission and Distribution, Energy retailing and Loads were discussed in detail. The number of
business models possible with a SO are higher than any other segments. With an SO, Enervalis can participate in ancillary market services offering flexibility of Electric vehicles or aggregated loads. This business model also provides DRP the freedom to choose its own time periods in advance.
There are also other business models possible where the load control and frequency control services
are offered to the SO. By offering these services, Enervalis can help SO make better decisions and save
costs in the long run. It is noted that the primary motive for the SO is the reliability DRP provides during
various situations and Enervalis can capitalise on the requirements of the industry. For transmission and distribution segment Enervalis can provide services such as congestion management to protect the grid from overloading. Using Energy generation and consumption forecasting, it can
advise energy retailers in making smart decisions regarding energy procurement. Enervalis can
provide its energy consumption flexibility to reduce the peak prices and fluctuations in the energy market
and reduce costs incurred by several segments of the grid. Enervalis currently participates with the end
users directly to minimize their electricity costs while increasing the overall performance efficiency of
their loads.
However, to proceed, further research is needed to look into the structure of electricity markets of individual countries to determine which of these business models can be applied. It can be
started with the markets where the remunerations for capacity pricing and DR actions are higher as
concluded in Section 4.4.2. A detailed study on each individual market is necessary to build the
roadmap for attaining economic feasibility of the company
In section 5, competitor analysis of several companies was performed. Product feature comparison and
company analysis were carried out to determine the competitive score of each of them and compared
with the score of Enervalis. It was found out that there are several service companies on the block who
have initiated the participation of the end user in the system by bringing transparency in their energy
consumption patterns by offering smart metering services and analysing the user loads. However,
Enervalis with its SmartPowerSuiteÒ can further offer optimising solutions to these companies and
further increase its customer base. The results of the analysis helped in mapping the trends of industry
and evaluating different features that are prime factors for the success of particular solutions.
For a Smart EV charging market, several prime factors are determined such as Single payment window, options to plan long distance rides with charging facilities as needed, ability to book charging spots in advance during such rides, real time monitoring etc. A platform to bring closer
EV users to fully extract the potential of EV charging network across Europe should incorporate all of
the above features. Enervalis can work with several charge pole vendors, energy retailers, communities

72
to offer Smart charging solutions. For Smart buildings/homes optimisation of performance efficiency
without compromising the user comfort is a challenge. Transparency into the actions is necessary to
keep the user updated about his energy consumption patterns, energy prices, while increasing self-
consumption and building roadmap to reduce his dependence on the grid. Enervalis can partner with construction companies who undertake construction/renovation of houses, office spaces and etc. to integrate renewable energy for future cost savings. The above solutions can be implemented
together in housing communities to create micro grids where the SmartPowerSuiteÒ will provide access
to energy market to offer flexibility. By using energy storage technologies, Enervalis can help mitigate
excess energy to the times during peak loads or direct it towards the grid to avail feed-in tariff benefits.
The Portal (Section 3.3) provides detailed data visualisations to the customer. The Portal has a tremendous potential and should be used extensively to promote the benefits of
SmartPowerSuiteÒ.
During the competitor analysis, the shortcomings of Enervalis were also spotted. A lack of online
presence and an absence of a product feature portfolio makes it difficult for future clients to access
information about SmartPowerSuiteÒ.
The competitor analysis needs to be updated constantly as several new companies are arising on the
block. There are several tools available online to help keep an eye on the industry and map out future
trends. However, the pricing of these services is at a higher range and currently the economic benefits
of availing these services are negligible.
To sum up, this thesis has attained its goal of conducting a case study of Enervalis and determining its
role in the market while analysing possible future sustainable business models. Competitor study was
also done to give an outlook of its competitors and map the industry trends. The success of Enervalis
depends on catering to the multiple services of different segments of the energy industry while building
the smart grid of tomorrow.
73
7. BIBLIOGRAPHY
[1] “Energy charting tool | BP Global.” [Online]. Available: http://tools.bp.com/energy-charting-
tool.aspx#/st/primary_energy/dt/consumption/unit/MTOE/view/column/.
[2] NGNP alliance, “Energy vs. Electricity and why we care | NGNP Alliance Blog.” [Online].
Available: http://blog.ngnpalliance.org/energy-vs-electricity-and-why-we-care/.
[3] British Petroleum, “BP Energy Outlook Country and regional insights – Global,” 2016. [Online].
Available: www.bp.com/energyoutlook. [Accessed: 02-Sep-2016].
[4] -Union of the Electricity Industry Eurelectric, “Power Distribution in Europe,” 2013.
[5] “What is a smart grid | ABB.” [Online]. Available: http://new.abb.com/smartgrids/what-is-a-smart-
grid.
[6] S. M. M. Amin and B. F. F. Wollenberg, “Toward a smart grid: power delivery for the 21st century,”
IEEE Power Energy Mag., vol. 3, no. 5, pp. 34–41, 2005.
[7] European commission., “Vision and Strategy for Europe’s Electricity Networks of the Future,” no.
Directorate-General for Research Sustainable Energy Systems, 2006.
[8] “Strategic Energy Technology Plan - European Commission.” [Online]. Available:
https://ec.europa.eu/energy/en/topics/technology-and-innovation/strategic-energy-technology-
plan.
[9] G. Locke and P. D. Gallagher, “NIST Special Publication 1108 NIST Framework and Roadmap
for Smart Grid Interoperability Standards, Release 1.0 NIST Framework and Roadmap for Smart
Grid Interoperability Standards, Release 1.0,” 2010.
[10] “Energy Security Strategy - European Commission.” [Online]. Available:
http://ec.europa.eu/energy/en/topics/energy-strategy/energy-security-strategy.
[11] F. A. Farret, M. Godoy, and S. Es, “INTEGRATION OF ALTERNATIVE SOURCES OF
ENERGY.”
[12] M. G. Simões, R. Roche, E. Kyriakides, A. Miraoui, B. Blunier, K. McBee, S. Suryanarayanan,
P. Nguyen, and P. Ribeiro, “Smart-grid technologies and progress in Europe and the USA,” IEEE
Energy Convers. Congr. Expo. Energy Convers. Innov. a Clean Energy Futur. ECCE 2011,
Proc., pp. 383–390, 2011.
[13] K. Visscher, “VSYNC The Virtual Synchronous Generator (VSG) concept Principle of a Virtual
Synchronous Generator Strategic objectives addressed.”
[14] R. Carnieletto, S. Suryanarayanan, M. G. Simões, and F. A. Farret, “A multifunctional single-
phase voltage source inverter in perspective of the Smart Grid Initiative,” Conf. Rec. - IAS Annu.
74
Meet. (IEEE Ind. Appl. Soc., pp. 2–8, 2009.
[15] IEEE standards association, IEEE 1547 Standard for Interconnecting Distributed Resources with
Electric Power Systems. .
[16] T. Ericsen, N. Hingorani, and Y. Khersonsky, “PEBB - Power electronics building blocks from
concept to reality,” in Record of Conference Papers - Annual Petroleum and Chemical Industry
Conference, 2006.
[17] A. R. Metke and R. L. Ekl, “Security technology for smart grid networks,” IEEE Trans. Smart Grid,
vol. 1, no. 1, pp. 99–107, 2010.
[18] A. H. Mohsenian-Rad and A. Leon-Garcia, “Optimal residential load control with price prediction
in real-time electricity pricing environments,” IEEE Trans. Smart Grid, vol. 1, no. 2, pp. 120–133,
2010.
[19] R. W. Uluski, “The role of Advanced Distribution Automation in the Smart Grid,” in Power and
Energy Society General Meeting, 2010 IEEE, 2010, pp. 1–5.
[20] S. M. Amin, “For the good of the grid,” IEEE Power Energy Mag., vol. 6, no. 6, pp. 48–59, 2008.
[21] S. Chakrabarti, E. Kyriakides, and D. G. Eliades, “Placement of synchronized measurements for
power system observability,” IEEE Trans. Power Deliv., vol. 24, no. 1, pp. 12–19, 2009.
[22] B. Betts, “Smart Sensors,” IEEE Spectr., vol. 43, no. 4, pp. 50–53, 2006.
[23] J. Do Kim, D. J. Kim, H. G. Byun, Y. K. Ham, W. S. Jung, D. W. Han, J. S. Park, and H. L. Lee,
“The definition of basic TEDS of IEEE 1451.4 for sensors for an electronic tongue and the
proposal of new template TEDS for electrochemical devices,” Talanta, vol. 71, no. 4, pp. 1642–
1651, 2007.
[24] Q. Zou and L. Qin, “Integrated communications in smart distribution grid,” in 2010 International
Conference on Power System Technology: Technological Innovations Making Power Grid
Smarter, POWERCON2010, 2010.
[25] ETP SmartGrids, European technology platform smart grids: vision and strategy for Europe’s
electricity networks of the future, vol. 19, no. 3. 2006.
[26] K. Koo, “The Era of Cyber Espionage & Cyber Warfare (Case Study: Stuxnet).”
[27] C. Thiel, J. Krause, and P. Dilara, “Electric vehicles in the EU from 2010 to 2014 - is full scale
commercialisation near?,” p. 36, 2015.
[28] P. Kadurek, C. Loakimidis, and P. Ferräo, “Electric vehicles and their impact to the electric grid
in isolated systems,” in POWERENG 2009 - 2nd International Conference on Power
Engineering, Energy and Electrical Drives Proceedings, 2009, pp. 49–54.
[29] “GSC3 - Global smart city and community coalition.” [Online]. Available:
https://www.gsc3.city/partners#smart-initiatives.
75
[30] “Glass and energy saving: Q&A on energy saving glazing solutions for a low carbon
economy.” [Online]. Available: http://www.glassforeurope.com/en/issues/faq.php.
[31] “Energy-efficient Buildings (EeB) - Research & Innovation - Key Enabling Technologies -
European Commission.” [Online]. Available:
http://ec.europa.eu/research/industrial_technologies/energy-efficient-buildings_en.html.
[32] “HORIZON 2020 -Work Programme 2016 -2017 ‘Secure, Clean and Efficient Energy.’”
[33] European commission., “EU LEGISLATION ON CLIMATE CHANGE Climate and energy
package.”
[34] D. Kolokotsa, D. Rovas, E. Kosmatopoulos, and K. Kalaitzakis, “A roadmap towards intelligent
net zero- and positive-energy buildings,” Solar Energy, vol. 85, no. 12. pp. 3067–3084, 2011.
[35] “REnnovates | a holistic systemic deep renovation concept.” [Online]. Available:
http://rennovates.eu/.
[36] “Enervalis proud to be part of an exciting next generation EU smartgrid project | Enervalis.”
[Online]. Available: http://www.enervalis.com/enervalis-proud-to-be-part-of-an-exciting-next-
generation-eu-smartgrid-project/.
[37] “Strategyzer | Business Model Canvas.” [Online]. Available:
http://businessmodelgeneration.com/canvas/bmc?_ga=1.221317916.522266209.1473772001.
[38] “REnnovates – a holistic systemic deep renovation concept.” [Online]. Available:
http://rennovates.eu/.
[39] “What is Horizon 2020? - European Commission.” [Online]. Available:
https://ec.europa.eu/programmes/horizon2020/en/what-horizon-2020.
[40] Accenture, “Stedin: Award Winning IT Platform Integration Leveraging SAP Technology,” 2014.
[41] “Eurostat - Supply of electricity - monthly data.” [Online]. Available:
http://appsso.eurostat.ec.europa.eu/nui/submitViewTableAction.do.
[42] European Commission, “Europe 2020: A European strategy for smart, sustainable and inclusive
growth,” in COM(2010) 2020, 2010, pp. 1–32.
[43] “Eurostat - Tables, Graphs and Maps Interface (TGM) table.” [Online]. Available:
http://ec.europa.eu/eurostat/tgm/table.do?tab=table&plugin=1&language=en&pcode=ten00117.
[44] P. Mandatova, M. Massimiano, D. Verreth, and C. Gonzalez, “Network tariff structure for smart
energy system,” Cired, no. May, 2014.
[45] Eurelectric, “RENEWABLE ENERGY AND SECURITY OF SUPPLY: FINDING MARKET
SOLUTION,” pp. 17–24, 2014.
[46] SEDC, “Mapping Demand Response in Europe Today,” 2014.
[47] Jan W. Bleyl-Androschin, Reinhard Ungerböck, and Grazer Energieagentur GmbH, “What is
76
Energy Contracting (ESCo services)? Concept, Definition, Two Basic Business Models.”
[48] S. K. Jason MacDonald,Peter Cappers,Duncan Callaway, “Demand Response Providing
Ancillary Services-A Comparison of Opportunities and Challenges in the US Wholesale
Markets,” no. Ernest orlando Lawrence Berkeley National Laboratory.
[49] P. Warren, “A review of demand-side management policy in the UK,” Renew. Sustain. Energy
Rev., vol. 29, pp. 941–951, 2014.
[50] O. Updated, “ERCOT Emergency Interruptible Load Service,” no. July, 2009.
[51] R. Walawalkar, S. Blumsack, J. Apt, and S. Fernands, “An economic welfare analysis of demand
response in the PJM electricity market,” Energy Policy, vol. 36, no. 10, pp. 3692–3702, 2008.
[52] P. Cappers, C. Goldman, and D. Kathan, “LBNL - Demand Response in U.S. Electricity Markets:
Empirical Evidence,” Energy, 2009.
[53] Q. Wu, P. Wang, and L. Goel, “Direct load control (DLC) considering nodal interrupted energy
assessment rate (NIEAR) in restructured power systems,” IEEE Trans. Power Syst., vol. 25, no.
3, pp. 1449–1456, 2010.
[54] “FPL | Business | OnCall Program.” [Online]. Available:
https://www.fpl.com/business/save/programs/oncall.html.
[55] “Load Shed Service for Imports (LSSi).” [Online]. Available:
http://www.aeso.ca/gridoperations/19611.html.
[56] B. J. Kirby, Frequency Regulation Basics and Trends, no. December. 2004.
[57] M. M. Nrel, “Why Are We Talking About Capacity Markets ? Outline • Overview of capacity and
why we are discussing capacity markets .,” 2011.
[58] J. Aghaei and M. I. Alizadeh, “Demand response in smart electricity grids equipped with
renewable energy sources: A review,” Renew. Sustain. Energy Rev., vol. 18, no. February 2013,
pp. 64–72, 2013.
[59] A. Sinha, R. N. Lahiri, D. Ghosh, A. Pradhan, S. Chowdhury, and S. P. Chowdhury, “Imbalance
cost hedging of wind generators in Europe using weather securities,” IEEE PES Gen. Meet. PES
2010, pp. 1–8, 2010.
[60] A. Yousefi, T. T. Nguyen, H. Zareipour, and O. P. Malik, “Congestion management using demand
response and FACTS devices,” Int. J. Electr. Power Energy Syst., vol. 37, no. 1, pp. 78–85,
2012.
[61] J. Jargstorf, K. Vanthournout, T. De Rybel, and D. Van Hertem, “Effect of Demand Response on
transformer lifetime expectation,” in IEEE PES Innovative Smart Grid Technologies Conference
Europe, 2012.
[62] L. A. Tuan, K. Bhattacharya, and J. Daalder, “Transmission congestion management in bilateral
77
markets: An interruptible load auction solution,” Electr. Power Syst. Res., vol. 74, no. 3, pp. 379–
389, 2005.
[63] M. Nazari and A. Akbari Foroud, “Optimal strategy planning for a retailer considering medium
and short-term decisions,” Int. J. Electr. Power Energy Syst., vol. 45, no. 1, pp. 107–116, 2013.
[64] T. Strauss, “Perspectives on interrruptible electric tariffs,” Util. Policy, vol. 4, no. 2, pp. 165–172,
1994.
[65] B. F. Hobbs, J. G. Inon, M.-C. H. M.-C. Hu, and S. E. Stoft, “Capacity markets: review and a
dynamic assessment of demand-curve approaches,” IEEE Power Eng. Soc. Gen. Meet. 2005,
pp. 1–9, 2005.
[66] “Crunchbase pro.” [Online]. Available: https://www.crunchbase.com/app/info/pro.
[67] “Crunchbase Data for Internal Use - Crunchbase.” [Online]. Available:
https://about.crunchbase.com/crunchbase-data-for-internal-use/.
[68] “Startup Genome.” [Online]. Available: http://startupgenome.com/.
[69] “About CB Insights.” [Online]. Available: https://www.cbinsights.com/about.
[70] “Dealroom.co – Europe’s go-to website to discover new tech companies and connect with the
right investors.” [Online]. Available: https://dealroom.co/about.
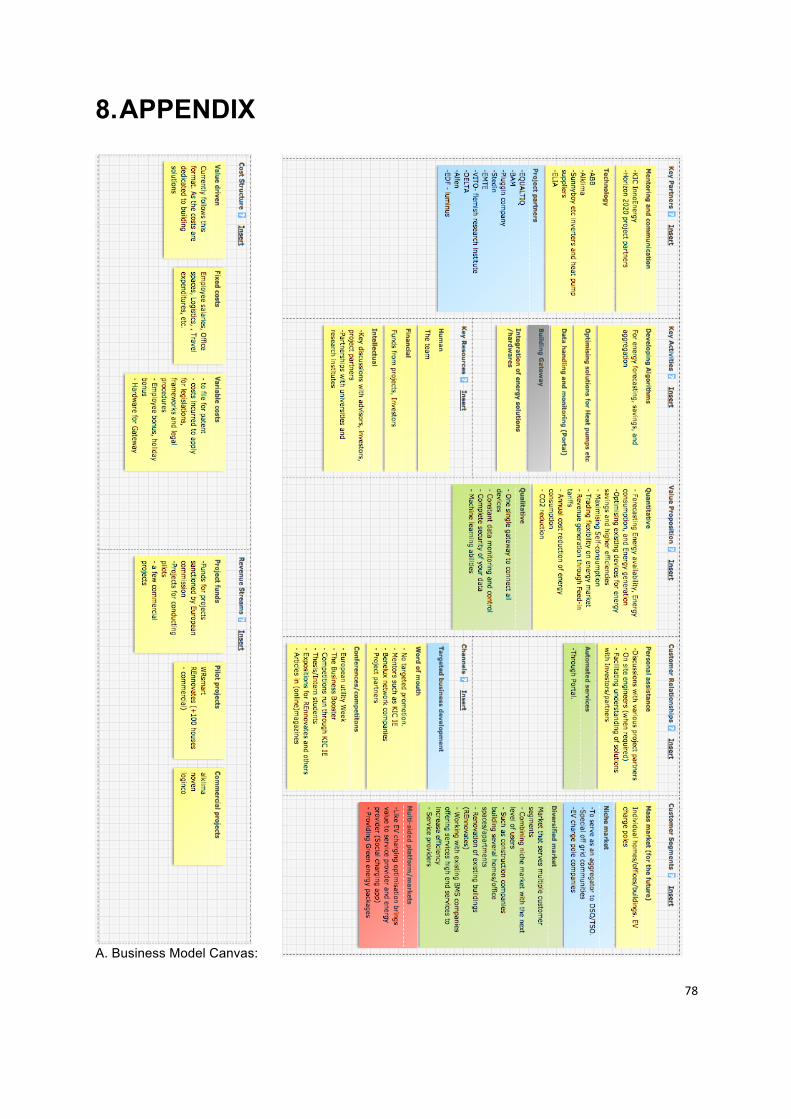
78
8. APPENDIX
A. Business Model Canvas: