Embed Size (px)
Citation preview
Abstract
The media and public frequently use the term “tornado alley,” an unofficial term which is used to describe various parts of the United States that are perceived to have a high incidence of tornado occurrence. This paper examined the history of the term “Tornado Alley,” as well as the lesser known term “Dixie Alley.” A basic statistical analysis of the temporal and spatial occurrence of tornadoes and tornado-related casualties was done in each of these areas, both long term and in the recent years following the modernization of the National Weather Service.
Corresponding Author: Alan GerardNational Weather Service
234 Weather Service DriveJackson, MS 39232
email: [email protected]
A HISTORICAL AND STATISTICAL COMPARISON OF "TORNADO ALLEY" TO "DIXIE ALLEY"
John P. GaganNational Weather Service
Springfield, Missouri
Alan GerardNational Weather Service
Jackson, Mississippi
John GordonNational Weather Service
Louisville, Kentucky
Gagan, et al.
146 National Weather Digest
1. History and Terminology
a. Tornado
Tornadoes are one of the most talked about weather phenomena and certainly one of the most destructive. The history of the word tornado took several twists before it landed with its current meaning in the United States. Ultimately, it comes from the Spanish word for thunderstorm, tronada, and then turned into ternado by English sailors in the 1500s to mean “a violent tropical storm.” In pop-culture, movies such as “The Wizard of Oz” in 1939, “Mr. and Mrs. Bridge” in 1990, and “Twister” in 1996 have certainly increased the public’s awareness. Public awareness has been fueled with impressive tornado videos, including a television crew hiding underneath a Kansas turnpike bridge on 26 April 1991, the 3 May 1999 video from the Moore, Oklahoma F5 tornado, and the 24 June 2003 National Geographic video from inside an F3 tornado near Manchester, South Dakota.
b. “Tornado Alley”
Many Americans are familiar with the widely used term “Tornado Alley.” Generally speaking, this is an area of the Great Plains and Midwest which is commonly thought of as the location for peak tornado occurrence in the United States. However, a less commonly known term is that of “Dixie Alley.” This generally refers to that part of the southeastern United States which is prone to tornado development. This manuscript will take an in depth look at the similarities and differences between “Tornado Alley” and “Dixie Alley.”
If you use any of the popular internet search engines and type in “tornado alley location”, you will come up with over 400,000 hits. Of the first 100 internet search results or so, the location for tornado alley varies greatly. Some of these include:
• “Region in the middle of the United States where more tornadoes occur than anywhere else in the world.”
• “Most tornadoes in the United States form in an area called ‘Tornado Alley.’ This area includes parts of Texas, Oklahoma, Kansas, and Nebraska.”
• “By most definitions, ‘Tornado Alley’ extends from north-central Texas through central Oklahoma, Kansas, and Nebraska into the Dakotas, the north-south line where moist and dry air collide time after time.”
• “The United States ‘Tornado Alley’ stretches from northwest Texas across Oklahoma and through northeast Kansas.”
• “States included in ‘Tornado Alley’ are Texas, Colorado, Kansas, Nebraska, Oklahoma, Arkansas, Illinois, Indiana, and Missouri.”
• “An L-shape region, which stretches from western Iowa down through Nebraska and Kansas to southern Oklahoma and then over Arkansas and Louisiana to southeastern Mississippi.”
Some publications that address “tornado alley” included:
• “The primary area of the U.S. in which significant tornadoes occur most often is in an L-shaped region from Iowa to Oklahoma to Mississippi, with the highest threat in Oklahoma.” (Concannon et al. 2000)
• “Texas, Oklahoma, Kansas, Nebraska, Iowa, Missouri, Arkansas, Louisiana were analyzed separately. This region essentially contains the proverbial ‘tornado alley’ where tornadoes are most prevalent.” (Schaefer and Tatom1999)
Historically, the term “Tornado Alley” has been used loosely, and the locations indicated are often based on personal perception rather than scientific data (Grazulis 1993). The authors personally spoke to Dr. Charles Doswell III and Dr. Howard Bluestein from the University of Oklahoma, Tom Grazulis from The Tornado Project, retired Storm Prediction Center (SPC) Director Dr. Joe Schaefer, retired SPC Science and Operations Officer Bob Johns, retired National Severe Storms Forecast Center (NSSFC) Director Fred Ostby, and former NSSFC Director Allen Pearson. Nobody could provide a definitive answer to the origin of “Tornado Alley.” Most of the aforementioned referenced Snoden Flora’s 1954 tornado climatology, although we could not locate a reference in Flora’s manuscript. The authors conducted a thorough literary search which entailed numerous papers from every decade from the 1950s through today. This included several papers from Snoden Flora, Dr. Theodore Fujita, and Dr. Howard Bluestein which offered no insights to definitive location or origin.
The only “tornado alley” reference that the authors could obtain was from an article in Take-off, the Tinker, OK Air Force Base (AFB) newspaper, which appeared on January 16, 1953 [Available online at: http://www.nssl.noaa.gov/GoldenAnniversary/awards.html]. The article stated: “On Feb 15, 1952, Fawbush and Miller set up a new project called, ‘Tornado Alley,’ in which a concentrated study of severe weather activity was made over an area extending from Lubbock, Texas to Eastern Colorado and Nebraska. This was done in stages, the first being from Lubbock, Texas to Enid, Oklahoma, and the second from Enid, Oklahoma to the Nebraska line.”
A Historical and Statistical Comparison of "Tornado Alley" to "Dixie Alley"
Volume 34 Number 2 ~ December 2010 147
c. “Dixie Alley”
Regarding the origin and location of “Dixie Alley,” the authors once again consulted those tornado experts previously cited, and researched numerous previous publications. Most experts referred the authors to Dr. Harold Brooks, but Dr. Brooks told us explicitly that he did not coin the phrase. The only source that knew the origin of “Dixie Alley” was former NSSFC Director Allen Pearson. Mr. Pearson explained that he personally coined the phrase after working the Mississippi Delta outbreak of 21 February 1971. This event had 10 long-track tornadoes that resulted in 121 deaths and over 1,500 injuries. Pearson compared that event with the Arkansas-Tennessee outbreak of 21-22 March 1952, where 28 tornadoes struck, killing over 200 people. Both events were in the south, and Pearson coined the phrase “Dixie Alley” in 1971. One of the few websites defining Dixie Alley was from an article in USA Today Weather [Available online at: http://www.usatoday.com/weather/tornado/storms/1999/ndstue09.htm] which stated: “A third tornado focus is the so-called ‘Dixie Alley’, which runs from northeast Texas to northern Alabama, then skips over the southern Appalachians and reforms in North Carolina.”
Since there was such limited formal documentation, it was difficult to compare the two tornado alleys. As Grazulis (1993) stated in Significant Tornadoes, 1680-1991 compendium, there is more than one tornado alley. “Any area that seems to experience above average tornado frequency is eventually labeled a ‘tornado alley.’ There are dozens of such regions.” There is also evidence of smaller tornado alleys across the United States based on a long track F3 to F5 tornado climatology study from 1880 to 2003 (Broyles and Crosbie 2004). This paper will bridge the gap between perception and reality by offering a basic statistical analysis of the frequency of tornadoes in the “Dixie Alley.” In an effort to support the validity of a “Dixie Alley,” these statistics will be compared to those from “Tornado Alley.”
2. Tornado Alley and Dixie Alley – A Historical Study
a. Background
The existence of “Tornado Alley” has been widely accepted by the meteorological community for decades, though as discussed in the introduction section, its exact spatial extent has had numerous interpretations. Without a definitive area to reference, the Tornado Alley referred to in this text should be considered the authors’ interpretation based on a collective of published
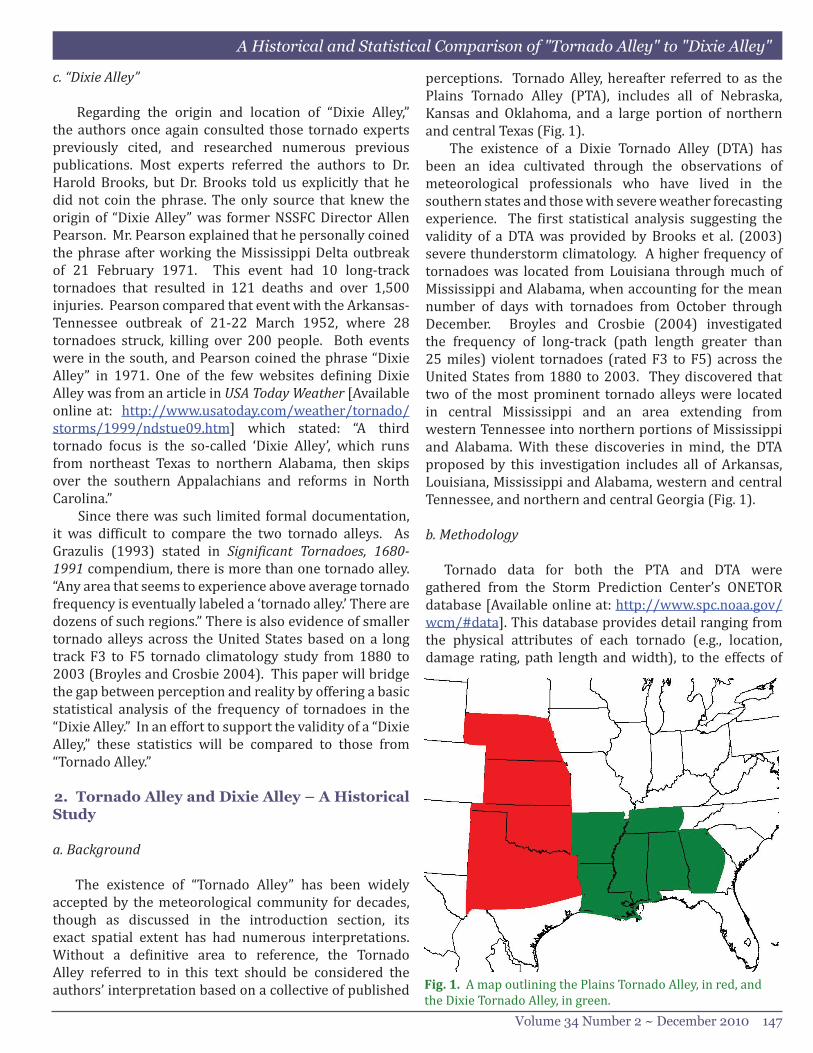
perceptions. Tornado Alley, hereafter referred to as the Plains Tornado Alley (PTA), includes all of Nebraska, Kansas and Oklahoma, and a large portion of northern and central Texas (Fig. 1).
The existence of a Dixie Tornado Alley (DTA) has been an idea cultivated through the observations of meteorological professionals who have lived in the southern states and those with severe weather forecasting experience. The first statistical analysis suggesting the validity of a DTA was provided by Brooks et al. (2003) severe thunderstorm climatology. A higher frequency of tornadoes was located from Louisiana through much of Mississippi and Alabama, when accounting for the mean number of days with tornadoes from October through December. Broyles and Crosbie (2004) investigated the frequency of long-track (path length greater than 25 miles) violent tornadoes (rated F3 to F5) across the United States from 1880 to 2003. They discovered that two of the most prominent tornado alleys were located in central Mississippi and an area extending from western Tennessee into northern portions of Mississippi and Alabama. With these discoveries in mind, the DTA proposed by this investigation includes all of Arkansas, Louisiana, Mississippi and Alabama, western and central Tennessee, and northern and central Georgia (Fig. 1).
b. Methodology
Tornado data for both the PTA and DTA were gathered from the Storm Prediction Center’s ONETOR database [Available online at: http://www.spc.noaa.gov/wcm/#data]. This database provides detail ranging from the physical attributes of each tornado (e.g., location, damage rating, path length and width), to the effects of
Fig. 1. A map outlining the Plains Tornado Alley, in red, and the Dixie Tornado Alley, in green.
Gagan, et al.
148 National Weather Digest
the tornado (e.g., injuries and fatalities). The ONETOR database was developed by counts of tornado records, not individual tornadoes [Available online at: http://www.spc.noaa.gov/wcm/SPC_severe_database_description.pdf] . A vast majority of the records within the database are counts of individual tornadoes; however, duplicate records for a tornado exist within the database when a tornado crosses one or more state lines. Therefore, in order to develop a data set of individual tornadoes, records within the ONETOR database were pared down to exclude duplicate counts of tornadoes. In addition, tornado segments outside of the boundaries of the PTA and DTA were excluded and tornadoes that moved from one alley to another were segmented into two separate events (one for each alley). For this study, reports of tornadoes from 1950 through 2007 were interrogated.
From this subset of the ONETOR database, raw tornado statistics for each alley were extracted, including the frequency of all tornadoes, the frequency of strong and violent tornadoes (F2/EF2 or greater on the Fujita Scale), the number of casualties, and the frequency of killer strong and violent tornadoes. In order to draw a more accurate one-to-one comparison of the DTA and the PTA, statistics have been normalized for both spatial area and population. The PTA spans 407,734 mi2, dwarfing the DTA, which covers 276,890 mi2. According to the 2000 United States Census [Available online at: http://quickfacts.census.gov/qfd/index.html, the population of the DTA was 24,948,345, while the population of the PTA was 17,824,023.
c. Comparison of the Dixie Tornado Alley and the Plains Tornado Alley
Without question, the PTA is second to none when it comes to overall tornado frequency. Over 13,500 tornadoes were reported in the PTA, with over 7500 tornadoes reported in the DTA. However, when considering strong and violent tornadoes (rated F2/EF2 to F5/EF5 on the Fujita scale), the annual frequency of tornadoes is much more comparable between alleys. Over 2850 strong and violent tornadoes were reported in the PTA, with a little over 2450 reported in the DTA. Normalizing these frequencies by area (10,000 mi2) produces similar results for the overall frequency of tornadoes. The normalized frequency of all tornadoes for the PTA outpaces that of the DTA, with 332 and 276 tornadoes per 10,000 mi2, respectively. For strong and violent tornadoes, however, the DTA has a higher frequency than the PTA, with 89 and 70 tornadoes per 10,000 mi2, respectively.
While both the PTA and DTA observe similar frequencies of strong and violent tornadoes, each alley has unique distributions of strong and violent tornado
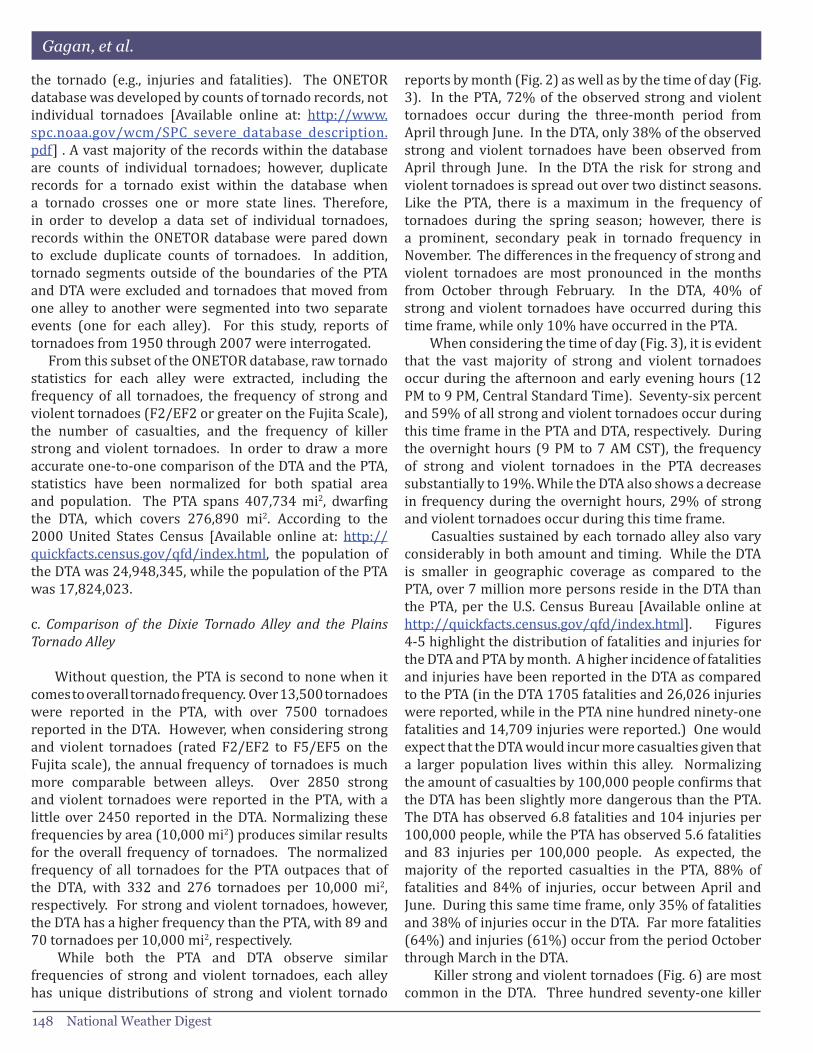
reports by month (Fig. 2) as well as by the time of day (Fig. 3). In the PTA, 72% of the observed strong and violent tornadoes occur during the three-month period from April through June. In the DTA, only 38% of the observed strong and violent tornadoes have been observed from April through June. In the DTA the risk for strong and violent tornadoes is spread out over two distinct seasons. Like the PTA, there is a maximum in the frequency of tornadoes during the spring season; however, there is a prominent, secondary peak in tornado frequency in November. The differences in the frequency of strong and violent tornadoes are most pronounced in the months from October through February. In the DTA, 40% of strong and violent tornadoes have occurred during this time frame, while only 10% have occurred in the PTA.
When considering the time of day (Fig. 3), it is evident that the vast majority of strong and violent tornadoes occur during the afternoon and early evening hours (12 PM to 9 PM, Central Standard Time). Seventy-six percent and 59% of all strong and violent tornadoes occur during this time frame in the PTA and DTA, respectively. During the overnight hours (9 PM to 7 AM CST), the frequency of strong and violent tornadoes in the PTA decreases substantially to 19%. While the DTA also shows a decrease in frequency during the overnight hours, 29% of strong and violent tornadoes occur during this time frame.
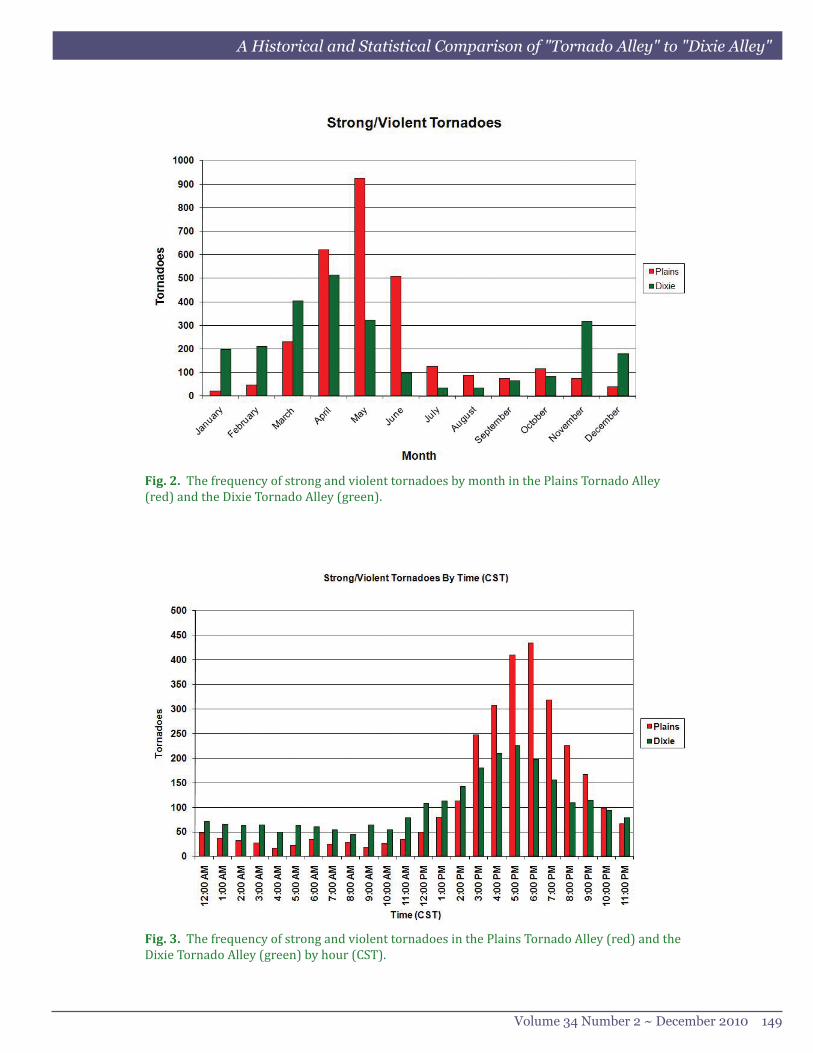
Casualties sustained by each tornado alley also vary considerably in both amount and timing. While the DTA is smaller in geographic coverage as compared to the PTA, over 7 million more persons reside in the DTA than the PTA, per the U.S. Census Bureau [Available online at http://quickfacts.census.gov/qfd/index.html]. Figures 4-5 highlight the distribution of fatalities and injuries for the DTA and PTA by month. A higher incidence of fatalities and injuries have been reported in the DTA as compared to the PTA (in the DTA 1705 fatalities and 26,026 injuries were reported, while in the PTA nine hundred ninety-one fatalities and 14,709 injuries were reported.) One would expect that the DTA would incur more casualties given that a larger population lives within this alley. Normalizing the amount of casualties by 100,000 people confirms that the DTA has been slightly more dangerous than the PTA. The DTA has observed 6.8 fatalities and 104 injuries per 100,000 people, while the PTA has observed 5.6 fatalities and 83 injuries per 100,000 people. As expected, the majority of the reported casualties in the PTA, 88% of fatalities and 84% of injuries, occur between April and June. During this same time frame, only 35% of fatalities and 38% of injuries occur in the DTA. Far more fatalities (64%) and injuries (61%) occur from the period October through March in the DTA.
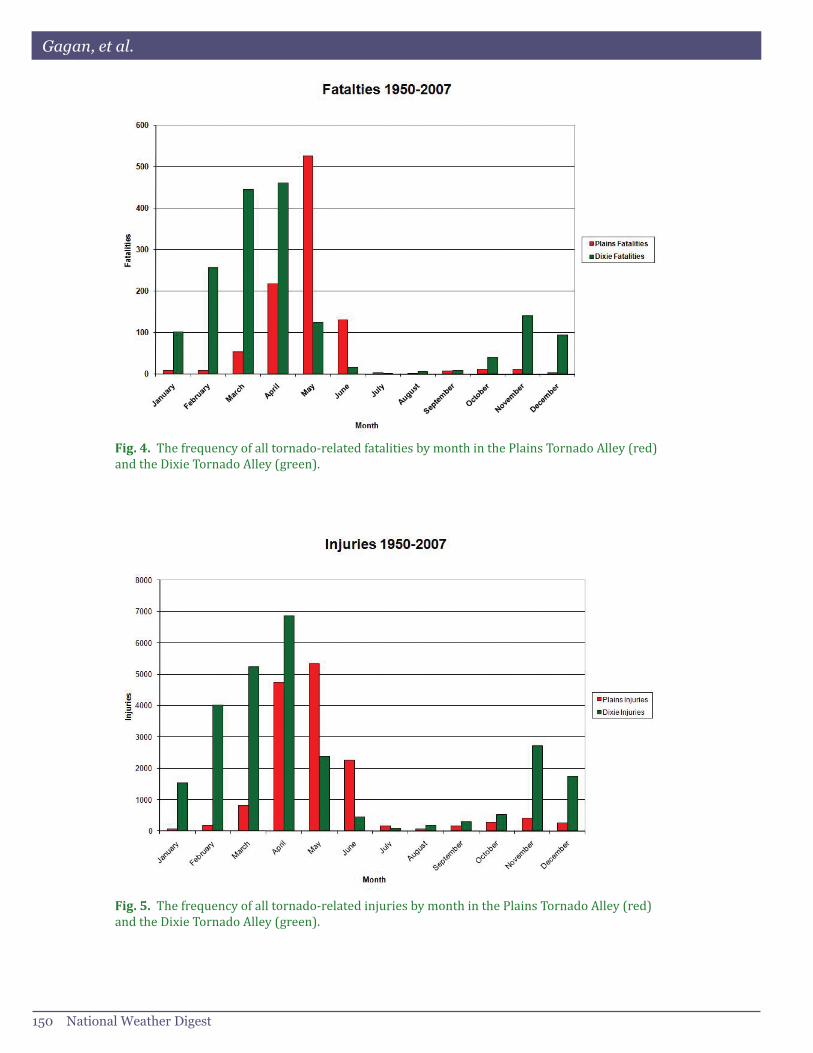
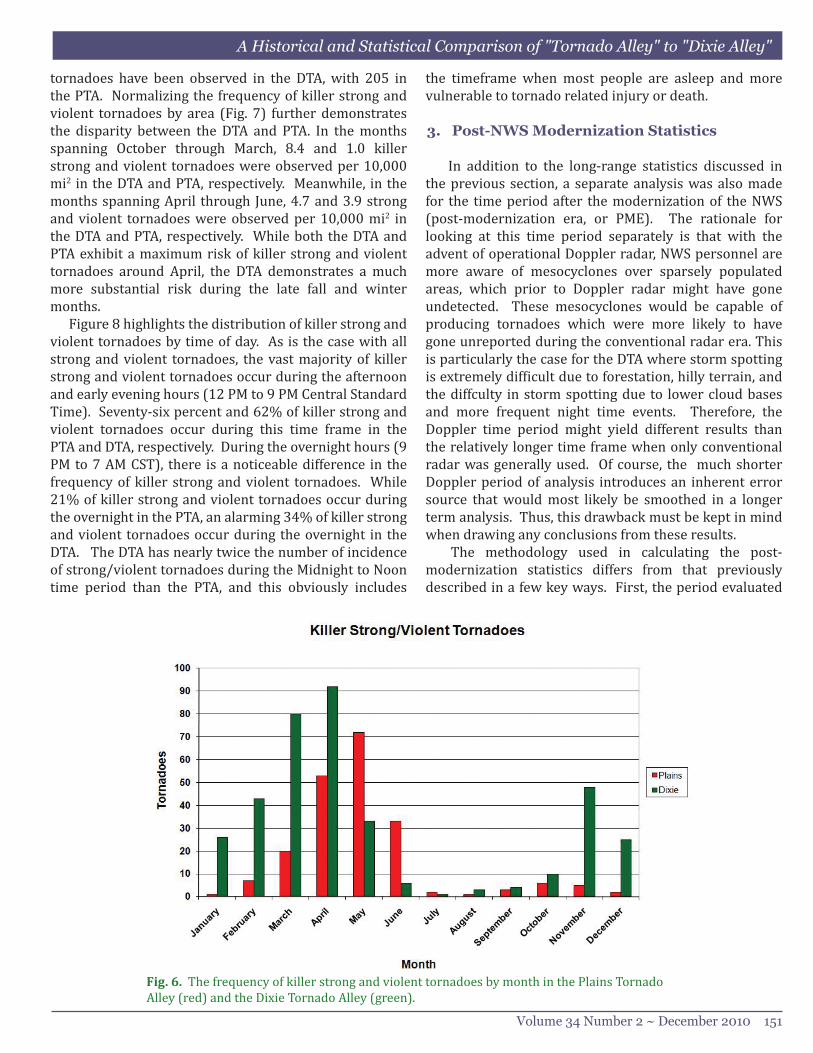
Killer strong and violent tornadoes (Fig. 6) are most common in the DTA. Three hundred seventy-one killer
A Historical and Statistical Comparison of "Tornado Alley" to "Dixie Alley"
Volume 34 Number 2 ~ December 2010 149
Fig. 2. The frequency of strong and violent tornadoes by month in the Plains Tornado Alley (red) and the Dixie Tornado Alley (green).
Fig. 3. The frequency of strong and violent tornadoes in the Plains Tornado Alley (red) and the Dixie Tornado Alley (green) by hour (CST).
Gagan, et al.
150 National Weather Digest
Fig. 4. The frequency of all tornado-related fatalities by month in the Plains Tornado Alley (red) and the Dixie Tornado Alley (green).
Fig. 5. The frequency of all tornado-related injuries by month in the Plains Tornado Alley (red) and the Dixie Tornado Alley (green).
A Historical and Statistical Comparison of "Tornado Alley" to "Dixie Alley"
Volume 34 Number 2 ~ December 2010 151
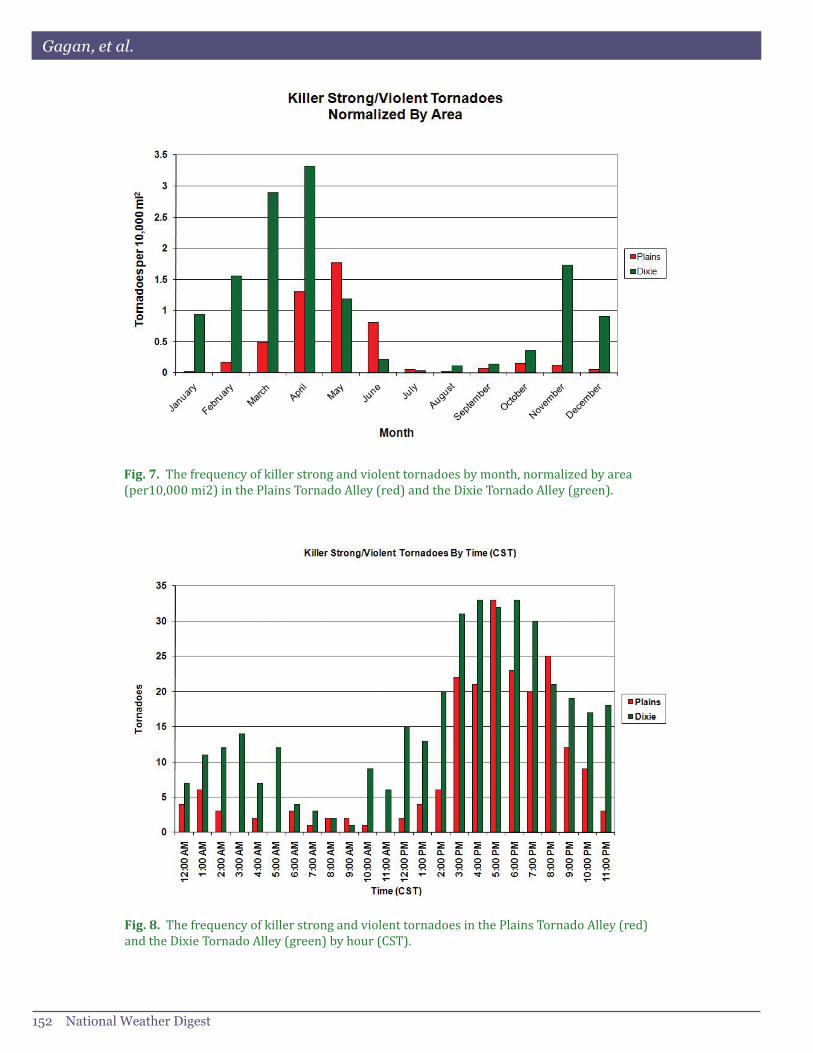
tornadoes have been observed in the DTA, with 205 in the PTA. Normalizing the frequency of killer strong and violent tornadoes by area (Fig. 7) further demonstrates the disparity between the DTA and PTA. In the months spanning October through March, 8.4 and 1.0 killer strong and violent tornadoes were observed per 10,000 mi2 in the DTA and PTA, respectively. Meanwhile, in the months spanning April through June, 4.7 and 3.9 strong and violent tornadoes were observed per 10,000 mi2 in the DTA and PTA, respectively. While both the DTA and PTA exhibit a maximum risk of killer strong and violent tornadoes around April, the DTA demonstrates a much more substantial risk during the late fall and winter months.
Figure 8 highlights the distribution of killer strong and violent tornadoes by time of day. As is the case with all strong and violent tornadoes, the vast majority of killer strong and violent tornadoes occur during the afternoon and early evening hours (12 PM to 9 PM Central Standard Time). Seventy-six percent and 62% of killer strong and violent tornadoes occur during this time frame in the PTA and DTA, respectively. During the overnight hours (9 PM to 7 AM CST), there is a noticeable difference in the frequency of killer strong and violent tornadoes. While 21% of killer strong and violent tornadoes occur during the overnight in the PTA, an alarming 34% of killer strong and violent tornadoes occur during the overnight in the DTA. The DTA has nearly twice the number of incidence of strong/violent tornadoes during the Midnight to Noon time period than the PTA, and this obviously includes
the timeframe when most people are asleep and more vulnerable to tornado related injury or death.
3. Post-NWS Modernization Statistics
In addition to the long-range statistics discussed in the previous section, a separate analysis was also made for the time period after the modernization of the NWS (post-modernization era, or PME). The rationale for looking at this time period separately is that with the advent of operational Doppler radar, NWS personnel are more aware of mesocyclones over sparsely populated areas, which prior to Doppler radar might have gone undetected. These mesocyclones would be capable of producing tornadoes which were more likely to have gone unreported during the conventional radar era. This is particularly the case for the DTA where storm spotting is extremely difficult due to forestation, hilly terrain, and the diffculty in storm spotting due to lower cloud bases and more frequent night time events. Therefore, the Doppler time period might yield different results than the relatively longer time frame when only conventional radar was generally used. Of course, the much shorter Doppler period of analysis introduces an inherent error source that would most likely be smoothed in a longer term analysis. Thus, this drawback must be kept in mind when drawing any conclusions from these results.
The methodology used in calculating the post-modernization statistics differs from that previously described in a few key ways. First, the period evaluated
Fig. 6. The frequency of killer strong and violent tornadoes by month in the Plains Tornado Alley (red) and the Dixie Tornado Alley (green).
Gagan, et al.
152 National Weather Digest
Fig. 7. The frequency of killer strong and violent tornadoes by month, normalized by area (per10,000 mi2) in the Plains Tornado Alley (red) and the Dixie Tornado Alley (green).
Fig. 8. The frequency of killer strong and violent tornadoes in the Plains Tornado Alley (red) and the Dixie Tornado Alley (green) by hour (CST).
A Historical and Statistical Comparison of "Tornado Alley" to "Dixie Alley"
Volume 34 Number 2 ~ December 2010 153
is a nine-year period from 1998 to 2006. Selection of this time period is of course somewhat subjective, but based on the authors’ experience it was felt that 1998 best demarcated the full modernization of the NWS from a severe convection perspective due to the full implementation of the Weather Surveillance Radar (WSR-88D ) system. Secondly, because of the desire to look at verification statistics in this part of the study as well as potential concerns about the ONETOR database at the very end of the study period, NWS Storm Data [Available online at http://www4.ncdc.noaa.gov/cgi-win/wwcgi.dll?wwEvent~Storms] was used to calculate the statistics rather than ONETOR. This means that instead of looking at actual tornadoes, we are looking at county-based tornado events. This introduces a potential bias since areas with more numerous, smaller counties will likely have somewhat more reports than those areas with fewer but larger counties. Because most tornado tracks are relatively short (< 20 km), it is expected that this bias should be relatively minimal, but could result in numbers that are slightly tilted toward the DTA region, where counties are generally smaller than in the PTA area.
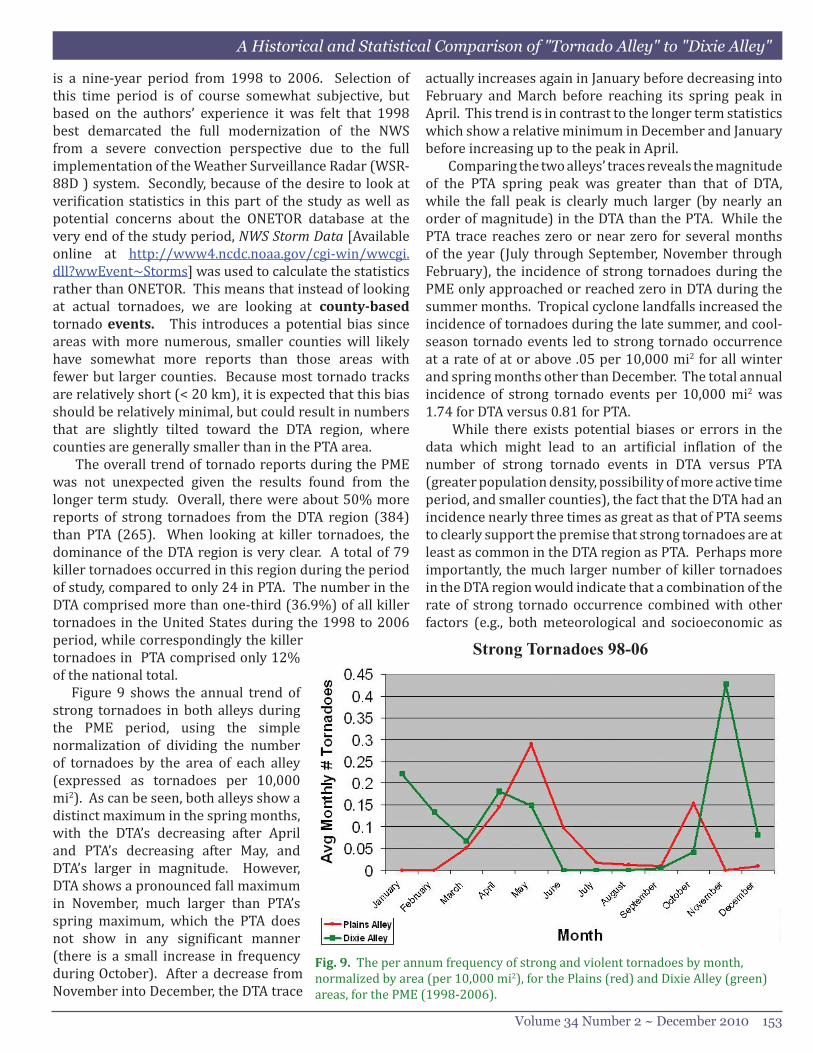
The overall trend of tornado reports during the PME was not unexpected given the results found from the longer term study. Overall, there were about 50% more reports of strong tornadoes from the DTA region (384) than PTA (265). When looking at killer tornadoes, the dominance of the DTA region is very clear. A total of 79 killer tornadoes occurred in this region during the period of study, compared to only 24 in PTA. The number in the DTA comprised more than one-third (36.9%) of all killer tornadoes in the United States during the 1998 to 2006 period, while correspondingly the killer tornadoes in PTA comprised only 12% of the national total. Figure 9 shows the annual trend of strong tornadoes in both alleys during the PME period, using the simple normalization of dividing the number of tornadoes by the area of each alley (expressed as tornadoes per 10,000 mi2). As can be seen, both alleys show a distinct maximum in the spring months, with the DTA’s decreasing after April and PTA’s decreasing after May, and DTA’s larger in magnitude. However, DTA shows a pronounced fall maximum in November, much larger than PTA’s spring maximum, which the PTA does not show in any significant manner (there is a small increase in frequency during October). After a decrease from November into December, the DTA trace
actually increases again in January before decreasing into February and March before reaching its spring peak in April. This trend is in contrast to the longer term statistics which show a relative minimum in December and January before increasing up to the peak in April.
Comparing the two alleys’ traces reveals the magnitude of the PTA spring peak was greater than that of DTA, while the fall peak is clearly much larger (by nearly an order of magnitude) in the DTA than the PTA. While the PTA trace reaches zero or near zero for several months of the year (July through September, November through February), the incidence of strong tornadoes during the PME only approached or reached zero in DTA during the summer months. Tropical cyclone landfalls increased the incidence of tornadoes during the late summer, and cool-season tornado events led to strong tornado occurrence at a rate of at or above .05 per 10,000 mi2 for all winter and spring months other than December. The total annual incidence of strong tornado events per 10,000 mi2 was 1.74 for DTA versus 0.81 for PTA.
While there exists potential biases or errors in the data which might lead to an artificial inflation of the number of strong tornado events in DTA versus PTA (greater population density, possibility of more active time period, and smaller counties), the fact that the DTA had an incidence nearly three times as great as that of PTA seems to clearly support the premise that strong tornadoes are at least as common in the DTA region as PTA. Perhaps more importantly, the much larger number of killer tornadoes in the DTA region would indicate that a combination of the rate of strong tornado occurrence combined with other factors (e.g., both meteorological and socioeconomic as
Fig. 9. The per annum frequency of strong and violent tornadoes by month, normalized by area (per 10,000 mi2), for the Plains (red) and Dixie Alley (green) areas, for the PME (1998-2006).
Strong Tornadoes 98-06
Gagan, et al.
154 National Weather Digest
discussed in the next section) means that the DTA region was much more susceptible to tornado-induced loss of life than the PTA region.
4. Conclusion
The purpose of this work is not to provoke scholarly arguments over the “champion” area as far as tornado incidence. Rather, it is to show that public and media perception is just that, perception, and that reality is often more complicated. Recent outstanding work by Ashley (2007) and Ashley et al. (2008) has helped to illustrate the complexity of the United States’ tornado vulnerability, and the potential for the mid-South and Southeast to be “overlooked” by the focus on “Tornado Alley,” including discussions of the potential socioeconomic factors (e.g., higher incidence of mobile home use) which will not be restated here. While the various biases associated with tornado reporting make any one-to-one comparison between “Tornado Alley” and “Dixie Alley” difficult at best, the statistics outlined in this paper make several clear points
First, both the monthly and diurnal distributions of tornado incidence are much different in the DTA than in the PTA. In the DTA, the risk of a strong or killer tornado on the day of peak risk is substantially less than the risk on the peak day in the PTA. However, this peak is much less pronounced in the DTA, and the annual incidence in the DTA can be viewed as more of a persistent, moderate risk through much of the year rather than an extreme risk during a more confined “season” as is observed in the PTA. When the more sustained risk of the DTA is added up over an entire year, it seems clear that even when taking any potential data biases into account, the DTA has at least as great a risk of strong/violent tornadoes as the PTA, and certainly has a greater risk of killer tornadoes than the PTA.
Additionally, the DTA has about a 50% greater risk of strong tornadoes during the overnight hours, with over a third of its killer tornadoes occurring between 9 pm and 7 am. The annual and diurnal distribution of the tornado risk in the DTA has a substantial impact on preparedness and warning dissemination efforts in this area. Clearly, residents and emergency personnel in the DTA must maintain a level of tornado preparedness throughout most of the year, which contrasts to the PTA in which the NWS, emergency management and media can focus their preparedness activities around the “tornado season” of late March through June (although occasional atpyical events do occur outside of the “season” here as well). Warning dissemination and preparedness activities in the DTA must also account for the greater frequency of overnight tornadic activity as well, although clearly there
is sufficient risk of such events in the PTA to ensure that residents there also do not discount the risk of nighttime tornadoes. Another concern is that cool season tornadoes are often moving at a greater speed than storms in the warm season, potentially leading to less time for people to take shelter.
The challenge facing operational meteorologists in the DTA can be summed up looking at statistics from the last 20 years. Between 1986 and 2005, SVRPlot [SPC online storm report program, available at: http://spc.nssl.noaa.gov/climo/online/sp3/plot.php] shows that 504 people have been killed by tornadoes in the two “alleys” combined. Seventy-five percent of these fatalities (377) occurred in the DTA. On average, a strong tornado in the DTA is associated with 0.44 fatalities, more than twice the rate as in the PTA (0.18). Also, NWS verification statistics during this time period show that the probability of detection (POD) and lead time (LT) for strong tornadoes is greater in the PTA than the DTA (POD: .80 versus .68; LT: 13.6 min versus 10.2 min).
The disparity in verification skill is likely in large part due to the inability to effectively spot storms in the southeast United States due to heavy forestation, and it should be noted that this disparity has shrunk markedly since NWS modernization introduced Doppler radar into warning operations [POD: .75; (1996-2005) versus .45 (1986-1995); LT: 12.6 min versus 6.1 min]. Still, tornado events associated with large numbers of fatalities continue to be a serious risk in the DTA even with improved warnings, as shown by the 2008 Super Tuesday outbreak. This outbreak killed 57 people, nearly all in the DTA, even with advance warnings issued for all of the killer tornadoes. Clearly, if the fatality rate is to be decreased substantially in the DTA, improved meteorological science and warnings will not be sufficient, at least not in the near term. At least as important will be a commitment by the operational meteorology community to better understand public response through an increased focus on social sciences, as well as increased understanding among the public and government officials of the significant risk from tornadoes faced by the region.
Acknowledgments
The authors would like to thank the reviewers for their thoughtful comments which improved the quality of this paper. We also would like to thank Tom Grazulis from The Tornado Project for his assistance with the historical part of this work. Finally, we would like to thank Jon Davies for his encouragement to formalize this study.
A Historical and Statistical Comparison of "Tornado Alley" to "Dixie Alley"
Volume 34 Number 2 ~ December 2010 155
Authors
John P. Gagan is currently a Senior Forecaster at the National Weather Service (NWS) Forecast Office in Springfield, MO. He received his Master of Science degree in Meteorology from Saint Louis University in 2001, with research focused on heavy rainfall and the role of system propagation. John began his weather career as a medium-range forecaster and weather derivative trader for Aquila Energy, based in Kansas City, MO. He began his NWS career as a General Forecaster in Jackson, MS from late 2002 through early 2006. John’s research interests have been focused on the improvement of weather forecasts, with an emphasis in the early detection and risk assessment of hazardous, high impact weather events.
Alan Gerard is the Meteorologist-In-Charge of the National Weather Service Forecast Office in Jackson, MS, a position he has held since 2002. Prior to that, he was the Science and Operations Officer and a Senior Forecaster in the same office. He has also held positions at the NWS forecast office in Cleveland, OH and the NWS office in Columbus, OH. He is a past-president of the National Weather Association, and is currently the NWA Commissioner of Committees. He has published articles in numerous publications, including National Weather Digest, Electronic Journal of Operational Meteorology, and Weather and Forecasting. He is a graduate of St. Louis University.
John Gordon is currently the Meteorologist-In-Charge (MIC) of the National Weather Service (NWS) Forecast Office in Louisville, KY, which serves citizens across 59 counties of Kentucky and southern Indiana. Previously, John was the first MIC at the new NWS office in Huntsville, Alabama from 2002-2004. Mr. Gordon received a BS in Meteorology from Parks College of St. Louis University in 1986 and a Masters in Teaching in Geoscience from Mississippi State in 2002. John served as a Lead Forecaster at WFO Nashville, TN from 1998-2002, Journeyman Forecaster at WFO Springfield, MO from 1994 to 1998, and Meteorologist Intern at WFO Jackson, MS from 1993-1994. Mr. Gordon retired from the U.S. Air Force (AF) Reserves after serving nearly 21 years. Most of his AF career was spent as a flight meteorologist for the US Air Force Reserve 53rd Weather Reconnaissance Squadron Hurricane Hunters based in Biloxi, MS. He flew three Category 4 and 5 hurricanes over 3 years from 2003-2005 (Isabel, Ivan, and Katrina).
References
Ashley, W.S., 2007: Spatial and temporal analysis of tornado fatalities in the United States: 1880–2005. Wea. Forecasting, 22, 1214-1228.
Ashley, W.S., A.J. Krmenec and R. Schwantes, 2008: Vulnerability due to nocturnal tornadoes. Wea. Forecasting, 23, 795-807.
Brooks, H.E., cited 2003: Severe thunderstorm climatology. [Available online at: http://www.nssl.noaa.gov/hazard/svrwxmisc.html]
Brooks, H.E., Doswell, C.A. III and Kay, M.P., 2003: Climatological estimates of local daily tornado probability for the United States. Wea. Forecasting, 18, 626-640.
Broyles, J.C., and K.C. Crosbie, 2004: Evidence of smaller tornado alleys across the United States based on a long track F3-F5 tornado climatology study from 1880-2003. Preprints, 22nd Conf. Severe Local Storms, Amer. Meteor. Soc., Hyannis MA. [Available online at: http://www.spc.noaa.gov/publications/broyles/longtrak.pdf].
Concannon, P.R., Brooks, H.E. and Doswell, C.A. III, 2000: Climatological risk of strong and violent tornadoes in the United States. Preprints, 2nd Conf. on Environmental Applications, Long Beach, CA, Amer. Meteor. Soc., 212-219.
Flora, S.D., 1954: Tornadoes of the United States. University of Oklahoma Press, 206 pp.
Grazulis,T.P., 1993: Significant Tornadoes, 1680-1991. Environmental Films, 1326 pp.
Grazulis, T.P., 2001: The Tornado: Nature’s Ultimate Windstorm. University of Oklahoma Press, 352 pp.
Schaefer, J. T, and F. B. Tatom, 1999: The relationship between El Nino, La Nina and United States tornado activity. Preprints, 19th Conf. Severe Local Storms, Minneapolis, MN, Amer. Meteor. Soc.