Embed Size (px)
Citation preview
ANALYTICAL BIOCHEMISTRY 98, 394-401 (1979)
A Highly Sensitive and Rapid Fluorometric Assay for UDP-Glucuronyltransferase Using
3-Hydroxybenzo(a)pyrene as Substrate
JASWANT SINGH AND FRIEDRICH J. WIEBEL
Abil. Toxikologie, Gesellschaft fir Strahlen- und Um,veltjiwschung. lngolstiidter Landstrasse I, D-8042 NeuherberglMiinchen, Federal Republic of Germany
Received February 2, 1979
A rapid and highly sensitive fluorometric assay for UDP-glucuronyltransferase (EC 2.4.1.17) has been devised using 3-hydroxybenzo(u)pyrene as substrate. The sensitivity of the procedure is based on (a) the high coefficient of fluorescence of the product, benzo(a)pyrene-3.glucuronide, and (b) the very low background which is obtained by an efficient differential extraction of substrate and product and their widely differing fluorescence characteristics in alkaline solution. As little as 5-10 pmol of product can be determined. The procedure involves essentially a single extraction and transfer step. The method may be applicable in measuring transferase activity in a few micrograms of tissue protein or of cultured cells as well as in the routine processing of large numbers of samples. Some of the properties of glucuronyltransferase activity directed toward 3-hydroxy- benzo(a)pyrene are described such as kinetic constants and the sensitivity of the reaction to detergents and organic solvents.
Glucuronidation by microsomal trans- ferases (EC 2.4.1.17) is a major pathway for the detoxification of numerous xenobi- otics. Because the metabolism of biologically active chemicals is increasingly studied in cells in culture or in extrahepatic tissues which may have a low capacity for glucuroni- dation and be available only in small quan- tities there is an apparent need for the development of highly sensitive assays of glucuronyltransferase activity.
Presently, several assays for UDP-glu- curonyltransferase activity are in use which are based on spectrocolorimetric (1,2), fluorometric (3,4.5), as well as radiometric (6,7) procedures and employ a large variety of substrates.
Nemoto and Gelboin (7) have shown that 3-hydroxybenzo(a)pyrene (3-OH-BP)’ and other phenols of benzo(u)pyrene (BP) are
1 Abbreviations used: 3-OH-BP, 3-hydroxybenzo- (rr)pyrene; BP. benzo(tr)pyrene: PB, phenobarbital.
readily converted to glucuronides in the presence of UDP-glucuronic acid and hepatic microsomes. The determination of BP- glucuronide formation involved the separa- tion of tritium-labeled substrate and product by thin-layer chromatography and radio- metric analysis (7).
The following describes a fluorometric assay for the glucuronidation of 3-OH-BP which is very simple and improves the sensitivity by taking advantage of (a) the high fluorescence coefficient of the product, BP-3-glucuronide, and (b) the ease with which the substrate, 3-OH-BP, and the glucuronidated product can be separated by differential extraction and distinguished by their widely differing fluorescence characteristics.
MATERIALS AND METHODS
Chemiwls. UDP-Glucuronic acid (sodium salt), Triton X-100, D-saccharic acid-l ,4-
0003.2697/79/140394-08$02.00/O Copyright 0 1979 by Academic Preys, Inc. All rights of reproductmn in any term reserved
394
FLUOROMETRIC ASSAY FOR UDP-GLUCURONYLTRANSFERASE 395
lactone were obtained from Sigma Chem- icals, and Brij-58 from Atlas Chemie. p- Glucuronidase (bovine liver, 243 Fishman units/mg) was from Serva. All other chem- icals used were of analytical grade. 3-OH-BP was obtained from the Carcinogenesis Standard Reference Compound Bank, NCI, Bethesda, Maryland.
Pwpurariotl of tnictwsotnes. Male Wistar rats (150-200 g body weight) were treated with phenobarbital (PB) supplied in the drinking water as a 0.1% solution for 12 days. PB-Treated and untreated animals were sacrificed by cervical dislocation, and microsomes were prepared as de- scribed by Hesse and Wolff (8). In the following, microsomes from PB-treated or untreated rats are referred to as PB and control microsomes, respectively.
Ccl1 c.ultrlr.r.s. 4-H-H-E cells derived from Reuber H-35 hepatoma were generously supplied by Dr. B. Thompson, Bethesda, Maryland. The cells were cultured in Dulbecco’s modified Eagle’s medium sup- plemented with 10% fetal calf serum, 100 units of penicillin. and 100 pg of strepto- mycin, harvested as previously described (9) and stored at -80°C. They were utilized for the transferase assay without further homogenization.
Etz:ytnc crsstry. The entire procedlure was performed under subdued light. The stand- ard reaction mixture contained in 0.4 ml: 100 mM Tris-HCI buffer, pH 7.6: 5 mM MgCI,. 3 mM UDP-glucuronic acid, 50 p.g protein, and 50 pM 3-OH-BP added in 20 ~1 methanol to give a final 5% (v/v). The substrate was added after the enzyme prep- aration. The reaction was started by placing the samples in a water bath at 37°C. Incuba- tion time was 3 min if not stated otherwise. After incubation under mild shaking the reaction was terminated by addition of 6 ml of chloroform:methanol (2: I, v/v) and 0.6 ml of water. The mixture was vigorously shaken and centrifuged at low speed for faster separation of the phases. An aliquot (1 ml) of the aqueous methanol phase was
transferred to a tube fitting the sample holder of the fluorometer and made alkaline by addition of 0.1 ml of 5 N NaOH. The resulting turbid solution was centrifuged or allowed to clear by standing for a few min- utes before fluorometric determination. The relative fluorescence intensity was then read at 378-nm excitation and 425-nm emission for glucuronide conjugates formed using an Aminco Bowmann fluorometer. The specific enzyme activity is expressed as nanomoles of BP-3-glucuronide formedlminimg pro- tein. The fluorescence coefficient of BP-3- glucuronide was determined as described under Results and Discussion.
Rrpt-otlucihiliry . All assays were per- formed in duplicates or triplicates. The co- efficient of variation was generally less than 5% The volumes given above can readily be reduced, e.g.. by half without loss of sensitivity or reproducibility.
Sllfety prec.rrufiott.s. 3-OH-BP has to be handled with caution since it has been found to be cytotoxic (10). weakly mutagenic in Saltnotzello ryplzittluriuttl ( 1 1,12), and very weakly if at all tumorigenic (13,14). The danger of exposure can be minimized by using disposable materials, i.e., tubes and tips of automatic pipetting devices.
Gllrcurotzidrtsr treclttnetlt. An aliquot containing approximately 2 nmol of BP-3- glucuronide and 0.08 nmol of 3-OH-BP was extracted with ch1oroform:methanol. The aqueous methanol phase was dried under a stream of nitrogen and the residual material was dissolved in ammonium acetate buffer, 0.5 M, pH 4.6. Duplicate samples were incubated in the presence of p-glucuronidase (200 Fishman units) and 5 mM saccharic acid- 1.4~lactone. The aliquots were removed at various time intervals and l-ml portions were extracted with 6 ml of chloroform: methanol (2:l). The fluorescence was then read in aqueous and organic phases as de- scribed above.
ProFeiti detrrt?iitiutiotz. Protein was meas- ured by the method of Lowry et ~1. (15).
396 SINGH AND WIEBEL
RESULTS AND DISCUSSION
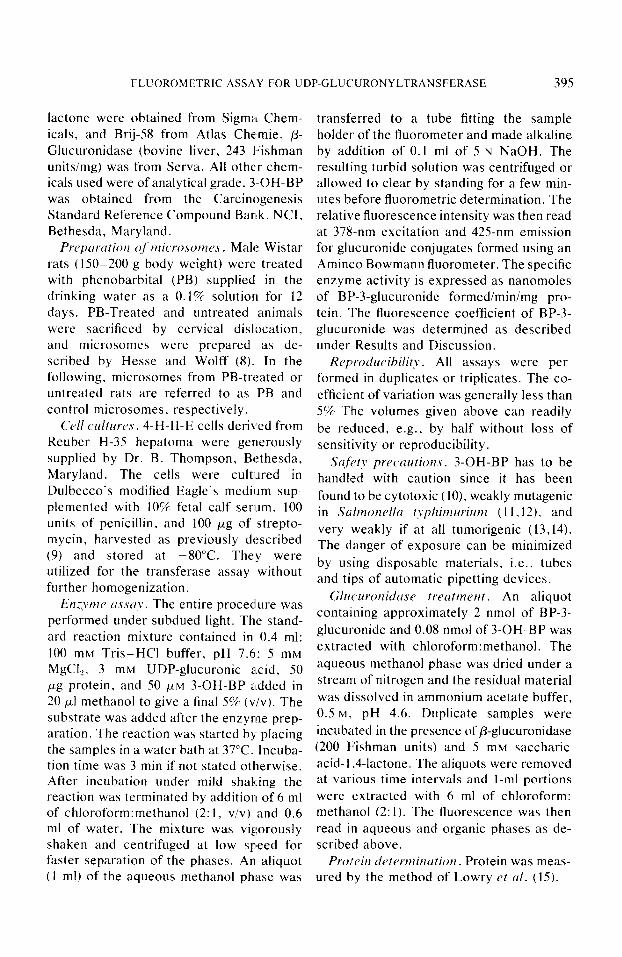
Figure 1 shows the fluorescence spectra of 3-OH-BP and the product(s) formed in the presence of UDP-glucuronic acid and hepatic microsomes which closely resemble those of BP-3-glucuronide described by Nemoto et al. (16) and Baird rt ~1. (17). The similarity of the maximum excitation and emission wavelengths of 3-OH-BP and BP-3-glucuronide precludes their quantita- tive fluorometric determination without prior separation or selective change of fluorescence properties. Both approaches proved to be feasible.
Of the various solvents and solvent mix- tures tested (diethylether, ethylacetate.
FIG. 1. Fluorescence spectra of 3-OH-BP and of the aqueous soluble product of UDP-glucuronic acid- dependent 3-OH-BP metabolism. (- - -) Fluores- cence in the water:methanol phase after incubation of 50 PM 3-OH-BP, 400 pg microsomal protein, 6 mM UDP-glucuronic acid, 0.0125% Brij-58 for 60 min and extraction of the incubation mixture with chloro- form:methanol (for other conditions see Materials and Methods). More than 90% of the substrate 3.OH-BP was utilized. (-1 Fluorescence of 3.OH-BP in the water:methanol phase. Conditions were as described above except that UDP-glucuronic acid was omitted from the incubation mixture. The amount of substrate remained unchanged over the incubation period. (. ‘1 Fluorescence of 3-OH-BP in the water: methanol phase after addition of 5 N NaOH (0.1 ml/ml). Excitation spectra t/eff sit/e) were recorded at an emission wavelength of (- - -) 425 nm. (-) 438 nm. and (. .) 520 nm. Emission spectra (right
side) were recorded at an excitation wavelength of (- - -) 378 nm. (---) 375 nm. and (. ) 392 nm.
acetone:hexane (1:3), propanol:hexane (1:3), chloroform, chloroform:methanol) a chloro- form:methanol mixture of 2: I gave the best differential extraction of substrate and product. Extraction of 1 part of the aqueous reaction mixture with 6 parts of chloroform: methanol (2: 1) removed more than 98% of the substrate into the organic solvent phase. Under these conditions about 90% of the product remained in the water:methanol phase. Following the extraction step, the fluorescence at 378-nm excitation/425-nm emission was linear with the concentration of BP-3-glucuronide in the reaction mixture in the range of 5 nM to 5 PM.
Extraction with chloroform:methanol proved also to be advantageous in that most of the protein appears in the intermediate layer of organic and aqueous phases. Addition of various amounts of microsomal protein to reaction mixtures containing a given amount of BP-3-glucuronide did not alter the fluorescence intensity in the aqueous phase after extraction.
In order to suppress the fluorescence arising from residual substrate in the aqueous phase after extraction which may interfere with the determination of low amounts of products, the aqueous phase was made alkaline by addition of 0.1 ml of 5 N NaOH. This causes the excitation and emission peaks of the substrate, 3-OH-BP. to shift from 375 to 392 nm and from 435 to 520 nm, respectively (Fig. l), but affects neither the fluorescence maxima nor in- tensity of the product BP-3-glucuronide. In the presence of alkali the product was stable for several hours.
The fluorescence of the substrate in alkaline solution at the wavelengths of interest (378-nm excitation/425-nm emis- sion) drops to less than 1% of its value in neutral water:methanol solution. Thus. by the combination of differential extraction
FLUOROMETRIC ASSAY FOR UDP-GLUCURONYLTRANSFERASE 397
and alkali treatment, the fluorescence of the substrate can be reduced to about 0.102% of its initial value, i.e., at a substrate concen- tration of 20 nmolireaction mixture the back- ground fluorescence corresponds to less than 5 pmol. Maximum suppression Iof sub- strate-dependent fluorescence requiires at least a final 0.05 N NaOH: above this value the normality of the solution is not critical.
From the foregoing it is apparent that an even simpler assay procedure may be em- ployed when the amounts of product formed comprise at least 5- 10% of the sub- strate, a condition which is usually met using microsomes from rodent liver. Mere addition of alkali to the reaction mixture suppresses the fluorescence due to thle sub- strate to 1 .O- I .5% and allows the fluores- cence of the product to be read directly in the reaction vessel. However, fluorescence of the product in alkaline aqueous solution is also decreased by 50% without con- comitant change in the fluorescence char- acteristics. This reduction in fluorescence intensity does not occur in the ,water: methanol phase obtained after chloroform: methanol extraction as noted above.
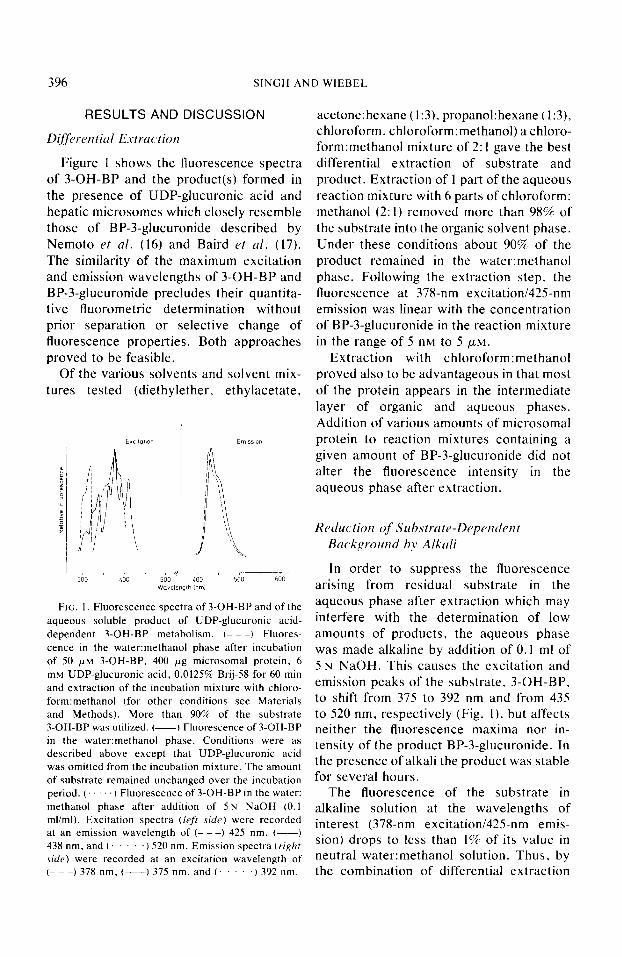
Figure 2a shows the disappearance of choloroform:methanol extractable fluores- cent material due to 3-OH-BP and the concomitant formation of fluorescent ma- terial in the aqueous phase, presumably the BP-3-glucuronide. The sum of the fluores- cent units consumed and appearing during UDP-glucuronic acid-dependent metabolism was the same at all incubation times pro- vided corrections were made for the dif- ferent degree of fluorescence of both product and substrate in organic and aqueous phases (1.0 and 1.4, respectively) and for the fraction of product extracted in1.o the organic phase amounting to about 10%. These results sugget that the coefficient of fluorescence of the substrate and the prod-
FIG. 2. Appearance and disappearance of fluores- cence during the formation and hydrolysis of BP-3- glucuronide. (a) Microsome-mediated formation of BP-3-glucuronide (W from 3-OH-BP (3). The incuba- tion mixture contained in a total volume of 1.0 ml: 400 fig microsomal protein. 6 rnM UDP-glucuronic acid. and 0.0125% Brij-58. At various times 0.1.ml aliquots were removed in duplicate from the reaction mixture and upon addition of 0.9 ml H,O were processed for determination of fluorescence as de- scribed under Materials and Methods. (b) Hydrolysis of BP-3.glucuronide by P-glucuronidase: disappear- ance of glucuronide (W) and appearance of 3-OH-BP (0). P-Glucuronidase treatment as described under Materials and Methods.
uct may be very similar if not identical. This is confirmed by reverting the enzyme re- action, i.e., by subjecting the aqueous- soluble product to hydrolysis by ,&glu- curonidase (Fig. 2b). Within a few min- utes the aqueous-soluble material was quantitatively converted into organic-soluble material which by fluorescence spectra was identified as 3-OH-BP. Again, the sum of the fluorescence due to substrate and product remained unchanged during the re- action (Fig. 2b). The fluorescence of the product did not decrease when p-gluc- uronidase hydrolysis was carried out in the presence of its inhibitor saccharic acid-l .4-lactone. The results indicate that BP-3-glucuronide is the only water-soluble fluorescent metabolite formed from 3- OH-BP in the presence of microsomes and UDP-glucuronic acid.
BP-Phenols have been shown to be sub- strate for microsomal monooxygenases (18) as well as for soluble sulfotransferases (19.20). However, taking into account a contamination of the microsomal prepara-
398 SINGH AND WIEBEL
tion with the soluble transferase. the lack of their cofactors in the reaction mixture most likely prevents the metabolism of 3- OH-BP by these alternative routes. The fact that no water-soluble fluorescent products are detectable in the absence of UDP- glucuronic acid does not exclude the forma- tion of other derivatives of 3-OH-BP than the glucuronide but it shows that even if they are formed in substantial amounts they do not interfere with the quantitation of the BP-3-glucuronide.
Dependency of’ Transferase Actil!ity on Time and Protein Concentration
The glucuronidation of 3-OH-BP by microsomes or preparations of cultured cells was linear with time of incubation for at least 30 min (Fig. 3a). Linearity of the reaction increased to 60 min when protein concentrations as low as 20 &reaction mixture were used. At microsomal protein concentration of 200 pg, the reaction was linear up to 20 min (data not shown). En- zyme activity was also proportionate to the amounts of protein used in the range of 20 to 80 wg after 30 min of incubation (Fig. 3a). These results were obtained in the absence of detergents from the reaction mixture. In
FIG. 3. Glucuronidation of 3-OH-BP as a function of time and protein concentration. Microsomal pro- tein: 20 pg, (0): 40 pg. (0); 80 pg, (a); and 50 kg protein of 4-H-H-E cells. (0). Other conditions as under Materials and Methods. (a) In the absence of detergents; (b) in the presence of 0.005 and 0.0075% of Brij-58 at 20 (0) and 40 ~g (0) of microsomal pro- tein, respectively.
01 0 01 02 OL 06 08 1G i3OH~Benro~olp”rene,~MI
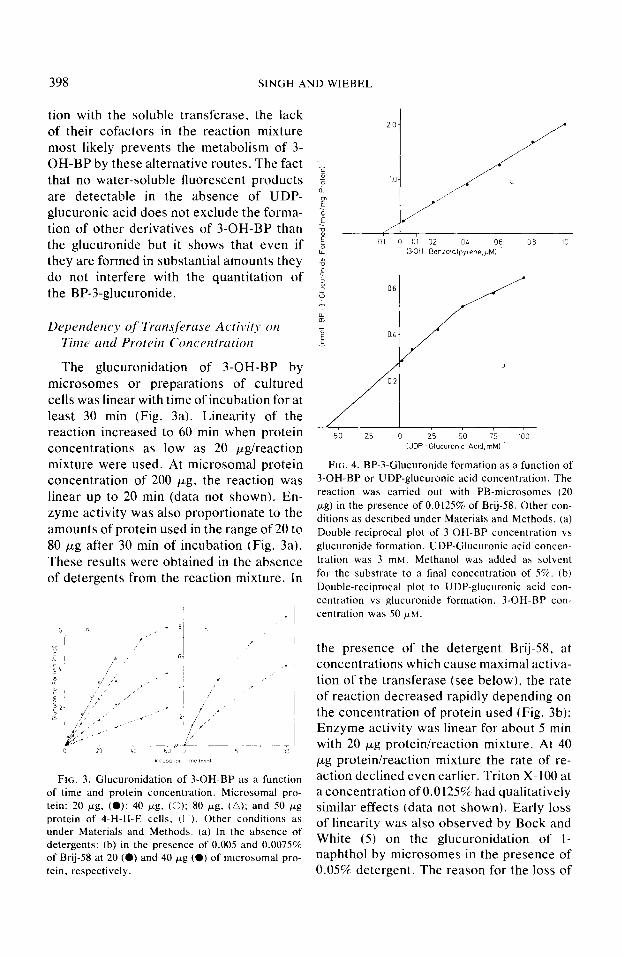
FIG. 4. BP-3-Glucuronide formation as a function of 3-OH-BP or UDP-glucuronic acid concentration. The reaction was carried out with PB-microsomes (20 pg) in the presence of 0.0125% of Brij-58. Other con- ditions as described under Materials and Methods. (a) Double-reciprocal plot of 3-OH-BP concentration vs glucuronide formation. UDP-Glucuronic acid concen- tration was 3 mM. Methanol was added as solvent for the substrate to a final concentration of 5%. (b) Double-reciprocal plot to UDP-glucuronic acid con- centration YS glucuronide formation. 3-OH-BP con- centration was 50 /rM.
the presence of the detergent Brij-58, at concentrations which cause maximal activa- tion of the transferase (see below), the rate of reaction decreased rapidly depending on the concentration of protein used (Fig. 3b): Enzyme activity was linear for about 5 min with 20 pg protein/reaction mixture. At 40 pg protein/reaction mixture the rate of re- action declined even earlier. Triton X- 100 at a concentration of 0.0125%~ had qualitatively similar effects (data not shown). Early loss of linearity was also observed by Bock and White (5) on the glucuronidation of l- naphthol by microsomes in the presence of 0.05% detergent. The reason for the loss of
FLUOROMETRIC ASSAY FOR UDP-GLUCURONYLTRANSFERASE 399
linearity in the presence of the detergents is not known.
Dependency on Substrrrte and UDP-Glucuronic Acid Concentrat,ion
The activity of microsomal glucuronyl- transferase at various concentrations of 3- OH-BP and of UDP-glucuronic acid is shown in Lineweaver-Burk plots in Fig. 4. The curve obtained with 3-OH-BP (Fig. 4a) is linear in the range of 1 to 50 PM and cor- responds to an apparent K,,, of 10 PM. This value is considerably lower than those re- ported for other substrates (21,22), a fact which might be attributable to the high lipophilicity of the 3-OH-BP and hence its likely accumulation in a lipophilic en- vironment of the enzyme within the micro- somal membrane (23). For the standard assay a substrate concentration of :5O PM
was adopted. V,,, of the reaction vvas 20 nmoliminimg protein (Fig. 4a). V,,,, values of the same order of magnitude have been reported for other substrates of the trans- ferase such as 2-aminophenol, I-naphthol, 4- nitrophenol, or 4-methylumbelliferone (5,31).
In contrast to the substrate, the reciprocal plot for the cosubstrate UDP-glucuronic acid is not linear (Fig. 4b), in agreement
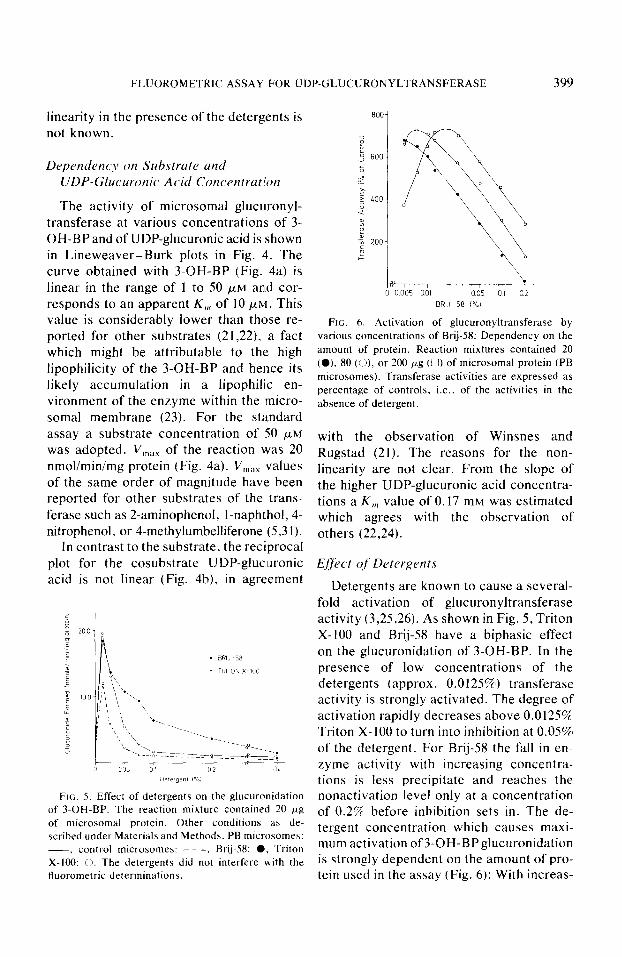
FIG. 5. Effect of detergents on the glucuronlidation of 3-OH-BP. The reaction mixture contained 20 pg of microsomal protein. Other conditions as de- scribed under Materials and Methods. PB microsomes: -. control microsomes: - - -. Brij-58: 0. Triton X-100: 0. The detergents did not interfere with the fluorometric determinations.
k “\ c-r-----., ‘V 0 0005 001 0.05 01 0.2
BRIJ -58 i%i
FIG. 6. Activation of glucuronyltransferase by various concentrations of Brij-58: Dependency on the amount of protein. Reaction mixtures contained 20 (0). 80 ((I), or 200 Kg (0) of microsomal protein (PB microsomes). Transferase activities are expressed as percentage of controls, i.e., of the activities in the absence of detergent.
with the observation of Winsnes and Rugstad (21). The reasons for the non- linearity are not clear. From the slope of the higher UDP-glucuronic acid concentra- tions a K,u value of 0.17 mM was estimated which agrees with the observation of others (22,24).
Detergents are known to cause a several- fold activation of glucuronyltransferase activity (3,25,26). As shown in Fig. 5, Triton X-100 and Brij-58 have a biphasic effect on the glucuronidation of 3-OH-BP. In the presence of low concentrations of the detergents (approx. 0.0125%) transferase activity is strongly activated. The degree of activation rapidly decreases above 0.0125% Triton X-100 to turn into inhibition at 0.05% of the detergent. For Brij-58 the fall in en- zyme activity with increasing concentra- tions is less precipitate and reaches the nonactivation level only at a concentration of 0.2% before inhibition sets in. The de- tergent concentration which causes maxi- mum activation of3-OH-BPglucuronidation is strongly dependent on the amount of pro- tein used in the assay (Fig. 6): With increas-
400 SINGH AND WIEBEL
ing amounts of microsomal protein ranging from 20 to 200 &reaction mixture, the optimal concentration of Brij-58 increases from 0.005 to 0.0125%, respectively, to yield an approximate sevenfold activation independently of the protein concentration. The results point out that great care has to be taken to stay within the proper range of detergent concentrations under the par- ticular experimental conditions.
Acti\,ation oj’ Gl~r~uron~ltr~~nsferuse
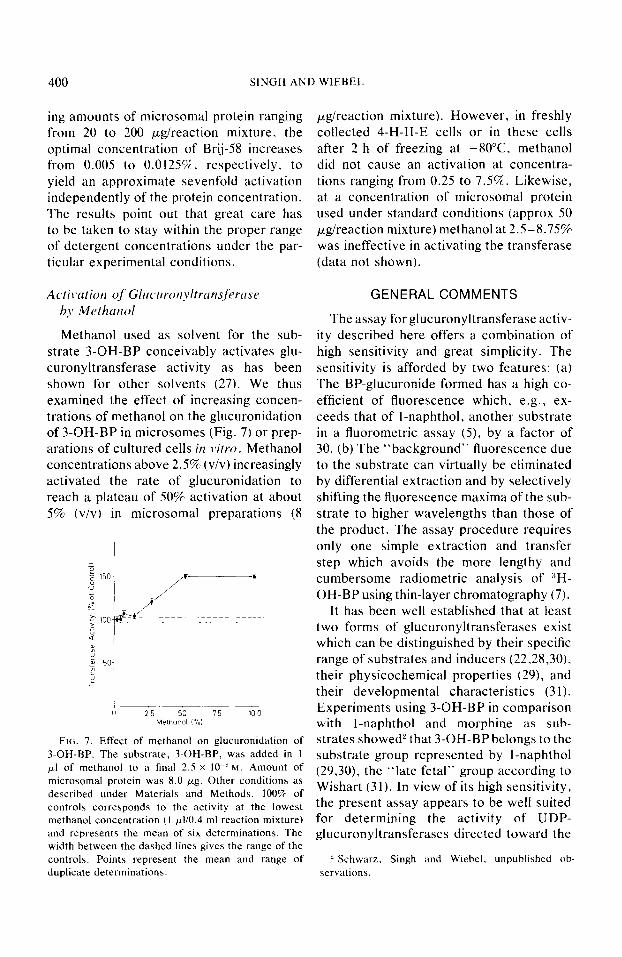
Methanol used as solvent for the sub- strate 3-OH-BP conceivably activates glu- curonyltransferase activity as has been shown for other solvents (27). We thus examined the effect of increasing concen- trations of methanol on the glucuronidation of 3-OH-BP in microsomes (Fig. 7) or prep- arations of cultured cells in vitro. Methanol concentrations above 2.5% (v/v) increasingly activated the rate of glucuronidation to reach a plateau of 50% activation at about 5% (v/v) in microsomal preparations (8
FIG. 7. Effect of methanol on glucuronidation of 3.OH-BP. The substrate, 3-OH-BP, was added in 1 ~1 of methanol to a final 2.5 x IO-” M. Amount of microsomal protein was 8.0 pg. Other conditions as described under Materials and Methods. 100% of controls corresponds to the activity at the lowest methanol concentration (1 #0.4 ml reaction mixture) and represents the mean of six determinations. The width between the dashed lines gives the range of the controls. Points represent the mean and range of duplicate determinations.
pg/reaction mixture). However, in freshly collected 4-H-B-E cells or in these cells after 2 h of freezing at -8o”C, methanol did not cause an activation at concentra- tions ranging from 0.25 to 7.5%. Likewise, at a concentration of microsomal protein used under standard conditions (approx 50 pg/reaction mixture) methanol at 2.5-8.75s was ineffective in activating the transferase (data not shown).
GENERAL COMMENTS
The assay for glucuronyltransferase activ- ity described here offers a combination of high sensitivity and great simplicity. The sensitivity is afforded by two features: (a) The BP-glucuronide formed has a high co- efficient of fluorescence which, e.g., ex- ceeds that of I-naphthol, another substrate in a fluorometric assay (5), by a factor of 30. (b) The “background” fluorescence due to the substrate can virtually be eliminated by differential extraction and by selectively shifting the fluorescence maxima of the sub- strate to higher wavelengths than those of the product. The assay procedure requires only one simple extraction and transfer step which avoids the more lengthy and cumbersome radiometric analysis of :‘H- OH-BP using thin-layer chromatography (7).
It has been well established that at least two forms of glucuronyltransferases exist which can be distinguished by their specific range of substrates and inducers (22,28,30), their physicochemical properties (29), and their developmental characteristics (31). Experiments using 3-OH-BP in comparison with 1-naphthol and morphine as sub- strates showed? that 3-OH-BP belongs to the substrate group represented by I-naphthol (29,30), the “late fetal” group according to Wishart (31). In view of its high sensitivity, the present assay appears to be well suited for determining the activity of UDP- glucuronyltransferases directed toward the
2 Schwarz, Singh and Wiebel, unpublished ob- servations.
FLUOROMETRIC ASSAY FOR UDP-GLUCURONYLTRANSFERASE 401
latter substrate group in tissues with low enzyme levels or in minute tissue samples. Likewise, simplicity and brevity recom- mend this assay for the routine processing of large numbers of biological probes.
ACKNOWLEDGMENTS
We thank Dr. L. R. Schwarz and Dr. A. Pawlak for their helpful advice. and Dr. H. Greim for his critical reading of the manuscript. The expert sec- retarial assistance of Ms. J. Byers and the technical assistance of P. Bannach are gratefully acknowledged.
REFERENCES
I. Dutton. G. J. (1966) in Glucuronic Acid (Dutton, G. J.. ed.). pp. 186-299. Academic Press. New York.
2. Van Roy, F. P., and Heirwegh. K. P. M. (1968) Biochetn. .I. 107, 507-518.
3. Winsnes. A. (1969) Eiochim. Biophy.7. Acttr 191,279-291.
4. Mulder, G. J. (1975)AnnI. Biochrnz. 64. 3510-359. 5. Bock, K. W.. and White, I. N. H. (1974) Eur.
J. Biochrrn. 46, 451-459. 6. Lucier. G. W., McDaniel, 0. S., and Malthews,
H. B. (1971) Arch. Biochrm. Biophy:N. 145, 520-530.
7. Nemoto. N.. and Gelboin. H. V. (1976) Biocham. Phurmtrcd. 25, 1221- 1226.
8. Hesse, S.. and Wolff. T. (1977) Bioc,henl. Phcrr- nruc~d. 26, 2043-2047.
9. Wiebel. F. J., Matthews, E. J., and Gelboin, H. V. (1972) .I. Bid. Chew/. 247, 4711-4717.
10. Celboin, H. V.. Huberman, E.. and Sachs, L. (1969) Prrw. ,Yur. Ac,ud. Sci. f Wush.) 64, 1188- 1194.
11. Glatt. H. R.. and Oesch, F. (1976) Muttrtion Re.c. 36, 379-384.
I?. Wislocki. P. G.. Wood. A. W.. Chang. R. L., Levin, W., Yagi. H.. Hernandez. 0.. Dansette.
P. M., Jerina. D. M., and Conney, A. H. (1976) Cuncer Rrs. 36, 3350-3357.
13. Cook, J. W., and Schoental, R. (1952) Brit. J. Cunc,er 6, 400-406.
14. Wislocki, P. G.. Chang, R. L., Wood, A. W., Levin, W., Yagi, H., Hernandez. 0.. Mah, H. D., Dansette, P. M., Jerina. D. M., and Conney, A. H. (1977) Cancer Rrs. 37, ?608- 2611.
15. Lowry, 0. H.. Rosebrough, N. J., Farr, A. L.. and Randall. R. J. (1951) J. Bid. Chem. 193, 265-275.
16. Nemoto. N., Hirakawa. T., and Takayama, S. (1978) Cham. Bid. Inrrrcrcr. 22, I- 14.
17. Baird, W. M., Chern, C. J.. and Diamond, L. (19’77) Cunc,er Rrs. 37, 3190-3197.
18. Wiebel. F. J. (1975) Arch. Biochetn. Biophys. 168, 609-621.
19. Cohen, G. M.. Moore, B. P., and Bridges. J. W. (1977) Biochem. Phurnmcnl. 26, 551-553.
20. Nemoto, N., and Takayama, S. (1977) Bioc-hem. Phurmuc~ol. 26, 679-684.
21. Winsnes, A., and Rugstad, H. E. (1973) Ac,fu Pharmucd. Toxicol. 33, 161- 176.
22. Bock, K. W.. Frohling, W.. Remmer, H., and Rexer, B. (1973) Biochim. Biophys. Acts 327. 46-56.
23. Zakim. D., and Vessey, D. A. ( 1977) J. Bid. Chrm. 252, 7534-7537.
24. Gregory, D. H.. II. and Strickland, R. D. (1973) Biwhim. Binpllys. Ac,tu 327, 36-45.
25. Lueders. K. K., and Kuff, E. L. (1967) Arch. Bio~~hrm. Biophys. 120, 198-203.
26. Mulder, G. J. (1970) Biochcm. J. 117, 319-324. 27. Gorski, J. P., and Kasper, C. B. (1977) J. Bid.
Chrm. 252, 1336-1343. 28. Lucier. G. W.. and McDaniel, 0. S. (1977) J.
Sfrroiti Biochrm. 8, X67-872. 29. Bock. K. W., von Clausbruch. U. C., Josting. D..
and Ottenwalder. H. (1977) Biochrnl. Phur- 1,7(1< 4. 26, 1097- 1 100.
30. Wishart. G. J. (1978) Bir>chem. .I. 174, 671-672. 31. Wishart, G. J. (1978) Biwhrm. J. 174. 485-489.


![Indigenous Enhanced Mineralization Pyrene, Benzo[a]pyrene ...Indigenous soil microorganism mineralization experiments. All of the mineralization experiments were performed by using](https://img.pdfslide.us/doc/110x75/5e7c41b0b7c4ef64181e5e16/indigenous-enhanced-mineralization-pyrene-benzoapyrene-indigenous-soil-microorganism.jpg)


![Benzo[a]pyrene in River Sediment](https://img.pdfslide.us/doc/110x75/613d64f9736caf36b75cd07b/benzoapyrene-in-river-sediment.jpg)


![BENZO[a]PYRENE · Benzo[a]pyrene May 2011 BENZO[a]PYRENE . This is a compilation of abstracts of articles identified during the preliminary toxicological evaluation of evidence on](https://img.pdfslide.us/doc/110x75/5be5a25109d3f2857c8c999a/benzoapyrene-benzoapyrene-may-2011-benzoapyrene-this-is-a-compilation.jpg)