Embed Size (px)
Citation preview

A high-level assessment of whether benefits of ownership and regulatory model changes can be accomplished through changes in rate design working paper prepared by London Economics International LLC for the State of Hawaii with support from Meister Consultants Group
April 12, 2019
London Economics International LLC (“LEI”) was contracted by the Hawaii Department of Business Economic Development and Tourism (“DBEDT”) to conduct a study that will evaluate the costs and benefits of various electric utility ownership models and regulatory models to support the State in achieving its energy goals. This document, which corresponds to Tasks 3.1.1 and 3.1.2 of the scope of work, is one of several working papers associated with that engagement. It provides a high-level qualitative assessment of whether the benefits of ownership and regulatory model changes can be achieved through changes to Hawaii’s existing rate design. The Project Team evaluated a range of alternative rate designs including tiered rates (inclining and declining block rates), higher fixed charges, and time-varying rates (Time-of-Use (“TOU”) rates, Real-Time Pricing (“RTP”), Critical Peak Pricing (“CPP”)). Based on a high-level qualitative evaluation of these alternative rate designs, the Project Team concluded that rate design changes can be effective complementary mechanisms to ownership and regulatory changes and could help achieve some of Hawaii’s state energy goals such as increasing the adoption of DERs and other consumer side resources, lowering peak demand, and encouraging energy conservation. At the same time, rate design is inherently interlinked with ownership and regulatory models and care must be taken to ensure that changes to rate design are consistent with overall policy goals in light of the prevailing ownership and regulatory model.
Table of Contents
LIST OF ACRONYMS ............................................................................................................................................... 3
1 EXECUTIVE SUMMARY ................................................................................................................................ 4
2 INTRODUCTION AND SCOPE ....................................................................................................................... 5
2.1 PROJECT DESCRIPTION .................................................................................................................................. 52.2 ROLE OF THIS DELIVERABLE RELATIVE TO OTHERS IN THE PROJECT.............................................................. 6
3 METHODOLOGY ............................................................................................................................................. 7
4 OVERVIEW OF RATE DESIGN..................................................................................................................... 8
5 OVERVIEW OF THE CURRENT RATE DESIGN IN HAWAII............................................................... 11
6 A HIGH-LEVEL ASSESSMENT OF POTENTIAL ALTERNATIVE RATE DESIGNS ........................ 13
6.1 TIERED RATES - INCLINING AND DECLINING BLOCK RATES ......................................................................... 136.2 HIGHER FIXED CHARGES ............................................................................................................................. 156.3 TIME-VARYING RATES ................................................................................................................................ 16
6.3.1 TOU rates .............................................................................................................................................. 16 6.3.2 RTP rates ............................................................................................................................................... 19 6.3.3 CPP rates............................................................................................................................................... 20
6.4 COMPARATIVE IMPACTS OF ALTERNATIVE RATE DESIGNS ON ENERGY SAVINGS......................................... 22
London Economics International LLC 1 contact: 717 Atlantic Ave, Suite 1A Bridgett Neely/Yemi Melka Boston, MA 02111 +1 (617) 9337229www.londoneconomics.com [email protected]
7 EVALUATION OF ALTERNATIVE RATE DESIGNS AS COMPARED TO OWNERSHIP ANDREGULATORY MODEL CHANGES.................................................................................................................... 23
7.1 ABILITY OF CHANGES IN RATE DESIGN TO MAXIMIZE CONSUMER COST SAVINGS ........................................237.2 ABILITY OF CHANGES IN RATE DESIGN TO ENABLE A COMPETITIVE DISTRIBUTION SYSTEM ........................247.3 ABILITY OF CHANGES IN RATE DESIGN TO ELIMINATE OR REDUCE CONFLICTS OF INTEREST IN ENERGY
RESOURCE PLANNING, DELIVERY, AND REGULATION ............................................................................................... 257.4 ABILITY OF CHANGES IN RATE DESIGN TO ALIGN MANAGEMENT, OWNERSHIP, AND RATEPAYER INTERESTS
25
8 CONCLUSION ................................................................................................................................................. 27
9 APPENDIX A: SCOPE OF WORK TO WHICH THIS DELIVERABLE RESPONDS ........................... 28
10 APPENDIX B: LIST OF WORKS CONSULTED ........................................................................................ 29
Table of Figures
FIGURE 1. STATE’S KEY CRITERIA FOR EVALUATING THE MODELS ...............................................................................5 FIGURE 2. SUMMARY OF METHODOLOGY FOR EVALUATING RATE DESIGN CHANGES ................................................7 FIGURE 3. KEY STEPS IN RATE DESIGN METHODOLOGY................................................................................................8 FIGURE 4. ADVANTAGES AND DISADVANTAGES OF TRADITIONAL RATE DESIGN .....................................................10 FIGURE 5. HECO COMPANIES RATE CLASSES AND APPLICABLE END USES ...............................................................11 FIGURE 6. KIUC RATE CLASSES AND APPLICABLE PARAMETERS ...............................................................................12 FIGURE 7. ADVANTAGES AND DISADVANTAGES OF INCLINING BLOCK RATES IN HAWAII ......................................14 FIGURE 8. TIME-OF-USE RATES .................................................................................................................................... 17 FIGURE 9. ADVANTAGES AND DISADVANTAGES OF TOU RATES IN HAWAII ...........................................................18 FIGURE 10. ADVANTAGES AND DISADVANTAGES OF RTP RATES IN HAWAII...........................................................20 FIGURE 11. ADVANTAGES AND DISADVANTAGES OF CRITICAL PEAK PRICING IN HAWAII.....................................21 FIGURE 12. PERCENTAGE OF ENERGY SAVINGS FROM SELECTS RATE PILOTS.............................................................22
London Economics International LLC 2 contact: 717 Atlantic Ave, Suite 1A Bridgett Neely/Yemi Melka Boston, MA 02111 +1 (617) 9337229www.londoneconomics.com [email protected]

List of acronyms
COS Cost-of-Service
CPP Critical Peak Pricing
DBEDT Hawaii Department of Business, Economic Development, and Tourism
DER Distributed Energy Resource
DSPP Distributed System Platform Provider
FERC Federal Energy Regulatory Commission
HECO Hawaiian Electric Company
HEI Hawaiian Electric Industries
HELCO Hawaii Electric Light Company
HERA Hawaii Electricity Reliability Administrator
IOU Investment Owned Utility
IPP Independent Power Producer
IGO Integrated Grid Operator
ISO Independent System Operator
KIUC Kauai Island Utility Cooperative
LEI London Economics International, LLC
MCG Meister Consultants Group
MECO Maui Electric Company
PBR Performance-Based Regulation
PUC Public Utilities Commission
RTP Real-Time Pricing
SB Single Buyer
TOU Time-of-Use
London Economics International LLC 3 contact: 717 Atlantic Ave, Suite 1A Bridgett Neely/Yemi Melka Boston, MA 02111 +1 (617) 9337229www.londoneconomics.com [email protected]

1 Executive summary
London Economics International LLC (“LEI”) was contracted by the Hawaii Department of Business Economic Development and Tourism (“DBEDT”) to conduct a study to evaluate the costs and benefits of various electric utility ownership models and regulatory models to support the State in achieving its energy goals. This working paper, which responds to Tasks 3.1.1 and 3.1.2 in the project scope of work, provides a high-level qualitative assessment of whether the benefits of ownership and regulatory model changes can be achieved through changes in rate design. The Project Team evaluates a range of alternative rate designs including:
Tiered rates;- Inclining block rates; and- Declining block rates
Higher fixed charges; and Time-Varying Rates;
- Time-of-Use (“TOU”) Rates;- Real-Time Pricing (“RTP”); and- Critical Peak Pricing (“CPP”)
Following a high-level qualitative evaluation of these rate designs, including associated advantages and disadvantages, the Project team evaluated the economic and regulatory benefits of these rate designs compared to that of ownership and regulatory model changes. Specifically, the Project team qualitatively assessed the relative ability of these rate designs to:
1. maximize consumer savings (including the maximum possible impact in percentageterms that these rate designs might have on savings based on previous experience inother markets);
2. enable a competitive distribution system in which independent agents can trade andcombine evolving services to meet customer and grid needs;
3. eliminate or reduce conflicts of interest in energy resource planning, delivery andregulation; and
4. align management, ownership, and ratepayer interests.
Based on this high-level qualitative assessment, the Project Team concluded that rate design changes can be effective complementary mechanisms to ownership and regulatory changes and could help achieve some of Hawaii’s state energy goals such as increasing the adoption of DERs and other consumer side resources, lowering peak demand, and encouraging energy conservation. Furthermore, depending on overarching ownership or regulatory model changes, rate design changes can contribute to increasing consumer savings and, to an extent, aligning utility and consumer incentives.
However, it is important to note that rate design is interlinked with prevailing regulatory and ownership models and can help advance or undermine state policy goals. As such, policymakers and regulators must be mindful of state policy objectives and the broader ownership and regulatory context when considering changes to rate design. Indeed, given the broad array of initiatives underway in Hawaii, a quantitative analysis of any potential rate design changes may be warranted once those initiatives have been implemented.
London Economics International LLC 4 contact: 717 Atlantic Ave, Suite 1A Bridgett Neely/Yemi Melka Boston, MA 02111 +1 (617) 9337229www.londoneconomics.com [email protected]

2 Introduction and scope
2.1 Project description
The Hawaii Department of Business, Economic Development and Tourism (“DBEDT”) was directed by the State legislature to commission a study to evaluate the costs and benefits of various electric utility ownership models and regulatory models to support the State in achieving its energy goals. London Economics International LLC (“LEI”), through a competitive sealed proposals procurement,1 was contracted to perform this study.2
The goal of the project is to evaluate the ability of each model to achieve the State’s key criteria3
listed in Figure 1.
Figure 1. State’s key criteria for evaluating the models
Achieve State energy goals
Maximize consumer cost savings
Enable a competitive distribution system in
which independent agents can trade and
combine evolving services to meet
customer and grid needs
Eliminate or reduce conflicts of interest in
energy resource planning, delivery, and
regulation
Source: Scope of Services under Contract No. 65595
The study will help in understanding the long-term operational and financial costs and benefits of electric utility ownership and regulatory models to serve each county of the State. In addition, it will also aid in identifying the process to be followed to implement such ownership and regulatory models, as well as determining whether such models would create synergies in terms of increasing local control over energy sources serving each county; ability to diversify energy
1 Request for Proposals for a Study to Evaluate Utility Ownership and Regulatory Models for Hawaii (RFP17-020-SID).
2 Hawaii Contract No. 65595 between DBEDT and LEI signed on March 23, 2017.
3 House Bill No. 1700 Relating to the State Budget.
London Economics International LLC 5 contact: 717 Atlantic Ave, Suite 1A Bridgett Neely/Yemi Melka Boston, MA 02111 +1 (617) 9337229www.londoneconomics.com [email protected]

resources; economic development; reducing greenhouse gas emissions; increasing system reliability and power quality; and lowering costs to all consumers.4
2.2 Role of this deliverable relative to others in the project
This deliverable responds to Tasks 3.1.1 and 3.1.2 in the project scope of work. It provides a high-level qualitative assessment of whether the benefits of recommended ownership and regulatory model changes (noted in Tasks 1.2.4 and 2.2.6) could be achieved through changes to Hawaii’s existing rate design.
In response to Task 3.1.1., it qualitatively assesses the extent benefits of ownership and regulatory model changes, including the alignment of utility interests with State policy, could be accomplished through changes in rate design. In doing so, it evaluates a range of alternative rate designs and the benefits they might offer the Hawaii electric power system relative to changes to the ownership and regulatory model.
In response to Task 3.1.2, it explicitly assesses how the proposed rate design changes compare to regulatory, and ownership model changes in terms of their ability to:
(a) maximize consumer savings;
(b) enable a competitive distribution system in which independent agents can trade andcombine evolving services to meet customer and grid needs;
(c) eliminate or reduce conflicts of interest in energy resource planning, delivery andregulation; and
(d) align management, ownership, and ratepayer interests.
Furthermore, the Project Team provides data on the possible impact in percentage terms that some of the alternative rate designs might have on savings based on previous experience.5
4 Hawaii Contract No. 65595. Scope of Services.
5 Please note that the data included only represents alternative rate design for which pilot projects have been conducted and energy savings data exists.
London Economics International LLC 6 contact: 717 Atlantic Ave, Suite 1A Bridgett Neely/Yemi Melka Boston, MA 02111 +1 (617) 9337229www.londoneconomics.com [email protected]

3 Methodology
The Project Team followed a series of four steps to assess the benefits of rate design changes relative to that of ownership and regulatory model changes and evaluate their ability to achieve Hawaii’s energy goals.
First, the Project Team laid out an explanation of how traditional rate design is usually implemented in the United States and Hawaii. Next, the Project Team discussed the details of the current rate design in Hawaii. Then, the Project Team evaluated a range of alternative rate designs including tiered rates (inclining and declining block rates), higher fixed charges, and time-varying rates (Time-of-Use (“TOU”) rates, Real-Time Pricing (“RTP”), and Critical Peak Pricing (“CPP”)). Finally, the Project Team qualitatively compared the benefits of these rate designs with the benefits of ownership and regulatory model changes proposed in prior tasks.
Figure 2. Summary of methodology for evaluating rate design changes
Step 1 •Overview of rate design
Step 2 •Overview of the current rate design in HI
Step 3 •A high level assessment of alternative rate designs
Step 4
•Evaluation of alternative rate designs as compared to ownership andregulatory model changes
London Economics International LLC 7 contact: 717 Atlantic Ave, Suite 1A Bridgett Neely/Yemi Melka Boston, MA 02111 +1 (617) 9337229www.londoneconomics.com [email protected]

4 Overview of rate design
Rate design refers to the itemized pricing structure reflected in consumers’ monthly electric bills including the underlying mechanism used to derive the prices.6 As discussed in the other working papers, rate design starts with calculating the total annual revenue requirement of a utility. In many jurisdictions, this is usually based on a Cost-of-Service (“COS”) approach, though this can vary in jurisdictions that have performance-based ratemaking. 7 The revenue requirement covers all expenses incurred by the utility and a fair return on its investments. Following that step, the cost components are allocated to different customer classes.
Rate design is the final step in the rate design process following the allocation of costs to different customer classes including residential, commercial, industrial, and others. Figure 3 below shows the series of steps involved in the rate design process.8
Figure 3. Key steps in rate design methodology
Step 1 •Compute total revenue requirement
Step 2 •Break revenue requirement into major operating fuctions(generation, transmission, and distribution)
Step 3 •Classify functionalized costs
Step 4 •Allocate costs to different rate classess
Step 5 •Rate design
Rates are typically designed by state regulators and vary across jurisdictions and customer classes. Traditional rate designs consist of two-parts including a fixed charge ($ per month) and a per unit energy charge applied to the amount of electricity consumed ($/kWh). The fixed charge accounts for costs incurred by the utility that are independent of electricity usage. On the other
6 Lazar, Jim, and Wilson Gonzalez. “Smart Rate Design for a Smart Future.” RAP, July 2015, http://www.raponline.org/wp-content/uploads/2016/05/rap-lazar-gonzalez-smart-rate-design-july2015.pdf.
7 The Hawaii Public Utility Commission is currently leading a proceeding on investigating Performance Based Regulation (Docket No. 2018-0088).
8 Please refer to the deliverable for Task 1.6.4 on retail rates for an in-depth explanation of the first 4 steps of the cost service mechanism and how it is used by HECO and KIUC companies
London Economics International LLC 8 contact: 717 Atlantic Ave, Suite 1A Bridgett Neely/Yemi Melka Boston, MA 02111 +1 (617) 9337229www.londoneconomics.com [email protected]

9
hand, the energy charge accounts for the costs incurred to generate and distribute electricity to consumers. The energy charge (in $/kWh) is calculated by dividing the total cost allocated to a given customer class by the total kilowatt-hour sales for that class.
Residential consumers typically have a monthly fixed charge and an energy charge. On the other hand, commercial and industrial consumers usually have a three-part rate which also includes a demand charge in addition to a fixed charge and energy charge. Accordingly, the monthly rate reflected on monthly commercial bills typically consists of the following types of charges:
1. Fixed charge ($ per customer) – used to recover costs related to billing and metering;outside of the generation and delivery of electricity. This applies to all customer classesregardless of usage levels. In certain cases, utilities use fixed charges to recoverdistribution system costs.9
2. Energy charge ($ per kWh) – accounts for the cost of generating and delivering energy toa consumer (i.e., based on volumetric energy use). These charges are often flat but couldalso be designed in a variety of forms including inclining or declining block rates,10
seasonal rates, or time-varying rates.
3. Demand charge ($ per kW) – used to recover the costs of generating and deliveringelectricity to large commercial and industrial consumers. Traditionally, these charges arebased on the customer’s peak demand (without considering coincidence with the systempeak) however many jurisdictions have adopted charges tied to the customer’s demandat times of system peak. For instance, California offers coincident demand charges (inaddition to non-coincident demand charges) in which the charges differ based on theamount of energy demanded with peak times having the highest charges and off-peaktimes having the lowest charges.11 Certain utilities in other states also include coincidentdemand charges in their rate structures.12 Demand charge are uncommon for low-usagecustomer classes, namely, residential consumers; however, some states such as Arizonado so.
This form of traditional rate design is the most commonly used form of rate design by state utilities in the U.S. given its simplicity and strong public acceptance.13 However, its focus on the
Lazar, Jim, and Wilson Gonzalez. “Smart Rate Design for a Smart Future.” RAP, July 2015, http://www.raponline.org/wp-content/uploads/2016/05/rap-lazar-gonzalez-smart-rate-design-july2015.pdf.
10 These concepts are discussed in Section 6.
11 CPUC. <http://www.cpuc.ca.gov/General.aspx?id=12188>
12 For example, Northern Electric Cooperative in South Dakota: https://www.northernelectric.coop/demand
13 Costello, Ken. “Alternative Rate Mechanisms and Their Compatibility with State Utility Commission Objectives.” National Regulatory Research Institute , Apr. 2014,
London Economics International LLC 9 contact: 717 Atlantic Ave, Suite 1A Bridgett Neely/Yemi Melka Boston, MA 02111 +1 (617) 9337229www.londoneconomics.com [email protected]

use of average costs to determine rates is often criticized as it negatively affects consumers with less on-peak consumption patterns as they would consume more during off-peak periods when prices are low and still pay higher average prices. The use of adjusted test year sales volumes to determine rates as opposed to the actual sales volume of the utility also leads to expected revenue fluctuations.14 Furthermore, due to the volumetric nature of energy charges and the associated COS approach to determining costs, utilities are incentivized to invest in excessive capital as a means to increase their profits. This can then lead to increased electricity costs for consumers. Figure 4 below shows a summary of the advantages and disadvantages of traditional rate design.
Figure 4. Advantages and disadvantages of traditional rate design
Rate design Advantages Disadvantages Simple for the public to understand
Limits customer response
Focus on utility prudence Negatively impacts low usage customers
Traditional rate design Perception of fairness due to avoidance of undue price discrimination
Reduces incentives for energy efficiency and distributed generation
Long-standing rate design paradigm
Incentivizes excessive capital investments increasing electricity system costs
Source: Costello, Ken. “Alternative Rate Mechanisms and Their Compatibility with State Utility Commission Objectives.” National Regulatory Research Institute, Apr. 2014, <http://nebula.wsimg.com/5a9a01aeb5f95984861ea4b20d2c903b?AccessKeyId=8AF7098D30C5BF55909C&dispositio n=0&alloworigin=1.>
Rate design has significant implications for consumer incentives and choices including time of electricity use and amount of electricity consumed. This, in turn, impacts overall electricity demand, the total cost incurred to generate and distribute electricity to consumers, and subsequent incentives of utilities. For this reason, rate design requires a careful balance of the interests of a variety of stakeholders including consumers, utilities, power producers, state institutions, and society.15
<http://nebula.wsimg.com/5a9a01aeb5f95984861ea4b20d2c903b?AccessKeyId=8AF7098D30C5BF55909C& disposition=0&alloworigin=1.>
14 Lazar, Jim, and Wilson Gonzalez. “Smart Rate Design for a Smart Future.” RAP, July 2015, http://www.raponline.org/wp-content/uploads/2016/05/rap-lazar-gonzalez-smart-rate-design-july2015.pdf.
15 Bonbright, James C. Principles of Public Utility Rates. 1961, http://media.terry.uga.edu/documents/exec_ed/bonbright/principles_of_public_utility_rates.pdf.
London Economics International LLC 10 contact: 717 Atlantic Ave, Suite 1A Bridgett Neely/Yemi Melka Boston, MA 02111 +1 (617) 9337229www.londoneconomics.com [email protected]

5 Overview of the current rate design in Hawaii
The HECO Companies and Kauai Island Utility Cooperative (“KIUC”) both use the traditional COS rate design mechanism - the form of rate design explained in the previous section.
Figure 5 below shows the applicable end users of each rate classes under HECO Companies.16
Figure 5. HECO companies rate classes and applicable end uses Category Applicable End Use
Residential lighting, heating, cooking, air conditioning and power in a
Schedule “R” (Residential Service) single family dwelling unit metered and billed separately by the Company. This schedule does not apply where a residence and business are combined; General light and/or power loads less than or equal to 5000
Schedule “G” (General Service Non-Demand) kilowatthours per month, and less than or equal to 25 kilowatts, and supplied through a single meter; General light and/or power loads which exceed 5000 kilowatthours per
Schedule “J” (General Service Demand) month or exceed 25 kilowatts three times within a twelve month period but are less than 300 kilowatts per month, and supplied through a single meter;
Schedule “P” (Large Power Service) Large light and/or power loads equal or greater than 300 kilowatts, supplied and metered at a single voltage and delivery point
Large light and/or power loads equal or greater than 300 kilowatts, supplied and metered at a single voltage and delivery point and served
Schedule “DS” (Large Power Directly Served Service) directly from a substation. Customers who are eligible for Schedule DS may elect to be served under any other schedule for which they are eligible.
HECO: public street and highway lighting, and public outdoor park and playground floodlighting service where the customer owns, maintains and operates the lighting fixtures and interconnecting circuits and conversion equipment. This rate is applicable to gaseous discharge lighting (Mercury Vapor) provided the regulator is corrected to power
Schedule “F” factor equivalent to the addition of one (1) KVAR of capacitors for each kW of name plate rating of the regulator. Under this schedule energy shall be supplied and metered at a nominal voltage of 2400 volt or more, as specified by the Company, except as set forth below under Special Terms and Conditions;
HELCO: All-night service for street and highway lighting where the customer owns, maintains, and operates the lighting fixtures and all circuits and appurtenances on the customer's side of the delivery point. The service voltage shall be the available distribution voltage at the point of delivery MECO: public street and highway lighting service supplied on the Island of Maui / Lanai/ Molokai where the Company owns, maintains and operates the street lighting facilities.
Note: “PUC” refers to Hawaii’s Public Utility Commission. These were discussed in detail in the deliverable for Task 1.2.5
16 HECO Companies. Rate & Regulations. Website. <https://www.hawaiianelectric.com/billing-and-payment/rates-and-regulations/hawaiian-electric-rates>. Access Date: March 8, 2018.
London Economics International LLC 11 contact: 717 Atlantic Ave, Suite 1A Bridgett Neely/Yemi Melka Boston, MA 02111 +1 (617) 9337229www.londoneconomics.com [email protected]

As shown in the figure above, HELCO and MECO have five rate classes, including “R” Residential, “G” Small Power Use Business, “J” Medium Power Use Business, “P” Large Power Use Business, and “F” Street Lighting. HECO, in addition, has another rate class called “DS” Large Power Directly Served Service.
Similarly, KIUC has eight rate classes, including Schedule “D” Residential, Schedule “G” Small Commercial, Schedule “J” Large Commercial, Schedule “L” Large Power (Primary), Schedule “P” Large Power (Secondary), Schedule “NEM PILOT”, Schedule “Q” Modified – Cogenerators, and Schedule “SL” Street Lighting. Among them, Schedule “NEM PILOT” and Schedule “Q” are energy credits payment rate to customers ($ per kWh). The thresholds that KIUC uses to separate the commercial rate classes are different from those of HECO Companies, as described below.17
Figure 6. KIUC rate classes and applicable parameters
Category Applicable parametersSchedule “G” (General Light & Power Service, Small Commercial)
Not greater than 30 kW demand and 10,000 kWh use per month
Schedule “J” (General Light & Power Service, Large Commercial)
Greater than 30 kW and less than 100 kW demand or 10,000 kWh per month
Schedule “L” (Large Power, Primary) Demand greater than 100 kW – metered on primary side of meter Schedule “P” (Large Power, Secondary) Demand greater than 100 kW – metered on secondary side of meter
For the HECO Companies, the current rates for Residential and Small Power Use Business are mainly based on energy charges (i.e., based on volumetric energy rates). Moreover, there is a fixed customer charge ($ per customer per month) and a Green Infrastructure Fee ($ per customer per month) added to all bills. In addition to these, rates for Medium Power Use Business, Large Power Use Business, and Large Power Use Business, Directly Served include demand charge ($ per kW) as well. Furthermore, HECO Companies provide an optional Time-of-Use (“TOU”) pilot rate program for Schedule R/ G/ J/ P rate classes.18 By participating in these pilot program, consumers can save money if they shift their energy use away from high-demand on-peak hours that are at a higher rate.19
17 KIUC. Energy Rate Adjustment Clause: Rate Data Sheet. Effective Date: March 1, 2018. Website. <http://kiuc.coopwebbuilder2.com/sites/kiuc/files/PDF/rates/2018%20Rate%20Data.pdf>.
18 Participation is voluntary. Only HELCO and MECO (not HECO) have Time-of-Use rate schedule for Schedule P.
19 HECO Companies. Time-of-Use Program. Website. <https://www.hawaiianelectric.com/save-energy-and-money/time-of-use-program>. Access date: March 8, 2018.
London Economics International LLC 12 contact: 717 Atlantic Ave, Suite 1A Bridgett Neely/Yemi Melka Boston, MA 02111 +1 (617) 9337229www.londoneconomics.com [email protected]

6 A high-level assessment of potential alternative rate designs
Technological advancements, shifting federal and state energy policies, and structural changes in the electricity industry have required a reconsideration of traditional rate design.20 To adapt to these changes, utilities and regulators throughout the US continue to propose alternative rate designs that more accurately align utility cost with consumer bills by addressing traditional rate design limitations including disincentives for promoting energy efficiency goals, lack of dynamic price signals, and inefficient pricing. Furthermore, the increasing penetration of renewable energy and distributed generation technologies has required more individualized customer services that accommodate customer-owned generation. The development of advanced metering infrastructure (“AMI”) has enabled some utilities to pursue time-varying rates such as Real-Time Pricing (‘RTP”). As part of its analysis, the Project Team assessed the following alternative rate designs:
Tiered rateso inclining block rates; ando declining block rates
Higher fixed charges Time-varying rates
o Time-of-Use (“TOU”) rates;o RTP rates; ando Critical Peak Pricing (“CPP”) rates
6.1 Tiered rates - inclining and declining block rates
Tiered rate design, also referred to as block pricing, involves the variation of the volumetric distribution charge between blocks of consumption.21 There are two types of block rates, namely, inclining and declining block rates.
Inclining block rates are one of the most common forms of residential rate design and involve a mechanism by which energy prices increase as the amount of energy consumption increases.22
This design signals to customers that increased energy usage is associated with higher costs. As a result, inclining block rates can lead to increased consumer savings by reducing the total amount of energy purchases and generation costs. Furthermore, inclining block rate can also
20 Wood, Lisa, et al. “Recovery of Utility Fixed Costs: Utility, Consumer, Environmental, and Economist Perspectives.” Electricity Markets and Policy Group, June 2016, https://emp.lbl.gov/sites/all/files/lbnl-1005742.pdf.
21 Costello, Ken. “Alternative Rate Mechanisms and Their Compatibility with State Utility Commission Objectives.” National Regulatory Research Institute , Apr. 2014,http://nebula.wsimg.com/5a9a01aeb5f95984861ea4b20d2c903b?AccessKeyId=8AF7098D30C5BF55909C&di sposition=0&alloworigin=1.
22 Lazar, Jim. “Global Best Practices in Residential Electric Rate Design.” Regulatory Assistance Project, May 2013, https://www.raponline.org/wp-content/uploads/2016/05/rap-lazar-globalratedesign-camunicipalratesgroup-2013-may.pdf.
London Economics International LLC 13 contact: 717 Atlantic Ave, Suite 1A Bridgett Neely/Yemi Melka Boston, MA 02111 +1 (617) 9337229www.londoneconomics.com [email protected]

incentivize consumers to self-generate. On the other hand, inclining block rates have drawbacks in terms of revenue instability for utilities whose profits are not decoupled from the amounts of electricity sold and higher costs for consumers who fail to lower consumption in response to higher rates.
Given that rates are decoupled in Hawaii, implementing an inclining block rate design would not threaten utility financial viability. However, a more detailed assessment on how such a rate design without a time-based price signal would impact the state ability to integrate higher penetration of renewable energy is needed. Figure 7 below summarizes the key advantages and disadvantages of inclining block rates.
Declining block rates are designed to decrease energy prices as consumers increase their level of energy consumption. This form of rate design encourages increased energy consumption by consumers and consequently fails to maximize cost savings or encourage adoption of alternative energy sources such as DERs. Accordingly, declining block rates have limited ability to meet most of Hawaii’s state energy goals and are not further explored in this report.
Figure 7. Advantages and disadvantages of inclining block rates in Hawaii 23
Rate design Advantages Disadvantages Promote energy conservation Adverse impacts on
consumers who fail to lower energy consumption
Improve utility system Higher costs for larger, less utilization through lower capacity intensive consumers demand Promote sales in a period of Incentivizes excessive capital
Inclining block rates abundant utility supply investments increasing
electricity system costs Long-standing rate design Encourages reduced paradigm consumption, which provides
for a smaller number of total kWh across which to spread costs of programs and policies, such as RPS, storage, etc.
23 Multiple sources (all included in the bibliography) used
London Economics International LLC 14 contact: 717 Atlantic Ave, Suite 1A Bridgett Neely/Yemi Melka Boston, MA 02111 +1 (617) 9337229www.londoneconomics.com [email protected]

Example: State of Missouri
In 2017, the Missouri Public Service Commission ordered Kansas City Power & Light to implement the use of inclining block rates to promote energy conservation and consumer savings. The proposed rate structure consists of the following block rates:
1. 12.9 cents per-kilowatt-hour for each of the first 600kilowatt hours per month
2. 14.9 cents per-kilowatt-hour beyond the threshold
Example: State of California
While the three largest IOUs in California are currently undergoing rate structure reforms and introducing default TOU rates, since the 1970’s they have had inclining block rates associated with the level of usage. These rates differed for each utility from year to year. For example, in 2009, one of California’s IOUs, PG&E had a rate an inclining block rate structure with the following five tiers:
Tier 1: $0.122/kWh (595 kWh); Tier 2: $0.139/kWh (178 kWh); Tier 3: $0.294/kWh (417 kWh); Tier 4: $0.404/kWh (493 kWh); and Tier 5: $0.404/kWh (remaining kWh consumed).24
6.2 Higher fixed charges
Higher fixed charges offer a minor change to the traditional flat rate design by simply increasing the fixed charge portion of consumer bills as a way to ensure revenue stability, recovery of utility fixed costs and mitigate cost shifts between customers. This means that consumers with energy efficiency measures or on-site renewable energy cannot avoid the charges. This approach has pros and cons that need to be carefully weighed. Despite their benefit of providing short-term revenue stability for utilities as well as mitigating potential cost shifts between consumer categories,
24 PG&E. “PG&E’s inclining block electric rates for residential customers: toward a more equitable rate design.” June 2011.<ftp://ftp2.cpuc.ca.gov/PG&E20150130ResponseToA1312012Ruling/2011/06/SB_GT&S_0444782.pd>
London Economics International LLC 15 contact: 717 Atlantic Ave, Suite 1A Bridgett Neely/Yemi Melka Boston, MA 02111 +1 (617) 9337229www.londoneconomics.com [email protected]

higher fixed charges can have detrimental impacts on consumers with low demands or with a high reliance on DERs.
Most importantly, higher fixed charges fail to address the key limitation of traditional rate design, lack of proper price signals. At the same time, as the changes to Hawaii’s electricity sector evolve, it will be vital to ensure that all possible tools are available to ensure that the utilities are compensated for their costs to remain financially viable companies that have access to capital markets. Thus, while the Project Team does not believe that higher fixed charges in isolation are a suitable way to achieve Hawaii’s policy goals, we recognize that this mechanism may merit consideration and more analysis in the future.
6.3 Time-varying rates
Time-varying rates refer to a set of rate design In February 2018, the Hawaii Public Utilities options which reflect some form of time- Commission (“HPUC”) approved a $205M differentiated pricing structure which allows more grid modernization plan proposed by efficient consumer response. The most common HECO.1 The plan includes: forms include
a strategic installation of advanced TOU rates; smart meters for consumers
participating in demand response programs or variable rate programs. RTP rates; and
Installation of advanced invertertechnology, voltage management tools, CPP rates, all of which are discussed in detailand outage management andbelow.notification technology by HECO.
6.3.1 TOU rates
TOU rates provide time-differentiated pricing which reflects the expected cost of providing electricity. TOU rates typically differentiate between “on-peak” and “off-peak” periods to reflect variable prices with on-peak periods having higher energy charges. Accordingly, TOU rates provide improved price signals compared to traditional flat rates and therefore incentivize consumer response by offering the opportunity to maximize consumer savings and encourage the adoption of DERs. To ensure proper customer response to price signals, several factors should be considered in designing TOU rates. First, the price differential between on-peak and off-peak periods should be large enough to incentivize the shifting of consumption to off-peak periods.25
Furthermore, the duration of price differentiated usage should also be designed to encourage customer response. Generally, shorter time periods allow for easier and more effective customers engagement as opposed to longer periods.
Note however in jurisdictions with high solar penetration, such as Hawaii and California for example, that this breakdown of high cost and low-cost periods has transitioned to reflect the lower afternoon demand that results from high levels of solar, as is shown by the rate breakdown
25 Chitkara, Aman, et al. “A Review of Alternative Rate Designs.” Rocky Mountain Institute, May 2016, https://rmi.org/wp-content/uploads/2017/04/A-Review-of-Alternative-Rate-Designs-2016.pdf.
London Economics International LLC 16 contact: 717 Atlantic Ave, Suite 1A Bridgett Neely/Yemi Melka Boston, MA 02111 +1 (617) 9337229www.londoneconomics.com [email protected]

for HECO in the figure below. On-peak periods are typically limited to weekdays while off-peak periods occur during weekends and holidays.26 It is important to note that TOU prices are fixed well in advance and therefore do not reflect the actual hourly costs of producing electricity (as opposed to RTP which is explained in the following section) or require the use of smart meters.27
Figure 8. Time-of-use rates
Source: HECO, Time-of-Use Program < https://www.hawaiianelectric.com/products-and-services/save-energy-and-money/time-of-use-program>
Compared with traditional flat rates, TOU rates provide clearer price signals to consumers as they differentiate prices by time periods and subsequently incentivize consumers to minimize electricity use during high-cost periods. This, in turn, contributes to reduced utility system costs. Research shows that TOU rates reduce overall electricity consumption by as much as 5%.28 TOU rates are more common for commercial and industrial customers, though such rates have also been offered to residential customers in the forms of pilots more frequently in recent years. Notably, California’s three major investor-owned utilities aim to roll out system-wide default
26 Lazar, Jim, and Wilson Gonzalez. “Smart Rate Design for a Smart Future.” RAP, July 2015, http://www.raponline.org/wp-content/uploads/2016/05/rap-lazar-gonzalez-smart-rate-design-july2015.pdf.
27 Lazar, Jim. “Rate Design Where Advanced Metering Infrastructure Has Not Been Fully Deployed .” Regulatory Assistance Project, Apr. 2013, https://www.raponline.org/wp-content/uploads/2016/05/rap-lazar-ratedesignconventionalmeters-2013-apr-8.pdf.
28 Wood, Lisa, et al. “Recovery of Utility Fixed Costs: Utility, Consumer, Environmental, and Economist Perspectives.” Electricity Markets and Policy Group, June 2016, https://emp.lbl.gov/sites/all/files/lbnl-1005742.pdf.
London Economics International LLC 17 contact: 717 Atlantic Ave, Suite 1A Bridgett Neely/Yemi Melka Boston, MA 02111 +1 (617) 9337229www.londoneconomics.com [email protected]

TOU rates for 22.5 million of their residential consumers by 2020.29 Figure 9 below summarizes the key advantages and disadvantages of TOU rates as they relate to impacts on overall market conditions in Hawaii.
The HECO companies currently offer an optional TOU program to increase consumer savings and promote the cost-effective integration of renewable energy.30 A thorough evaluation of that program will be useful to inform considerations of further TOU program refinement and deployment.
Figure 9. Advantages and disadvantages of TOU rates in Hawaii
Rate design Advantages Disadvantages Economically efficient; need for less utility capacity additions over time
Aggravation of high utility bills during peak periods
TOU Avoidance of subsidies to high peak-use utility customers
Potentially skeptical public
Promotion of demand-side actions to allocate utility costs
Potentially large adverse effect on utility non-price responsive customers
Note: The advantages and disadvantages from the source below have been modified to reflect Hawaii specific market conditions. Source: Costello, Ken. “Alternative Rate Mechanisms and Their Compatibility with State Utility Commission Objectives.” National Regulatory Research Institute, Apr. 2014,<http://nebula.wsimg.com/5a9a01aeb5f95984861ea4b20d2c903b?AccessKeyId=8AF7098D30C5BF55909C&dispositio n=0&alloworigin=1.>
Example: State of Massachusetts
In 2014, the Massachusetts Department of Public Utilities (“MDPU”) committed to transitioning residential consumers to TOU rates with a critical peak pricing overlay as the default rate
29 Trabish, Herman. “As California leads way with TOU rates, some call for simpler solutions.” Utility Dive. September 2, 2018. <https://www.utilitydive.com/news/as-california-leads-way-with-tou-rates-some-call-for-simpler-solutions/532436/>
30 HECO. Time-of-Use Program. <https://www.hawaiianelectric.com/products-and-services/save-energy-and-money/time-of-use-program>
London Economics International LLC 18 contact: 717 Atlantic Ave, Suite 1A Bridgett Neely/Yemi Melka Boston, MA 02111 +1 (617) 9337229www.londoneconomics.com [email protected]

design within the next several years. The order requires electric distribution companies to offer two basic service TOU options:31
1. A TOU pricing which includes a CPP component in which retail electricity pricesduring on-peak hours (12 pm – 8 pm during weekdays) is priced higher than remainingoff-peak hours.
2. A flat rate with a peak time rebate (“PTR”) option in which consumers who choose tolower energy consumption during identified peak times receive a payment. This optioneffectively protects consumers who continue to consume during on-peak periods asthey would be able to pay a flat rate.
6.3.2 RTP rates
RTP is a form of rate design which establishes hourly rates based on actual wholesale electricity costs (in restructured/competitive markets) or short run marginal generation costs (in vertically integrated markets).32 RTP rates require the use of smart meters that can monitor hourly prices based on electricity costs and report usage patterns on an hourly basis. RTP provides proper price signals to consumers by linking wholesale/generation costs with retail electricity prices. Pilot programs have shown that RTP rates can work in terms of altering consumer choice and lead to benefits that exceed associated metering and incremental costs.33
Despite its appealing benefits, RTP use is limited due to the fact that it exposes consumers to volatile wholesale energy prices and the technical and implementation cost challenges.34
Moreover, RTP could have adverse impacts on consumers who fail to shift energy consumption from on-peak to off-peak periods by increasing the average price of electricity they have to pay. Thus, RTP requires consumers to be well-educated about wholesale power markets and price dynamics so that they can effectively respond to price signals. Furthermore, it needs a robust energy service provider or an aggregator market so that consumers have sufficient options to optimize their energy use and manage their bills. Given these hurdles, it remains unclear if RTP rates would be appropriate for smaller consumers including residential and small-scale
31 “Massachusetts DPU Says Time of Use Pricing Will Be the Default for All Customers | Smart Grid Legal News. Smart Grid Legal News, 26 June 2014, https://www.smartgridlegalnews.com/demand-response/massachusetts-dpu-says-time-of-use-pricing-will-be-the-default-for-all-customers/.
32 Lazar, Jim, and Wilson Gonzalez. “Smart Rate Design for a Smart Future.” RAP, July 2015, http://www.raponline.org/wp-content/uploads/2016/05/rap-lazar-gonzalez-smart-rate-design-july2015.pdf.
33 Costello, Ken. “Alternative Rate Mechanisms and Their Compatibility with State Utility Commission Objectives.” National Regulatory Research Institute, Apr. 2014,http://nebula.wsimg.com/5a9a01aeb5f95984861ea4b20d2c903b?AccessKeyId=8AF7098D30C5BF55909C&di sposition=0&alloworigin=1.
34 Ibid
London Economics International LLC 19 contact: 717 Atlantic Ave, Suite 1A Bridgett Neely/Yemi Melka Boston, MA 02111 +1 (617) 9337229www.londoneconomics.com [email protected]

commercial consumers. Figure 10 below provides a summary of the key advantages and disadvantages of RTP rates as they relate to the overall impacts on market conditions in Hawaii.
The HECO companies and KIUC currently do not offer an RTP program to any of their customers.
Figure 10. Advantages and disadvantages of RTP rates in Hawaii
Rate design Advantages Disadvantages Leads to a more efficient use of energy and capacity resources by utilities and consumers
Exposes consumers to highly volatile electricity prices
RTP Allows easier integration of renewable energy
Adverse impact on consumers who fail to shift consumption from on-peak to off-peak periods
Improves load flexibility Requires the installation of smart meters; high implementation cost
Source: Costello, Ken. “Alternative Rate Mechanisms and Their Compatibility with State Utility Commission Objectives.” National Regulatory Research Institute, Apr. 2014, <http://nebula.wsimg.com/5a9a01aeb5f95984861ea4b20d2c903b?AccessKeyId=8AF7098D30C5BF55909C&disposition=0&allo worigin=1.>
Example: State of Illinois
Illinois is the only state in the US whose two major utilities, Ameren Illinois and Commonwealth Edison (“ComEd”) offer comprehensive opt-in dynamic “real-time pricing” programs for residential consumers in which electricity prices offered to consumers vary hourly, based on wholesale electricity prices.35 Analysis conducted by the Citizens Utility Board shows that 97% of ComEd’s customers could save on average $86.63 (approximately 13%) annually only through participating in the real-time pricing program.
6.3.3 CPP rates
CPP rates allow utilities to set substantially higher prices during “critical peak periods” which occur on specific hours of “critical peak days” of the year. The number of critical periods is often capped for a given year. Customers are therefore incentivized to lower their energy consumption
35 Jeff, and David Kolata. “The Costs and Benefits of Real-Time Pricin.” Citizens Utility Board, Nov. 2017, https://citizensutilityboard.org/wp-content/uploads/2017/11/FinalRealTimePricingWhitepaper.pdf.
London Economics International LLC 20 contact: 717 Atlantic Ave, Suite 1A Bridgett Neely/Yemi Melka Boston, MA 02111 +1 (617) 9337229www.londoneconomics.com [email protected]

during these periods and subsequently benefit from lower electricity bills. However, this form of rate design reduces the incentivize for consumers to reduce energy consumption in off-peak periods.36 This rate design also requires the use of AMI. A slight variation of CPP rate is a Critical Peak Rebate (“CPR”) or Peak Time Rebate (“PTR”) in which the utility pays consumers for every kWh of electricity reduced during critical peak periods.37 The figure below summarizes the key advantages and disadvantages of CPP rates as applicable to Hawaii.
Currently, utilities in Hawaii do not offer CPP rates to consumers. However, given the increasing penetration of solar power in Hawaii and the need to effectively manage peak load, if implemented strategically, CPP rates could offer significant benefits and could merit further evaluation.
Figure 11. Advantages and disadvantages of Critical Peak Pricing in Hawaii
Rate design Advantages Disadvantages
Critical Peak Pricing
Significant load reductions in peak periods
Adverse impacts on consumers who fail to reduce electricity consumption during "critical periods"
Significant cost savings for consumers who lower electricity consumption during "critical periods"
Provides no consumer incentives to reduce energy consumption during hours outside of "critical periods"
Source: Badtke-Berkow, Mina, et al. “Making the Most of Time-Variant Electricity Pricing.” Environmental Defense Fund, 2015, <https://www.edf.org/sites/default/files/content/a_primer_on_tvp_for_edf_webpage.pdf.>
Example: State of California
In the US, the largest residential CPP deployment is offered by PG&E. PG&E started offering its CPP rate in May 2008, with the initiation of its system-wide smart metering deployment. The CPP rate features:
Applicable during summer with peak period 2 pm – 6pm
Maximum number of peak events limited to 15 persummer
Peak surcharge set at 60 cents/kWh Off-peak discounts vary between 3 cents and 4
cents/kWh
36 Badtke-Berkow, Mina, et al. “Making the Most of Time-Variant Electricity Pricing.” Environmental Defense Fund, 2015, https://www.edf.org/sites/default/files/content/a_primer_on_tvp_for_edf_webpage.pdf.
37 Ibid
London Economics International LLC 21 contact: 717 Atlantic Ave, Suite 1A Bridgett Neely/Yemi Melka Boston, MA 02111 +1 (617) 9337229www.londoneconomics.com [email protected]

6.4 Comparative impacts of alternative rate designs on energy savings
The relative impacts of the alternative rate designs discussed in the prior section, including those on energy savings, vary depending on specific design characteristics and prevailing market conditions in the jurisdiction of implementation. Thus, they are not directly comparable to one another. We list them here merely to share experience from other jurisdictions and to provide an order of magnitude impact that such rate designs have had elsewhere. Figure 12 below summarizes the percentage of annual energy savings from select rate design pilots conducted by the following utilities:38
Sacramento Municipal Utility District (“SMUD”) of California;
Xcel Energy of Colorado;
Baltimore Gas and Electric (“BGE”) of Maryland; and
Public Service Electric and Gas Company (“PSEG”) of New Jersey.
Figure 12. Percentage of energy savings from select rate pilots
Note: Ranges for % in energy savings represent values across two phases of the given pilot. Furthermore, the values listed represent average values across phases. Source: Baatz, Brendon. “Rate Design Matters: The Intersection of Rate Design and Energy Efficiency.” March 2017. American Council for an Energy-Efficient Economy.
As shown in the figure, the percentage of annual energy savings varies widely depending on the form of rate design used and the jurisdiction in which the pilot is conducted. Specifically, impacts on energy savings vary due to factors including the type of customer group, enabling technologies used, and level of consumer responsiveness, among others. Generally, based on the pilot results noted above, CPP and PTR result in higher energy savings than TOU rates
38 Please note that the table includes rates design pilots for which there is specific data on annual energy savings.
London Economics International LLC 22 contact: 717 Atlantic Ave, Suite 1A Bridgett Neely/Yemi Melka Boston, MA 02111 +1 (617) 9337229www.londoneconomics.com [email protected]

(considering both default and opt-in variations). However, care must be taken when drawing conclusions regarding the relative effectiveness of these rate designs given the factors above.
7 Evaluation of alternative rate designs as compared to ownership and regulatory model changes
In accordance with the scope of Tasks 3.1.1 and 3.1.2, the Project team conducted a high-level assessment of the extent to which the benefits of ownership and regulatory model changes can be achieved through rate design changes and the relative ability of rate design changes to:
(I) maximize consumer cost savings;(ii) enable a competitive distribution system;(iii) eliminate or reduce conflicts of interest in energy resource planning, delivery,
and regulation; and(iv) align management, ownership, and ratepayer interests.39
We discuss each of these in the subsections below.
It is important to note that a detailed quantitative analysis would be required to draw more specific conclusions about the relative effectiveness of rate design changes in achieving the benefits from ownership and regulatory model changes. Rate design is inherently interlinked with ownership, and regulatory models and care must be taken to ensure that rate design changes serve as effective complimentary tools and are consistent with overall policy goals in light of the prevailing ownership and regulatory model.
7.1 Ability of changes in rate design to maximize consumer cost savings
If designed and implemented correctly, rate design changes have the potential to optimize consumer cost savings. However, this is dependent upon consumers responding to price signals by shifting energy usage from on-peak to off-peak periods. By moving consumption to off-peak periods, consumers could reduce overall utility costs for additional generation capacity which would subsequently lead to lower rates. However, depending on program design, rate design changes such as time-varying rates could have adverse impacts on residential consumers who are unable to shift usage from on-peak to off-peak periods whether due to inflexible electric demand or a lack of enabling technology. In this context, the inability to shift from on-peak to off-peak periods would lead to higher monthly bills for these consumer groups.40
Regulatory model changes, if implemented correctly, also have the potential to result in significant cost savings for consumers. As discussed in the memo for Task 2.2.1, the Performance-Based Regulatory model (“PBR”), including both variants of outcomes-based PBR and conventional PBR, could result in reduced consumer rates as they allow the regulator to set
39 Note: the ranking on regulatory models included an additional criteria of transition costs
40 Colgan, John T., et al. “Guidance for Utilities Commissions on Time of Use Rates: A Shared Perspective from Consumer and Clean Energy Advocates.” 15 July 2017, <https://uspirg.org/sites/pirg/files/reports/TOU-Paper-7.17.17.pdf>
London Economics International LLC 23 contact: 717 Atlantic Ave, Suite 1A Bridgett Neely/Yemi Melka Boston, MA 02111 +1 (617) 9337229www.londoneconomics.com [email protected]

incentives and penalties tailored to the specific goal of affordable rates. Furthermore, rate design mechanisms can be effective complementary tools to the PBR regulatory model.
On the other hand, the relative effectiveness of ownership model changes would depend on prevailing regulatory practices. As discussed in the memo for Task 1.2.5, for instance, the efficacy of the co-op model in lowering rates would primarily depend on the priorities of the customer-owners. Similarly, the Single Buyer model, given its ability to create a competitive procurement process can result in lower consumer rates driven by lower generation prices. However, the relative amount of consumer savings would depend on the management and procurement practices of the SB.
Overall, rate design, regulatory, and ownership model changes are all subject to varying levels of implementation risks. The relative effectiveness of such changes would depend on program design and prevailing market conditions at the time of implementation.
7.2 Ability of changes in rate design to enable a competitive distribution system
Time-varying rate design has the potential to advance customer driven DERs as it provides price signals that better reflect the costs associated with producing electricity. By doing so, it allows customers to make better-informed decisions about their energy usage and subsequently enable efficient use of DER resources.41 For instance, during on-peak periods in which the grid’s power supply is constrained, consumers could shift energy consumption from grid source electricity to on-site DER. This system would allow consumers to rely on grid-sourced electricity during off-peak periods and use DERs during on-peak periods, effectively reducing their consumer bills while also contributing to lower utility grid costs.42 Furthermore, such rate designs could also improve the economic competitiveness of DERs.
Ownership model changes in isolation including co-ops, IOUs, and the SB model have limited abilities to promote distribution system competition, specifically, in promoting DERs due to bias towards building their generation instead of encouraging DERs (for co-ops and IOUs) or lack of incentives to do so. On the other hand, regulatory model changes, such as a shift toward the PBR model, has the potential to increase competition at the distribution level, by designing incentives and penalties specific to the goal enabling a competitive distribution system. It is important to note that the implementation of ownership or regulatory changes, such as a shift toward the PBR model, would still require corresponding revisions to rate design in order to enable a competitive distribution system.
41 Badtke-Berkow, Mina, et al. “Making the Most of Time-Variant Electricity Pricing.” Environmental Defense Fund, 2015, https://www.edf.org/sites/default/files/content/a_primer_on_tvp_for_edf_webpage.pdf.
42 Ibid
London Economics International LLC 24 contact: 717 Atlantic Ave, Suite 1A Bridgett Neely/Yemi Melka Boston, MA 02111 +1 (617) 9337229www.londoneconomics.com [email protected]

7.3 Ability of changes in rate design to eliminate or reduce conflicts of interest in energy resource planning, delivery, and regulation
As discussed in prior memos, under vertically integrated utilities, conflict of interest in the areas of energy resource planning, delivery, and regulation is primarily addressed through the separation of planning and operational control from investment and ownership. IOUs earn profits on capital investments, creating an economic incentive for them to favor IOU-owned assets. This has historically translated into a bias for thermal generation (as the IOUs are not allowed to own renewable generation) as well as wires investments. Customer-sited assets such as DERs would offset investments in centralized generation assets and thereby reduce utility revenues, although one might argue that over the long term, DER expansion might require additional wires investment.
While rate design changes would not enable the separation of planning and operational control from investment and ownership, they can play a significant role in utility resource planning strategy. For instance, a shift from traditional flat rate design to some form of time-varying rate would improve energy resource planning by incentivizing low-cost planning and potentially encourage utility adoption of DERs by ensuring revenue stability. Furthermore, it would encourage more efficient consumption of electricity and provide consumers an economic incentive to adopt DERs. At the same time, there are other forms of rate design that could be less favorable toward DERs.
Regulatory model changes including a shift toward the PBR model, despite not being able to result in full separation of planning and operational control from investment and ownership, could provide incentives and penalties tailored to the goal of reducing conflicts of interest. However, the Hybrid model could result in separation at the distribution level. These regulatory models are discussed in detail in the memo for Task 2.2.1.
On the other hand, as discussed in the memo for Task 1.2.5, changes from the status quo ownership model to the SB (outside of the utility) model would effectively eliminate the conflict of interest in energy resource planning, delivery, and regulation as it completely separates the ownership of generation and transmission assets from operational control. In a similar fashion, a shift towards a co-op ownership model could reduce conflicts of interest given that co-ops would generally be more favorable toward customer owned DERs.
7.4 Ability of changes in rate design to align management, ownership, and ratepayer interests
As noted in prior memos, the key principle that guides the alignment of management, ownership and ratepayer interests is the separation of ownership, procurement, and operations. While rate design changes only address the mechanism of structuring consumer bills and do not effect change in the ownership and regulatory regime (i.e., enable the separation of ownership, procurement, and operations, depending on program design and prevailing ownership and regulatory structures) they can offer useful benefits that can better align stakeholder interests. For instance, if utilities are required to invest capital in the grid to accommodate DERs, rate design changes such as time-varying rates, can better align consumer and utility interests.
London Economics International LLC 25 contact: 717 Atlantic Ave, Suite 1A Bridgett Neely/Yemi Melka Boston, MA 02111 +1 (617) 9337229www.londoneconomics.com [email protected]

Under the status quo IOU ownership model, the utility’s primary interest is to maximize financial returns to utility owners and shareholders. On the other hand, ratepayers’ primary interest is to reduce electricity rates. While rate design changes such as time-varying rates and inclining block rates would meet the ratepayer interest in terms of increasing savings and promoting the adoption of DERs, they can adversely impact prevailing ownership and management interests by reducing the number of consumers under each rate class and subsequently increasing rates for remaining customer groups from which utilities can recover costs, given the decoupling regime in Hawaii.
In summary, aligning management, ownership, and ratepayer interests would require a careful combination of ownership, regulatory, and rate design changes. For instance, a transition from the status quo IOU ownership model to an SB (outside of the utility) model would better align stakeholder interests as the SB would be a stand-alone, not-for-profit entity and not own any generation or transmission assets which would cause it to favor utility interests over that of ratepayers. Alternatively, a transition to a co-op form of ownership would also effectively address misalignment of utility and ratepayer interests as co-ops are owned and controlled by their members who are also customers, as is the case for the island of Kauai. In both cases, a complimentary change in rate design is necessary to ensure the effective alignment of management, ownership, and ratepayer interests.
London Economics International LLC 26 contact: 717 Atlantic Ave, Suite 1A Bridgett Neely/Yemi Melka Boston, MA 02111 +1 (617) 9337229www.londoneconomics.com [email protected]

8 Conclusion
In assessing whether the benefits of ownership and regulatory model changes can be achieved through changes to Hawaii’s existing rate design, the Project Team evaluated a broad range of alternative rate designs including tiered rates (inclining and declining block rates), higher fixed charges, and time-varying rates (Time-of-Use (“TOU”) rates, Real-Time Pricing (“RTP”), Critical Peak Pricing (“CPP”)). Based on a high-level qualitative assessment of these rate designs, the Project Team concluded that rate design changes can be effective complementary mechanisms to ownership and regulatory changes and could help achieve some of Hawaii’s state energy goals such as increasing the adoption of DERs and other consumer side resources, lowering peak demand, and encouraging energy conservation.
Rate design has significant implications for utility and consumer incentives. On the consumer side, rate design is a key driver of when electricity is consumed and how much of it is consumed. Accordingly, rate design impacts overall levels of electricity demand for utilities, and as a result, the total cost incurred to generate and distribute electricity to consumers. If designed appropriately, rate design can be a useful complementary mechanism to ownership and regulatory models and can contribute to balancing the interests of consumers, utilities, and policy makers alike. For instance, when used in conjunction with a PBR regulatory model, rate design can serve as a useful mechanism to incentivize utilities to consider distributed generation in the utility planning process and accordingly meet distributed generation targets. In this case, rate design can play an essential role in balancing utility and customer interests, while advancing the priorities of policymakers. While this is one example of how rate design can be paired with a regulatory model, there are several combinations of rate design and ownership or regulatory models that can be considered to ensure the alignment of stakeholder interests, increased adoption of consumer side resources, and enhancement of a competitive distribution system.
It is important to note that the relative effectiveness of rate designs and their ability to achieve Hawaii’s energy goals are best assessed in light of any ultimate changes in ownership model or regulatory model. In order to do so, a detailed quantitative analysis would be required to identify the relative benefits of rate design changes and the most effective combinations of rate design with selected ownership and regulatory models.
London Economics International LLC 27 contact: 717 Atlantic Ave, Suite 1A Bridgett Neely/Yemi Melka Boston, MA 02111 +1 (617) 9337229www.londoneconomics.com [email protected]

9 Appendix A: Scope of work to which this deliverable responds
Task 3.1.1 Assessing whether benefits of changes from ownership and regulatory model changes could be accomplished through changes in rate design. CONTRACTOR shall provide a qualitative discussion on the extent benefits of ownership and regulatory model changes, including the alignment of utility interests with State policy, can be accomplished through changes in rate design.
DELIVERABLE FOR TASK 3.1.1. CONTRACTOR shall provide its conclusions and all work related to assessing whether the benefits of changes in ownership and regulatory model could be accomplished through changes in rate design. CONTRACTOR shall evaluate different potential changes in rate design qualitatively to consider the kinds of benefits they might offer the Hawaii electric power system. CONTRACTOR shall list the benefits and compare them to the benefits from the proposed changes to the ownership and regulatory model. CONTRACTOR shall then qualitatively assess them to consider whether the rate design changes can have a sufficiently large impact to be considered comparable to the ownership and regulatory model changes. The CONTRACTOR shall provide a written summary of the findings in MS Word and Power Point. CONTRACTOR shall submit deliverable for TASK 3.1.1 to the STATE for approval.
Task 3.1.2. Assessing how rate design compares to regulatory and ownership model changes considering overall market conditions. CONTRACTOR shall evaluate the ability of changes in rate design relative to ownership and regulatory model changes to (a) maximize consumer cost savings; (b) enable a competitive distribution system in which independent agents can trade and combine evolving services to meet customer and grid needs; (c) eliminate or reduce conflicts of interest in energy resource planning, delivery and regulation; and (d) align management, ownership, and ratepayer interests.
DELIVERABLE FOR TASK 3.1.2. CONTRACTOR shall provide its conclusions and all work related to considering how rate design compares to regulatory and ownership model changes in terms of maximizing consumer savings, enabling a competitive distribution system, reducing conflicts of interest in energy planning and dispatch, and aligning management, ownership, and ratepayer interests. CONTRACTOR shall consider different potential rate designs and the maximum possible impact in percentage terms that these rate designs might have on savings based on previous experience. In addition, CONTRACTOR shall consider the impact rate designs have on these overall market conditions and whether any changes to rate design could shift them. CONTRACTOR shall provide a written summary of the findings in MS Word and Power Point. CONTRACTOR shall submit deliverable for TASK 3.1.2 to the STATE for approval.
London Economics International LLC 28 contact: 717 Atlantic Ave, Suite 1A Bridgett Neely/Yemi Melka Boston, MA 02111 +1 (617) 9337229www.londoneconomics.com [email protected]

10 Appendix B: List of works consulted
Badtke-Berkow, Mina, et al. “Making the Most of Time-Variant Electricity Pricing.” Environmental Defense Fund, 2015, https://www.edf.org/sites/default/files/content/a_primer_on_tvp_for_edf_webpage.pdf.
Bonbright, James C. Principles of Public Utility Rates. 1961, http://media.terry.uga.edu/documents/exec_ed/bonbright/principles_of_public_utility_rat es.pdf.
Chitkara, Aman, et al. “A Review of Alternative Rate Designs.” Rocky Mountain Institute, May 2016, https://rmi.org/wp-content/uploads/2017/04/A-Review-of-Alternative-Rate-Designs-2016.pdf.
Colgan, John T., et al. Guidance for Utilities Commissions on Time of Use Rates: A Shared Perspective from Consumer and Clean Energy Advocates. 15 July 2017, https://uspirg.org/sites/pirg/files/reports/TOU-Paper-7.17.17.pdf.
Costello, Ken. “Alternative Rate Mechanisms and Their Compatibility with State Utility Commission Objectives.” National Regulatory Research Institute , Apr. 2014, http://nebula.wsimg.com/5a9a01aeb5f95984861ea4b20d2c903b?AccessKeyId=8AF7098D30C 5BF55909C&disposition=0&alloworigin=1.
HECO Companies. Rate & Regulations. Website. <https://www.hawaiianelectric.com/billing-and-payment/rates-and-regulations/hawaiian-electric-rates>. Access Date: March 8, 2018
HECO Companies. Time-of-Use Program. Website. <https://www.hawaiianelectric.com/save-energy-and-money/time-of-use-program>. Access date: March 8, 2018
Jeff, and David Kolata. “The Costs and Benefits of Real-Time Pricing.” Citizens Utility Board, November 2017, <https://citizensutilityboard.org/wp-content/uploads/2017/11/FinalRealTimePricingWhitepaper.pdf.>
KIUC. Energy Rate Adjustment Clause: Rate Data Sheet. Effective Date: March 1, 2018. Website. http://kiuc.coopwebbuilder2.com/sites/kiuc/files/PDF/rates/2018%20Rate%20Data.pdf
Lazar, Jim, and Wilson Gonzalez. “Smart Rate Design for a Smart Future.” RAP, July 2015, http://www.raponline.org/wp-content/uploads/2016/05/rap-lazar-gonzalez-smart-rate-design-july2015.pdf.
Lazar, Jim. “Global Best Practices in Residential Electric Rate Design.” Regulatory Assistance Project, May 2013, https://www.raponline.org/wp-content/uploads/2016/05/rap-lazar-globalratedesign-camunicipalratesgroup-2013-may.pdf.
Lazar, Jim. “Rate Design Where Advanced Metering Infrastructure Has Not Been Fully Deployed .” Regulatory Assistance Project, Apr. 2013, https://www.raponline.org/wp-content/uploads/2016/05/rap-lazar-ratedesignconventionalmeters-2013-apr-8.pdf.
London Economics International LLC 29 contact: 717 Atlantic Ave, Suite 1A Bridgett Neely/Yemi Melka Boston, MA 02111 +1 (617) 9337229www.londoneconomics.com [email protected]

“Massachusetts DPU Says Time of Use Pricing Will Be the Default for All Customers | Smart Grid Legal News.” Smart Grid Legal News, 26 June 2014, https://www.smartgridlegalnews.com/demand-response/massachusetts-dpu-says-time-of-use-pricing-will-be-the-default-for-all-customers/.
Wood, Lisa, et al. “Recovery of Utility Fixed Costs: Utility, Consumer, Environmental, and Economist Perspectives.” Electricity Markets and Policy Group, June 2016, https://emp.lbl.gov/sites/all/files/lbnl-1005742.pdf.
London Economics International LLC 30 contact: 717 Atlantic Ave, Suite 1A Bridgett Neely/Yemi Melka Boston, MA 02111 +1 (617) 9337229www.londoneconomics.com [email protected]

London Economics International LLC 1 contact: 717 Atlantic Ave, Suite 1A Cherrylin Trinidad/Tianying Lan Boston, MA 02111 617-933-7229www.londoneconomics.com [email protected]
Assessment of Hawaii’s electricity sector management: comparison of independent county with multi-county models
working paper prepared by London Economics International LLC for the State of Hawaii with support from Meister Consultants Group
September 26, 2018
London Economics International LLC (“LEI”), together with Meister Consultants Group, was contracted by the Hawaii Department of Business Economic Development and Tourism (“DBEDT”) to conduct a study that will evaluate the costs and benefits of various electric utility ownership and regulatory models that can support the State in achieving its energy goals. This document, which corresponds to Task 3.1.3, is one of several working papers associated with that engagement. This paper assesses two models when it comes to the management of Hawaii’s electricity sector: (1) independent single-county model; and (2) multi-county model.
The single-county model is the status quo because the operations and management of electric
systems are standalone and independent of each county (island). In contrast, under the multi-
county model, two or more counties are assumed to be interconnected via inter-island
transmission lines, which enable joint operations and dispatch resources these counties. Our
preliminary evaluation of these models shows that the multi-county model works better when
the models are evaluated relative to the state criteria.
Finally, the Project Team analyzed the recommended ownership and regulatory models under the
single-county vs. multi-county approaches. We found that the cooperative model would be easier
to implement under the single-county approach while the Single Buyer outside the utility model,
Integrated Grid Operator, and Light Hawaii Electricity Reliability Administrator (“HERA”)
model would be more cost-effective under the multi-county approach. Meanwhile, other
ownership and regulatory models such as the performance-based regulation (“PBR”) and
distribution system platform provider (“DSPP”) would not be affected significantly whether the
management of the electric systems is single county or multi-county.
Table of Contents
LIST OF ACRONYMS ............................................................................................................................................... 3
1 EXECUTIVE SUMMARY ................................................................................................................................ 4
2 INTRODUCTION AND SCOPE ....................................................................................................................... 6
3 OVERVIEW OF SINGLE-COUNTY MODEL VS. MULTI-COUNTY MODEL ....................................... 8
3.1 SIMILARITIES BETWEEN SINGLE-COUNTY AND MULTI-COUNTY MODELS ....................................................... 9 3.2 DIFFERENCES BETWEEN THE SINGLE-COUNTY MODEL AND MULTI-COUNTY MODEL ................................... 10
4 ADVANTAGES AND DISADVANTAGES OF EACH MODEL................................................................. 11
4.1 SINGLE-COUNTY MODEL ............................................................................................................................. 11 4.1.1 Advantages ............................................................................................................................................. 11 4.1.2 Disadvantages ........................................................................................................................................ 12
4.2 MULTI-COUNTY MODEL .............................................................................................................................. 12 4.2.1 Advantages ............................................................................................................................................. 12

London Economics International LLC 2 contact: 717 Atlantic Ave, Suite 1A Cherrylin Trinidad/Tianying Lan Boston, MA 02111 617-933-7229 www.londoneconomics.com [email protected]
4.2.2 Disadvantages ........................................................................................................................................ 12
5 EVALUATION OF EACH MODEL RELATIVE TO STATE CRITERIA ............................................... 14
5.1 ABILITY TO MEET STATE ENERGY GOALS .................................................................................................... 15 5.2 MAXIMIZE CONSUMER COST SAVINGS ......................................................................................................... 17 5.3 ENABLE A COMPETITIVE DISTRIBUTION SYSTEM ......................................................................................... 17 5.4 ADDRESS CONFLICTS OF INTEREST .............................................................................................................. 18 5.5 ALIGN STAKEHOLDER INTERESTS ................................................................................................................ 18
6 ADDITIONAL ANALYSIS OF OWNERSHIP AND REGULATORY MODELS .................................... 20
6.1 OWNERSHIP MODELS................................................................................................................................... 20 6.2 REGULATORY MODELS ................................................................................................................................ 22
7 APPENDIX A: SCOPE OF WORK TO WHICH THIS DELIVERABLE RESPONDS ........................... 23
8 APPENDIX B: LIST OF WORKS CONSULTED ........................................................................................ 24
Table of Figures FIGURE 1. STATE’S KEY CRITERIA FOR EVALUATING THE MODELS ............................................................................... 6 FIGURE 2. SERVICES THAT ARE SHARED OR INDEPENDENTLY PROVIDED UNDER HECO COMPANIES’ ONE
COMPANY INITIATIVE .......................................................................................................................................... 8 FIGURE 3. ADVANTAGES AND DISADVANTAGES OF EACH MODEL ............................................................................ 11 FIGURE 4. SUMMARY OF EVALUATION: UTILITIES’ MANAGEMENT AND OPERATIONS.............................................. 14 FIGURE 5. HAWAII’S ENERGY POLICY DIRECTIVES ...................................................................................................... 15 FIGURE 6. COMPARISON OF OWNERSHIP AND REGULATORY MODELS UNDER SINGLE-COUNTY AND MULTI-COUNTY
SCENARIOS .......................................................................................................................................................... 20

London Economics International LLC 3 contact: 717 Atlantic Ave, Suite 1A Cherrylin Trinidad/Tianying Lan Boston, MA 02111 617-933-7229 www.londoneconomics.com [email protected]
List of acronyms
CEO Chief Executive Officer
DBEDT Hawaii Department of Business Economic Development and Tourism
DER Distributed energy resources
DSPP Distributed System Platform Provider
HECO Hawaiian Electric Company
HELCO Hawaii Electric Light Company
HERA Hawaii Electricity Reliability Administrator
HSEO Hawaii State Energy Office
IGO Integrated Grid Operator
IPP Independent power producers
KIUC Kauai Island Utility Cooperative
LEI London Economics International LLC
MECO Maui Electric Company
PBR Performance-based ratemaking
PSIP Power Supply Improvement Plan
PUC Public Utilities Commission
RPS Renewable Portfolio Standards

London Economics International LLC 4 contact: 717 Atlantic Ave, Suite 1A Cherrylin Trinidad/Tianying Lan Boston, MA 02111 617-933-7229 www.londoneconomics.com [email protected]
1 Executive summary
London Economics International LLC (“LEI”) was contracted by the Hawaii Department of Business Economic Development and Tourism (“DBEDT”) to conduct a study that will evaluate the costs and benefits of various electric utility ownership models and regulatory models that can support the State in achieving its energy goals. This working paper, which responds to Task 3.1.3 in the project scope of work, provides an assessment of managing Hawaii’s electricity sector with each county operating independently as compared to a multi-county model.
The Project Team analyzed the single-county vs. the multi-county models from the perspective of utilities’ management and operations—how the utilities operate the electricity system—from sourcing the supply to dispatching the electrons. The single-county model is the status quo because grids in each county (island) are isolated from those in other counties. Therefore, the operations and management of electric systems are standalone and independent in each county. In contrast, the multi-county model has two or more counties that are interconnected via inter-island transmission lines, which enable joint operations and the dispatch of resources in two or more counties.
Each model has its advantages and disadvantages. The current single-county model provides easier management and operations of the electricity system in each county because the local utility leadership can make operational decisions immediately. Moreover, local utilities are likely to be more aware of what is happening in their respective counties, enabling them to act based on county-specific needs. On the other hand, a multi-county model could better utilize the available renewable resources in each county because of the inter-island connection. This would then potentially lower the total cost of management and operations, thereby, reducing retail rates for electric consumers. However, the upfront costs of building and operating the interisland cables are high, making it a controversial topic that triggers significant socio-economic challenges in the past.
Moreover, the Project Team assessed the performance of each model relative to the policy goals established by the State for the energy sector. We found that the multi-county model better addresses 3 of the State’s priorities while the single-county model is better suited for 2 of the State’s priorities. The multi-county model received a better rating in the ability to meet state energy goals, maximize consumer cost savings, and enable a competitive distribution system. In contrast, the single-county model works better in addressing conflicts of interest and aligning stakeholder interests.
Finally, the Project Team performed an analysis of how the single-county and multi-county approach would affect the implementation of the recommended ownership and regulatory models. While most of the models would not be impacted by either approach, it would be easier to implement the cooperative model under the single-county approach. Meanwhile, the Single

London Economics International LLC 5 contact: 717 Atlantic Ave, Suite 1A Cherrylin Trinidad/Tianying Lan Boston, MA 02111 617-933-7229 www.londoneconomics.com [email protected]
Buyer outside the utility model1, Integrated Grid Operator2 and Light HERA3 (segments of the Hybrid regulatory model) would be more cost-effective under the multi-county approach (see Section 6).
1 The single buyer is not only ring-fenced from the other business entities of the utility but is outside of the utility.
2 As discussed in Task 2.2.1, the functions of the ISO and the independent distribution system operator are combined in an Independent Grid Operator (“IGO”) model. Given the smaller size of Hawaii’s transmission systems (compared to other jurisdictions), combining these two regulatory models would be more effective and efficient in its context.
3 A Light HERA was also considered as an alternative option to HERA. Under the Light HERA, HERA (the entity) could perform as an ombudsman and an appeals body focused on hosting capacity and interconnection. It would have the technical capability to set target timeframes and standard models for calculating interconnection costs—in cases when a customer wants to challenge utility interconnection behavior or lack of hosting capacity transparency. See Task. 2.1.1. for more description of the Light HERA.

London Economics International LLC 6 contact: 717 Atlantic Ave, Suite 1A Cherrylin Trinidad/Tianying Lan Boston, MA 02111 617-933-7229 www.londoneconomics.com [email protected]
2 Introduction and scope
The Hawaii Department of Business, Economic Development and Tourism (“DBEDT”) was directed by the state legislature to commission a study that will evaluate the costs and benefits of various electric utility ownership models and regulatory models, which can facilitate the achievement of the State’s energy goals. London Economics International LLC (“LEI”), through a competitive sealed proposals procurement,4 was contracted to perform this study.5
The project aims to evaluate the different utility ownership and regulatory models for Hawaii and the ability of each model to achieve the State’s key criteria6 (Figure 1).
Figure 1. State’s key criteria for evaluating the models
Source: Scope of Services under Contract No. 65595
The study will help in understanding the long-term operational and financial costs and benefits of electric utility ownership and regulatory models that could serve each county. Moreover, it
4 Request for Proposals for a Study to Evaluate Utility Ownership and Regulatory Models for Hawaii (RFP17-020-SID).
5 Hawaii Contract No. 65595 between DBEDT and LEI signed on March 23, 2017.
6 House Bill No. 1700 Relating to the State Budget.
Achieve State energy goals
Maximize consumer cost savings
Enable a competitive distribution system in
which independent agents can trade and
combine evolving services to meet
customer and grid needs
Eliminate or reduce conflicts of interest in
energy resource planning, delivery, and
regulation

London Economics International LLC 7 contact: 717 Atlantic Ave, Suite 1A Cherrylin Trinidad/Tianying Lan Boston, MA 02111 617-933-7229 www.londoneconomics.com [email protected]
will also aid in identifying the process that must be followed in forming such ownership and regulatory models as well as determining whether such models would create synergies in terms of increasing local control over energy sources serving each county, the ability to diversify energy resources, economic development, reducing greenhouse gas emissions, improving system reliability and power quality, and lowering costs to all consumers.7
This deliverable is responsive to Task 3.1.3 in the project scope of work.8 It analyzes the relative advantages and disadvantages of the models, that is when each county is operating independently or collectively as a part of a multi-county model, which may involve the ownership of electric utilities in two or more counties. The evaluation is governed by a set of criteria, which assess the models in terms of ability to 1) achieve State energy goals; 2) maximize consumer cost savings; 3) enable a competitive distribution system in which independent agents can trade and combine evolving services to meet customer and grid needs; and 4) eliminate or reduce conflicts of interest in energy resource planning, delivery, and regulation.
7 Hawaii Contract No. 65595. Scope of Services.
8 This task involves a high-level overview, which may not include all of the detailed nuances, conditions and exceptions that may apply under certain circumstances, which are beyond the scope of this task.

London Economics International LLC 8 contact: 717 Atlantic Ave, Suite 1A Cherrylin Trinidad/Tianying Lan Boston, MA 02111 617-933-7229 www.londoneconomics.com [email protected]
3 Overview of single-county model vs. multi-county model
Currently, Hawaiian Electric Company, Inc (“HECO”) and its subsidiaries, Maui Electric Company (“MECO”) and Hawaii Electric Light Company (“HELCO”)—collectively known as the HECO Companies—serve about 95% of Hawaii’s population through its electric utilities. The island of Kauai is served by the Kauai Island Utility Cooperative (“KIUC”), which serves the remaining 5% of Hawaii’s customers. The discussion in this memo will focus on the utilities in the three counties only because the electric system in Kauai is operated separately by KIUC and there is little chance that it would be operated along with other utilities.
In this section, the Project Team focuses on the perspective of utilities’ management and operations. Currently, the HECO Companies operate as a single-county model; each utility covers a single county. MECO and HELCO are subsidiaries under HECO, and certain functions and teams are shared or closely collaborated among these utilities. However, MECO and HELCO are separate entities that manage and operate their systems independently, and as required by the Hawaii Public Utilities Commission (“PUC”), HECO, MECO, and HELCO submit rate filings separately. Moreover, the grids in each county are isolated from each other—this means that each county’s utility has its own control center and operates the system independently. Therefore, from the perspective of utilities’ management and operations, the status quo is regarded as a single-county model. Figure 2 summarizes the services that are shared or independently provided under HECO Companies’ One Company Initiative.
Figure 2. Services that are shared or independently provided under HECO Companies’ One Company Initiative
Note: Independent areas were identified by comparing the list of departments under shared services with the list of all departments in HECO’s website.
Source: HECO Companies. Hawaiian Electric Company 2017 Test Year Rate Case – One Company Initiative. Docket No. 2016-0328. Page 1. HEI. Corporate Governance. Website. <http://www.hei.com/CustomPage/Index?keyGenPage=1073751876>. Access Date: September 5, 2018.
Alternatively, there could be a multi-county model where the utility in each county operates in more enhanced coordination with other county utilities. This would mean that the utility would manage and operate the system in two or more counties—this requires inter-island transmission that connects these counties. Once the grids are connected, the utility would be able to manage

London Economics International LLC 9 contact: 717 Atlantic Ave, Suite 1A Cherrylin Trinidad/Tianying Lan Boston, MA 02111 617-933-7229 www.londoneconomics.com [email protected]
the demand and supply in these counties jointly, requiring one control center only for the dispatch of resources.
The comparison of the single-county and multi-county models is below.
3.1 Similarities between single-county and multi-county models
The single-county and multi-county models have several similarities, and some of them are discussed below:
• Neither model depends on the ownership of the utilities. From the perspective of utilities’ management, the single-county model holds as long as each utility covers one and only one county while the multi-county model applies when a utility works in two or more counties, which are interconnected. These definitions do not change if the ownership of utility changes. For instance, if there is a cooperative that covers two counties and they are interconnected, it is still considered as a multi-county model.
• Both models involve cooperation and collaboration among different counties, to some extent. Under the current single-county model, MECO and HELCO are independent entities but are subsidiaries of HECO. In fact, some of their management team have worked or continue to work for two entities. For instance, currently, the same Board of Directors serves both MECO and HELCO and all of them are working or have worked as top executives at HECO. The executive management team of HECO includes both the Presidents of HELCO and MECO. Moreover, some departments provide supportive services (or “shared services”)—such as legal, regulatory, system planning, independent power producer negotiations and renewable acquisitions, environmental consulting, IT services related to Enterprise Information Systems and finance—for HECO, MECO, and HELCO.9 Meanwhile, some departments, including those that require communication with the local community on the ground, are operated within HECO, MECO, and HELCO separately. Moreover, the HECO Companies are considering expanding shared services to the core operating areas of Power Supply, Energy Delivery, and System Operation.10 This structure means having or implementing a reporting line within one single company.
However, if some or all the islands (except Kauai) become interconnected under the multi-county model, HECO could manage the single integrated network, increasing the level of cooperation and collaboration among different counties further. For instance, the management of the control room could be under one team because one interconnected system would cover multiple counties.
9 HECO Companies. Hawaiian Electric Company 2017 Test Year Rate Case – One Company Initiative. Docket No. 2016-0328. Page 1.
10 Ibid, page 2.

London Economics International LLC 10 contact: 717 Atlantic Ave, Suite 1A Cherrylin Trinidad/Tianying Lan Boston, MA 02111 617-933-7229 www.londoneconomics.com [email protected]
• Under both models, the utilities take the broad picture of multi-counties into account in their strategic plans. This is obvious under the multi-county model if two or more counties are interconnected. However, even under the current single-county model, HECO Companies have one single filing that presents a general picture of three counties covered by HECO, MECO, and HELCO in the strategic plans. Strategic plans referred to by the Project Team show that they share similar or complementing grid modernization strategy, sustainability reports, and power supply improvement plans.
3.2 Differences between the single-county model and multi-county model
From the utility’s perspective, the fundamental difference between the single-county model and multi-county model is the presence of inter-island transmission lines in the latter model. The inter-island transmission would connect two or more counties with each other and, thereby, enable a utility to make strategic plans based on aggregated supply and demand and manage and operate the electric system of two or more counties.

London Economics International LLC 11 contact: 717 Atlantic Ave, Suite 1A Cherrylin Trinidad/Tianying Lan Boston, MA 02111 617-933-7229 www.londoneconomics.com [email protected]
4 Advantages and disadvantages of each model
In this section, we provide a high-level overview of the potential advantages and disadvantages of each model. Figure 3 summarizes them.
Figure 3. Advantages and disadvantages of each model
4.1 Single-county model
As mentioned earlier, the single-county model is the current structure (status quo) in Hawaii, where there is no inter-island transmission connection. As a result, the utility of each island is relatively independent.
4.1.1 Advantages
Although MECO and HELCO are subsidiaries of HECO and the management and operations in each county are independent, certain collaboration and shared resources/services still exist. HECO, as the parent company, makes decisions on broad strategic plans together with MECO and HELCO while the local utility decides specific projects implementation for their respective county. For instance, on procurement, MECO and HELCO coordinate with HECO staff to get their support in negotiations with independent power producers and renewable acquisitions but when it comes to interconnection, technical staff in each local utility company process the interconnection request. This procedure enables collaboration among counties but also allows flexibility in implementation cognizant of the unique characteristics of each county.
Moreover, some stakeholders on neighboring counties oppose inter-island transmission because the interconnection between islands may cause unintended advantages for Oahu at the cost of

London Economics International LLC 12 contact: 717 Atlantic Ave, Suite 1A Cherrylin Trinidad/Tianying Lan Boston, MA 02111 617-933-7229 www.londoneconomics.com [email protected]
neighboring counties. 11 Naturally, the single-county model (status quo) has broader social support because the current structure (without inter-island transmission) gives greater local control of the electric system compared with the system in a multi-county model (with inter-island transmission).
4.1.2 Disadvantages
The absence of inter-island transmission likely leads to a mismatch of resources among counties. For instance, the City and County of Honolulu has the highest demand among all the counties, but the renewable resources are relatively limited there compared with the wind resources in the County of Maui and geothermal resources in the County of Hawaii. Under the single-county model, resources are dispatched to each county (island) independently, resulting in one control center and functional teams per county (island). Without the inter-island transmission, coordination in terms of dispatch and system operations between counties is limited. Therefore, the management and operations under the single-county model are observed to be less efficient compared with the multi-county model.
4.2 Multi-county model
Inter-island transmission that connects two or more counties is the foundation of the multi-county model and the reason why it is differentiated from a single-county model. It enables two or more interconnected counties to be managed and operated by one utility. Therefore, demand and supply on these counties can be aggregated and dispatched together in one system.
4.2.1 Advantages
Interconnected counties only need one control center and set of functional teams that cover multiple counties. This would lower the staff costs. The interconnected system would help to better utilize excess renewable resources from certain counties (i.e., reduce the curtailment) to meet the demand from other counties. If designed and operated effectively, this would help reduce the volatility of electricity rates by replacing local oil-fired generation with renewable generation from other counties. Moreover, an efficient system could potentially lower the retail rates for electric consumers as well.
4.2.2 Disadvantages
However, economic, political and social challenges for inter-island transmission are significant. First, many stakeholders interviewed for this Study are concerned about the high capital costs of such an inter-island transmission project and whether that would result in higher electric rates for consumers. HECO Companies evaluated the cost of inter-island transmission among Oahu, Maui, and Hawaii Island and determined that it would be around $600 million.12 However, whether the benefit will be higher than the costs may require further analysis, which is not part
11 HECO Companies. PSIP Update Report. December 23, 2016. Book 3. Page H-52.
12 HECO Companies. PSIP Update Report. December 23, 2016. Book 1. Page 3-14.

London Economics International LLC 13 contact: 717 Atlantic Ave, Suite 1A Cherrylin Trinidad/Tianying Lan Boston, MA 02111 617-933-7229www.londoneconomics.com [email protected]
of the scope of this Study. Second, some stakeholders from neighboring counties question whether the interconnection will benefit Oahu only, especially at the costs of neighboring counties.13 Stakeholders are also concerned that county-specific would not be heard if multiple counties are connected to be one system. Third, some stakeholders are concerned with the potential negative impact on the environment. 14 Finally, it would be challenging to obtain consensus on the establishment of an inter-island transmission of the communities in the neighboring counties. Box 1 carries a discussion of prevailing opinions and studies related to these concerns.
13 HECO Companies. PSIP Update Report. December 23, 2016. Book 3. Page H-52.
14 For instance, an inter-island cable might have impacts on marine mammals and deep-sea corals, etc. Source: HECO Companies. PSIP Update Report. December 23, 2016. Book 3. Page H-52.
Controversial topic: Inter-island transmission in the Hawaii context
The building of an inter-island transmission has always been a controversial topic in Hawaii for a long period of time. In 2013, Docket 2013-0169—which discusses whether inter-island cables were in the public interest—was opened but it has been inactive for a while.
Studies that revealed different opinions had also been conducted. For instance, DBEDT analyzed the costs and benefits of an inter-island transmission cable connecting Oahu and Maui in 2013 and concluded on an economic basis that the net benefits of the inter-island connection outweigh the costs. In addition to the overall cost savings to ratepayers, the report also stated that the inter-island transmission cable would reduce dependence on fossil fuels, lower fuel costs and provide less exposure to price volatility, increase flexibility in siting new renewable energy generation, reduce curtailment of renewable generation, and lower the operating reserve requirements, among others.
Meanwhile, the HECO Companies—as stated in the 2014 Power Supply Improvement Plan (“PSIP”)—evaluated the interconnection between Oahu and Maui island, but found that the gross benefits were “substantially less than the estimated cost of a cable.” However, in the December 2016 PSIP, the HECO Companies evaluated the potential inter-island transmission among Oahu, Maui, and Hawaii Island again by conducting a break-even analysis. The analysis assumes various copper plate configurations and then compares the benefits against $600 million. According to E3 Copper-plate Plans, the present value benefit of the cable is $3 billion, which is “sufficiently large enough to justify further analysis of the feasibility, configuration and cost effectiveness of inter-island interconnections.”
Source: DBEDT. Initial Public Comments in Response to Hawaii PUC Order No. 31356 (Docket No. 2013-0169). HECO Companies. 2016 PSIP.

London Economics International LLC 14 contact: 717 Atlantic Ave, Suite 1A Cherrylin Trinidad/Tianying Lan Boston, MA 02111 617-933-7229www.londoneconomics.com [email protected]
5 Evaluation of each model relative to State criteria
The assessment of the single-county and multi-county models relative to State’s criteria is both qualitative and high-level. Results are subject to refinement as the project proceeds and receives more feedback from stakeholders. The evaluation mechanism is intended as a thought exercise in comparing the single-county with the multi-county models. There are two models only under evaluation, so the Project Team identified the model that meets each State criteria more effectively. Figure 4 shows a summary of the findings.
Figure 4. Summary of evaluation: Utilities’ management and operations
Overall, the multi-county model meets three of the state goals while the current single-county model is better in meeting two of the state goals. If designed and implemented correctly, the multi-county model with inter-island transmission could help achieve the 100% RPS goal faster, maximize consumer cost savings,15 and enable a competitive distribution system that covers two or more counties. However, specific concerns such as potentially greater conflicts of interests in energy resource planning and delivery among different counties and wider gap among stakeholder interests would need to be addressed.
The two models are evaluated based on their ability to address the following state goals, which are the same criteria used in the evaluation of ownership and regulatory models.
i. meet state energy goals, particularly Hawaii’s mandated RPS goal of 100% renewableenergy by 2045;
15 This is based on the assumption that the benefits of the inter-island transmission will be higher than the costs, which are the results of DBEDT’s study in 2014 and also result of HECO’s study in PSIP 2016.
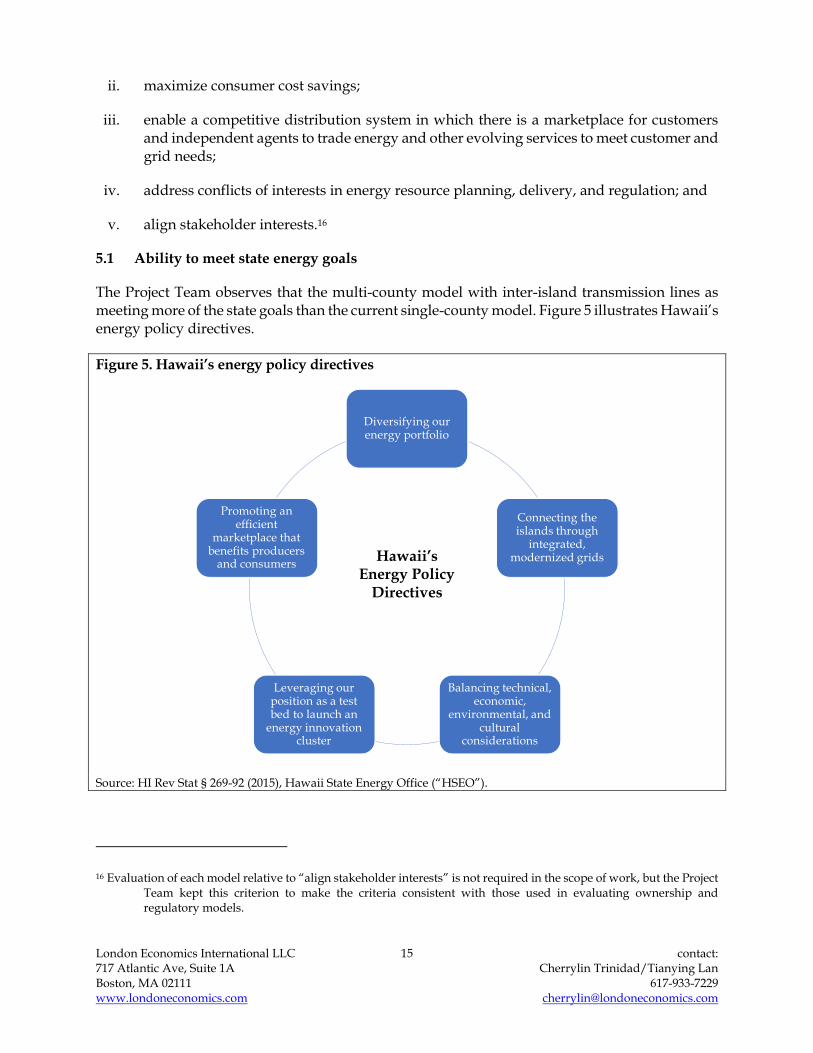
London Economics International LLC 15 contact: 717 Atlantic Ave, Suite 1A Cherrylin Trinidad/Tianying Lan Boston, MA 02111 617-933-7229www.londoneconomics.com [email protected]
ii. maximize consumer cost savings;
iii. enable a competitive distribution system in which there is a marketplace for customersand independent agents to trade energy and other evolving services to meet customer andgrid needs;
iv. address conflicts of interests in energy resource planning, delivery, and regulation; and
v. align stakeholder interests.16
5.1 Ability to meet state energy goals
The Project Team observes that the multi-county model with inter-island transmission lines as meeting more of the state goals than the current single-county model. Figure 5 illustrates Hawaii’s energy policy directives.
Figure 5. Hawaii’s energy policy directives
Source: HI Rev Stat § 269-92 (2015), Hawaii State Energy Office (“HSEO”).
16 Evaluation of each model relative to “align stakeholder interests” is not required in the scope of work, but the Project Team kept this criterion to make the criteria consistent with those used in evaluating ownership and regulatory models.
Diversifying our energy portfolio
Connecting the islands through
integrated, modernized grids
Balancing technical, economic,
environmental, and cultural
considerations
Leveraging our position as a test bed to launch an
energy innovation cluster
Promoting an efficient
marketplace that benefits producers
and consumersHawaii’s
Energy Policy Directives

London Economics International LLC 16 contact: 717 Atlantic Ave, Suite 1A Cherrylin Trinidad/Tianying Lan Boston, MA 02111 617-933-7229www.londoneconomics.com [email protected]
Hawaii has one of the most aggressive renewable energy targets in the country. As mentioned above, it aims for its utilities to generate 100% of their electricity from renewable energy by 2045.17 Although there are other policy directives (Figure 5), for this criterion, the Project Team focused on Hawaii’s target to achieve 100% of their electricity from renewable energy by 2045. The other policy directives are covered by the other criteria. For example, “balancing technical, economic, environmental, and cultural considerations” is reflected in criteria (v): align stakeholder interests. Likewise, “promoting an efficient marketplace that benefits producers and consumers” is substantially similar to “enabling a competitive distribution system.”
Hawaii’s utilities have made substantial progress toward the 100% renewables target under the status quo. All but one of the utilities are ahead of the current intermediate RPS target of 30% by 2020.18 This indicates that the State’s renewable energy goals are currently on-track under the status quo. This state-focused target allows the PUC to push the utilities toward the RPS targets while giving them enough flexibility to design tailored strategies for each county as well as make effective strategic plans collectively.
Changing to the multi-county model with inter-island transmission system can support the achievement of the State’s energy targets further. One of the current challenges with increasing renewable generation is how renewable resources could be better utilized in each county. If abundant generation resources in one county could help meet demand in another, it would assist in addressing the concerns of curtailment and resource adequacy at the same time.
17 HI Rev Stat § 269-92 (2015).
18 HB623 HD2 SD2 CD1, Relating to Renewable Standards. House of Representatives, Twenty-Eight Legislature, 2015. State of Hawaii. Web. Accessed May 10, 2017.
Implementation of the Renewable Portfolio Standards goals
As required in House Bill (“HB”) 623, each electric utility company in Hawaii should achieve 100% of renewable electrical energy sales by 2045, and “an electric utility company and its electric utility affiliates may aggregate their renewable portfolios to achieve the renewable portfolio standard.”* This means that HECO, MECO, and HELCO could combine their renewable energy sales to achieve the RPS targets. Alternatively, the RPS targets could be set up in a way that each electric utility must achieve 100% renewable goal independently for each county.
An ownership change of one utility within HECO Companies could result in this condition. For instance, if MECO and HELCO become independent entities outside of HECO Companies, the new utilities have to meet the 100% renewable goal on their own as they are not affiliated with any parent company. Without collaboration among counties, relying solely on local resources to achieve 100% RPS goal could be challenging for some counties.
* Source: HB 623

London Economics International LLC 17 contact: 717 Atlantic Ave, Suite 1A Cherrylin Trinidad/Tianying Lan Boston, MA 02111 617-933-7229www.londoneconomics.com [email protected]
5.2 Maximize consumer cost savings
The multi-county model (with inter-island transmission) is better than the current single-county model in maximizing consumer cost savings.
The City and County of Honolulu is the economic center in the State of Hawaii. Some neighboring islands such as Molokai and Hawaii have greater social and economic challenges than Oahu. Moreover, all the neighboring counties face higher electricity rates than the City and County of Honolulu because of higher fuel costs. As a result, high electricity rate poses more significant challenges to some neighboring counties especially to the low-income class than to Honolulu. During the outreach, many stakeholders in neighboring counties commented that lowering electricity costs is the top priority for them (even more important than achieving the 100% renewable goal).19
Admittedly, building inter-island transmission lines will bring significant upfront costs. However, it could bring more benefits to consumers in the long term particularly if designed and implemented effectively. According to the study from DBEDT, an Oahu-Maui grid tie could reduce electricity rates of up to 0.6 cents per kWh while the overall net savings on both islands were estimated to reach $423 million (net present value) in the period 2020 to 2050.20 Similarly, HECO Companies’ E3 Copper-plate Plans noted that the present value benefit of the inter-island cable is $3 billion, as mentioned earlier in the textbox.”21
5.3 Enable a competitive distribution system
The multi-county model with an inter-island transmission cable could better facilitate the achievement of the state energy goal on enabling a competitive distribution system particularly in terms of utilities’ management and operations.
A competitive distribution system is one “in which independent agents can trade and combine evolving services to meet customer and grid needs.”22 This goal requires the evolution of grid operations and services away from the traditional utility business model where the utility has a monopoly over the sale of electricity and other limited services to the customer. If inter-island cables are constructed, the grids that connect two or more counties could create a competitive distribution system. Moreover, the combined generation will be significantly higher than the isolated generation in each island—this could serve as a basis for the centralized competitive distribution system. Therefore, considering the potential of inter-island connection under the multi-county model, the Project Team scored the multi-county model more “favorably” than the single-county model under this criterion.
19 For instance, in the County of Hawaii, stakeholders identified reducing rates as the highest priority. Source: deliverable under Task 2.2.5 Stakeholder Workshop Summary: Regulatory Models.
20 HSEO. Oahu-Maui Grid Tie. Website. <http://energy.hawaii.gov/renewable-energy/oahu-maui-gridtie>
21 HECO Companies. PSIP Update Report. December 23, 2016. Book 1. Page 3-14.
22 Hawaii Contract No. 65595. Scope of Services.

London Economics International LLC 18 contact: 717 Atlantic Ave, Suite 1A Cherrylin Trinidad/Tianying Lan Boston, MA 02111 617-933-7229www.londoneconomics.com [email protected]
5.4 Address conflicts of interest
Conflicts of interest can take place among utility shareholders, ratepayers, regulators, and market participants like independent power producers (“IPPs”) and distributed energy resources (“DER”) providers in matters of energy resource planning, energy delivery, and regulation. Addressing conflicts of interest requires the participation of local communities and the consideration of county-specific characteristics such as energy resources and culture.
The current single-county model scores “better” because the current single-county model, in theory, would allow more local participation in managing electric systems in each county because the electric system in each county stands alone. As discussed above, some stakeholders are concerned about the imbalanced distribution of costs and benefits in each county if the inter-island transmission lines are constructed under the multi-county model. 23 Box 3 carries a narrative about a transformative experience in a ‘standalone’ island in Scotland in terms of electricity.
5.5 Align stakeholder interests
Aligning stakeholder interests is similar to the previous criterion but with more focus on whether stakeholder interests are aligned rather than whether conflicts can be resolved. The multi-county model is again the less favorable model vis-a-vis alignment of stakeholder interests. This is because the current single-county model enables wider participation of stakeholders from each
23 HECO Companies. PSIP Update Report. December 23, 2016. Book 3. Page H-52.
Leadership from the community: Isle of Eigg’s electricity transformation
The Isle of Eigg is a small island off the coast of Scotland with approximately 100 residents. The installed capacity is around 250 kW, which is about 18% of the installed capacity (13.7 MW) in Lanai. Prior to 2007, power in the Isle of Eigg was generated at homes and businesses using diesel. Later, the community drove a transformation of the electricity system after recognizing the drawbacks of relying on diesel alone. According to the Rocky Mountain Institute, leadership from the community is a unique feature of the transformation. The residents decided to create an integrated plan for a new connected electricity system rather than create an electrical connection to the mainland grid. Throughout the process, the community was forced to learn by doing, including “applying for grant funding, securing permission to build, finding a contractor to design and build the system, and training local residents on how to operate and repair the renewable microgrid.” As a result, a team of local residents are able to maintain the system and “ensure reliable electricity for all community members.”
Source: Rocky Mountain Institute and Carbon War Room. Renewable Microgrids: Profiles from Islands and Remote Communities across the Globe. November 2015.
Source: NERC. History of NERC. August 2013
London Economics International LLC 19 contact: 717 Atlantic Ave, Suite 1A Cherrylin Trinidad/Tianying Lan Boston, MA 02111 617-933-7229www.londoneconomics.com [email protected]
county in the decision-making process, eventually aligning interests better between stakeholders in the City and County of Honolulu and the neighboring counties. During the stakeholder outreach conducted in each island between June 12th and June 22nd, 2018, several stakeholders raised the issue that the HECO Companies’ decision making, as well as some of the PUC’s policies, are favoring Oahu.24
If the inter-island transmission is built, the City and County of Honolulu as the demand center could be supplied with excess generation from neighboring counties. This could lead to further conflicts of interests with stakeholders in the other counties. As a result, the interests of stakeholders in neighboring counties could be misaligned with that of stakeholders in the City and County of Honolulu.
24 For more information, please see the deliverable under Task 2.2.5 Stakeholder Workshop Summary: Regulatory Models.

London Economics International LLC 20 contact: 717 Atlantic Ave, Suite 1A Cherrylin Trinidad/Tianying Lan Boston, MA 02111 617-933-7229www.londoneconomics.com [email protected]
6 Additional analysis of ownership and regulatory models25
Moreover, the Project Team analyzed how the single-county model and multi-county model would affect the implementation of the ownership and regulatory models that were identified and recommended in Tasks 1.2.5 and 2.2.6. Figure 6 shows a summary of the results.
Figure 6. Comparison of ownership and regulatory models under single-county and multi-county scenarios
Note: PBR: performance-based ratemaking, HERA: Hawaii Electricity Reliability Administrator, DSPP: Distributed System Platform Provider, IGO: Integrated Grid Operator.
6.1 Ownership models
Based on the Project Team’s analyses, the four most favorable models (when it comes to ownership models) are the cooperative model, status quo, Single Buyer within the utility, and Single Buyer outside the utility. Since the analysis in Section 3 and 4 is based on the status quo, this section focuses on the other three models.
Cooperative
Given the unique features of each county, it would be easier to implement the cooperative model under the single-county model. A cooperative under a single county model would be able to facilitate more local control in the decision-making process—this would allow close alignment of
25 From the perspective of utilities’ management and operations only.

London Economics International LLC 21 contact: 717 Atlantic Ave, Suite 1A Cherrylin Trinidad/Tianying Lan Boston, MA 02111 617-933-7229www.londoneconomics.com [email protected]
utility activities and goals with community priorities. Moreover, stakeholders within the single county would feel that they have more voice and decision-making power since all the Board members come from the same county.
On the other hand, a cooperative under a multi-county model would not likely provide the same “close alignment” as the single county model because the Board members would have to take the priorities of two or more counties into account. Therefore, the focus would be shared by different counties instead of being enjoyed by one county only. Furthermore, the cooperative model under the multi-county scenario might not even be possible in the state given the farm bill population limits on the definition of “rural.” Some sources of co-op funding have specific requirements as to the size of the cooperative. More specifically, the Rural Utilities Service (“RUS”) funding26 is only available for areas with populations smaller than 20,000—this would allow island-wide cooperatives on in Molokai and Lanai only. As discussed in Task 1.2.3, the amended farm bill would not allow the creation of an island-wide cooperative in Oahu or the alteration of analysis in any other island.
Single Buyer within the utility
Under the Single Buyer within the utility model, the Single Buyer is owned by the incumbent utility, but ring-fenced from the functions of the existing utility in terms of legal status, financial accounts, and operations. This includes separated buildings, branding, employees, and information technology systems. Whether it is a single-county or a multi-county model, the single buyer within the utility would not be impacted much because the Single Buyer is within the utility.
Single buyer outside the utility
As for the Single Buyer outside the utility model, the single buyer is not only ring-fenced from the other business entities of the utility but is outside of the utility. It would be more cost-effective to be under a multi-county approach because the interconnection will require one central Single Buyer—tasked to determine the needs of each county and coordinate with the utilities—only.
26 The RUS has specific loan programs for increasing energy efficiency, renewables, and additional grant programs specifically for high-cost energy areas. For more detailed information, please see Task 1.2.3.

London Economics International LLC 22 contact: 717 Atlantic Ave, Suite 1A Cherrylin Trinidad/Tianying Lan Boston, MA 02111 617-933-7229www.londoneconomics.com [email protected]
6.2 Regulatory models
With regard to regulatory models, the highest-ranking models are outcomes-based performance-based ratemaking (“PBR”), 27 conventional PBR 28 with Light Hawaii Electricity Reliability Administrator (“HERA”),29 and Hybrid model, which includes outcomes-based PBR, Distributed System Platform Provider (“DSPP”),30 and Integrated Grid Operator (“IGO”).31
Since PBR and DSPP will be implemented within the utilities, the implementation of these regulatory models would not change much whether they are under the single-county or multi-county model.
On the other hand, HERA and IGO would be more cost-effective under the multi-county model. Only one IGO is required once multiple counties are interconnected. Likewise, one HERA entity could do the work for the entire state.
27 As discussed in Task 2.1.1 (Introduction to the Regulatory Models), outcomes-based PBR would focus on outcomes related to enhancing customer experience, improving utility performance, achieving public policies and goals, and attaining healthy financial performance. It also features an expanded set of Performance Incentive Mechanisms (“PIMs”) with Earning Sharing Mechanism (“ESM”) and longer regulatory period, among the other features of this PBR.
28 Conventional PBR would use an indexation formula and a revenue cap to determine the revenue requirements of the utilities—restricting their ability to increase revenue requirements—but would also have PIMs and a symmetrical ESM and total expenditure approach in treating expenditures.
29 Under the Light HERA, HERA (the entity) could perform as an ombudsman or appeals body focused on hosting capacity and interconnection. It would have the technical capability to set target timeframes and standard models for the calculation of interconnection costs convened in cases when a customer wants to challenge utility interconnection behavior or lack of hosting capacity transparency. See Task. 2.1.1. for more description of the Light HERA.
30 The DSPP would be responsible for planning and designing its distribution system so it can integrate DER as a primary means of meeting system needs.
31 As discussed in Task 2.2.1, the functions of the ISO and independent distribution system operator are combined, and the resulting body is called Independent Grid Operator (“IGO”). Given the smaller size of Hawaii’s transmission systems (compared to other jurisdictions), combining these two regulatory models would be more effective and efficient in the Hawaii context.

London Economics International LLC 23 contact: 717 Atlantic Ave, Suite 1A Cherrylin Trinidad/Tianying Lan Boston, MA 02111 617-933-7229www.londoneconomics.com [email protected]
7 Appendix A: Scope of work to which this deliverable responds
Task 3.1.3 Assessing the pros and cons of managing Hawaii’s electricity sector with each county operating independently as compared to a multi-county model.
CONTRACTOR shall include an analysis of the relative advantages and disadvantages of each county operating independently and collectively as a part of a multi-county model which may include the ownership of electric utilities in two or more counties. CONTRACTOR shall evaluate the potential for each model to 1) achieve State energy goals; 2) maximize consumer cost savings; 3) enable a competitive distribution system in which independent agents can trade and combineevolving services to meet customer and grid needs; and 4) eliminate or reduce conflicts of interestin energy resource planning, delivery, and regulation.
DELIVERABLE FOR TASK 3.1.3. CONTRACTOR shall provide its conclusions and all work related to assessing the pros and cons of managing Hawaii’s electricity sector with each county operating independently as compared to a multi-county model. CONTRACTOR shall consider the cost savings and additional costs that might be entailed in a multi-county model to assess the impact on consumer costs. CONTRACTOR shall consider the benefits that a multi-county model may offer achieving state energy goals as compared to the costs. CONTRACTOR shall assess whether there is any impact from a single county or multi-county model to enabling a competitive distribution system or reducing conflicts of interest in energy planning, delivery, and regulation. CONTRACTOR shall provide a written summary of the findings in MS Word and Power Point. CONTRACTOR shall submit deliverable for TASK 3.1.3 to the STATE for approval.

London Economics International LLC 24 contact: 717 Atlantic Ave, Suite 1A Cherrylin Trinidad/Tianying Lan Boston, MA 02111 617-933-7229www.londoneconomics.com [email protected]
8 Appendix B: List of works consulted
DBEDT. Initial Public Comments in Response to Hawaii PUC Order No. 31356 (Docket No. 2013-0169). HECO Companies. 2016 PSIP.
DOE. “Renewable Portfolio Standard.” Web. < https://www.energy.gov/savings/renewable-portfolio-standard-4>. Access date: August 21, 2018.
HB623 HD2 SD2 CD1, Relating to Renewable Standards. House of Representatives, Twenty-Eight Legislature, 2015. State of Hawaii. Web. Accessed May 10, 2017.
HECO Companies. Hawaiian Electric Company 2017 Test Year Rate Case – One Company Initiative. Docket No. 2016-0328.
HECO Companies. PSIP Update Report. December 23, 2016. Book 1.
HSEO. Oahu-Maui Grid Tie. Website. <http://energy.hawaii.gov/renewable-energy/oahu-maui-gridtie>. Access date: August 21, 2018.
Rocky Mountain Institute and Carbon War Room. Renewable Microgrids: Profiles from Islands and Remote Communities across the Globe. November 2015.