Embed Size (px)
Citation preview

i
A high frequency model of the COVID-19
pandemic
September 2020

i
Contents Page
Abstract
Tables, Figures and Annexes
ii
iii
1 Introduction and Background 1
2 Literature Review 5
3 Model data and estimation 5
4 Results 7
5 Conclusion
7
6 References
10

ii
Figures, Tables and Appendices
Figures
Figure 1 Fatalities per 100,000 in days after 10 fatalities recorded in each country 3
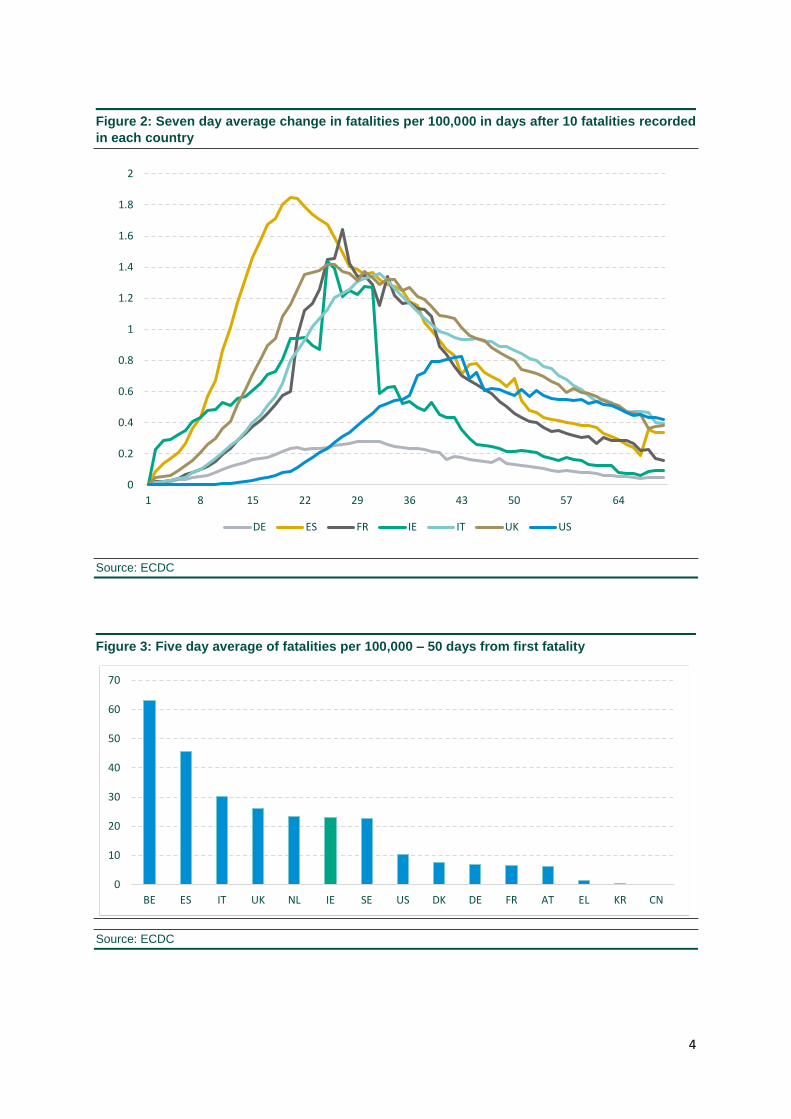
Figure 2 Seven day average change in fatalities per 100,000 in days after 10 fatalities
recorded in each country. 4
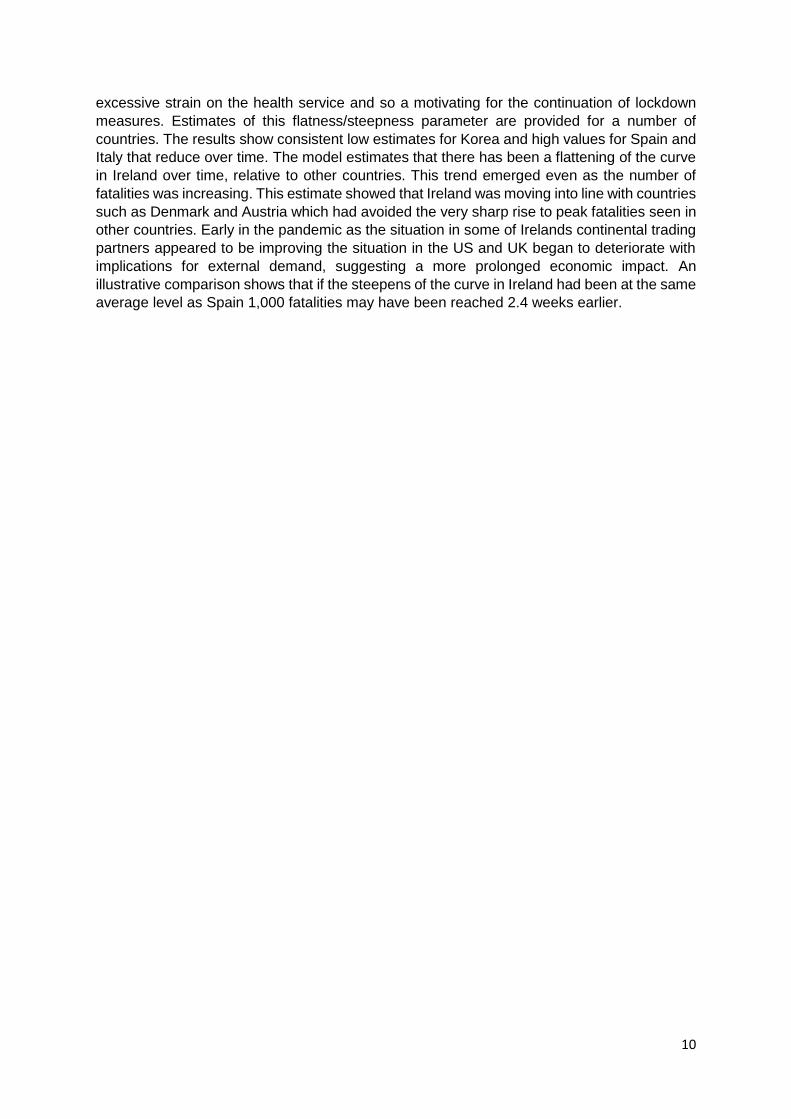
Figure 3 Five day average of fatalities per 100,000 – 50 days from first fatality. 4
Figure 4 Estimated and actual fatalities in days after first 5 fatalities recorded in each
country. 8
Figure 5 Three day average of the measure of steepness/flatness over time. Rolling
estimation for all countries beginning for N=15 after at least 5 fatalities were recorded 9

iii
Abstract
The COVID-19 pandemic represents a complex challenge to policymakers from both a public
health and economic perspective. It has caused a severe economic shock to both the Irish
and global economy with shutdown measures in Ireland and its trading partners. This paper
describes a high frequency database and model developed from both the econometric and
medical literature to provide a relative measure of the path of the pandemic in Ireland and
across the globe with the aim of adding to the real time evidence for policy makers. Model
estimates are reported for the critical early and peak stages of the pandemic.
The model is complementary to those used for public health policy as while it cannot estimate
the rate of transmission that is critical for policy decisions is has the flexibility to provide daily
estimates and relative metrics for a large set of countries. In the early stages of the pandemic
the model estimated a high value of steepness of the curve for Spain and Italy and a low level
for Korea. Ireland’s measure showed a trend decline, in line with countries such as Denmark
and Austria. In the early stages of the pandemic as the situation improved in some of Ireland’s
continental trading partners there was deterioration in the UK and US, indicating the potential
for a more prolonged economic impact. Illustrative calculations reveal that if Ireland’s
pandemic curve been on average as steep as in Spain, 1,000 fatalities would have been
reached 2.4 weeks earlier than observed.
1
1. Introduction1
The outbreak of coronavirus disease (COVID-19), first identified in China in December 2019,
has now become a global pandemic. At the time of writing, approximately sixteen million cases
of the disease have been confirmed affecting almost all countries and territories, leading to
over 600,000 deaths.2 Aside from the health impact, this has also brought the world economy
to a near standstill as governments introduce measures in an effort to contain the spread.
For Ireland, COVID-19 poses the single largest challenge to the economy since the financial
crisis (2007-08), and is likely to have an even larger impact in the short term. The highly
contagious nature of the disease has meant that the stringency of the containment measures
imposed have been unprecedented in nature even compared to the previous literature on the
economic impact of pandemics, (Keogh-Brown, 2010; Jonung and Roeger, 2006). Economic
activity in some sectors has completely ceased, while the labour market has also been
transformed from one of full employment in late-2019, to one in which unemployment reached
its highest level on record (Central Statistics Office, 2020). A number of domestic institutions
have estimated a severe impact on the Irish economy, ESRI (March 2020), Central Bank (April
2020) and Department of Finance (April 2020). The estimated impacts on GDP for the year
range from a -7.1 to -10.5 per cent decline depending on the type of recovery scenario
assumed.3 Ultimately an exit from the containment measures will be determined by the path
of the virus. This underscores the importance of real time quantification of the dynamics of the
virus.
In addition to the direct impact of measures on the domestic economy, part of the estimated
downturn for Ireland captures the weakening of the global economy as the COVID-19
pandemic has also led to lockdown measures across a substantial number of Ireland’s trading
partners. In their broader contagion scenario, the OECD forecast global growth to fall to 1.5
per cent in 2020, half the rate that was predicted before the pandemic. The IMF forecasts are
even more pessimistic, projecting the global economy to contract sharply by 3 per cent in
2020, worse than the fall observed during the 2008–09 financial crisis. This worsening of the
external environment will weigh on demand for Irish exports and so economic activity within
Ireland. For the year as a whole, GDP will likely decline significantly in the euro area, UK and
US (IMF, 2020) – with these destinations accounting for two-thirds of Irish exports. Ireland’s
vulnerability as a small, open economy to such shocks in the global environment is well
documented, with its reliance on markets such as the UK already highlighted in a number of
studies focusing on the economic impact to Ireland following Brexit (Department of Finance
2016). It is thus important to not only track the path of the pandemic in Ireland but also in
Irelands key trading partners and globally.
With the rapid changes in the dynamics of the pandemic the prospects of economies exiting
lockdown measures can change on a daily basis. Of critical importance is the
1 Authors Donal Smith and Luke Rehill are economists in the Department of Finance, Haicheng Shu is an
Assistant Professor in the School of Economics, Southwestern University of Finance and Economics, China. The analysis and views set out in this paper do not necessarily reflect the views of the Minister for Finance. This paper has greatly benefitted from comments from, Peter Spencer & Adam Golinski (University of York), Tiago McCarthy, Evan Walker (Department of Health), members of the Irish Epidemiological Modelling Advisory Group (IEMAG), Robert Scott & Patrick Moran (Department of Public Expenditure and Reform) and anonymous referees from the Economic and Social Review. In addition to comments we are thankful to Brendan O’Connor and John McCarthy (Department of Finance) for supporting the development of this analysis. 2 Source: European Centre for Disease Control (ECDC). https://www.ecdc.europa.eu/en 3 Box 5 of the Department of Finance Stability Programme provides an overview of the different recovery scenarios.

2
steepness/flatness of the pandemic curve as this is related to the severity of the pandemic
and so to the use lockdown measures and their associate economic implications. The need
for daily tracking across a large number of countries motivates development of the model in
this paper. In estimating the steepness/flatness daily fatalities data are used as opposed to
cases. Cases would give more of a leading indicator of potential future pressures on the health
services. However fatalities data are likely to be more consistent across countries than cases
data and the aim is to provide relative estimates on the path of countries throughout the
pandemic due to its economic implications and not to provide a predictive, medical scenarios
type model as is done with SEIR models from the epidemiological literature.
The fatalities from the virus have displayed a very different dynamic across countries (Figures
1, 2 & 3). These figures show the comparative measures for the early phase of the pandemic,
up to early June. From Figures 1-3 is can be seen that the pandemic changes rapidly over
time. The figures presented give a sample of the daily summary statistics produced throughout
the pandemic, currently containing 43,091 data points. The growth rate and levels of the data
are aligned to give countries a common starting point, e.g. greater than 1 or 10 fatalities
recorded and converted to fatalities per 100,000 of population to facilitate cross country
comparison as countries entered the pandemic at different points in time.
As will be discussed in the subsequent section a range of modelling approaches have been
used to track the pandemic and provide evidence for policy makers. These include large
simulation models from the epidemiological literature but also econometric approaches.
Econometric approaches are particularly applicable as the topics of economics and finance
have always been to the forefront of high frequency and big data modelling problems (Dunbar,
2019). In this paper a logistic model is used due to its flexibility in quickly estimating a high
volume of daily data across a large number of countries allowing an insight into countries
relative dynamics. This approach complementary to SEIR models. SEIR models are used for
medically motivated precise interventions such as, the lifting of restriction and counterfactual
estimation of the impact of these policies on the rate of transmission, hospital admissions and
intensive care unit (ICU) admissions. This involves detailed estimates for a particular country.
The logistic approach complements this by providing a high-frequency cross country
comparison.
In reporting estimated results, although figures can be reported to the current date, the focus
in this paper is on estimates produced at the early stages and peak of the pandemic when the
figures were of most value to policy makers dealing with a very new challenge.4 The model
estimates that in the early stages of the pandemic steepness of the curve was low in Korea
and high in Spain and Italy, in line with observed developments. There was a trend flattening
of the curve in Ireland relative to other countries bringing the estimates closer to those of
Denmark and Austria. An illustrative scenario shows that fatalities in Ireland would have
reached 1,000 seventeen days earlier if the dynamics of curve flattening had followed the
pattern in Spain rather than what did occur in Ireland. The model also provided an early
indication of a deteriorating situation in some of Ireland’s main trading partners indicating a
more prolonged economic impact. The paper will be organised as follows Section 2 reviews
the literature. Section 3 presents the model used. Sections 4 presents the results and Section
5 concludes.
4 Estimates in this paper are correct as of early June.

3
Figure 1: Fatalities per 100,000 in days after 10 fatalities recorded in each country
Source: ECDC
0
10
20
30
40
50
60
70
80
1 8 15 22 29 36 43 50 57 64 71 78 85 92
DE ES FR IE IT UK US
4
Figure 2: Seven day average change in fatalities per 100,000 in days after 10 fatalities recorded
in each country
Source: ECDC
Figure 3: Five day average of fatalities per 100,000 – 50 days from first fatality
Source: ECDC
0
0.2
0.4
0.6
0.8
1
1.2
1.4
1.6
1.8
2
1 8 15 22 29 36 43 50 57 64
DE ES FR IE IT UK US
0
10
20
30
40
50
60
70
BE ES IT UK NL IE SE US DK DE FR AT EL KR CN

5
2. Literature Review
COVID-19 forecasts have largely been based on mathematical models that capture the
probability of moving between states from susceptible to infected, before either a recovered
state or a fatality (SIR models). How an epidemic plays out over time is determined by the
transition rates between these three states.5 In general, these models assume random mixing
between all individuals in a given population. SIR models can account for a range of alternative
estimates of key parameters and be used for counterfactual scenario analysis.
A more aggregate strategy is to focus on modelling the empirically observed COVID-19
population infection or death rate curves, the latter of which directly reflect both the
transmission of the virus and the case-fatality rates in each community. Indeed, daily deaths
are likely more accurately reported than cases in settings with limited testing capacity. Logistic
models can be used to provide a simple representation of the evolution of infection numbers,
hospital admissions and deaths from a pandemic by fitting a curve to the available series.
These have been commonly used to model outbreaks as they are able to capture the initial
slow growth of a pandemic, followed by a period of rapid growth, followed by a tapering off
(Baldwin, 2020).
Early results using these types of models have shown a high degree of accuracy in predicting
the evolution of the COVID-19 outbreak in Wuhan (Batista, 2020). This was also the case
when applied to other regions in China, while outperforming the use of other mathematical
models in its fit for cases and deaths (Jia et al, 2020).Logistic models have also been used
with empirical data from Costa Rica, Italy, Spain and the US (Villalobos-Arias, 2020), obtaining
a high degree of fit in each. In an attempt to forecast extreme scenarios model parameters
were obtained from South Korea and Italy, two developed countries which have had very
different experiences in dealing with the spread, in order to generate a range of forecasts for
daily infections in the state of Utah (Queadan et al, 2020).
Logistic-type models have the benefit of being relatively simple, flexible and can be updated
quickly to follow data released on a daily basis. They can also be used to predict the point of
inflection in the curve, or turning point, which is when the number of daily observations in
cases or deaths will have peaked and thereafter start to decrease. This approach has been
taken to track the progression of the COVID-19 outbreak in the UK in terms of daily cases and
deaths announced, and had enough data as of 15 April 2020 to estimate that a corner had
been turned (Golinski and Spencer, 2020a & 2020b). We follow the same curve fitting
approach in this paper.6 It is important to note that model takes an econometric approach and
does not estimate the rate of transmission which is a key variable from a public health policy
perspective.
3. Model data and estimation
The data used is taken from the European Centre for Disease Prevention and Control (ECDC).
This comprises daily data on cases and fatalities covering 184 countries beginning on the
31/12/2019. Fatalities data is selected for estimation as there are considerable cross country
differences is testing coverage and guidelines (Irish Times, 2020). Even though the fatalities
5 Atkeson (2020) introduces a simple SIR model of the progression of COVID-19 in the US. 6 A Gompertz curve or other functional form specifications can provide a better fit to the data for some countries however in the early and peak stages of the pandemic, which is the focus of this paper, there is not a substantial improvement over the logistic model.

6
data may be more consistent it should be noted that this is still not directly comparable as
countries have differed thus far in the reporting of COVID-19 fatalities.7
The dynamics of fatalities across countries are modelled by a general logistic function:
𝐹(𝑡) =
𝛽1
1 + 𝑒(𝛽2−𝛽3∗𝑡)
(1)
Time is given by 𝑡 and 𝛽 are the parameters estimating key features of the curve; level,
intercept and slope. The model is flexible enough to fit the distribution at both the early and
late stages of the pandemic. To fit the daily fatality data for estimation the model is discretized
and an error term, 𝜖𝑡 ~𝑁(0,1), added:
𝐹′(𝑡) = 𝛽1 (1 + 𝑒(𝛽2−𝛽3∗𝑡))−2(𝛽3𝑒(𝛽2−𝛽3∗𝑡)) + 𝜖𝑡
(2)
Estimation is in differences given the issues of estimation on levels data (Sims, 1980). The
model is applied to a rolling sample of daily data from 15 observation up to the end of the
sample for each country. Throughout the pandemic the data program allowed this model to
be run for 184 countries and provided summary statistics and estimates on a daily basis. The
first observation is taken as when a country recorded at least 5 fatalities. While not a causal
analysis, and relying on distributional assumptions, this data driven model can give some
indication of countries relative position in moving through the pandemic. The cumulative
distribution function of the logistic function provides a close description of the pandemics
dynamics. The fitted and actual values from the estimation of equation 2 for China, Ireland
Italy and Spain are shown in Figure 4 for the early stages of the pandemic.
The model can be used to estimate the steepness/flatness of the curves across countries and
to construct an indicator of turning points. As a robustness check on the results we also employ
techniques from the finance literature as discussed in Golinski and Spencer (2020a & 2020b).
We estimate equation two with a square root volatility specification as used for bounded
processes in Cox, Ingersoll, and Ross (1985). We find that for the sample of countries used
this does not radically change the estimate of the steepness parameter which is of primary
interest in this paper. Thus for computational ease with high frequency data equation 2 is used.
The estimation of the turning point in each country is based on the rolling estimation of model
parameters. Point estimates of parameters yield a turning point estimate at that point in time.
As the sample increases this rolling estimate will converge to the actual inflection point. To
approximate this end point, a function is fit to a convergent sequence of parameter estimates
from the model and forecast forward. Forecasted numbers are subject to more uncertainty
than estimates on observed data, however the method employed here is less reliant on
restrictive assumptions than other approaches which employ an estimated common fatality
rate across countries (IHME, 2020).
4. Results
7 The prime aspect here was some countries were not reporting COVID-19 deaths that occurred outside of hospitals (i.e. nursing homes and long term care facilities).

7
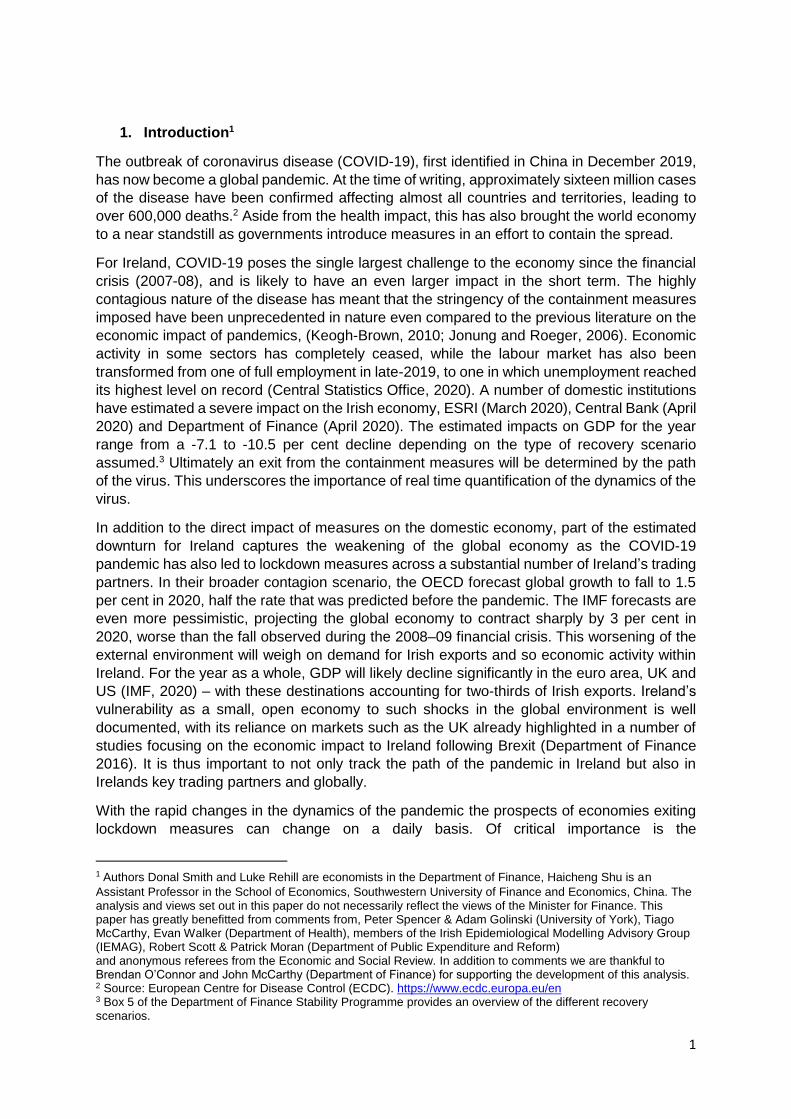
A key element leading to the shutdown measures is the risk of pressure being placed on
medical services by a rapid increase in the spread of the virus. Rolling estimation of the
flatness or steepness of the underlying density function can provide an indicator over time
across countries of entering a lockdown scenario (Figure 5). The models estimates show that
in the early stages of the pandemic Korea, which has managed to avoid severe lockdown
measures, has a low number and is well below the estimate for Italy, Spain the UK and US.
The situation in important trading partners the UK and US was seen to deteriorate at points
over time indicating the potential for a more prolonged economic impact. Ireland’s number has
shown a trend decline and is closer to the estimates seen in Denmark and Austria than
severely impacted countries like Spain and Italy. Denmark and Austria were among the first
European countries to lift lockdown measures.
The flattening of the curve estimated in Ireland highlights the value of the model based
estimated as this can be seen at a time when fatalities were increasing. The cross country
estimates can be used to construct and illustrative scenario such as a comparison of a
situation where Irelands curve had not flattened to this extent and had instead evolved in line
with that of Spain. An illustrative comparison shows that if the steepness of the curve in Ireland
had been at the same average level as Spain 1,000 fatalities may have been reached 17 days
earlier than actually observed. This would have implications for pressures on the medical
service and would likely have prolonged the period proposed to relax shutdown measures.
The turning point can be approximated by forecasting of model parameters. The results for
the turning point estimates are: Ireland - last week of May; UK - Last week of April; Spain - 2nd
week of April. These forecast numbers should be interpreted in the context of the caveats
outlined.

8
Figure 4: Estimated and actual fatalities in days after first 5 fatalities recorded in each country.
Source: ECDC
0
500
1,000
1,500
2,000
2,500
3,000
3,500
6 13 20 27 3 10 17 24 2 9 16 23 30
M1 M2 M3 M4
CN data CN fi tted
China - Total Fatalities , estimated and actual
0
4,000
8,000
12,000
16,000
20,000
24,000
28,000
6 13 20 27 3 10 17 24 2
M1 M2 M3
IT data IT fi tted
Italy - Total Fatalities , estimated and actual
0
5,000
10,000
15,000
20,000
25,000
6 13 20 27 3 10 17 24
M1 M2
ES data ES fi tted
Spain - Total Fatalities , estimated and actual
0
200
400
600
800
1,000
1,200
1,400
6 13 20 27 3 10 17
M1 M2
IE data IE fi tted
Ireland - Total Fatalities , estimated and actual

9
Figure 5: Three day average of the measure of steepness/flatness over time. Rolling estimation
for all countries beginning for N=15 after at least 5 fatalities were recorded8.
Source: ECDC
5. Conclusions
The COVID-19 pandemic has spread rapidly across the globe and caused considerable
challenges for policy makers. A key component in determining the economic impact is the path
of the pandemic in Ireland and its trading partners. In quantifying this there are a wide range
of modelling approaches available from the medical and economic literatures which can be
used to provide insights on the spread and of the pandemic. In this paper we present an
econometric approach. This approach is taken as data modelling methodologies employed in
economics and finance are well suited to handling high frequency and large datasets.
Using these methodologies we construct a daily data set of corona fatalities of 184 countries
and apply an econometric model to track the relative evolution of the flatness/steepness of the
pandemic curve in a subset of countries. In the paper the summary statistics and estimates
are presented for the early stages and peak of the pandemic as this is when this information
was most critical for policymakers. The summary statistic indicators revealed a wide
divergence in the dynamic of the pandemic among Ireland and its key trading partners. The
rapidly evolving nature of the pandemic necessitated the use of high frequency data
techniques. The model is complementary to those used for public health policy as while it does
not estimate the rate of transmission it can provide relative measures across a large set of
countries.
The flatness/steepness of the pandemic curve is a key feature as a steep curve, although not
an exact measure, provides some indication of the risk of a situation where there may be an
8 Date from which at least 5 fatalities were recorded: Austria - 20th March, Denmark – 20th March, Spain – 7th
March, Ireland – 24th March, Italy – 25th February, Korea – 23rd February, UK – 11th March, US – 3rd March.
0
0.05
0.1
0.15
0.2
0.25
0.3
0.35
0.4
0.45
1 3 5 7 9 11 13 15 17 19 21 23 25 27 29 31 33 35 37 39 41 43 45 47 49 51
Days after at least 5 fatailties recorded
AT DK ES IE IT KR UK US
10
excessive strain on the health service and so a motivating for the continuation of lockdown
measures. Estimates of this flatness/steepness parameter are provided for a number of
countries. The results show consistent low estimates for Korea and high values for Spain and
Italy that reduce over time. The model estimates that there has been a flattening of the curve
in Ireland over time, relative to other countries. This trend emerged even as the number of
fatalities was increasing. This estimate showed that Ireland was moving into line with countries
such as Denmark and Austria which had avoided the very sharp rise to peak fatalities seen in
other countries. Early in the pandemic as the situation in some of Irelands continental trading
partners appeared to be improving the situation in the US and UK began to deteriorate with
implications for external demand, suggesting a more prolonged economic impact. An
illustrative comparison shows that if the steepens of the curve in Ireland had been at the same
average level as Spain 1,000 fatalities may have been reached 2.4 weeks earlier.
11
References
Atkeson, A, 2020. ‘What Will Be the Economic Impact of COVID-19 in the US? Rough
Estimates of Disease Scenarios.’ NBER Working Paper No. 26867, National Bureau of
Economic Research, Inc.
Baldwin, R, 2020. ‘It’s not exponential: An economist’s view of the epidemiological curve’.
VoxEU Article, March 2020.
Batista, M, 2020. ‘Estimation of the final size of the COVID-19 epidemic.’ Preprint. medRxiv.
Central Bank of Ireland, 2020. Quarterly Bulletin - Q2 2020.
Central Statistics Office, Monthly Unemployment, April 2020.
Cox, J. C., J. Ingersoll, J E, and S. A. Ross, 1985. ‘A Theory of the Term Structure of
Interest Rates,’ Econometrica, 53(2), 385–407.
Department of Finance (2016). Smith, Donal, Fahy, Mike, Corcoran, Brian and O’Connor,
Brendan. ‘UK EU Exit – An Exposure Analysis of Sectors of the Irish Economy.’.
Department of Finance Draft Stability Programme Update 2020, April 2020.
Dunbar, S., 2019. ‘Mathematical Modeling in Economics and Finance Probability, Stochastic
Processes and Differential Equations’. American Mathematical Society.
Golinski, A., and Spencer, P. 2020a. ‘Coronametrics: The UK turns the corner’ University of
York Discussion Papers in Economics.
Golinski, A., and Spencer, P. 2020b. ‘Modeling the Covid-19 epidemic using time series
econometrics University of York Discussion Papers in Economics.
IHME, and Murray, C, 2020. ‘Forecasting COVID-19 impact on hospital bed-days, ICU-days,
ventilator-days and deaths by US state in the next 4 months.’ medRxiv.
Jia, L, et al., 2020. ‘Prediction and analysis of Coronavirus Disease 2019.’ arXiv preprint
arXiv: 2003.05447.
Jonung, L and Werner R, 2006. ‘The macroeconomic effects of a pandemic in Europe-A
model-based assessment.’ Available at SSRN 920851.
Keogh‐Brown, M R., et al., 2010. ‘The possible macroeconomic impact on the UK of an
influenza pandemic.’ Health economics 19.11: 1345-1360.
IMF World Economic Outlook, April 2020: Chapter 1.
Irish Times, 2020. ‘Coronavirus testing: how some countries got ahead of the curve’, Apr 3,
2020.
McQuinn, K, O’Toole, C, Allen-Coughlan, M, and Coffey, C, 2020. ESRI Quarterly Economic
Commentary, Spring 2020.
OECD Economic Outlook, Interim Report, March 2020.
Qeadan, F, et al, 2020. ‘Naive Forecast for COVID-19 in Utah Based on the South Korea
and Italy Models-the Fluctuation between Two Extremes.’ International Journal of
Environmental Research and Public Health 17.8: 2750.
Sims, C. A., 1980: ‘Macroeconomics and Reality’, Econometrica, 48(1), 1–48.

12
Villalobos-Arias, Mario, 2020. "Using generalized logistics regression to forecast population
infected by Covid-19." arXiv preprint arXiv: 2004.02406.

1