Embed Size (px)
Citation preview
A Hardwood Log Grading Handbook
PB1772$2.50
Contents
How Much Is a Log Worth? ..........................................1 Veneer, Sawlogs and Other Log Classes .................2 Log Scaling ................................................................3 Table 1. The Doyle Log Rule .......................................4 Log Grading — Relation to Lumber Grading ...........6 Table 2. Summary of the NHLA hardwood lumber grading rules ............................................7
Log Grading Methods .................................................8 Defects .......................................................................8 USDA Forest Service Hardwood Sawlog Grading System ...................................................11 Table 3. Summary of Forest Service Hardwood Log Grading Rule ..............................12 Table 4. Total cutting lengths required in each grade .....................................................15 Table 5. Sweep deduction (percent) .....................16 Grading a Log Using the Forest Service System ....17 Table 6. Scaling deduction factors .........................18 Clear Face Grading ................................................19
The Log Grading Rules Compared ..........................20 The US Forest Service Log Grading Rule .................20 Clear Face Rules .....................................................20 Weight Scaling .........................................................20
Tree Grading ...............................................................21 Table 7. Summary of US Forest Service Rule for Tree Grading ...................................................21
Log Bucking Optimization ........................................22
Summary .....................................................................24
References ..................................................................25
1
A Hardwood Log Grading HandbookAdam Taylor
University of Tennessee
A good understanding of log valuation will help landowners, loggers, log buyers and saw millers agree on the fair value for a load of logs. This handbook briefly summarizes common log grading rules for hardwoods. Basic concepts in log scaling, lumber grading and log bucking optimization are also discussed because each of these topics relates to log grading.
How much is a log worth?There are three main factors that buyers
and sellers use to determine the value of a log: Grade, Scale and Species. Grade is a measure of the quality of the log and the lumber that will come from the log. Scale is a measure of the quantity of lumber within a log. Different species can be used for different products and have inherently different value, regardless of the quality of the lumber. Even seemingly minor differences in grade or spe-cies can mean a very different value for logs – see below for an example:
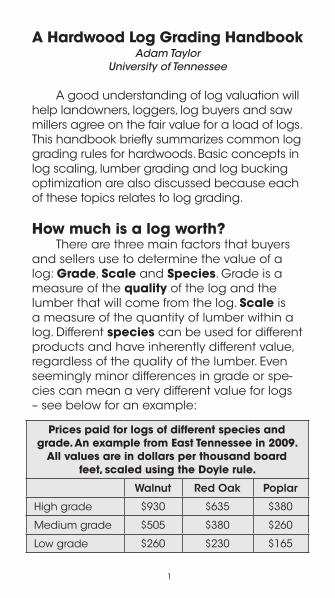
Prices paid for logs of different species and grade. An example from East Tennessee in 2009.
All values are in dollars per thousand board feet, scaled using the Doyle rule.
Walnut Red Oak Poplar
High grade $930 $635 $380
Medium grade $505 $380 $260
Low grade $260 $230 $165
2
Log grading is important because it helps buyers and sellers settle on a fair price for a load of logs. Log grades can be used to predict the proportion of high-quality lumber that will be produced from that log. This log grading can also be used to help measure sawmill efficiency.
Veneer, Sawlogs and Other Log ClassesSome hardwood logs are reserved for the
production of veneer – thin sheets of wood that are peeled or sliced directly from logs. These logs are usually very high quality, with few if any visible defects. Veneer logs may also be judged on color, growth rate and amount of sapwood versus heartwood. Veneer logs are higher value than sawlogs. More information on veneer, and the grading of veneer logs, can be found in the publication Factors Affect-ing the Quality of Hardwood Timber and Logs for Face Veneer.1
Sawlogs are those that are sawn into hardwood lumber and the grading of saw-logs is the subject of this handbook. These logs are also called “factory” logs. Logs that are not of sufficient quality to be a sawlog may be used for cutting pallet stock or rail-road crossties, where appearance is not im-portant, or for pulpwood.
This handbook deals only with hardwoods. Softwoods such as pine and spruce are gen-
1Cassens, D.L. 2004. Factors Affecting the Quality of Hardwood Timber and Logs for Face Veneer. Purdue University publication FNR239. Available for down-load from http://www.ces.purdue.edu/extmedia/FNR/FNR-239.pdf
3
erally used for making structural products, for example the studs used for framing a house. Softwoods are graded using different rules that focus on strength-reducing defects.
Log ScalingScaling is used to predict the amount of
lumber that will be sawn from a log. The amount of lumber is measured in board feet, where one board foot is 1” x 12” x 12”, or any dimension with the same volume of wood. For example, a board 2” x 6” x 8’ contains 8 board feet.
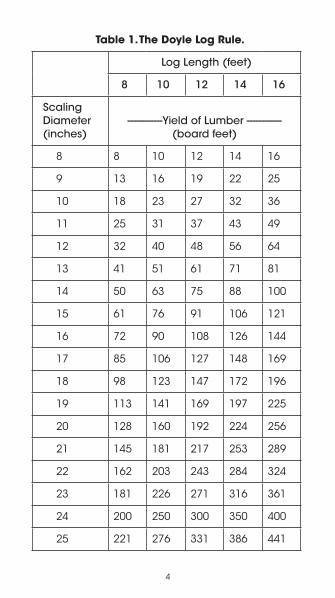
There are different log rules that are used for scaling in different regions and for different products. The three most common log scales are the Doyle rule, the Scribner rule and the International ¼” Rule. By tradition, the Doyle Scale is the most commonly used scaling rule used in Tennessee (Table 1.)2
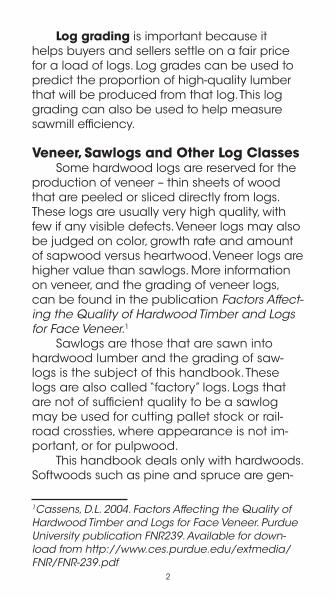
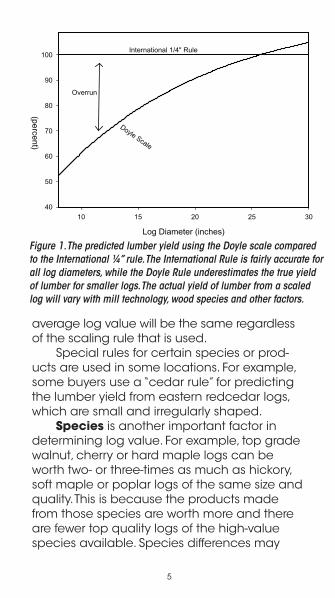
The Doyle Rule often underestimates the yield of lumber for small logs and for modern, more efficient sawmills (e.g. band mills). This underestimating can lead to “overrun”, when the actual yield is more than the scaling pre-dicted. Figure 1 shows a comparison of the Doyle scale to the International ¼” Rule, which more accurately predicts the true yield.
Log prices are normally different depend-ing on the rule used, reflecting the differences in the scale resulting from each rule. Thus, the
2For more information on scaling, and conversions among the log rules, see Understanding Log Scales and Log Rules by Brian Bond. University of Tennessee Extension PB1650. Download available at www.utextension.utk.edu/publications/pbfiles/Pb1650.pdf
4
Table 1. The Doyle Log Rule.
Log Length (feet)
8 10 12 14 16
Scaling Diameter (inches)
------------Yield of Lumber ------------ (board feet)
8 8 10 12 14 16
9 13 16 19 22 25
10 18 23 27 32 36
11 25 31 37 43 49
12 32 40 48 56 64
13 41 51 61 71 81
14 50 63 75 88 100
15 61 76 91 106 121
16 72 90 108 126 144
17 85 106 127 148 169
18 98 123 147 172 196
19 113 141 169 197 225
20 128 160 192 224 256
21 145 181 217 253 289
22 162 203 243 284 324
23 181 226 271 316 361
24 200 250 300 350 400
25 221 276 331 386 441
5
average log value will be the same regardless of the scaling rule that is used.
Special rules for certain species or prod-ucts are used in some locations. For example, some buyers use a “cedar rule” for predicting the lumber yield from eastern redcedar logs, which are small and irregularly shaped.
Species is another important factor in determining log value. For example, top grade walnut, cherry or hard maple logs can be worth two- or three-times as much as hickory, soft maple or poplar logs of the same size and quality. This is because the products made from those species are worth more and there are fewer top quality logs of the high-value species available. Species differences may
Figure 1. The predicted lumber yield using the Doyle scale compared to the International ¼” rule. The International Rule is fairly accurate for all log diameters, while the Doyle Rule underestimates the true yield of lumber for smaller logs. The actual yield of lumber from a scaled log will vary with mill technology, wood species and other factors.
Log Diameter (inches)
10 15 20 25 30
Predicted Lum
ber Yield
(percent)
40
50
60
70
80
90
100
Doyle Scale
International 1/4" Rule
Overrun
6
be stated explicitly in some log grading rules. Other log grading rules grade all species of logs in the same way, with buyers paying dif-ferent prices for logs of the same grade but of different species.
There are regional differences in pricing of logs and lumber products, because the wood quality of certain species is thought to be superior in some areas. For example, cherry logs from the northeastern United States are believed to contain higher-quality lumber and thus higher prices are paid for cherry logs from that area. There are also local variations in log prices. For example, if there are many sawmills within a reasonable hauling range of a timber harvest, this can increase the demand – and thus the price paid – for logs. Finally, prices paid for logs can vary substantially with fluc-tuations in demand due to seasonal changes and overall economic trends.3
Log Grading —Relation to Lumber Grading
Most hardwood logs are sawn into lumber. The value of this lumber, and thus of the log, is determined in part by the lumber grade. The grade of hardwood lumber is determined by a visual inspection of each board according to rules developed by the National Hardwood 3Information on prices trends in log and lumber markets are available from a number of sources including the including Tennessee Division of Forestry (www.state.tn.us/agriculture/forestry/tfbp.html), the Hardwood Market Report (www.hmr.com/), the Hardwood Review (www.hardwoodreview.com/) and TimberMart South (www.tmart-south.com/tmart/)
7
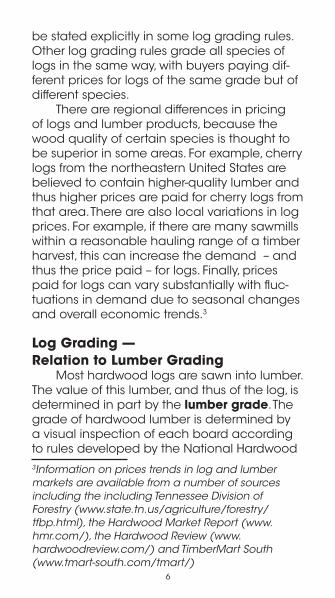
Lumber Association (NHLA - Table 2). The most important factors in determining lumber grade are width, length and yield of defect-free wood (“clear cuttings”).
As shown in Table 2, high-grade lumber must be relatively long, wide and clear of de-fects. Therefore high grade logs must be long, large in diameter and contain mostly clear wood. Larger logs are also preferred in log grading because they cost less to process per unit of lumber produced.
Table 2. Summary of the NHLA hardwood lumber grading rules. Adapted from NHLA, 2003.
Grade
Lumber Requirements
Min. Board Length (feet)
Min. Board Width
(inches)
Clear cuttings (poor face)
Total yield
Min. size
Max. number
FAS (the top grade)
8 6 83.3% 4” x 5’3” x 7’
4*
Selects 6 4 83.3% (good face)
1 Common 4 3 66.6% 4” x 2’3” x 3’
5*
2 Common 4 3 50% 3” x 2’ 7*
3 Common (the lowest grade)
4 3 33.3% 3” x 2’ --
*The maximum number of cuttings allowed depends on board size. The actual number is usually fewer.
8
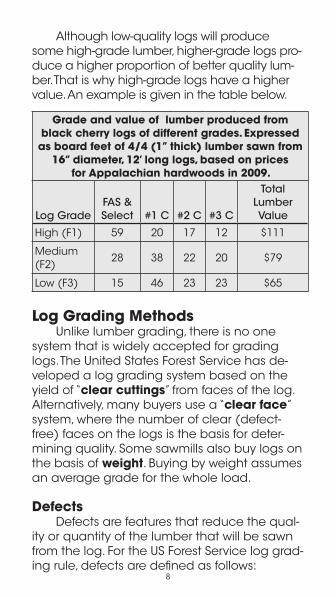
Although low-quality logs will produce some high-grade lumber, higher-grade logs pro-duce a higher proportion of better quality lum-ber. That is why high-grade logs have a higher value. An example is given in the table below.
Log Grading MethodsUnlike lumber grading, there is no one
system that is widely accepted for grading logs. The United States Forest Service has de-veloped a log grading system based on the yield of “clear cuttings” from faces of the log. Alternatively, many buyers use a “clear face” system, where the number of clear (defect-free) faces on the logs is the basis for deter-mining quality. Some sawmills also buy logs on the basis of weight. Buying by weight assumes an average grade for the whole load.
DefectsDefects are features that reduce the qual-
ity or quantity of the lumber that will be sawn from the log. For the US Forest Service log grad-ing rule, defects are defined as follows:
Grade and value of lumber produced from black cherry logs of different grades. Expressed as board feet of 4/4 (1” thick) lumber sawn from
16” diameter, 12’ long logs, based on prices for Appalachian hardwoods in 2009.
Log GradeFAS & Select #1 C #2 C #3 C
Total Lumber Value
High (F1) 59 20 17 12 $111
Medium (F2)
28 38 22 20 $79
Low (F3) 15 46 23 23 $65
9
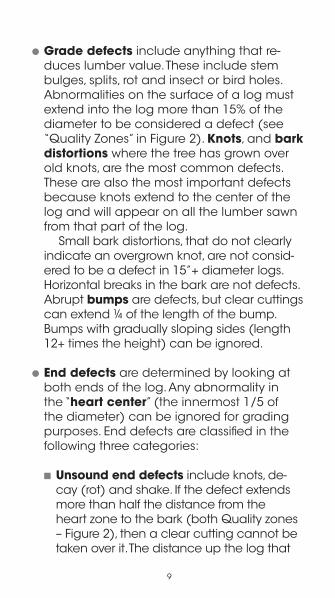
● Grade defects include anything that re-duces lumber value. These include stem bulges, splits, rot and insect or bird holes. Abnormalities on the surface of a log must extend into the log more than 15% of the diameter to be considered a defect (see “Quality Zones” in Figure 2). Knots, and bark distortions where the tree has grown over old knots, are the most common defects. These are also the most important defects because knots extend to the center of the log and will appear on all the lumber sawn from that part of the log.
Small bark distortions, that do not clearly indicate an overgrown knot, are not consid-ered to be a defect in 15”+ diameter logs. Horizontal breaks in the bark are not defects. Abrupt bumps are defects, but clear cuttings can extend ¼ of the length of the bump. Bumps with gradually sloping sides (length 12+ times the height) can be ignored.
● End defects are determined by looking at both ends of the log. Any abnormality in the “heart center” (the innermost 1/5 of the diameter) can be ignored for grading purposes. End defects are classified in the following three categories:
■ Unsound end defects include knots, de-cay (rot) and shake. If the defect extends more than half the distance from the heart zone to the bark (both Quality zones – Figure 2), then a clear cutting cannot be taken over it. The distance up the log that
10
the defect extends should be estimated; a clear cutting can extend over 1/3 of the estimated length of the defect.
■ Sound end defects include stain and slight dote (the beginning of rot) and are restricted in Grades 1 & 2. • Grade1–notmorethan½ofeitherend• Grade2–notmorethan3/5ofeither
end(limitedto½of16”diameterandsmaller logs.
■ Specific end defects include bird peck, wormholes, spots and streaks. If these de-fects cover more than half the distance from the heart center to the bark under three or more faces at one end, or two faces at both ends, lower Grade 1 & 2 one grade.
● Scaling defects reduce the amount, or vol-ume, or useable lumber. Rot and large holes
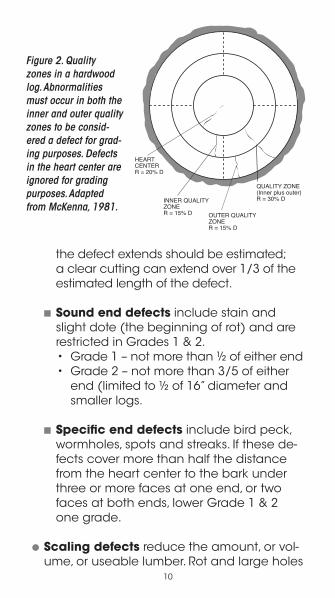
Figure 2. Quality zones in a hardwood log. Abnormalities must occur in both the inner and outer quality zones to be consid-ered a defect for grad-ing purposes. Defects in the heart center are ignored for grading purposes. Adapted from McKenna, 1981.
HEART CENTERR = 20% D
INNER QUALITY ZONER = 15% D OUTER QUALITY
ZONER = 15% D
QUALITY ZONE(Inner plus outer)R = 30% D
11
produce no lumber and thus can reduce not only the grade (quality) of the lumber produced from a log but also the quantity (scale). Scaling deductions can be made to account for these defects when scaling the log but these defects are also consid-ered in log grading.
USDA Forest Service Hardwood Sawlog Grading System – a clear cutting method
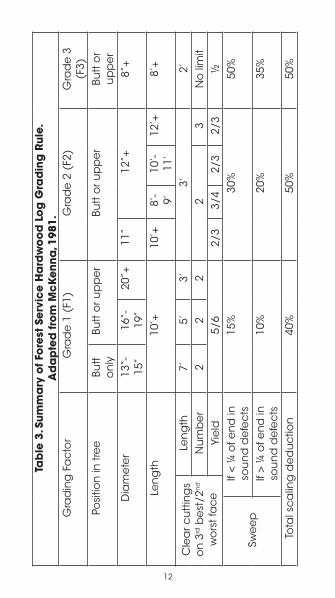
The Forest Service has developed a system to organize sawlogs into one of three grades. Grade 1 (or “F1”, where F stands for ‘factory’) is the highest (top quality), grade 2 (F2) the next best, and grade 3 (F3) is the lowest grade. The Forest Service grading system predicts the yield of 1 Common and better grades of lumber produced from the log. This is estimated based on the whether the log is a butt or upper cut, the log length and diameter, and the number and location of defects on the log.
Table 3 summarizes the requirements for each of the three grades. The factors used in grading are listed in the left-hand column.
● Position in tree. “Butt” logs come from the base of the tree and are preferred because there is usually more clear wood in that part of the tree stem. Butt logs can be identified by the flare at the base of the log and the presence of the notch that was used to di-rect the falling tree. Upper logs are also ac-ceptable for all three grades, except smaller grade 1 logs (13” – 15” diameter), which must be butt cuts only.
12
Tab
le 3
. Sum
ma
ry o
f Fo
rest
Se
rvic
e H
ard
wo
od
Lo
g G
rad
ing
Rul
e.
Ad
ap
ted
fro
m M
cK
enn
a, 1
981.
Gra
din
g F
ac
tor
Gra
de
1 (
F1)
Gra
de
2 (
F2)
Gra
de
3
(F3)
Posi
tion
in tr
ee
Butt
o
nly
Butt
or u
pp
er
Butt
or u
pp
er
Butt
or
up
pe
rD
iam
ete
r13
”-15
”16
”-19
”20
”+11
”12
”+8”
+
Len
gth
10’+
10’+
8’-
9’10
’-11
’12
’+8’
+
Cle
ar c
utt
ing
so
n 3
rd b
est
/2n
d
wo
rst f
ac
e
Len
gth
7’
5’3’
3’2’
Nu
mb
er
22
22
3N
o li
mit
Yie
ld5/
62/
33/
42/
32/
3½
Swe
ep
If <
¼ o
f en
d in
so
un
d d
efe
cts
15%
30%
50%
If >
¼ o
f en
d in
so
un
d d
efe
cts
10%
20%
35%
Tota
l sc
alin
g d
ed
uc
tion
40%
50%
50%
13
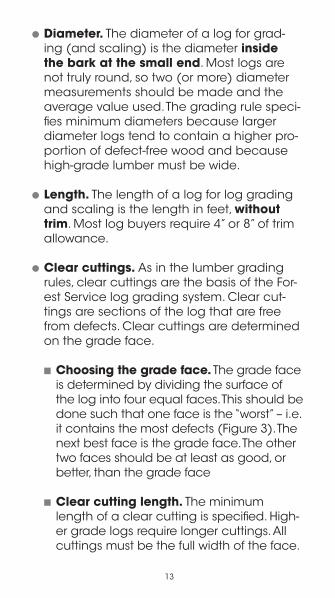
● Diameter. The diameter of a log for grad-ing (and scaling) is the diameter inside the bark at the small end. Most logs are not truly round, so two (or more) diameter measurements should be made and the average value used. The grading rule speci-fies minimum diameters because larger diameter logs tend to contain a higher pro-portion of defect-free wood and because high-grade lumber must be wide.
● Length. The length of a log for log grading and scaling is the length in feet, without trim. Most log buyers require 4” or 8” of trim allowance.
● Clear cuttings. As in the lumber grading rules, clear cuttings are the basis of the For-est Service log grading system. Clear cut-tings are sections of the log that are free from defects. Clear cuttings are determined on the grade face.
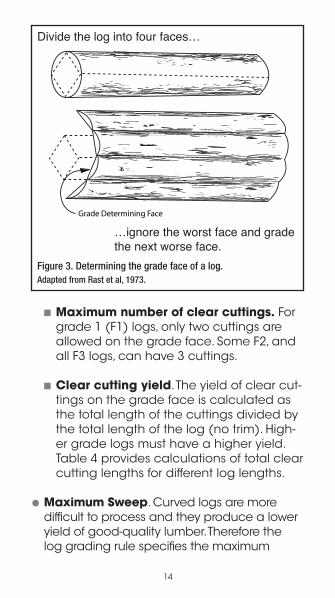
■ Choosing the grade face. The grade face is determined by dividing the surface of the log into four equal faces. This should be done such that one face is the “worst” – i.e. it contains the most defects (Figure 3). The next best face is the grade face. The other two faces should be at least as good, or better, than the grade face
■ Clear cutting length. The minimum length of a clear cutting is specified. High-er grade logs require longer cuttings. All cuttings must be the full width of the face.
14
■ Maximum number of clear cuttings. For grade 1 (F1) logs, only two cuttings are allowed on the grade face. Some F2, and all F3 logs, can have 3 cuttings.
■ Clear cutting yield. The yield of clear cut-tings on the grade face is calculated as the total length of the cuttings divided by the total length of the log (no trim). High-er grade logs must have a higher yield. Table 4 provides calculations of total clear cutting lengths for different log lengths.
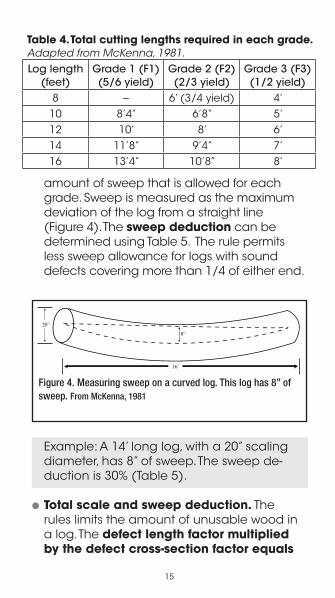
● Maximum Sweep. Curved logs are more difficult to process and they produce a lower yield of good-quality lumber. Therefore the log grading rule specifies the maximum
Divide the log into four faces…
…ignore the worst face and grade the next worse face.
Figure 3. Determining the grade face of a log. Adapted from Rast et al, 1973.
Grade Determining Face
15
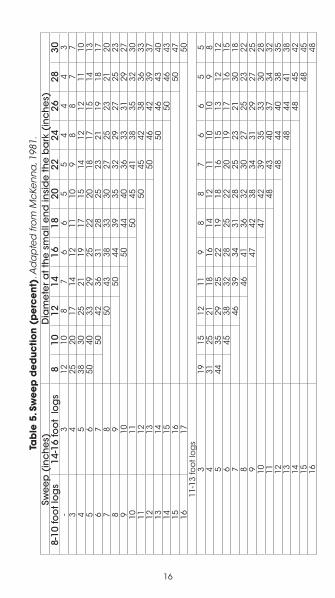
amount of sweep that is allowed for each grade. Sweep is measured as the maximum deviation of the log from a straight line (Figure 4). The sweep deduction can be determined using Table 5. The rule permits less sweep allowance for logs with sound defects covering more than 1/4 of either end.
Example: A 14’ long log, with a 20” scaling diameter, has 8” of sweep. The sweep de-duction is 30% (Table 5).
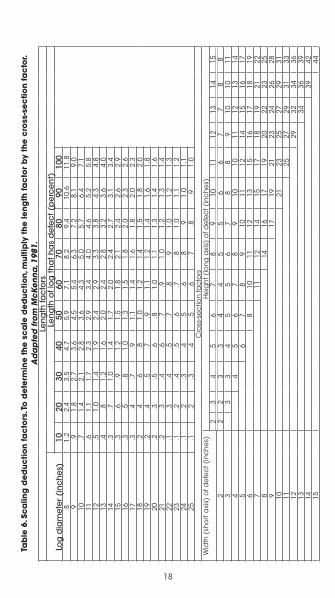
● Total scale and sweep deduction. The rules limits the amount of unusable wood in a log. The defect length factor multiplied by the defect cross-section factor equals
Figure 4. Measuring sweep on a curved log. This log has 8” of sweep. From McKenna, 1981
8”
16’
20”
Table 4. Total cutting lengths required in each grade. Adapted from McKenna, 1981.Log length
(feet)Grade 1 (F1)(5/6 yield)
Grade 2 (F2)(2/3 yield)
Grade 3 (F3)(1/2 yield)
8 -- 6’ (3/4 yield) 4’10 8’4” 6’8” 5’12 10’ 8’ 6’14 11’8” 9’4” 7’16 13’4” 10’8” 8’
16
Tab
le 5
. Sw
ee
p d
ed
uctio
n (p
erc
ent
). A
da
pte
d fr
om
Mc
Ken
na
, 198
1.Sw
ee
p (
inc
he
s)D
iam
ete
r a
t th
e s
ma
ll e
nd
insi
de
the
ba
rk (
inc
he
s)8-
10 fo
ot l
og
s14
-16
foo
t lo
gs
810
1214
1618
2022
2426
2830
-3
1210
87
66
55
44
43
34
2520
1714
1211
109
88
77
45
3830
2521
1917
1514
1212
1110
56
5040
3329
2522
2018
1715
1413
67
5042
3631
2825
2321
1918
177
850
4338
3330
2725
2321
208
950
4439
3532
2927
2523
910
5044
4036
3331
2927
1011
5045
4138
3532
3011
1250
4542
3836
3312
1350
4642
3937
1314
5046
4340
1415
5046
4315
1650
4716
1750
11-1
3 fo
ot l
og
s3
1915
1211
98
87
66
55
431
2521
1816
1412
1110
109
85
4435
2925
2219
1816
1513
1212
645
3832
2825
2220
1917
1615
746
3934
3128
2523
2130
188
4641
3632
3027
2523
229
4742
3834
3129
2725
1047
4239
3533
3028
1148
4340
3734
3212
4844
4038
3513
4844
4138
1448
4542
1548
4516
48
17
Tab
le 5
. Sw
ee
p d
ed
uctio
n (p
erc
ent
). A
da
pte
d fr
om
Mc
Ken
na
, 198
1.Sw
ee
p (
inc
he
s)D
iam
ete
r a
t th
e s
ma
ll e
nd
insi
de
the
ba
rk (
inc
he
s)8-
10 fo
ot l
og
s14
-16
foo
t lo
gs
810
1214
1618
2022
2426
2830
-3
1210
87
66
55
44
43
34
2520
1714
1211
109
88
77
45
3830
2521
1917
1514
1212
1110
56
5040
3329
2522
2018
1715
1413
67
5042
3631
2825
2321
1918
177
850
4338
3330
2725
2321
208
950
4439
3532
2927
2523
910
5044
4036
3331
2927
1011
5045
4138
3532
3011
1250
4542
3836
3312
1350
4642
3937
1314
5046
4340
1415
5046
4315
1650
4716
1750
11-1
3 fo
ot l
og
s3
1915
1211
98
87
66
55
431
2521
1816
1412
1110
109
85
4435
2925
2219
1816
1513
1212
645
3832
2825
2220
1917
1615
746
3934
3128
2523
2130
188
4641
3632
3027
2523
229
4742
3834
3129
2725
1047
4239
3533
3028
1148
4340
3734
3212
4844
4038
3513
4844
4138
1448
4542
1548
4516
48
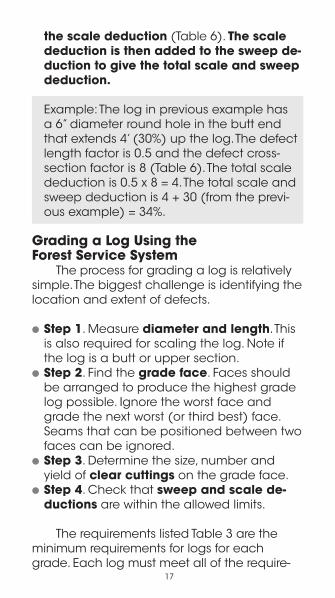
the scale deduction (Table 6). The scale deduction is then added to the sweep de-duction to give the total scale and sweep deduction.
Example: The log in previous example has a 6” diameter round hole in the butt end that extends 4’ (30%) up the log. The defect length factor is 0.5 and the defect cross-section factor is 8 (Table 6). The total scale deduction is 0.5 x 8 = 4. The total scale and sweep deduction is 4 + 30 (from the previ-ous example) = 34%.
Grading a Log Using the Forest Service System
The process for grading a log is relatively simple. The biggest challenge is identifying the location and extent of defects.
● Step 1. Measure diameter and length. This is also required for scaling the log. Note if the log is a butt or upper section.
● Step 2. Find the grade face. Faces should be arranged to produce the highest grade log possible. Ignore the worst face and grade the next worst (or third best) face. Seams that can be positioned between two faces can be ignored.
● Step 3. Determine the size, number and yield of clear cuttings on the grade face.
● Step 4. Check that sweep and scale de-ductions are within the allowed limits.
The requirements listed Table 3 are the minimum requirements for logs for each grade. Each log must meet all of the require-
18
Tab
le 6
. Sc
alin
g d
ed
uctio
n fa
cto
rs. T
o d
ete
rmin
e t
he s
ca
le d
ed
uctio
n, m
ultip
ly t
he le
ngth
fac
tor
by
the
cro
ss-s
ec
tion
fac
tor.
Ad
ap
ted
fro
m M
cKen
na, 1
981.
Le
ng
th fa
cto
rs
Log
dia
me
ter
(in
ch
es)
Len
gth
of l
og
tha
t ha
s d
efe
ct (
pe
rce
nt)
1020
3040
5060
7080
9010
08
1.2
2.4
3.5
4.7
5.9
7.1
8.2
9.4
10.6
11.8
9.9
1.8
2.7
3.6
4.5
5.4
6.3
7.2
8.1
9.0
10.7
1.4
2.1
2.8
3.6
4.3
5.0
5.7
6.4
7.1
11.6
1.1
1.7
2.3
2.9
3.4
4.0
4.6
5.2
5.8
12.5
1.0
1.4
1.9
2.4
2.9
3.3
3.8
4.3
4.8
13.4
.81.
21.
62.
02.
42.
83.
23.
64.
014
.3.7
1.0
1.4
1.7
2.0
2.4
2.7
3.1
3.4
15.3
.6.9
1.2
1.5
1.8
2.1
2.4
2.6
2.9
16.3
.5.8
1.0
1.3
1.5
1.8
2.0
2.3
2.6
17.3
.4.7
.91.
11.
41.
61.
82.
02.
318
.2.4
.6.8
1.0
1.2
1.4
1.5
1.8
2.0
19.2
.4.5
.7.9
1.1
1.2
1.4
1.6
1.8
20.2
.3.5
.6.8
1.0
1.1
1.3
1.4
1.6
21.2
.3.4
.6.7
.91.
01.
21.
31.
422
.1.3
.4.5
.7.8
.91.
01.
21.
323
.1.2
.4.5
.6.7
.81.
01.
11.
224
.1.2
.3.4
.5.6
.8.9
1.0
1.1
25.1
.2.3
.4.5
.6.7
.8.9
1.0
Cro
ss-s
ec
tion
fac
tors
Wid
th (
sho
rt a
xis)
of d
efe
ct (
inc
he
s)H
eig
ht (
lon
g a
xis)
of d
efe
ct (
inc
he
s)2
34
56
78
910
1112
1314
152
22
33
44
55
66
77
88
33
34
55
67
88
910
1011
44
56
78
910
1011
1213
145
67
89
1011
1214
1516
176
810
1112
1315
1617
1819
711
1214
1517
1819
2122
814
1617
1920
2223
259
1719
2123
2426
2810
2123
2527
2931
1125
2729
3133
1229
3234
3613
3436
3914
3942
1544
19
ments for each grade. Logs that do not meet Grade 3 are “cull” or below grade.
Clear Face GradingClear face log grading rules are used by
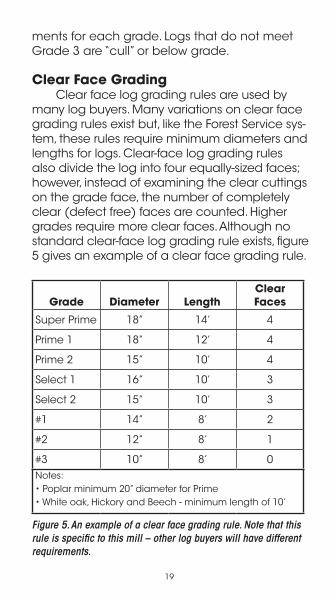
many log buyers. Many variations on clear face grading rules exist but, like the Forest Service sys-tem, these rules require minimum diameters and lengths for logs. Clear-face log grading rules also divide the log into four equally-sized faces; however, instead of examining the clear cuttings on the grade face, the number of completely clear (defect free) faces are counted. Higher grades require more clear faces. Although no standard clear-face log grading rule exists, figure 5 gives an example of a clear face grading rule.
Grade Diameter LengthClear Faces
Super Prime 18” 14’ 4
Prime 1 18” 12’ 4
Prime 2 15” 10’ 4
Select 1 16” 10’ 3
Select 2 15” 10’ 3
#1 14” 8’ 2
#2 12” 8’ 1
#3 10” 8’ 0Notes: •Poplarminimum20”diameterforPrime•Whiteoak,HickoryandBeech-minimumlengthof10’
Figure 5. An example of a clear face grading rule. Note that this rule is specific to this mill – other log buyers will have different requirements.
20
The Log Grading Rules Compared
The US Forest Service Log Grading RuleThe Forest Service system for grading logs
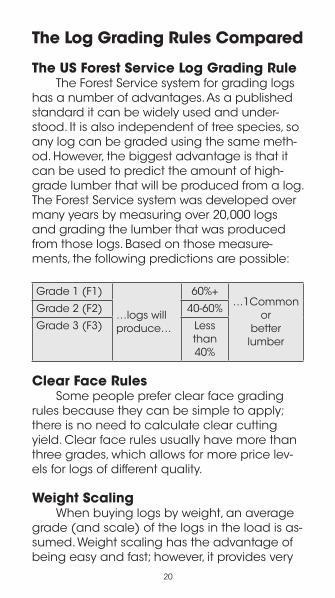
has a number of advantages. As a published standard it can be widely used and under-stood. It is also independent of tree species, so any log can be graded using the same meth-od. However, the biggest advantage is that it can be used to predict the amount of high-grade lumber that will be produced from a log. The Forest Service system was developed over many years by measuring over 20,000 logs and grading the lumber that was produced from those logs. Based on those measure-ments, the following predictions are possible:
Grade 1 (F1)
…logs will produce…
60%+…1Common
or better
lumber
Grade 2 (F2) 40-60%
Grade 3 (F3) Less than 40%
Clear Face RulesSome people prefer clear face grading
rules because they can be simple to apply; there is no need to calculate clear cutting yield. Clear face rules usually have more than three grades, which allows for more price lev-els for logs of different quality.
Weight ScalingWhen buying logs by weight, an average
grade (and scale) of the logs in the load is as-sumed. Weight scaling has the advantage of being easy and fast; however, it provides very
21
little information about the quality and quan-tity of lumber that will be produced.
Tree Grading
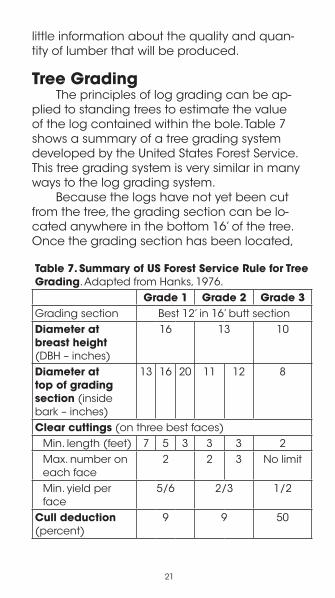
The principles of log grading can be ap-plied to standing trees to estimate the value of the log contained within the bole. Table 7 shows a summary of a tree grading system developed by the United States Forest Service. This tree grading system is very similar in many ways to the log grading system.
Because the logs have not yet been cut from the tree, the grading section can be lo-cated anywhere in the bottom 16’ of the tree. Once the grading section has been located,
Table 7. Summary of US Forest Service Rule for Tree Grading. Adapted from Hanks, 1976.
Grade 1 Grade 2 Grade 3Grading section Best 12’ in 16’ butt sectionDiameter at breast height (DBH – inches)
16 13 10
Diameter at top of grading section (inside bark – inches)
13 16 20 11 12 8
Clear cuttings (on three best faces)Min. length (feet) 7 5 3 3 3 2Max. number on each face
2 2 3 No limit
Min. yield per face
5/6 2/3 1/2
Cull deduction (percent)
9 9 50
22
the diameter of the tree is measured at breast height and the scaling diameter at the top of the grading section is estimated. Then, the size and number of clear cuttings on the grade face are determined. Of course, because the tree has not yet been cut, possible end defects are not a factor; only defect indica-tors on the surface of the tree are considered. Tree grading also can be used to predict the proportion of high-grade lumber that can be sawn from the tree (see Hanks, 1976).
Log Bucking OptimizationAfter a tree is felled and limbed, it is
“bucked” into logs. The location of the bucking cuts on the tree stem can greatly influence the grade, and thus the value, of the resulting logs. Studies have shown that improved buck-ing practices can increase the average value of logs by 15 to 35%. Loggers should keep the following rules-of-thumb in mind when making bucking decisions:
● Know the market. Different log buyers use different log grading methods and small differences in the grading system can result in large differences in log values. By being familiar with what the buyer wants, a logger can make bucking decisions that improve the value of the logs cut from trees.
● Find the best log. In general, it is best to locate the top grade log from a stem first and then arrange the other bucking cuts around it. Often this highest-value log will be the butt log but in many cases the best-
23
grade log will be located further up the stem. In some cases, this process will involve discarding cull sections at the butt end. Because of the relatively high value of top-grade logs, it is usually advantageous to lose some scale (volume) if it will result in a higher grade (quality) log.
It is also important to remember that longer lengths of logs do not necessarily have higher value. Although the minimum length requirements for various grades and products must be met, the length of a log should be adjusted (if possible) to yield the highest grade logs from the tree.
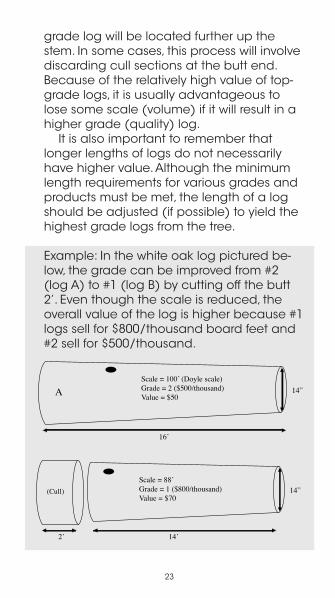
Example: In the white oak log pictured be-low, the grade can be improved from #2 (log A) to #1 (log B) by cutting off the butt 2’. Even though the scale is reduced, the overall value of the log is higher because #1 logs sell for $800/thousand board feet and #2 sell for $500/thousand.
14”
14’2’
Scale = 88’ Grade = 1 ($800/thousand)Value = $70
(Cull)
A
16’
14”Scale = 100’ (Doyle scale)Grade = 2 ($500/thousand)Value = $50
24
● Keep logs straight. As described above, sweep can lower log grade. For this reason, it is often best to buck stems where they curve. The resulting logs will be straighter and could be a higher grade.
● Put the defects on the end. Many log buy-ers will consider the location of defects in a log, especially if they are using the Forest Service’s grading system. Defects that are close to the ends of a log are easier for the sawyer to cut around (to produce clear lumber). For this reason, defects near the ends of a log often won’t reduce the grade as much as defects that are in the middle.
More information on hardwood log buck-ing is available on the internet at http://www.hardwoodvip.org/
SummaryA knowledge of how hardwood log values
are determined can help buyers and sellers decide on a fair price for timber sales. Mea-suring incoming log quality can also help sawmills to evaluate the efficiency of their mills. Log values are a function of the grade (qual-ity), scale (size) and wood species. Log grade affects the quality mix of lumber that will be sawn from a log; high quality logs produce a larger proportion of high quality lumber. Log grading rules vary by region and individual buyer but the principles remain the same ev-erywhere: High grade logs have few defects (especially knots), are large in diameter, and are of a minimum length. Small differences in
25
grade can mean large differences in price, so it is important to understand how grade is determined. Loggers in particular should be familiar with the log market and applicable grading rules so that they can make buck-ing decisions that maximize the value of logs coming from a tree.
ReferencesHanks, Leland F. 1976. Hardwood Tree Grades
for Factory Lumber. USDA Forest Service Research Paper NE-333.
Hardwood Value Improvement Program (HVIP). 2006. Increase Log Quality Through Improved Bucking. Internet website at http://www.hardwoodvip.org/. Accessed November 20, 2006.
Kenna, Karen M. 1981. Grading Hardwood Logs for Standard Lumber: Forest Service Standard Grades for Hardwood Factory Lumber Logs. Formerly Publication No. D1737-A, Forest Products Laboratory, USDA Forest Service. Revised 1981.
Rast, Everette D., David L. Sonderman and Glenn L. Gammon. 1973. A guide to hardwood log grading. USDA Forest Service General Technical Report NE-1
National Hardwood Lumber Association (NHLA). 2003. Rules for the Measurement & Inspection of Hardwood & Cypress. PO Box 34518, Memphis TN 38184. www.nhla.com

Programs in agriculture and natural resources, 4-H youth development, family and consumer sciences, and resource development.
University of Tennessee Institute of Agriculture, U.S. Department of Agriculture and county governments cooperating.
UT Extension provides equal opportunities in programs and employment.
PB1772-1M-12/09 (Rev) E12-4910-122-002-10
Visit the UT Extension Web site athttp://www.utextension.utk.edu/


![TalEval DH Grading & Outcomes Assessment Guide 2017[1] DH Grading... · task of grading students. The externship staff will simply log-in to TalEval, view the student’s “Unverified](https://img.pdfslide.us/doc/110x75/5f396d4b4ef0945b3871854a/taleval-dh-grading-outcomes-assessment-guide-20171-dh-grading-task.jpg)