Embed Size (px)
Citation preview

UNIVERSITÀ DEGLI STUDI DI NAPOLI FEDERICO II
DIPARTIMENTO DI SCIENZA DEGLI ALIMENTI
TESI DI DOTTORATO DI RICERCA
SCIENZE E TECNOLOGIE DELLE PRODUZIONI AGRO-ALIMENTARI
XXI CICLO
APPLICATION OF HIGH RESOLUTION NMR IN THE STUDY OF OILS AND FATS
TUTOR: PROF. RAFFAELE SACCHI
DOTTORANDO: ANTONELLO PADUANO
COORDINATORE: PROF. GIANCARLO BARBIERI

Non si riceve la saggezza, bisogna scoprirla da sé,
dopo un tragitto che nessuno può fare per noi, né può
risparmiarci, perché essa è una visuale sulle cose.
(M. Proust, Alla ricerca del tempo perduto)
To my family

INDEX
1 THE NUCLEAR MAGNETIC RESONANCE SPECTROSCOPY 1
1.1 ULTRA-HIGH RESOLUTION NMR (HR-NMR) 4 1.2 APPLICATIONS OF NMR TO OILS AND FATS ANALYSIS 5
1.2.1 1H-NMR spectroscopy. 7
1.2.2 13C-NMR spectroscopy 15
1.2.3 Other NMR experiments 26
2 MILK FAT CONTENT IN MIXED FATS 28
2.1 INTRODUCTION 28 2.2 MATERIALS AND METHODS 36
2.2.1 Fat samples 36 2.2.2 Standards and reagents 37 2.2.3 Preparation of FAMEs and Gas chromatography 37 2.2.4 High Resolution
13C-NMR spectroscopy 37
2.3 RESULTS AND DISCUSSION 40 2.4 CONCLUSIONS 46
3 HYDROPEROXIDE DECOMPOSITION PRODUCTS IN THERMALLY OXIDIZED OILS 47
3.1 INTRODUCTION 47 3.2 MATERIALS AND METHODS 58
3.2.1 Oil samples and thermal stressing 58 3.2.2 Standards and reagents 58 3.2.3 Chemical characterization of oils 59 3.2.4 Total polar compounds and short chain fatty acids analysis 59 3.2.5 1
H-NMR spectroscopy 60 3.3 RESULTS AND DISCUSSION 62
3.3.1 1H-NMR quantitative analysis of aldehydes 64
3.3.2 Relationship between unsaturated aldehydes and methyl-octanoate 68 3.3.3 Relationship between total aldehydes and total polar compounds 69 3.3.4 NMR Sensitivity 70
3.4 CONCLUSIONS 71
4 GEOGRAPHICAL CHARACTERIZATION OF EXTRA VIRGIN OLIVE OILS 72
4.1 INTRODUCTION 72 4.2 MATERIALS AND METHODS 78
4.2.1 Oil samples 78 4.2.2 Standards and reagents 79 4.2.3 Preparation of FAMEs and Gas chromatography 80 4.2.4 1
H-NMR spectroscopy 80 4.3 RESULTS AND DISCUSSION 82 4.4 CONCLUSIONS 88
5 NEW HORIZONS 89
ACKNOWLEDGMENTS 91
BIBLIOGRAPHY 92

CHAPTER 1 THE NUCLEAR MAGNETIC RESONANCE SPECTROSCOPY
1
1 THE NUCLEAR MAGNETIC RESONANCE SPECTROSCOPY
The Nuclear Magnetic Resonance Spectroscopy (NMR) is a powerful analytical
method that allows obtaining detailed information on molecular structure of organic
compounds. It’s one of the most common analytical methods in chemistry and the
related sciences due to the wealth of information available from the spectra.
Accordingly, both 1H- and 13CNMR spectroscopy are routinely used in lipid
chemistry (Gunstone et al., 2007). Also being the more recent spectroscopic
technique, it has exceeded all the other techniques for potentiality of application in
several fields of chemistry, finding employment also in other fields which medical
sciences (Lanzetta, 2002).
NMR is an analytical method that makes use of the fact that nearly all molecules
contain magnetic nuclei and can therefore be detected in a strong magnetic field
when irradiated with a specific radiofrequency (Falch, 2006).
In 1945 was observed for first time the physical phenomenon of the Nuclear
Magnetic Resonance, and that it made to win the Nobel Prize in physics to Bloch
(Stanford University) and Purcell (Harvard University) in 1952. In 1953 the first
commercial spectrometer was constructed operating to Continuous Wave (CW-
NMR) and used to observation of proton only. In years '70 the second generation of
spectrometers to Fourier Transform (FT-NMR) has allowed the observation of less
abundant nuclei: 1H, 13C, 15N, 19F, 29Si, and 31P. The contemporary evolution of
computers has widened the NMR applications with the possibility to obtain two and
three dimensions spectra (2D and 3D-NMR). In organic chemistry NMR
spectroscopy have wide application in the definition of structure of natural
substances and in the study of reaction mechanisms (Lanzetta, 2002).
NMR spectroscopy involves a transition of nuclear spin induced from an
opportune radio-frequency after to have subordinate the nucleus in examination to
the influence of an external magnetic field. NMR studies a magnetic nucleus, like
that of a hydrogen atom (1H is the most receptive isotope at natural abundance), by
aligning it with a very powerful external magnetic field and perturbing this alignment

CHAPTER 1 THE NUCLEAR MAGNETIC RESONANCE SPECTROSCOPY
2
using an electromagnetic field. The response to the field (the perturbing), is what is
exploited in NMR spectroscopy. Therefore with the NMR the atomic nuclei are
examinated directly and not the electrons. Every information on around chemical
comes deducted observing the behaviour of the atomic nuclei (Falch, 2006).
The simplest atom, hydrogen, is found in almost all organic compounds and is
composed of a single proton and a single electron. The hydrogen atom is denoted 1H,
in which the superscript signifies the sum of the atom's protons and neutrons (i.e., the
atomic mass of the element). For the purpose of NMR, the key aspect of the
hydrogen nucleus is its angular momentum properties, which resemble those of a
classical spinning particle. Because the spinning hydrogen nucleus is positively
charged, it generates a magnetic field and possesses a magnetic moment μ, just as a
charge moving in a circle creates a magnetic field (Figure 1.1). The magnetic
moment μ is a vector, because it has both magnitude and direction, as defined by its
axis or spin in the figure. The NMR experiment exploits the magnetic properties of
nuclei to provide information on molecular structure (Lambert and Mazzola, 2003).
Figure 1.1. Analogy between a charge moving in a circle and a spinning nucleus
The spin properties of protons and neutrons in the nuclei of heavier elements
combine to define the overall spin of the nucleus. When both the atomic number (the
number of protons) and the atomic mass (the sum of the protons and neutrons) are
even, the nucleus has no magnetic properties, as signified by a zero value of its spin
quantum number I (Figure 1.2).

CHAPTER 1 THE NUCLEAR MAGNETIC RESONANCE SPECTROSCOPY
3
Figura 1.2. Three classes of nuclei.
Such nuclei are considered not to be spinning. Common nonmagnetic
(nonspinning) nuclei are carbon (12C) and oxygen (16O), which therefore are invisible
to the NMR experiment. When either the atomic number or the atomic mass is odd,
or both are odd, the nucleus has magnetic properties and is said to be spinning. For
spinning nuclei, the spin quantum number can take on only certain values. Those
nuclei with a spherical shape have a spin of , and those with a nonspherical, or
quadrupolar, shape have a spin of 1 or more (in increments of ). Common nuclei
with a spin of include 1H, 13C, 15N, 19F, 29Si, and 31P. Thus, many of the most
common elements found in organic molecules (H, C, N, P) have at least one isotope
with I = (although oxygen does not). The class of nuclei with I = is the most
easily examined by the NMR experiment. Quadrupolar nuclei (I > ) include 2H, 11B, 14N, 17O, 33S, and 35Cl.
The magnitude of the magnetic moment produced by a spinning nucleus varies
from atom to atom in accordance with the equation μ = yhI. The quantity h is
Planck's constant divided by 2 , and y is a characteristic of the nucleus called the
gyromagnetic or magnetogyric ratio. The larger the gyromagnetic ratio, the larger is
the magnetic moment of the nucleus. Nuclei that have the same number of protons,
but different numbers of neutrons, are called isotopes (1H/2H, 14N/15N). The term
nuclide is generally applied to any atomic nucleus.
All nuclei that have a spin quantum number value I 0 possesses a magnetic
moment μ and, when are subordinated to the action of an external magnetic field and
irradiated by a radio frequency, they turn out active to the NMR, that is give useful

CHAPTER 1 THE NUCLEAR MAGNETIC RESONANCE SPECTROSCOPY
4
and interpretable marks for the definition of the molecular structure.
The most common magnetic nuclei are 1H, 13C, 31P, 19F, 14N with natural
abundances close to 100%, except 13C which has 1.1% natural abundance. In lipid
research 1H, 13C and 31P are the most studied nuclei. Nuclei in different chemical
environments have slightly different resonance frequencies. The resonances obtained
from NMR are expressed as chemical shift values ( ) in ppm units relative to a
reference compound (tetramethylsilane ( = 0.0 ppm) for 1H).
While resonance frequency is given in Hz, which is dependent on the acquisition
conditions, the chemical shift scale is a dimensionless quantity and a more
convenient way of presenting the spectra. The chemical shift values are dependent on
molecular structure (Hunter et al, 2005), but do also vary based on solvent,
concentration (Mannina et al., 2000; Gunstone, 2004) and pH (Fan, 1996).
1.1 ULTRA-HIGH RESOLUTION NMR (HR-NMR)
The application of Nuclear Magnetic Resonance (NMR) spectroscopy to the
analysis and quality control in foods also shows great developments in the last few
years. The increase of new applications and the attention to this technique by
scientists, official control institutions and food industries can be attributed both to the
high specificity and versatility of the NMR technique and to the improvement of
NMR instrument performances and availability (Sacchi and Paolillo, 2007).
Ultra High-Resolution NMR (HR-NMR) utilises frequencies above 1 GHz and is
available together with cryo-probes in recent years. HR-NMR has been recently
applied in many more food authenticity studies. The advantage of HR-NMR is that
permits the observation of very detailed spectral parameters of a food sample (high
resolution of signals in natural food mixtures and used without any previous
treatment) as well as a very high sensitivity. These two factors are indeed quite
important in assigning components and measuring their intensity ratios. In general
qualitative and quantitative criteria are considered in HR-NMR. Qualitative criteria
are discussed in terms of linearity and selectivity. NMR is definitely the best
analytical method from the linearity point of view since the intensity of resonances is

CHAPTER 1 THE NUCLEAR MAGNETIC RESONANCE SPECTROSCOPY
5
strictly proportional to the number of nuclei resonating at a certain frequency.
Selectivity is also extremely good because NMR differentiates all the isotopes of the
elements and even for a given isotope is able to yield measurable differences in
chemical shift for different chemical environments.
From a quantitative point of view sensitivity, precision and accuracy are crucial
criteria. Sensitivity depends on the signal to noise ratio (S/N) which can be
considered acceptable when it is higher than 10. Modern NMR spectrometers easily
meet these requirements. Precision and accuracy can be determined from mean
standard deviations on replicates. It has been shown that by using ultra-high field
spectrometers precision and accuracy are comparable to HR-GC (high resolution gas
chromatography) techniques (Sacchi and Paolillo, 2007). The major disadvantage of
HR-NMR is that it is one of the most expensive analytical techniques to employ,
both in terms of the initial capital outlay and running costs (Reid et al., 2006).
1.2 APPLICATIONS OF NMR TO OILS AND FATS ANALYSIS
Food quality, authenticity and traceability are becoming very important aspects in
the food chain and market. Safety, nutritional and sensory quality are very important
for both fresh and processed food products and recent issues are related to the
assurance of the food geographic origin, raw material used (botanical variety or
cultivar, animal species) and processes applied to produce it (Aparicio et al., 1999;
Sacchi and Paolillo, 2007).
Authentication of food products is of primary importance for both consumers and
industries, at all levels of the production process, from raw materials to finished
products. From the legislative point of view, quality standards have been established
through the requirement of quality labels that specify the chemical composition of
each product. From the economic point of view, product authentication is essential to
avoid unfair competition that can create a destabilized market and disrupt the
regional economy and even the national economy. All food products targeted for
adulteration are high-commercial-value products and/or produced in high tonnage
around the world (Cordella et al., 2002).

CHAPTER 1 THE NUCLEAR MAGNETIC RESONANCE SPECTROSCOPY
6
One of the main fields in which High Resolution NMR has been largely applied is
food lipids. The use of NMR in lipid science has begun some forty years ago with
the pioneering applications of proton NMR to oils and fats made with the aim of
assess the global unsaturation (Johnson and Shoolery, 1962). These Researchers
measured the degree of unsaturation of fatty acids and their triglycerides. Area
measurements of signals assignable to olefinic protons in the fatty acid chains and
protons in the glyceryl radical allowed a determination of average molecular weight.
This measure were used to calculate an iodine number which are compared to that
obtained on the same sample by the Wijs method.
Since 1962 to 2008 many NMR applications in the study of oils, fats and lipids
appear in the scientific literature and also several reviews on 13C and 1H NMR
applications have been recently published. The results and applications relevant for
our study will be briefly discussed in the following paragraphs.

CHAPTER 1 THE NUCLEAR MAGNETIC RESONANCE SPECTROSCOPY
7
1.2.1 1H-NMR spectroscopy.
The term "proton" is routinely used to indicate 1H-NMR spectroscopy even
though the atoms, the hydrogens, in the molecules are the species studied. 1H NMR
spectroscopy has become an extremely valuable research tool in elucidating the
structure of molecules as the chemical shifts (position of signals in the spectrum) of
the protons are often very sensitive to minor changes in molecular structure.
For the purpose of obtaining NMR spectra, lipid samples are usually dissolved in
a deuterated solvent or one that does not contain hydrogen. Deuterated chloroform
(CDCl3) is currently the most common solvent used for this purpose. With about 1
mg of oil, a 1H NMR spectrum can be recorded in few minutes. All values reported
in Table 1.2.1.1 use the scale (ppm), in which to the signal of tetramethylsilane
(TMS) has been assigned the value = 0. In practice, many spectra are now obtained
using the known shift values of the solvent signal(s) as reference.
Table 1.2.1.1 contains information on the most common functional groups in
lipid chemistry and their 1H-NMR chemical shifts. To illustrate these values, the 1H-
NMR spectrum of methyl linoleate (Figure 1.2.1.1) is given as an example since it
contains most of the common functional groups in a fatty acid chain. The
assignments are shown in Figure 1.2.1.2. The abbreviations in parentheses refer to
the splitting of the signals, s = singlet, d = doublet, t = triplet, q4 = quartet, q5 =
quintet, m = multiplet (usually broad; br) (Gunstone et al., 2007). 1H nuclear magnetic resonance spectroscopy is a technique that can be very useful
to determine the proportion of the different acyl groups in oils and fats, in a very
short period of time. The area of the signals of the 1H NMR spectra is proportional to
the number of hydrogen atoms that produce the signal (Sacchi et al., 1989, 1996;
Guillèn et al., 2003a). High-resolution 1H NMR spectroscopy has limited use in fatty
acid analysis owing to the small range of chemical shifts covered by protons, which
resulted in the small number of signals in the proton spectrum. The splitting patterns
of proton signals, however, can provide unique structural properties of lipid
molecules under investigation (Lie Ken Jie and Mustafa, 1997).
CHAPTER 1 THE NUCLEAR MAGNETIC RESONANCE SPECTROSCOPY
8
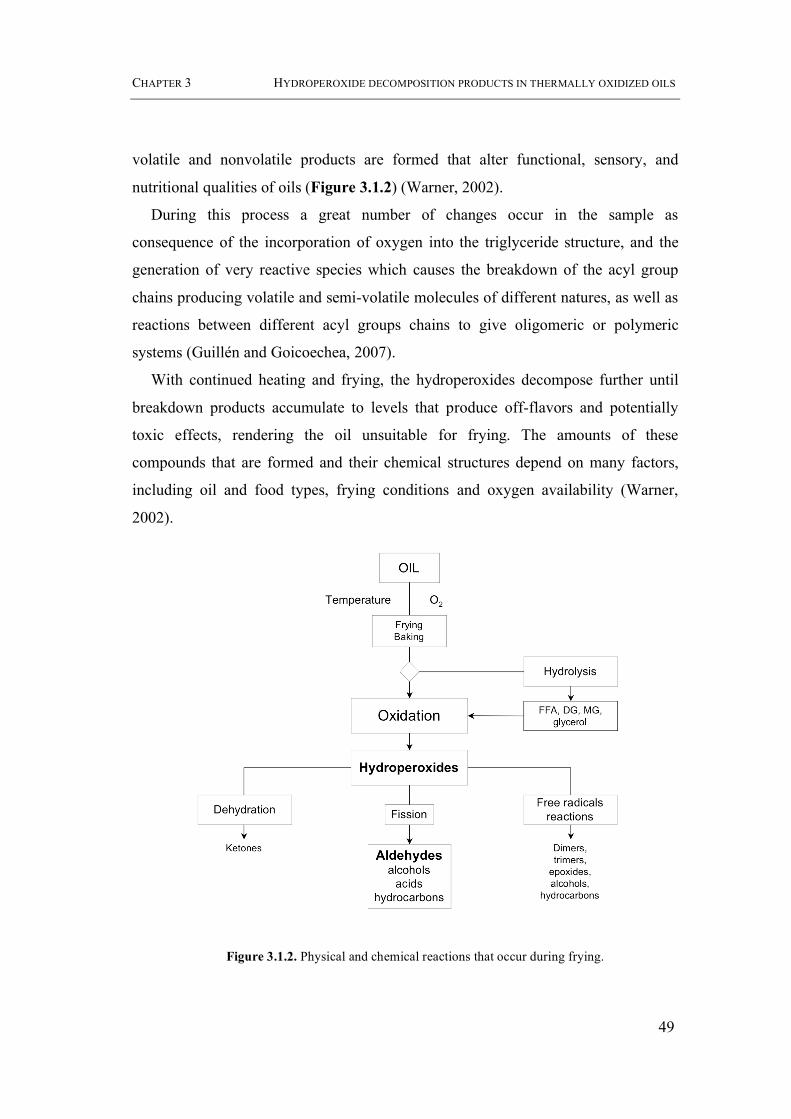
Table 1.2.1.1. Assignments of proton signals in the 1H-NMR spectra of fatty compounds; all values relative to tetramethylsilane (TMS) = 0 ppm
a Values in parentheses apply to compounds that may absorb outside this range. b Concentration-dependent; higher when diluted. Source: From Gunstone F.D., Harwood J.L. and Dijkstra A.J. (2007). In The Lipid Handbook -
Third Edition CRC Press Taylor & Francis Group.

CHAPTER 1 THE NUCLEAR MAGNETIC RESONANCE SPECTROSCOPY
9
Figure 1.2.1.1. 1H-NMR spectrum of methyl linoleate.
Figure 1.2.1.2. Example of the common functional groups in a fatty acid chain.
In Figure 1.2.1.3 the spectrum of an olive oil is shown as an example. The
labelled signals can be observed in all triglyceride seed oils that contain usual fatty
acids, including linolenic acid. Signal groups at (ppm) 0.85 (CH=CHCH2CH3 all
acids except linolenyl); 0.95 (CH2CH2CH2CH3 Linolenyl); 1.28 (CH2 All acyl
chains), 1.6 (CH2-CH2-COOH, All acyl chains); 2.05 (CH2CH=CH, All unsaturated
fatty acids), 2.2 (-CH2-COOH, All acyl chains); 2.8 (CH=CHCH2CH=CH, Linoleyl
and linolenyl); 4.19 (CH2OCOR, Glycerol triacylglycerols); 5.15 (CHOCOR,
Glycerol triacylglycerols); 5.29 (CH=CH, All unsaturated fatty acids); 7.26 (CHCl3,

CHAPTER 1 THE NUCLEAR MAGNETIC RESONANCE SPECTROSCOPY
10
Chloroform solvent) can be observed in the spectrum. As only a relatively small
number of signals at > 9 ppm can be observed, the information impact of 1H NMR
spectra is limited in comparison with that of 13C NMR spectra (Sacchi et al., 1997;
Spitzer, 1999).
Figure 1.2.1.3. 400 MHz 1H NMR spectrum of a virgin olive oil. (from Sacchi et al., 1997)
The proton resonances were explained in terms of the long-range deshielding
effects which are produced by the functional groups of cis-unsaturated fatty acids
and esters, i.e. the double bonds and carboxylic groups, upon methylenes up to five
or six carbons distant from the functional groups. The chemical shifts were predicted
by adding to the basic unperturbed value for a middle chain methylene ( = 1,25) and
for a methyl group ( = 0,88); the - to - substituent effects of the functional groups
(Vlahov, 1999). The configuration of the double bond protons could be determined
by the coupling constant of methyne protons which is always larger for trans than for
cis bonds, especially for monounsaturated compounds, even if this is not possible in
H-2
H-1 / H-3

CHAPTER 1 THE NUCLEAR MAGNETIC RESONANCE SPECTROSCOPY
11
practice because the chemical shift differences of methyne protons of isolated double
bonds are small and produce a signal envelope that is very difficult to analyse
(Vlahov, 1999). In conjugated linoleic acid (CLA) the peaks of the olefinic protons
are split. The number of signals depends on the double bond configuration. Two
peaks are observed when the two double bonds have identical configuration and four
signals when the configuration is not identical (Lie Ken Jie et al., 1997; Gunstone et
al., 2007).
Glycerides. The glycerides, 1- and 2-monoglycerides, 1,2-diglycerides, 1,3-
diglycerides and triglycerides can be detected on the basis of the resonances of the
protons attached to glycerol carbons. Three well resolved signals appear for the H-1,
H-2 and H-3 protons in 1-mono and 1,2-diglycerides, whereas the H-1 and H-3
protons resonate as a single peak shifted at lower frequency from H-2 in 2-mono and
triglycerides (Figure 1.2.1.3). Only one signal appears for the glycerol protons in
1,3-diglycerides (Sacchi et al., 1991, 1996; Gunstone et al., 2007). The resolution of
proton resonances of 1,3-diglycerides and triglycerides, is improved by acylating the
diglyceride hydroxyl groups with trichloroacetyl isocyanate which makes the , ’-
CH2 of 1,3-diglycerides shift to higher frequency. As a consequence, they appear
better resolved from the triacylglycerol resonances (Sacchi et al., 1991). The method
was used for the quantitative determination of 1,2- and 1,3-diglycerides in virgin
olive oils and, in particular, to detect the adulteration of virgin olive oils by refined
olive oils whose diglyceride content is substantially larger.
Fatty acids. The amounts of individual fatty acids can be obtained by means of 1H
nuclear magnetic resonance (1H-NMR) spectroscopy in an oil or fat sample (Knothe
and Kenar, 2004). Probably the first report on the 1H-NMR spectra of fatty
compounds was published in 1959 (Hopkins and Bernstein). Three years later, the
presumably first report using 1H-NMR for quantitatively determining unsaturation
and average molecular weight followed (Johnsthon and Shoolery, 1962).
Further, the molar percentages of unsaturated fatty acids in triglycerides can be
measured by comparing the peak areas of the allylic methylenes with those of the
methyl signals. Considering that each mole of monoenoic acid or polyunsaturated

CHAPTER 1 THE NUCLEAR MAGNETIC RESONANCE SPECTROSCOPY
12
fatty acid contains four allylic protons, the ratio of peak areas of allylic methylenes
( = 2.05 ppm) and terminal methyl of all chains ( = 0.8 - 1.0 ppm) lower than 4:3
indicates the presence of saturated fatty acids, whereas the ratio is zero for
triacylglycerols containing only saturated chains (Sacchi et al., 1989, 1997; Vlahov,
1999). The use of 1H-NMR has since expanded to include the identification of
vegetable oils as well as identifying individual vegetable oils in mixtures thereof
(Fauhl et al., 2000; Sacco et al., 2000; Guillén and Ruiz, 2003b; Brescia and Sacco;
2008). Since vegetable oils contain various proportions of saturated, oleic, and
polyunsaturated acyl groups, the resulting signals have different chemical shifts and
shapes depending on these proportions. A careful observation of the shape and
number of peaks of each signal present in the spectra and the use of multivariate
statistical method allows to find significant differences between vegetable oils of
different composition (Guillén and Ruiz, 2003b). The adulteration of olive oil with
seed oils such as soybean and rapeseed oils, whose linolenic acid content is higher
than that of olive oil, can be detected by using the methyl signal of n-3 fatty acids
resonating at 0.94 ppm, in olive oil the only n-3 fatty acid detected is linolenic acid.
Owing to its low intensity, the resonance at 0.94 ppm has to be compared with the
13C satellites of the methyl resonance at 0.84 ppm whose amount is 0.57% of the
methyl signal (Sacchi et al., 1996). Nevertheless, the full fatty acid pattern of olive
oils can be derived from the proton spectrum by measuring the intensities of the
methyl resonance at 0.84 ppm as a total of saturated, monounsaturated and
polyunsaturated (linoleic) chains, whereas the allylic (1.97 ppm) and the bis-allylic
(2.73 ppm) proton resonances represent the sum of oleic plus linoleic acid and of
linoleic plus linolenic acid, respectively (Sacchi et al., 1996).
The analysis of the 1H NMR spectrum of fish oils permits the quantitative
determination of of specific fatty acids (DHA and EPA) in materials such as fish oils
(Sacchi et al., 1993a; Igarashi et al., 2000, 2002; Tyl et al., 2008).
Aldehydes and Volatile Compounds. The first 1H NMR studies regarding
oxidation processes of edible oils have been conducted on pure triacylglycerols, like
trilinolein, trilinolenin, and triolein (Frankel, 1987). The oxidation of unsaturated

CHAPTER 1 THE NUCLEAR MAGNETIC RESONANCE SPECTROSCOPY
13
fatty acids by oxygen, generally known as autoxidation, is important in the
development of rancidity and other “off-flavours” in edible fats. The secondary
reactions occurring during the autoxidation produce by chain scission, shorter-chain
carbonyl compounds (mainly saturated and unsaturated aldehydes). The volatile
compounds of virgin olive oils have been studied by high field (600 MHz) NMR
spectroscopy (Sacchi et al., 1996). The aldehydic protons of saturated aldehydes,
hexanal and heptanal resonate as a singlet at 9.74 ppm, whereas trans-2-hexenal,
which represents more than 50% of the headspace above fresh extra virgin olive oils,
resonates at 9.46 ppm as a doublet (J = 7,96 Hz) (Vlahov, 1999). In model sistems,
the heating of oils in presence of pure oxygen formed principally
monohydroperoxides, together with bis-hydroperoxides and tris-hydroperoxides
(Neff et al., 1988), that produce a characteristic signal at 8-8.9 ppm, due to the
hydroperoxide group. Other authors (Sacchi et al., 2006a; Guillén and Ruiz, 2005a,b,
2006, 2008) have directly monitored by 1HNMR spectroscopy the deterioration
process of edible oils submitted to thermal stressing, in order to study the nature and
levels of potentially toxic products, which were produced during heating at frying
temperature. They detected the presence of signals due to hydroperoxides and
saturated, mono-unsaturated, di-unsaturated, and hydroxy mono-unsaturated
aldehydes. These aldehydes can be easily detected in the low-field region of the 1H
NMR spectrum (Sacchi et al., 2006a; Guillén and Goicoechea, 2007) and can be
used to follow the oxidation process of an oil and to evaluate its oxidative stability
(Brescia and Sacco, 2008).
The composition of volatiles plays an important role in defining the sensory
quality of virgin olive oils. Positive (green-fruity odor, etc.) and negative attributes
(bitter tasting, etc.) have been correlated with the presence of aldehydes, alcohols,
polyphenols, terpenes, and acetic acid. The very low concentration of these
compounds in virgin olive oil makes possible their direct determination only by high
field (500-600 MHz) 1HNMR (Mannina and Segre, 2002) further studies are needed
to establish more strict correlations between minor compounds determined directly
by high field NMR and sensory profile of virgin olive oils.

CHAPTER 1 THE NUCLEAR MAGNETIC RESONANCE SPECTROSCOPY
14
Sterols. The signal due to methyl CH3 in position 18 of the sterols resonates
between 0.6 and 0.7 ppm. The signal due to methyl 18 signal of -sitosterol,
resonating at 0.62 ppm, has been clearly identified in virgin and refined olive oils
(Sacchi et al., 1996).
Phenolic Compounds. Phenolic compounds contribute to olive oil sensory
quality, since they are responsible for its bitter and pungent flavor. The prevalent
phenolic constituents of olive oil are secoiridoid derivatives, such as the dialdehydic
form of the elenolic acid linked to hydroxytyrosol or to tyrosol (ligstroside) and the
elenolic acid linked to hydroxytyrosol (oleuropein aglycon) (Sacchi et al., 1997;
Brescia and Sacco, 2008). Their structure has been identified using NMR
(Montedoro et al., 1993), after extraction in absolute methanol and separation by
HPLC. Other compounds detected in olive oil phenolic fraction, whose structure was
elucidated with NMR, are demethyl-oleuropein, glucosides of hydroxytyrosol
(Bianco and Uccella, 2000) and also two soluble lignans-pinoresinol and its
derivative, 1-acetoxypinoresinol (Brenes et al., 2000).
A detailed assignment of 1H NMR spectra of phenolic compounds extracted by
SPE from virgin olive oils and analyzed in methanol-d solution by NMR was
reported by Dais and Christophoridou (2008).

CHAPTER 1 THE NUCLEAR MAGNETIC RESONANCE SPECTROSCOPY
15
1.2.2 13
C-NMR spectroscopy
The chemical shift values of 13C normally ranges from 0 to 200 ppm and spectra
are normally broadband, proton decoupled and therefore show the resonances as
single lines. The lower abundance of 13C compared to 1H, makes it is 400 times less
sensitive to the NMR phenomena. The number of scans is usually 1000 or more. The
sample size for a routine 13C-NMR spectrum is 50-100 mg but by investment in a
large number of scans high quality spectra can be obtained with as little as 1 mg. It
therefore takes a longer time to acquire 13C spectra, though they tend to look simpler.
Overlap of peaks is much less common than for 1H NMR which makes it easier to
distinguish among different carbon atoms (Sacchi et al., 1989; Falch, 2006).
Similar to 1H-NMR a 13C-NMR data for linoleic acid have been shown (Figure
1.2.2.1.). The 13C-NMR spectrum of the methyl ester of linoleic acid is shown in
Figure 1.2.2.2.
Figure 1.2.2.1. Example of the common functional groups in a linoleic acid chain and their 13C-NMR chemical shift in CDCl3.
Figure 1.2.2.2. 13C-NMR spectrum of methyl linoleate.

CHAPTER 1 THE NUCLEAR MAGNETIC RESONANCE SPECTROSCOPY
16
Generally, many effects observed in 1H-NMR are also found in 13C-NMR. For
example, the methyl and methylene signals are upfield in the spectrum, while signals
of olefinic carbons are farther downfield. The number and nature of double bonds
affects the chemical shifts as does the proximity of multiple double bonds to each
other and the presence of functional groups. Table 1.2.2.1 is a compilation of the
chemical shifts of functional groups in 13C-NMR (Gunstone et al., 2007).
Table 1.2.2.1. Assignments of carbon signals in the 13C-NMR spectra of fatty compounds (CDCl3)

CHAPTER 1 THE NUCLEAR MAGNETIC RESONANCE SPECTROSCOPY
17
Table 1.2.2.1. Continued

CHAPTER 1 THE NUCLEAR MAGNETIC RESONANCE SPECTROSCOPY
18
Table 1.2.2.1. Continued
Source: From Gunstone F.D., Harwood J.L. and Dijkstra A.J. (2007). In The Lipid Handbook - Third Edition CRC Press Taylor & Francis Group.
The fact that 13C-NMR spectra cover a wider range of chemical shifts (0 to 200
ppm and even beyond) facilitates some aspects of evaluation compared to 1H-NMR.
A major aspect is that some functional groups impart shift values in parts of the
spectrum where they do not overlap with the peaks of other moieties. 13CNMR spectroscopy is routinely used in lipid chemistry. Edible lipids are
composed of more than 95% of triacylglycerols. Therefore, the analysis of
triacylglycerol components (fatty acids) and, more recently, triacylglycerols
themselves, was primarily used to determine oil authenticity. Thus, one of the first

CHAPTER 1 THE NUCLEAR MAGNETIC RESONANCE SPECTROSCOPY
19
applications of NMR to oil analysis was the simultaneous determination of the fatty
acid composition and positional distribution of triacylglycerols by high-resolution 13C NMR (Pfeffer et al., 1977b; Ng, 1983, 1985; Ng and Ng, 1983; Wollenberg,
1990; Sacchi et al., 1992; Knothe et al., 1995). When an oil is submitted to NMR
analysis, the spectrum obtained is that of triacylglycerols. In Figure 1.2.2.3, the 13C
NMR spectrum of a virgin olive oil is shown. 13C NMR resonances can be grouped
into four well-defined spectral regions: carbonyl carbons ranging from 173.3 to
172.8 ppm; unsaturated carbons ranging from 132.0 to 127.1 ppm; glycerol carbons
ranging from 69.1 to 61.6 ppm; aliphatic carbons ranging from 34.3 to 14.0 ppm.
The assignment of the different signals has been the objective of many studies and is
nowadays clearly resolved (Ng, 1983; Bonnet et al., 1990; Sacchi et al., 1992;
Gunstone, 1993a,b; Van Calsteren et al., 1996; Mannina et al., 1999; Vlahov et al.,
1999; Alemany, 2002; Simova et al., 2003; Vlahov, 2006). The main resonances
observed in the 13C NMR spectra of edible oils are collected in Table 1.2.2.2
(Gunstone et al., 2007).
Figure 1.2.2.3. Typical 13C NMR spectrum of a virgin olive oil. (from Sacchi et al., 1997)

CHAPTER 1 THE NUCLEAR MAGNETIC RESONANCE SPECTROSCOPY
20
Table 1.2.2.2. Chemical shift assignments of the 13C NMR signals of the main components of edible oilsa
a Assignments are abbreviated by fatty acid, carbon number, and position in the glycerol. 1(3)- and 2-positions of glycerol are designated by the Greek symbols and , respectively. Labeling of acyl chains: P, palmityl; St, stearyl; O, oleyl; L, linoleyl; Ln, linolenyl chain. Depending on the oil composition and experimental conditions, a lower number of signals is usually observed. Source: From Gunstone F.D., Harwood J.L. and Dijkstra A.J. (2007). In The Lipid Handbook - Third Edition CRC Press Taylor & Francis Group.
The different oils usually exhibit some differences in quantitative chain
composition rather than in qualitative acid profile, therefore exhibiting analogous
signals in the 13C NMR spectrum, although with varying intensities which are
characteristic for each oil. Positions and intensities of the signals are a consequence
of the fatty acid profile of the oils and the position of these acyl chains in the
triacylglycerols (Hidalgo and Zamora, 2003). Thus, when studying the carbonyl
region (Figure 1.2.2.4), the substituents at the positions sn-1,3 and sn-2 of the
triacylglycerol can be clearly distinguished.

CHAPTER 1 THE NUCLEAR MAGNETIC RESONANCE SPECTROSCOPY
21
Figure 1.2.2.4. 13C NMR carbonyl spectra of ester carbons of triglycerides. The carbonyl peaks are defined as attached to the sn-1,3 or sn-2 position. The acyl groups are saturated, monounsaturated and polyunsaturated (from Bonnet et al., 1990).
Analogous results can also be obtained when analyzing the olefinic region. Thus,
the different olefinic carbons of the different fatty acids and in the different positions
of the triacylglycerol molecule appear at different chemical shifts (Figure 1.2.2.5).
Figure 1.2.2.5. The olefinic carbon region 124–134 ppm of the 300 MHz 13C spectrum of an olive oil sample. The resonances of the unsaturated carbons of oleyl (O), linoleyl (L) and linolenyl (Ln) chains esterified at 2-glycerol positions are indicated (from Vlahov, 1999).

CHAPTER 1 THE NUCLEAR MAGNETIC RESONANCE SPECTROSCOPY
22
All this information can be used for fatty acid determination. For this purpose
HR-13C-NMR was applied to the study of fish lipid composition and structure
(Aursand and Grasdalen, 1992; Aursand et al., 1993, 1995, 2000; Vatèle et al., 1998;
Aursand and Alexon 2001; Sacchi et al., 1993a,b, 1994, 2006b; Scano et al., 2008)
and for the analysis of conjugated linoleic acid isomers (Davis et al., 1999). 13C NMR is also useful for distinguishing different glyceride classes and for
verifying the presence of non triacilglycerol compounds such as mono-, diglycerides
and phospholipids (Sacchi et al., 1990, 1993b, 1995; Medina and Sacchi, 1994; Ng,
2000). The glycerol carbons of mono-, di- and triacylglycerols, resonate in the
spectral region from 60 to 72 ppm. The chemical shift assignments were based on the
assumption that acylglycerol symmetry or asymmetry determines the number of
resonances and their relative intensities. Therefore, 2-monoacylglycerols, 1,3-
diacylglycerols and triacylglycerols give two signals for the glycerol moiety with
intensity ratios 1:2, whereas the asymmetrical 1-monoacylglycerols and 1,2-
diacylglycerols give three separate signals (Vlahov, 1999). The spectral region of
glycerol carbons of a standard mixture of glycerides, is reported in Figure 1.2.2.6
and the chemical shift assignments in Table 1.2.2.3. The shift data demonstrate that
the length and degree of unsaturation of the acyl chains does not influence
significantly the chemical shifts of glycerol carbons.
Table 1.2.2.3. 13C NMR chemical shifts (ppm) of glycerol
carbon atoms in glycerides at different esterification degree (from Vlahov, 1999).

CHAPTER 1 THE NUCLEAR MAGNETIC RESONANCE SPECTROSCOPY
23
Figure 1.2.2.6. The glycerol carbon region 60-72 ppm of the 300 MHz 13C spectrum of a standard mixture of glycerides at different esterification degree. The resonances of glycerol carbons are labelled as -CH2OAc and -CH2OH in correspondence of an acylated and a non-acylated alcoholic group of the glycerol molecule (from Vlahov, 1999).
The fatty acids composition can be evaluated in the 13C NMR spectrum by
evaluating the intensities of the signals of methylene and olefinic carbons. The
resonances of methylene and methyl carbons of saturated and unsaturated acyl chains
are reported in Figure 1.2.2.7.
From the observation of the methylene region (Figure 1.2.2.8), saturated, cis-
monoene, cis-diene and cis-triene levels can be determined. In addition, the total
trans/cis ratio and the amounts of trans-monoene (t), cis-trans (ct), trans-cis (tc) and
trans-trans (tt) diene can be calculated. This possibility arises from thew very large
chemical shift difference ( =5 ppm) occurring in the cis-allylic carbons (27.12
ppm) with respect to the trans-allylic ones (32.53 ppm) in monoenes as well as from
the presence of resolved signals for dienes (Table 1.2.2.4) (Pfeffer et al., 1977a;
Sacchi et al., 1995).

CHAPTER 1 THE NUCLEAR MAGNETIC RESONANCE SPECTROSCOPY
24
Figure 1.2.2.7. The methylenic and methyl carbon region 10-35 ppm of the 300 MHz 13C spectrum of an olive oil sample. The resonances of carboxy chain end methylenes C-2 and C-3, of methyl chain end carbons C-16/C-18, of allylic and bis-allylic methylenes, are reported except for the methylene envelope –(CH2)n which is indicated as a whole (from Vlahov, 1999).
Figure 1.2.2.8. The methylene region of the 100.64 MHz 13C-NMR spectra of fractionated-interesterified (a) and hydrogenated (b) margarine samples (from Sacchi et al., 1995).

CHAPTER 1 THE NUCLEAR MAGNETIC RESONANCE SPECTROSCOPY
25
Table 1.2.2.4. Chemical shift (ppm/TMS) assignement of methylene carbons (from Sacchi et al., 1995).
a SFA, saturated fatty acids; c, cis-monoene; t, trans-monoene; tt, trans,trans-diene; cc, cis,cis-diene; ct, cis,trans-diene; tc, trans,cis-diene; ccc, cis,cis,cis,-triene.
Unsaturated fatty acid composition can be in detail assessed also by studying the
olefinic region (120-135 ppm) (Figure 1.2.2.5).

CHAPTER 1 THE NUCLEAR MAGNETIC RESONANCE SPECTROSCOPY
26
1.2.3 Other NMR experiments
Besides acquiring the “normal” 1H- and 13C-NMR spectra, other NMR
experiments can prove to be very helpful in assigning peaks and removing remaining
ambiguities. For example DEPT (distortionless enhancement of polarization
transfer) is an experiment that is useful for determining the number of protons
attached to a carbon atom. In the usual DEPT experiment (DEPT-135; the number
referring to the pulse angle of the experiment), the 13C signals appear either as
positive or negative peaks or disappear. Positive peaks correlate with carbons
carrying an odd number of protons (methine or methyl carbons). Negative peaks
correlate with carbons carrying an even number of protons (methylene carbons).
Carbons without an attached hydrogen do not give a visible peak. This experiment,
therefore, is useful for distinguishing carbons in areas of the spectrum where there
can be significant overlap of the type of signalcausing carbons (Gunstone et al.,
2007).
Two-dimensional experiments provide a means of identifying nuclei that are
mutually coupled. In the COSY (COrrelation SpectroscopY) experiment,
homonuclear coupled protons are identified. The 1H spectrum serves as x- and y-axis
for a contour plot. The diagonal of the contour plot results from the cross peaks of an
individual signal with itself. Besides the peaks in the diagonal, various cross peaks
“scattered” across the contour plot, but symmetrical to the diagonal as mirror plane,
signal coupling of specific protons. This is often very useful in identifying which
kind of carbon a specific functional group is bound.
Because of the low natural abundance of 13C (ca. 1.1%), correlation spectroscopy
between carbons is of no significance. Instead, heteronuclear correlation (HETCOR)
between 1H and 13C is now a common experiment yielding useful information. The
common experiment is termed HMQC (heteronuclear multiple-quantum
correlation). The experiment yields a contour map similar to the one described for
COSY above, except that one axis is now the 13C spectrum instead of the 1H
spectrum, and, of course, there is no diagonal of cross peaks. The contour plot

CHAPTER 1 THE NUCLEAR MAGNETIC RESONANCE SPECTROSCOPY
27
indicates which 1H-NMR peaks correlate with which 13C peaks (Gunstone et al.,
2007).
Thus, the combination of “regular” spectra, DEPT and 2D experiments is a
powerful tool for determining the structure of lipids and organic compounds in
general.

CHAPTER 2 MILK FAT CONTENT IN MIXED FATS
28
2 MILK FAT CONTENT IN MIXED FATS
2.1 INTRODUCTION
In food production the quality assessment of raw materials and final products is a
fundamental parameter for having and maintaining high quality standards. There are
different aspects determining the overall quality of foods: the “quality” (in terms of
sensory characteristics, stability and nutritional value), the “safety” (with respect to
microbiology, contaminants and toxins) and the “authenticity”.
An authentic product, whether raw material or a product on the supermarket shelf,
is one which strictly complies with the declaration given by the producer in terms of
ingredients, natural components, absence of extraneous substances, production
technology, origin, production year and genetic identity. Authenticity is an important
issue for the food industry due to legal compliance, economic reasons (“right goods
for the right price”), guarantee of a constant well-defined quality, use of safe
ingredients (Kamm, 2002). The problem how to guarantee/ensure food authenticity
can be tackled by applying accurate specifications for raw materials and selecting
suppliers that have a quality assurance system in place. The compliance with the
specification is assured by regular audits of the supplier(s), certificates of analysis
and periodical analytical checks. Hence it is necessary to identify and anticipate
emerging authenticity issues, to confirm authenticity of potentially adulterated
products, to develop methods adapted to solve new problems and to organize and/or
perform analytical surveys of sensitive products (Kamm, 2002).
According to EC regulations, in the blends of milk fat with other fats (mixed fats
or yellow fats) the milk fat content has to be indicated on the label (Council
Regulation (EC) No 2991/94; Council Regulation (EC) No 445/07). The proportion
of milk fat in the product has to be labelled to protect the consumer from fraudulent
malpractice, since the price of milk fat is higher than that of other relevant raw
materials. Due to the considerable price differences between milk fat and other fats
(animal or vegetable), there is a strong interest in verifying the declared milk fat
content in products obtained with a mixed fat. Adulteration has always been

CHAPTER 2 MILK FAT CONTENT IN MIXED FATS
29
practised and it is carried out for economical purposes (e.g. to increase the bulk
volume, to over-evaluate a product of inferior quality or to subtract/save expensive
ingredients). On the other hand, contaminations may occur accidentally, e.g. in
factories, where several fats are produced or used at the same time (Kamm, 2002).
To assess the authenticity of fats and oils it is fundamental to know the
technologies applied, the fat modification techniques used and the chemical
composition of the authentic oil(s) and of the potential adulterants (Kamm et al.,
2001). The fundamental problem for the authenticity assessment of fats and oils is to
define one or more parameters within the lipid fraction which allow to check for the
identity and purity of the specified fat or oil. Ideally, such markers are chemical
compounds which are present in the adulterant fat and absent in the original one.
Therefore, profiles of authentic fats must be compared with the fat to be tested. For
the definition of authenticity, the natural variations of the markers, e.g. due to
climate, soil and breeding must be taken into account.
Chemically, the main constituents of fats and oils are triacylglycerols (commonly
referred to as triglycerides), lower levels of diacylglycerols (diglycerides),
monoacylglycerols (monoglycerides) and free fatty acids, accompanied by other
minor components like the sterols (Kamm, 2002).
Methods for the determination of the milk fat content of fat mixtures are of
considerable practical importance, as can be seen from three relevant Regulations
published by the European Commission and the Council (Commission Regulation
(EEC) No 4056/87, No 4154/87, Council Regulation (EC) No 2991/94). In order to
check the correct labelling of mixed spreads, food inspection authorities need reliable
analytical methodologies to determine the percentage of milk fat in the spread. The
International Dairy Federation (IDF) developed an accurate and reliable method for
this purpose, based on the fatty acid profile of the raw materials and the finished
product (Muuse and Martens, 1993). However, this approach is not used widely,
since in modern commerce the raw materials are mostly not available for testing. As
a consequence, the most distinctive feature of milk fat, i.e. the unique occurrence of

CHAPTER 2 MILK FAT CONTENT IN MIXED FATS
30
butyric acid, exclusively present in milk fat, is most often determined by
chromatography, and used as an indicator for calculating the milk fat content in
foodstuffs (Ulberth, 1998).
Milk fat contains predominantly short-chain fatty acids (chains of less than eight
carbon atoms) built from acetic acid and -hydroxibutyrate units derived from
fermentation in the rumen (Alais, 2000). So butyric acid (BA) occurs exclusively in
milk fat from cows and other ruminant mammals, thus is not found in fats of
vegetable origin or animal adipose tissues. This fact can be used for distinguishing
between these kinds of fat, and also for the determination of proportions of milk fat
in mixed fats. Thus, the quantitative determination of BA levels is particularly useful
for controlling the declared composition of mixed-fat products, as well as of
processed foods like chocolate, bread, cakes, pastries and ice-cream. (Molkentin and
Precht, 1998).
The butyric acid content of milk fat and butterfat, although subject to a significant
natural variation, can be assumed for practical purposes to be constant within certain
limits. This fact allows the butyric acid content of a fat to be used as a criterion for
the measurement of the amount of butterfat in the fat (Pocklington and Hautfenne,
1986; Molkentin and Precht, 2000; Glaeser, 2002). But while it is generally accepted
that measurement uncertainty has to be taken into consideration when evaluating
analytical results, the variation of the butyric acid content of milk fat is usually not
taken into consideration. A conversion factor is normally used to calculated the milk
fat content of fat mixtures from the results of butyric acid determination (Molkentin
and Precht, 1997).
This procedure can lead to considerable errors. An approach based on the actual
butyric acid content of the milk fat used for the production of fat mixtures therefore
appears to be preferable. Ideally, when performing the analysis, information on the
butyric acid content of the milk fat used for the production of mixed fats should be
available. This information could be part of the milk fat specification and passed by
the processor to the control authority (Glaeser, 2002).
A procedure based on the calculation of several fatty acid methyl esters

CHAPTER 2 MILK FAT CONTENT IN MIXED FATS
31
apparently did not find widespread application. Several authors have proposed
methods for the determination of milk fat based on the content of fatty acids typical
for ruminant milk fat such as butyric acid or the ratio between myristic and palmitic
acids (Muuse and Martens, 1993). Other strategies to detect adulterated milk fat are
based on the concentration ranges of even more than two fatty acids using
multivariate statistical evaluation tools (Ulberth, 1995). Currently, the analysis of
butyric acid in a mixed fat is a widely applied method and has, for instance, already
been applied to quantitate small amounts of milk fat in cocoa butter or chocolate fats
(Buchgraber et al, 2007). Nevertheless, depending on feeding conditions and
lactation, the amount of butyric acid varies considerably. If a sample of the pure milk
fat is not available, an average of butyric acid content may be used instead, which
could assist in accurately determining the milk fat content fats (Buchgraber et al,
2007).
There are numerous methods for the measurement of butyrate in fats that are
mainly based on gas chromatography (GC) of the methyl ester or the free acid.
Because of different dimensions of BA data, e. g. the butyric acid content may be
expressed as free acid or as methyl ester and may be related to total fat or to fatty
acids, and also because of inaccuracies associated with certain methods, varying and
partly contradictory results may be found with different methods for the
measurement of butyric acid. However, the expression of the butyrate content in
g/100 g fat is most advantageous for purposes of food control, as it is frequently used
in food regulations (Molkentin and Precht, 1998).
In the last decade the use of Nuclear Magnetic Resonance (NMR) in food science
has consistently grown (Alberti et al., 2002). This non-invasive technique preserves
food structure and extracts useful information from such a chemically complex and
highly heterogeneous system. The increase of new applications and the attention to
this technique by scientists, official control institutions and food industries can be
attributed both to the high specificity and versatility of the NMR technique and to the
improvement of NMR instrument performances and availability. In the last 10 years,
a strong diffusion of new NMR equipments occurred in research centres and

CHAPTER 2 MILK FAT CONTENT IN MIXED FATS
32
industries, thus stimulating new applications, and a similar trend can be expected in
the near future (Sacchi and Paolillo, 2007).
Taking advantage of the development of digital computers, pulse Fourier
transform techniques and the availability of superconducting magnets, 13C NMR
technique complemented 1H NMR technique in many ways. The natural abundance
of 13C (1.1%) in nature was compensated by the low possibility of 13C-13C spin-spin
coupling and by broadband heteronuclear decoupling (i.e., elimination of all 1H-13C
couplings) which resulted in sharp singlets for all 13C absorptions, permitting small
chemical shift differences to be measured. With advanced electronic techniques, it
was also possible to run a 13C NMR spectrum under conditions that allow for a
quantitative integral, as in the case of 1H NMR. Inverse Gated decoupling was used
to remove the nuclear overhauser enhancement, and longer pulse delays were used to
allow 13C nuclei with long spin-lattice relaxation time to relax completely.
The first quantitative applications of 13C NMR spectroscopy on lipid molecules
were reviewed by Shoolery (1977) with which the iodine values of fats and oils were
determined accurately. As a complement to 1H NMR, 13C NMR offered a means of
determining the composition of mixtures of fatty acids and lipid molecules in much
greater detail. Gunstone published several valuable reviews, which dealt specifically
with the use of high-resolution 13C NMR technique in the analysis of lipid mixtures
(Gunstone, 1991b, 1993a; 1994). 13C NMR spectra of fatty acids provided a large
number of signals spread over a wide range of chemical shifts, which made the
spectrum appear complicated but much more informative. Techniques of correlating
signals between 1H and 13C NMR spectra provided two-dimensional correlation
spectra (2D COSY), which permitted confirmation of signals. Other techniques, such
as INADEQUATE (incredible natural abundance double quantum transfer
experiment), HSQC (heteronuclear single quantum correlation), HMQC
(heteronuclear multiple quantum correlation) and HMBC (heteronuclear multiple
bonds correlation), are some of the latest techniques in NMR spectroscopy from
which structural details can be derived in great detail (Lie Ken Jie and Mustafa,
1997).

CHAPTER 2 MILK FAT CONTENT IN MIXED FATS
33
NMR supports the food industry in its increasing need to understand and be
innovative in products and process and provides a new method to enforce legislation
and quality control. A well-known example is the authentication of olive oil by using 13C NMR spectroscopy (Sacchi et al., 1992, 1997). From a single 13C NMR
spectrum, the fatty acid composition, the saturated, monounsaturated and
polyunsaturated fatty acid ratios can be determined. In addition, the presence of
unsaturated trans isomers and the distribution of fatty acids on the glycerol chain can
also be detected (Wollenberg, 1990; Sacchi et al., 1995; Lie Ken Jie and Mustafa,
1997).
Although widely studied, because of its complexity, milk and dairy products have
not yet been subjected to thorough examination by NMR (Alberti et al., 2002). The
use of 1H and 13C NMR has been limited to the description of the non random
distribution of butyric acyl group in triacylglycerols from butter oil fraction (Pfeffer
et al., 1977b; Gunstone, 1993a; Kalo et al., 1996; Van Calsteren et al., 1996).
Recently, NMR spectroscopy has been successfully applied to milk directly without
any pretreatment. Various organic compounds in whole milk were quantified
simultaneously by one- (1H, 13C) and two-dimensional (1H-13C HSQC 2D) NMR
spectra (Hu et al., 2004, 2007)
No NMR methods have as yet been proposed as analytical tools in analysis of
butyric acid (BA) in a mixed fat although 13C-NMR spectroscopic analysis of milk
fat triacylglycerols show well-resolved resonances of butyrate carbons (Pfeffer et al,
1977; Lie Ken Jie and Mustafa, 1997; Andreotti et al., 2000, 2002) (Figure 2.1 and
2.2).

CHAPTER 2 MILK FAT CONTENT IN MIXED FATS
34
Figure 2.1. 22.63 MHz 13C spectrum (methyl and methylene region) of butter oil (0.5 g in 1.3 ml of CDCI3). Sweep width of displayed spectrum is 500 Hz. The letter (B) identifies shifts due to butyrate and (L) those due to long chain species (Pfeffer et al, 1977b).
Figure 2.2. 100 MHz 13C nuclear magnetic resonance (NMR) spectrum of the C1 region of triacylglycerols from buffaloes’ milk fat in CDCl3 at 25°C. Saturated, S, and unsaturated, U, fatty acids signals are labeled referring to the glycerol backbone, i.e., position sn-1,3 and position sn-2. The C1 signal for butyric acyl group in sn-1,3 position is labeled.

CHAPTER 2 MILK FAT CONTENT IN MIXED FATS
35
Considering that non-milk animal and vegetable fats contain very low amounts of
short chain fatty acids and no butyric acid, the direct quantitative evaluation of BA
by NMR could be an useful method to quantify the milk fat content.
In this study the butyrate content in milk fat and mixed fats (obtained by mixing
milk fat with known amounts of pork fat and vegetable margarines) was determined
using 13C NMR. The NMR data have been compared to those obtained by capillary
gas chromatography of fatty acid methyl esters.

CHAPTER 2 MILK FAT CONTENT IN MIXED FATS
36
2.2 MATERIALS AND METHODS
2.2.1 Fat samples
Fat mixtures containing different amounts of milk fat were prepared by mixing a
butter milk fat sample with some amount of genuine pork fat sample, obtained by
melting a pork adipose tissue, and a commercial vegetable margarine (fractionated
and interesterified fats). The fat samples were dried on sodium sulphate, weighed and
mixed in order to obtain two series of mixed fat samples containing known amounts
of milk fat (5, 10, 25, 50 % w/w). Mixtures were melted at 40°C for 1 h and
homogenized (Figure 2.1.1).
Figure 2.1.1. Experimental design relative to the preparation and analytical determination of the mixed fat samples.

CHAPTER 2 MILK FAT CONTENT IN MIXED FATS
37
2.2.2 Standards and reagents
Chloroform-d (with 0.03 % v/v internal tetramethylsilane, TMS) and
thribromobenzol (TBB) were obtained from Aldrich Chemical Co. (Milwaukee,
WIS, USA). All other chemicals were HPLC or reagent grade and were purchased
from Fluka (Buchs, Switzerland).
2.2.3 Preparation of FAMEs and Gas chromatography
Analysis of fatty acid methyl esters (FAMEs) were carried out by cold
transmethylation in KOH/methanol (Christie, 2003; Ichihara et al., 1996).
A quantity of 100 mg fat was weighed (to the nearest 0.1 mg) and dissolved in 10
ml n-hexane. 1 ml of this solution was mixed with 500 μl sodium methylate solution
(2 N in methanol) in a sample vial, shaken vigorously for 1 min using a vortex mixer,
and centrifuged for 1 min. The clear supernatant was used for GC analysis.
Analyses of FAME were performed using a Shimadzu GC17A gas
chromatography (Shimadzu Italia, Milan, Italy) equipped with split/splitless injection
port, flame ionization detector and a 60 m fused-silica capillary column (Quadrex
Corporation, New Heaven, U.S.A.) coated with cyanopropyl methyl silicone (0.25
μm film thickness). Helium was used as the carrier gas and the flow rate was 1.8 ml
min±1 at a split ratio of 1:60. The temperature of both the injector and detector was
250 °C. The initial oven temperature was set at 70 °C for 4 min; it was then
programmed to increase at a rate of 10 °C min±1 until it reached 170 °C, maintained
for 10 min, and thereafter to increase at a rate of 10 °C min±1 until it reached 220
°C, maintained for 10 min. The samples (1 μl) were injected using an automatic
injector Shimadzu AOC-20i (Shimadzu Italia, Milan, Italy).
2.2.4 High Resolution 13
C-NMR spectroscopy
The 13C-NMR analysis was carried out on dissolving in 5 mm NMR-tubes 50 mg
of sample in 500 μl chloroform-d with internal 0.03% v/v tetramethylsilane. The 13C-
NMR spectra were recorded on a Bruker AV 400 spectrometer (Bruker, Germany)

CHAPTER 2 MILK FAT CONTENT IN MIXED FATS
38
operating at a 13C-frequency of 100.62 MHz. Spectra were recorded with 32K data
points, spectral width of 200 ppm, pulse width 45°, acquisition time 0.81 sec,
relaxation delay 4 sec (with a digital resolution of 2 Hz/pt). Quantitative spectra were
recorded with 128-3000 scans and the acquisition was stopped when a good S/N
ratio was observed for the butyric acid minor C4 peak (experimental time of 20-120
min in relation to the milk fat amount in the samples). High resolution carbonyl
spectra were recorded at 30 ± 1°C with 32K data points, a spectral width of 10 ppm,
pulse width 90°, an acquisition time of 23.2 sec and a relaxation delay of 2 sec. The
resulting digital resolution was 0.04 Hz/pt.
Nuclear Overhauser Effects (NOEs) were measured only for those signals relevant
in the quantitative analysis by comparing spectra recorded in Broad Band (BB)
decoupling mode (with NOE enhancement) with those recorded by using the inverse
gate decoupling sequence (without NOE). Inverse gated spectra were recorded with
the same acquisition parameters and with the same number of scans used in the BB
experiments, with an additional delay of 20 sec. Spectra were transformed in
absolute intensity mode. Carbon-13 spin-lattice relaxation times (T1) were measured
using the inversion-recovery (180- -90) pulse sequence1. Spectra recorded at
1 The inversion-recovery method is a convenient way to measure T1 values of both 1H and 13C
nuclei. In a moderately complex molecule (15–30 carbons), the T1 values of all positions in the molecule can be determined simultaneously, with spectral overlap the only limitation. The method is a multiple-pulse experiment in which net magnetization of the sample nuclei is first inverted with a 180 pulse (“inversion”) and then allowed to relax along the z axis with the characteristic time constant T1 (“recovery”). The effect of the 180 pulse is to interchange all of the spins between the upper and lower energy levels, so that now the higher energy spin state has a slight excess of population and the lower energy spin state has a slightly depleted population. This causes the net magnetization vector to be turned upside-down so that Mz now equals Mo. Recovery begins immediately according to the exponential law, with characteristic rate R1 =1/T1. Because z
magnetization is not a directly observable quantity, the recovery period is followed by a 90 pulse that “samples” or “reads” the z magnetization by converting it into observable x–y magnetization. The magnitude of the FID signal that results from this x–y magnetization (and the peak height in the spectrum) should be directly proportional to the sample’s z magnetization just before the 90 pulse. By repeating the experiment with different time delays after the 180 pulse, we can monitor this return of z magnetization to equilibrium and determine the value of T1 by curve fitting of the data to an exponential function. The phase correction parameters are first set using a simple 90 pulse acquisition (starting with equilibrium magnetization, along+z) and then applied to a series of inversion-recovery spectra acquired with increasing values of the delay . For =0 we should see an upside-down spectrum, with each peak at its maximum height but inverted. As the delay is increased

CHAPTER 2 MILK FAT CONTENT IN MIXED FATS
39
different delays between pulses ( values) were transformed in absolute intensity
mode without any phase correction. In order to obtain the T1 values, peak intensities
were fitted to an exponential curve via a three-parameter minimization (Jacobsen,
2007). Chemical shift values were referenced to internal TMS and assignments made
by comparison with standard compounds and data in the literature (Pfeffer et al,
1977b; Van Calsteren, 1996; Lie Ken Jie and Mustafa, 1997; Andreotti et al., 2000,
2002).
each peak will become less intense, pass through zero, and finally become positive. At very long
delays the spectrum should look just like a normal spectrum (Jacobsen, 2007).

CHAPTER 2 MILK FAT CONTENT IN MIXED FATS
40
2.3 RESULTS AND DISCUSSION
Figures 2.3.1 and 2.3.2 show the 13C-NMR spectra (expansion of carbonyl and
methylene regions) of the milk fat sample, used in this study. Labelled signals were
assigned as shown in Table 2.3.1. Four butyril chain signals were completely
resolved in the milk fat spectrum. No butyrate was detected in pork fat and
margarine. This suggests that all butyrate signals can be used to quantify the milk fat
contents. For this reason the work has been focused on the C1 and C2 resonances
which being well resolved provide, in addition to the total amount of butyrate, also
useful information on the distribution on triacylglycerols. The position of
butyrate was first determined by NMR methods by Pfeffer et al. (1977) who
indicated that butyrate is predominantly present in the -position. Our high
resolution spectral data confirm these previous findings, and the C1 or C2 -butyril
peaks can, infact, be used for the determination of butyrate amount which can be
expressed as molar fraction % of the total fatty acid chains or referred only to the -
acyl chains.
Figure 2.3.1. 100 MHz 13C nuclear magnetic resonance (NMR) spectrum of the carbonyl region of triacylglycerols in butter fat in CDCl3 at 25°C. Saturated, S, and unsaturated, U, fatty acids signals are labelled referring to the glycerol backbone, i.e., position sn-1,3 and position sn-2. The C1 signal for butyric acyl group in sn-1,3 position is labelled.

CHAPTER 2 MILK FAT CONTENT IN MIXED FATS
41
Figure 2.3.2. 100 MHz 13C nuclear magnetic resonance (NMR) spectrum of the methylene region of triacylglycerols in butter fat in CDCl3 at 25°C. The C4, C3 and C2 signals for butyric acyl group are labelled.
Table 2.3.1. 13C NMR chemical shift values of Butyrate
The quantitative analysis of butyrate can be performed by comparing the intensity
of the C1 or C2 peaks at 173,13 and 35,94 ppm, with the corresponding signals of
other long, medium and short chain fatty acids (C6-C22), using the following
expressions:
Carbon nuclei
( ) ( )
C-1 173.136 -
C-2 35.938 -
C-3 18.366 -
C-4 13.630 -
Butyrate
C1
C2
C3
C4

CHAPTER 2 MILK FAT CONTENT IN MIXED FATS
42
Butyrate% (mole fraction) = B1*100/ (B1 + A1 + C1) (1)
where: B1= intensity of C1 butyrate signal (173,13 ppm); A1= intensity of C1 -
long chain fatty acids (C6-C20) (173,36 ppm); C1 = intensity of C1 -long chain fatty
acids (C6-C20) (172,95 ppm) (Figure 2.3.3).
Figure 2.3.3. Carbonyl carbon signals of acyl group in butter fat. The C1 signal in sn-1,3 and sn-2 position are labelled.
Butyrate% (mole fraction) = B2*100/ (B2 + A2 + C2) (2)
where: B2 = intensity of C2 butyrate signal (35,94 ppm); A2 = intensity of C2 -
long chain fatty acids (C6-C20) (34,18 ppm); C2 = intensity of C2 -long chain fatty
acids (C6-C20) (34,35 ppm) (Figure 2.3.4).
CHAPTER 2 MILK FAT CONTENT IN MIXED FATS
43
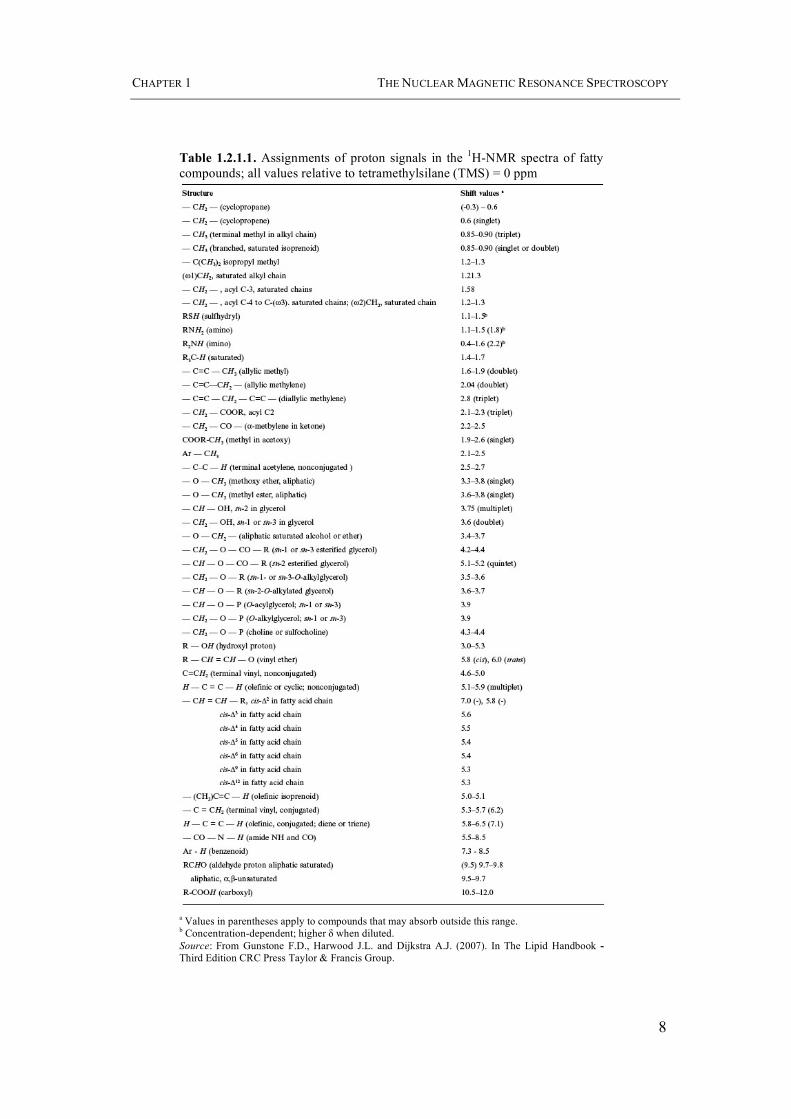
Figure 2.3.4. C2 carbon signals of acyl group in butter fat. The C2 signal in sn-1,3 and sn-2 position are labelled (A2, B2, C2).
It’s important to mention at this point that, in order to obtain an NMR quantitative
response, spectra have to be acquired under experimental conditions ensuring the
same recovery of each NMR resonance used in the quantitative measurements. In
fact, the linearity between NMR signal intensity and the concentration of the
component can be distorted by the different relaxation rate on Nuclear Overhauser
Enhancement (NOE) (Wollenberg, 1990; Lie Ken Jie and Mustafa, 1997; Ng, 2000).
In routine 13C-NMR qualitative analysis, most spectra are recorded using Broad-
Band proton decoupling (irradiation of all the protons at the same time with the result
of a completely proton decoupled spectrum with a single line for each carbon) and
using a short delay time (D1) between two subsequent pulses. When carbons have
different relaxation behaviours, the longitudinal relaxation time (T1) has to be known
for all carbons to ensure that all carbons are fully-relaxed between two succeeded
pulses. As for the NOE factor, NOE enhancement may not be the same for all

CHAPTER 2 MILK FAT CONTENT IN MIXED FATS
44
resonances, which means that evaluation of the peak areas could not correspond to
the true population of the carbon species. For this reason both NOE and T1 values
have been regulated by considering the literature data for the acquisition parameters
used for quantitative experiments (Wollenberg, 1990; Ng, 2000). T1 values ranged
between 9 and 11 s for carbonyls and were less than 1 sec for all methylene carbons
(Ng, 2000). Based on these T1 values, and using a 45° pulse, a short relaxation delay
of 2 sec was used for recording full quantitative spectra.
The Broad Band mode was used for a faster quantitative analysis using the same
acquisition conditions for each sample to ensuring a similar NOE for different
experiments. The advantage of using the broad band mode is related both to better
sensitivity due to the NOE enhancement, and higher S/N ratio due to the faster
recycle delay between pulses (2.37 s) with respect to those used in NOE suppressed
spectra (22.37 s). This means a higher number of scans/min (25.3 scans/min) in the
broad band accumulation with respect to the inverse gated recording (only 2.7
scans/min). To obtain the same S/N for methylene carbons, 20-30 times smaller
accumulation time than the inverse-gated mode is required.
Considering the small NOE effect on carbonyl signal intensities, the acyl
distribution on triacylglycerols can be studied from the high resolution spectra of the
carbonyl region using the broad band mode. In fact, the complete relaxation of
carbonyls is guaranteed by the high acquisition time (12-20 sec) requested for high
digital resolution (0.04 HZ/pt) (Wollenberg, 1990).
In this study we have measured the signal intensity of C2 carbon methilen
resonances in order to verify the amount of milk fat in the mixed fat samples. To
check the quantitative performances of NMR measure, independent GC analysis
were performed.
In Table 2.3.2 is reported the amount of butyric acid obtained by NMR measure
of C2 carbon, expressed in mole fraction %, and by Gas Chromatographic analysis of
methyl ester fatty acids, expressed in %, of mixed fat samples. NMR spectra were
repeated three times and a good reproducibility of relative signal intensities has
obtained (st. dev. 0.08).

CHAPTER 2 MILK FAT CONTENT IN MIXED FATS
45
Table 2.3.2. Butyric acids amount in mixed fat samples (average ± st. dev.).
The NMR quantitative response was verified by comparing the NMR derived data
with those obtained from Gas Chromatography (Figure 2.3.5). A good agreement
(R2 = 0.9996) was found between butyric acid of mixed fat samples calculated by
means of NMR and GC.
Figure 2.3.5. C2 NMR data vs BA GC data
The NMR values for C2 carbon were also plotted against the amounts of milk fat
in the mixtures (w/w%) (Figure 2.3.6). The NMR response showed a very good
linearity with R2 of 0.9994
milk fat %
0 0,00 ± 0,00 0,00 ± 0,00
5 0,55 ± 0,05 0,21 ± 0,02
10 1,02 ± 0,01 0,44 ± 0,01
25 2,13 ± 0,02 0,84 ± 0,02
50 4,36 ± 0,06 1,65 ± 0,04
100 8,38 ± 0,08 3,21 ± 0,07
butyric acid by NMR (fraction molar %)
butyric acid by GC (%)

CHAPTER 2 MILK FAT CONTENT IN MIXED FATS
46
Figure 2.3.6. C2 NMR data vs milk fat amount in mixed fat samples
2.4 CONCLUSIONS
Carbon-13 NMR spectroscopy has the considerable advantage, over the usual
methods, of operating directly on the oil sample without any chemical manipulation
and it seems to represent the only direct instrumental method by which the butyrate
content and position on triacylglycerols can be specifically identified. High
resolution NMR analysis, certainly cannot be suggested as a routine method to
quantify milk fat in mixed fats, due to the expensive NMR equipment required, but it
can certainly be used as a direct, specific and rapid reference method, also to assess
the genuineness and purity of butter and the presence of transesterified glycerols,
with BA, in which the butyrate is randomly distributed.

CHAPTER 3 HYDROPEROXIDE DECOMPOSITION PRODUCTS IN THERMALLY OXIDIZED OILS
47
3 HYDROPEROXIDE DECOMPOSITION PRODUCTS IN THERMALLY
OXIDIZED OILS
3.1 INTRODUCTION
The oxidation of polyunsaturated fatty acids (PUFAs) is an autocatalytic, self-
perpetuating chain reaction system and the oxidized PUFAs have been implicated in
the pathogenesis of many human diseases, e.g., atherosclerosis and inflammatory
joint diseases (Lopez-Varela et al., 1995; Esterbauer, 1993; Dobarganes and
Márquez-Ruiz, 2003). Oxidation of lipids is promoted by factors such as elevated
temperature, exposure of light, presence of extraneous materials, such as metals or
other oxidation initiators. The nature of the radicals also influences the products
obtained. Oxidation can be inhibited, but not prevented in the long term, by the
presence of antioxidants (Gunstone et al., 2007).
PUFAs are particularly susceptible to oxidative damage by virtue of the easy
abstraction of one of their bis-allylic methylene group hydrogen atoms on exposure
to light or radical species of sufficient reactivity, a process facilitated by the low
bond dissociation energy of the methylene group C–H bonds. Subsequently, one
major reaction pathway for the resulting resonance-stabilized carbon-centered
pentadienyl lipid radical generated in this manner involves its interaction with
molecular oxygen to produce a peroxyl radical which in turn can abstract a hydrogen
atom from an adjacent PUFA to form a conjugated hydroperoxydiene (CHPD) and a
further pentadienyl lipid radical species. In the absence of sufficient quantities of
chain-terminating, lipid-soluble antioxidants such as vitamin E ( -tocopherol), the
process is repeated many times. CHPD are subsequently degraded to a wide variety
of secondary autoxidation products which include saturated and unsaturated
aldehydes, di- and epoxyaldehydes, lactones, furans, ketones, oxo and hydroxy acids,
and saturated and unsaturated hydrocarbons (Figure 3.1.1).

CHAPTER 3 HYDROPEROXIDE DECOMPOSITION PRODUCTS IN THERMALLY OXIDIZED OILS
48
Figure 3.1.1. Oxidation of polyunsaturated lipid
Thermal stressing of culinary oils according to standard frying/cooking practices
(domestic or otherwise) gives rise to and/or perpetuates the radical-dependent
autoxidation of PUFA therein. Indeed, a wide range of aldehydes arises from the
thermally induced decomposition of CHPD via several processes, including the -
scission of pre-formed alkoxyl radicals. Such aldehydic fragments (n-alkanals, trans-
2-alkenals, trans,trans- and cis,trans-alka-2,4-dienals, 4-hydroxy-trans-2-alkenals,
and malondialdehyde) have the capacity to exert a variety of toxicological effects in
view of their extremely high reactivity with critical biomolecules (DNA base
adducts, proteins such as the apolipoprotein B moiety of low density lipoprotein,
peptides, free amino acids, endogenous thiols such as glutathione, etc). Interaction of
these aldehydes with DNA can give rise to genotoxic events and possibly cancer
(Silwood and Grootveld, 1999).
Many humans are continually exposed to oxidized oils and fats in the diet which
arise from either shallow or deep fat frying processes, and the possibility that regular
consumption of such materials may be deleterious to human health has attracted
much interest (Guillén and Ruiz, 2005a).
Deep-fat frying is a common method of food preparation that imparts desired
sensory characteristics of fried food flavor, golden brown color and crisp texture.
During frying, at approximately 190°C, as oils thermally and oxidatively decompose,
CHAPTER 3 HYDROPEROXIDE DECOMPOSITION PRODUCTS IN THERMALLY OXIDIZED OILS
49
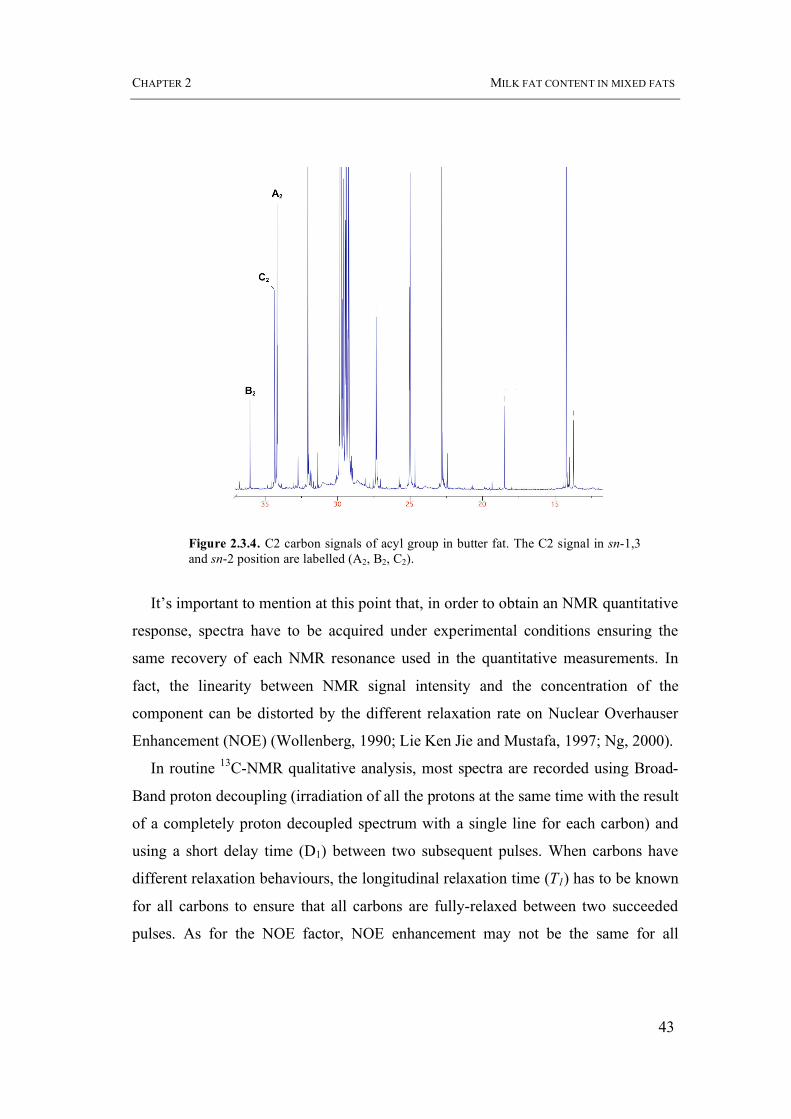
volatile and nonvolatile products are formed that alter functional, sensory, and
nutritional qualities of oils (Figure 3.1.2) (Warner, 2002).
During this process a great number of changes occur in the sample as
consequence of the incorporation of oxygen into the triglyceride structure, and the
generation of very reactive species which causes the breakdown of the acyl group
chains producing volatile and semi-volatile molecules of different natures, as well as
reactions between different acyl groups chains to give oligomeric or polymeric
systems (Guillén and Goicoechea, 2007).
With continued heating and frying, the hydroperoxides decompose further until
breakdown products accumulate to levels that produce off-flavors and potentially
toxic effects, rendering the oil unsuitable for frying. The amounts of these
compounds that are formed and their chemical structures depend on many factors,
including oil and food types, frying conditions and oxygen availability (Warner,
2002).
Figure 3.1.2. Physical and chemical reactions that occur during frying.

CHAPTER 3 HYDROPEROXIDE DECOMPOSITION PRODUCTS IN THERMALLY OXIDIZED OILS
50
Besides species with relatively unchanged molecular weight, secondary oxidation
products are a variety of polymeric and lower-molecular weight compounds. The
complicated decomposition process of hydroperoxides is reflected in this complex
variety of products.
Information on the secondary oxidation products that can result from the initially
formed hydroperoxides is summarized in Table 3.1.1. The secondary products are
categorized as monomeric (products with the same chain length as the original
material, but with different functional groups), oligomeric (products of higher
molecular weight), and volatile (short-chain) compounds. Various types of reactions
can occur during the decomposition process including dehydration, cyclization,
rearrangement, radical substitution, chain cleavage, dimerization, etc (Figure 3.1.2).
In many cases, a combination of these reactions occurs to form the final “secondary”
oxidation products. The formation of some of the observed volatiles cannot be
readily explained by classical cleavage mechanisms, but may be attributed to further
oxidation of the unsaturated aldehydes and, thus, may be “tertiary” products.
Thermal and metal catalyzed reactions of hydroperoxides give homolytic cleavage
while acidic decomposition proceeds by heterolytic cleavage, leading to less
complex products consisting mainly of aldehydes (Warner, 2002; Frankel, 1998).
The reactions that occur during the formation of the secondary products are
influenced by various parameters (temperature, light, air or extraneous materials)
which also affect the initial oxidation step of hydroperoxide formation. It may be
noted that the various secondary oxidation products listed in Table 3.1.1 are formed
in different proportions depending from the oxidation conditions.

CHAPTER 3 HYDROPEROXIDE DECOMPOSITION PRODUCTS IN THERMALLY OXIDIZED OILS
51
Se
co
nd
ary
p
rod
uc
ts
Fa
tty
co
mp
ou
nd
O
leate
L
ino
lea
te
L
ino
len
ate
T
ria
cy
lgly
cero
ls
Mo
no
meri
c
Ally
lic k
eto
-ole
ate
s (
keto
at
C8-1
1)
Epo
xy s
teara
te
Epo
xy o
leate
s
Dih
ydro
xyste
ara
tes
Keto
-lin
ole
ate
(C
9-C
13
) E
po
xyhyd
roxy o
leate
H
ydro
xy d
iene
s
Dih
ydro
xyole
ate
s
Trihydro
xyo
leate
s
Hydro
pero
xy e
pid
ioxid
es
, dih
ydro
pero
xid
es
Olig
om
eri
c
D
ime
rs lin
ke
d v
ia p
ero
xy o
r eth
er
gro
ups w
ith O
OH
, O
H o
r C
=O
gro
up
s
C-C
lin
ke
d d
ime
rs (
un
der
N2
) D
ime
rs a
nd
olig
om
ers
co
nta
inin
g c
on
juga
ted d
iene
-triene
, d
ihydro
pero
xid
es,
or
hydro
pe
roxy e
pid
ioxid
e u
nit
s
Di- a
nd
tri
hyd
rop
ero
xid
es;
less t
ende
ncy
to d
imeri
ze t
ha
n w
ith m
eth
yl este
rs;
more
sig
nific
ant
at h
igher
tem
pera
ture
s
(fry
ing),
giv
ing
“th
erm
al” a
nd“o
xid
ative
” d
ime
rs
V
ola
tile
s
Satu
rate
d a
nd
unsatu
rate
d s
ho
rt-c
ha
in c
arb
onyl co
mpo
un
ds,
alc
oho
ls,
an
d h
ydro
ca
rbo
ns; e
xa
mple
s g
iven b
elo
w
H
ep
tan
al, n
ona
na
l, de
ca
na
l
2-n
onenal, 2
-undecena
l
he
pta
ne
, octa
ne
oxo e
ste
rs
me
thyl nonanoate
Fro
m p
ero
xid
e-l
inked d
ime
rs
pe
nta
ne
, 1-p
enta
no
l, pe
nta
na
l, he
xana
l,
3-n
on
en
al, 2
,4-d
eca
die
na
l, m
eth
yl
octa
no
ate
, m
eth
yl 9-o
xononan
oate
O
the
rs:
aceta
lde
hyde
, 2-p
enty
lfura
n, m
eth
yl
he
pta
no
ate
, 2
-octe
na
l, 2
,4-n
ona
die
nal,
2-4
-deca
die
nal, m
eth
yl 8-o
xoo
cta
no
ate
,
me
thyl 1
0-o
xo
decano
ate
; 2c-o
cte
na
l, 2t-
no
ne
na
l, 1-o
cte
ne
-3-o
ne
, 3-o
cte
ne
-2-o
ne,
2t-
octe
na
l, 4
-hydro
xy-
2-n
onenal, 4
-oxo-2
-non
ena
l;
vola
tile
epo
xy a
cid
s (t-
2,3
-epo
xyocta
no
ic a
cid
)
De
ca
trie
na
l, m
eth
yl octa
no
ate
, p
rop
an
al,
2-p
en
tena
l, 3-h
exenal, 2
,4-h
epta
die
na
l,
eth
ane
, a
ce
tald
ehyde
, b
uta
na
l, m
eth
yl
9-o
xo
no
nanoate
, 2
-bute
nal, 2
- buty
lfura
n, 2t,6c-n
ona
die
nal, 1
,5co
cta
d
ien
-3-o
ne
, 3c-h
exenal, 3
-nonena
l,
he
xa
na
l; t-
4,5
-epo
xy-2
-hep
tena
l
Oxogly
ce
ride
s o
r ald
ehydo
-gly
ce
ride
s
Fro
m t
rilinole
in: p
enta
ne
, h
exa
na
l,
2-h
ep
tena
l, 2,4
-de
cad
iena
l F
rom
tri
linole
nin
: pro
panal,
2,4
- he
pta
die
nal, 2
,4,7
-de
ce
trie
na
l In
ve
ge
table
oils
: eth
ane
, pro
pa
ne
, pe
nta
ne
, he
xa
ne
. d
iald
eh
yde
s,
ke
tone
s,
eth
yl este
rs,
no
na
ne,
de
ca
ne
, u
nde
cane
,
2-p
en
tylfura
n,
lacto
ne
s,
be
nzene
, be
nzald
ehyde
, ace
top
he
no
ne
Vo
lati
les
fro
m
Sec
on
da
ry
pro
du
cts
A
lkana
ls, gly
oxal,
-ke
to a
lde
hyde
s,
dia
lde
hyde
s
Ma
lona
lde
hyde
(ty
pic
al fo
r lipid
s w
ith
th
ree o
r m
ore
do
ub
le b
on
ds
)
Ta
ble
3.1
.1.
Sec
onda
ry o
xida
tion
pro
duct
s d
eriv
ed f
rom
the
dec
ompo
siti
on o
f hy
drop
erox
ides
(G
unst
one
et a
l., 2
007)
So
urc
e:
Ada
pted
fro
m G
unst
one,
F.D
. (E
d.),
in
Th
e C
hem
istr
y o
f F
ats
an
d O
ils,
Bla
ckw
ell
Pub
lish
ing,
Oxf
ord,
U.K
., 20
04,
pp.
150–
168;
and
Fra
nkel
, E
.N.,
Lip
id O
xid
ati
on
, 2n
d ed
., T
he O
ily
Pre
ss, B
ridg
wat
er, U
.K.,
2005
.

CHAPTER 3 HYDROPEROXIDE DECOMPOSITION PRODUCTS IN THERMALLY OXIDIZED OILS
52
The most important reaction involved in the oxidative deterioration of food lipids
is the thermally induced radical-mediated autoxidation of polyunsaturated fatty acids
(PUFAs), primarily generating conjugated hydroperoxydiene (CHPD) species. Such
PUFA-derived CHPDs are particularly unstable at temperatures associated with
standard frying practices (180°C), and are degraded to a wide variety of secondary
peroxidation products, including a range of aldehydes (predominantly n-alkanals,
trans-2-alkenals, alka-2,4-dienals, 4-hydroxy-trans-2-alkenals and malondialdehyde)
which have the capacity to exert a range of toxicological effects in view of their high
reactivity with critical biomolecules in vivo (Claxson et al., 1994).
The unsaturated aldehydes formed as volatile secondary products are important
because these are responsible for the off-flavour of foods containing oxidized oils.
These flavour-affecting compounds are often formed in very small amounts (ppb
levels) (Solinas et al., 1988; Gunstone et al., 2007).
Several studies have been caried out in order to indentify mechanisms of volatile
compound formation (Frankel, 1998; Katsuta, 2008). Selke et al. (1977) identified
volatile odor constituents and their precursors from heated soybean oil, using model
triglycerides (pure triolein, mixture of triolein 25% -tristearin, and a randomly
esterified triglyceride of stearic and 25% oleic acids) heated at 192°C in air for 10
minutes. Each model system produced the same major compounds, identified as
heptane, octane, heptanal, octanal, nonanal, 2-decenal, and 2-undecenal. These seven
compounds were unique to the oxidation of the oleate fatty acid in each triglyceride
sample. Later, Selke and coworkers (1980) analyzed pure trilinolein and mixtures of
trilinolein-tristearin, trilinolein-triolein, and trilinolein-triolein-tristearin heated to
192°C in air. Major volatiles detected in heated and frying oils included pentane,
acrolein, pentanal, 1-pentanal, hexanal, 2- and/or 3 hexanal, 2-heptenal, 2-octenal,
2,4-decadienal, and 4,5-epoxide-2-enal (Frankel, 1998; Warner, 2002).
Oil thermoxidation is currently assessed using different analytical methods. As
early as 1981, a measure of thermoxidation based on the estimation of the total polar
compounds (TPC) by silica column chromatography was introduced by the IUPAC.
(Walking and Wesserls, 1981; Dobarganes et al., 2000). Determination of polar

CHAPTER 3 HYDROPEROXIDE DECOMPOSITION PRODUCTS IN THERMALLY OXIDIZED OILS
53
compounds in heat-abused oils and fats is a well-accepted method due to its accuracy
and reproducibility (Walking and Wesserls, 1981). The level of polar compounds is a
quite good indicator of the quality of used frying fats and oils, giving information of
the total amount of newly formed compounds having higher polarity than that of
triacylglycerols and being the basis of the present recommendations and regulations
limiting degradation of used frying fats for human consumption. More recently High
Performance Size Exclusion Chromatography (HPSEC) and High Performance
Liquid Chromatography (HPLC) were applied to measure the high molecular weight
compounds (dimers and polymers of triacylglycerols) formed during oil heating
(Figure 3.1.3) (White and Wang, 1986; Veazey, 1986; Márquez-Ruiz et al., 1995;
Dobarganes et al., 2000). Complementary determination of polymerized
triacylglycerols in fats and oils by exclusion chromatography allows quantification of
the main groups of compounds formed during the frying process (Dobarganes et al.,
2000).
Figure 3.1.3. Analytical procedure for determination of total polar compounds and their distribution. Abbreviations: HPSEC, high-performance size-exclusion chromatography; PTG, polymerized triacylglycerols; OTG, oxidized triacylglycerols; DG, diacylglycerols; FA, fatty acids (Dobarganes et al., 2000.

CHAPTER 3 HYDROPEROXIDE DECOMPOSITION PRODUCTS IN THERMALLY OXIDIZED OILS
54
Márquez-Ruiz and Dobarganes (1996) also proposed a simple High Resolution
Gas Chromatography (HRGC) determination of short-chain fatty acids (heptanoate
and octanoate) to evaluate hydroperoxide thermal decomposition in heated and fried
oils. Decomposition of the alkoxy radical involving carbon-carbon bond scission is a
major pathway for the generation of low-molecular-weight compounds. Studies on
model systems have shown that methyl octanoate (C8:0) is a significant product of the
oxidation of fatty acid methyl esters. In fats and oils, oxidation takes place in the
unsaturated fatty acyl radicals and, in consequence, C8:0 and other short-chain fatty
acids remain attached to the glyceridic backbone forming part of a non-volatile
molecule (Figure 3.1.4).
Figure 3.1.4. Schematic representation of bound short fatty acid formation. (Márquez-Ruiz and Dobarganes, 1996)
Quantitation of these resulting short-chain fatty acids is hence an indirect
measurement of both oxidation and volatile formation, particularly under frying
conditions, wherein the real volatiles are continuously leaving the oil due to the high

CHAPTER 3 HYDROPEROXIDE DECOMPOSITION PRODUCTS IN THERMALLY OXIDIZED OILS
55
temperature of the process and the influence of steam while the bound short-chain
acids remain as markers of the oxidation intermediates (Márquez-Ruiz et al., 1995).
Oleic, linoleic and linolenic acids are the major unsaturated fatty acids in edible fats
and oils and all of them are capable of forming bound C8:0 from their 9-
hydroperoxides. The formation of glycerol-bound heptanoate and octanoate
correlates with the amount of total polar compounds determined by the official
IUPAC method (Márquez-Ruiz et al., 1995; Brühl and Matthäus, 2008).
However, the measure of the aldehydes can be also a good way to assess the
secondary oxidation products arising from peroxide decomposition (this is very rapid
at temperature higher than 140°C), directly responsible of "rancid", "fishy" and
"deep-fried" flavours (Solinas et al., 1988; Frankel, 1987) (Figure 3.1.5).
Figure 3.1.5. Thermal decomposition of monohydroperoxides produces alkoxyl radicals undergoing homolytic -scission to form aldehydes, alkyl and olefinic radicals (Frankel, 1998).
Classical methods of studying these volatile compounds (Head-Space techniques
coupled with GC or GC/MS) provide partial information, referring only to the

CHAPTER 3 HYDROPEROXIDE DECOMPOSITION PRODUCTS IN THERMALLY OXIDIZED OILS
56
concentration of one class of compounds present in the complex mixture formed
during the oxidation process, but none of them give a picture of the total mixture;
this fact, combined with the great number of inherent drawbacks of these methods,
such as the poor reproducibility of some, or the difficulty in knowing the real
significance of the parameters obtained in others (Frankel, 1998), shows the
necessity to search for new methods to study these complex processes in depth. The
usefulness of Fourier transform infrared spectroscopy as well as of the 1HNMR has
been studied with positive results (Guillén and Goicoechea, 2007; Sacchi et al.,
2006a). 1H nuclear magnetic resonance has proved to be a very valuable tool which
allows to follow not only the degradation of acyl groups but also, at the same time,
the formation and degradation of primary oxidation compounds as well as the
formation and evolution of secondary oxidation products throughout the oxidation
process (Guillén and Ruiz, 2005b; Sacchi et al., 2006a).
The first application of 1H-NMR in lipid analysis was performed by Johnston and
Shoolery in 1962. These pioneers demonstrated the ability of proton NMR to assess
the unsaturation degree in different oils and fats. In recent years, NMR applications
in this field concern mainly 13C-NMR, due to the higher resolution of signals. 13C-NMR spectra can provide many important compositional information not
easily gained with other analytical tools (Ng, 1985; Gunstone, 1994; Wollenberg,
1990; Sacchi et al., 1997). The direct application of 13C-NMR to the study of lipid
oxidation is limited by the low intrinsic sensitivity of this nucleus and by the low
amount of oxidation compounds present in oxidized lipids. In particular, secondary
oxidation products (i.e. aldehydes) have very low sensory thresholds and their
instrumental measure requires very sensitive methods (Frankel, 1998; Guth and
Grosch, 1991). For these reasons, the study of lipid oxidation products by 1HNMR
has been somewhat ignored and only few applications appeared in the literature,
suggesting the possibility of detecting, directly from the proton NMR spectra, the
hydroperoxides and aldehydes (Claxson et al., 1994; Aparicio et al., 1999; Guillén
and Ruiz, 2003a,b, 2005, 2006, 2007, 2008; Sacchi et al., 2006a).

CHAPTER 3 HYDROPEROXIDE DECOMPOSITION PRODUCTS IN THERMALLY OXIDIZED OILS
57
In this part of the work, high-resolution 1H-NMR spectroscopy (400-600 MHz)
was applied to the quantitative analysis of hydroperoxide decomposition products in
thermally oxidized oils. A first part of the results obtained as been already
pubblished (Sacchi et al, 2006a). Further results are in pubblication.

CHAPTER 3 HYDROPEROXIDE DECOMPOSITION PRODUCTS IN THERMALLY OXIDIZED OILS
58
3.2 MATERIALS AND METHODS
3.2.1 Oil samples and thermal stressing
Three oil types (extra virgin olive oil, sunflower oil and soybean oil) were
selected for this study and purchased on the Italian market. One litre of each oil was
continually heated at 180 °C for 6 hours, using a thermostated household-frying bath
(Tefal, Milan, Italy). Oil samples were collected in duplicate at different times during
the six-hour heating treatment: 0 (initial time), 60, 120, 240, and 360 min and stored
in glass bottle at -20°C until analyses (Figure 3.2.1.1).
Figure 3.2.1.1. Experimental design relative to the preparation and analytical determination of the oils samples.
3.2.2 Standards and reagents
Standard triacylglycerols, methyl esters and fatty acids were obtained from Fluka
(Buchs, Switzerland), Larodan (Malmoe, Sweden) and Nu-Chek-Prep Inc. (Elysian,
MIN, USA). Chloroform-d (with 0.03 % v/v internal tetramethylsilane, TMS) and
thribromobenzol (TBB) were Aldrich Chemical Co. (Milwaukee, WIS, USA)

CHAPTER 3 HYDROPEROXIDE DECOMPOSITION PRODUCTS IN THERMALLY OXIDIZED OILS
59
products. All other chemicals were HPLC or reagent grade and were purchased from
Fluka (Buchs, Switzerland).
3.2.3 Chemical characterization of oils
The determination of the peroxide value, the specific extinction K232 (conjugated
dienes) and K270 (trienes and carbonyl compounds) were performed on oil samples
before the heating tests according to the EC official methods for olive oils (EC
Regulation 2568/91).
The phenolic compounds were extracted from oils and analyzed by reversed phase
HPLC following the method previously described (Sacchi et al., 2002) The
chromatographic separation was achieved on a Shimadzu (Milan, Italy) liquid
chromatograph (model LC-10AD) equipped with a Spherisorb (Bedfordshire, UK)
ODS-3 5μ column (250 x 4.6 mm i.d.). The HPLC peaks were detected using a diode
array detector (model SPD M10A VP) identified by comparing their relative
retention times and UV spectra with those of pure compounds (simple phenol acids
and alcohols). Major peaks due to complex phenols (hydrolysable phenols) were
assigned to the molecular structures identified by Montedoro et al. (1993) and
Brenes et al. (2000). Quantitative analysis of the main phenol peaks was made with
the aid of tyrosol as an external standard according to the procedure indicated by
Tsimidou et al. (1992).
Tocopherols were determined by reversed- phase HPLC (Tonolo and Marzo,
1989) using the same column and equipment employed for the phenol analysis and
d- -tocopheryl acetate (Fluka, Switzerland) as internal standard. Quantitative data
were expressed as -tocopherol (response factor calculated using a standard solution
of -tocopherol and d- -tocopheryl acetate).
3.2.4 Total polar compounds and short chain fatty acids analysis
Total polar compounds were determined by column silica gel chromatography
according to the official IUPAC method (Waltking and Wessels, 1981; AOAC,
2000; Dobarganes et al., 2000).

CHAPTER 3 HYDROPEROXIDE DECOMPOSITION PRODUCTS IN THERMALLY OXIDIZED OILS
60
The analysis of fatty acid methyl esters (FAMEs) in starting oils and that of short
chain fatty acids in heated oils were carried out by gas chromatography according to
the method described by Màrquez-Ruiz and Dobarganes (1996) (Figure 3.2.4.1) on a
Shimadzu GC17A chromatograph (Shimadzu Italia, Milan, Italy) equipped with a 60
m fused-silica capillary column (Quadrex Corporation, New Heaven, U.S.A.) coated
with cyanopropyl methyl silicone (0.25 μm film thickness). Temperature was set at
80°C for 5 min, then to 170°C at a rate of 10°C min-1, kept at 170°C for 12 min,
then to 220°C at a rate of 10°C min-1, and finally 6 min at 220°C. The injection
temperature was 250°C and the detector temperature was 250°C. The individual
FAMEs were identified by comparison with the retention times of pure standards
(mixture Olive – cod. 90-5518, Larodan, Malmoe, Sweden). Quantification of
methyl-octanoate and methyl-heptanoate was made by referring to an internal
standard (methyl-nonanoate) (Màrquez-Ruiz and Dobarganes, 1996).
Figure 3.2.4.1. Example of Gas-liquid chromatogram showing fatty acid composition of a sample added C9:0 as internal standard. The corresponding peaks of C8:0 and I.S. have been indicated.
3.2.5 1H-NMR spectroscopy
Oil samples were prepared by dissolving in 5 mm NMR tubes 100 μL of oil in
700 μL of Chloroform-d (Euriso-Top, 99.8% isotopic purity) containing 1.1 mmol/L

CHAPTER 3 HYDROPEROXIDE DECOMPOSITION PRODUCTS IN THERMALLY OXIDIZED OILS
61
of 1,3,5-tribromobenzene (TBB, Fluka) as an internal reference for the quantitative
analysis of aldehydes. All spectra were recorded at a temperature of 25°C. Chemical
shifts were referred to internal tetramethylsilane (TMS). 1D proton NMR spectra
were acquired on a Varian Unity 400, operating at a proton frequency of 400 MHz,
located at the “IBB-CNR, Istituto di Biostrutture e Bioimmagini del C.N.R.” at the
University Federico II of Naples, equipped with a 5 mm Indirect Detection probe
(Varian, Palo Alto, CA, USA). 400 MHz proton NMR spectra were recorded with
the following acquisition parameters: 32K data points (zero-filled to 64K data points
prior to Fourier transformation), spectral width 13 ppm, acquisition time 3.0 s, pulse
width 10°, 3000 scans were used for a total acquisition time of 2.5 hours. Total
accumulation time was reduced to 2 min on a Varian UNITY-Inova 600 NMR
spectrometer operating at a proton frequency of 600 MHz, also located at the
IBBCNR, equipped with a 5mm PFG Penta Probe (Varian, Palo Alto, CA, USA).

CHAPTER 3 HYDROPEROXIDE DECOMPOSITION PRODUCTS IN THERMALLY OXIDIZED OILS
62
3.3 RESULTS AND DISCUSSION
The chemical composition of vegetable oils used in this study is reported in Table
3.3.1. The samples presented oxidation parameters, fatty acids composition,
tocopherols and phenolic antioxidants contents quite different. No phenols were
detected in two seed oils, whilst virgin olive oil used in this study was characterized
by a total phenolic content of 224 mg tyrosol /Kg oil as determined by HPLC (sum
of the identified compounds). The phenol composition is reported in Table 3.3.1.
Table 3.3.1. Chemical composition of unheated oils

CHAPTER 3 HYDROPEROXIDE DECOMPOSITION PRODUCTS IN THERMALLY OXIDIZED OILS
63
Oil samples collected at regular intervals during heating at 180°C, were submitted
to the determination of the total polar compounds, to the HRGC and 1H-NMR
analyses of short chain fatty acids and aldehydes, respectively. The comparison of
the data obtained from each independent method was made following the formation
of the different classes of compounds. In fact, the homolytic -scission of
hydroperoxides formed during the thermoxidation of vegetable oils generates
different products, depending on the structure of the starting fatty acids, on the
position of the peroxyl group and on the cleavage site (Màrquez-Ruiz and
Dobarganes, 1996; Frankel, 1991). It is known that temperature-induced cleavage on
the side of the acyl carbonyl head of the oleyl-8-hydroperoxide gives rise to the
formation of heptanoate and n-alkenals; the decomposition of oleyl-9, linoleyl-9 or
linolenyl-9- hydroperoxides gives rise to the formation of octanoate and unsaturated
aldehydes like trans-2-alkenals, alka-2,4- dienals and 4-hydroxy-2-alkenals (Frankel,
1987).
In Figure 3.3.1 is shown the formation of octanoate 1 and aldehydes 2- 5 from
oleyl-9 6, linoleyl-9 hydroperoxides 7.
The formation of the octanoyl chain 1 bound to the glyceryl moiety of
triacylglycerols is due to oleyl-9 6 and linoleyl-9 hydroperoxide 7 cleavage, that also
produces unsaturated aldehydes 2 and 3 6. The formation of saturated aldehydes 4
and 5 originates from the decomposition of oleyl-10 8 and linoleyl-13
hydroperoxides 9. In these cases no octanoyl chains are formed (Frankel, 1998).
Therefore, the amount of saturated aldehydes cannot be correlated with the HRGC
determination of methyl octanoate 1, while a possible relationship can only be
checked between the total amount of aldehydes determined by NMR and the total
amount of polar compounds.

CHAPTER 3 HYDROPEROXIDE DECOMPOSITION PRODUCTS IN THERMALLY OXIDIZED OILS
64
Figure 3.3.1. Formation of octanoate (1), 2-undecenal (2), 2,4-decadienal (3) and n-alkanals (4 and 5) from the homolytic b-scission of oleyl-9 hydroperoxy (6), linoleyl-9 hydoperoxy (7), oleyl-10 hydroperoxy (8), and linoleyl-13 hydroperoxy (9) radicals.
3.3.1 1H-NMR quantitative analysis of aldehydes
The formation of aldehydic compounds during the oil thermoxidation was
followed in the 1H-NMR spectra by measuring the absolute intensity of carbonyl
proton (-CHO) resonances in the low field spectral region (Figure 3.3.1.1).

CHAPTER 3 HYDROPEROXIDE DECOMPOSITION PRODUCTS IN THERMALLY OXIDIZED OILS
65
According to literature data (Claxson et al., 1994; Guillén and Ruiz, 2005a,b, 2006,
2008), -CHO proton resonances have been assigned to n-alkanals (triplet at 9.76
ppm), 4- hydroxy-trans-2-alkenals (doublet at 9.61 ppm), alka-2,4- dienals (doublet
at 9.54 ppm) and trans-2-alkenals (doublet at 9.51 ppm).
The quantitative data were expressed as mmol/L oil, using the tribromobenzene
(TBB) as an internal standard (7.7 mmol per Litre of oil) added to the oil sample in
chloroform-d solution. This compound was chosen for its solubility in chloroform
and for its proton chemical shift around 7.6 ppm not overlapping other proton NMR
signals usually occurring in vegetable oils (Sacchi et al., 1997).
Figure 3.3.1.1. 1H NMR spectrum of a sunflower oil thermoxidized for 6 hours, acquired at
400 MHz in CDCl3 (a). In the expansion of the low field region (b) the aldehyde proton signals are assigned as follows: 1) n-alkanals, 2) 4-hydroxy-trans-2-alkenals, 3) alka-2,4-dienals, 4) trans-2-alkenals.
a
b

CHAPTER 3 HYDROPEROXIDE DECOMPOSITION PRODUCTS IN THERMALLY OXIDIZED OILS
66
The formation of the hydroperoxidienes was also investigated by the proton
patterns centred around 8.5 ppm, corresponding to the hydroperoxide protons (-
OOH), and at 5.5-6.6 ppm, due to the hydroperoxidiene conjugated olefinic protons
(R-CH=CH-CH=CH-CH-OOH-R) (Claxson et al., 1994; Haywood, et al., 1995). No
increase in the corresponding resonance was detected during heating, confirming that
hydroperoxides at frying temperature are rapidly decomposed and do not accumulate
in the oil. Diagnostic resonances of fatty acid dimers (Neff et al., 1988) in this
experimental conditions in the NMR spectra of heated oils were also not detected in
all examined oils. The time-course of the total aldehydes formation in three oils
studied is presented in the Figure 3.3.1.2.
Figure 3.3.1.2. Quantitative evolution of total aldehydes in different vegetable oils subjected to heating at 180°C, as measured by 1H-NMR spectroscopy
In virgin olive oil a detectable amount of aldehydes was observed only after 2
hour heating, whilst sunflower and soybean oils showed 1.99 and 1.60 mM/L
respectively of total aldehydes after 1 hour heating. The relative rate of total
aldehydes formation was virgin olive oil< soybean oil < sunflower oil. The

CHAPTER 3 HYDROPEROXIDE DECOMPOSITION PRODUCTS IN THERMALLY OXIDIZED OILS
67
behaviour of EVOO can be attribuited both to the fatty acid composition (rich in
oleic acid and low level of PUFAs) and to the presence of antioxidants (phenols,
tocopherols). The higher degradation of sunflower oil with respect to soybean oil
indicate a strong antioxidant role of -tocopherol at high temperatures (Frankel,
1998) In all vegetable oils, aldehydic components increase quite regularly throughout
the thermal treatment. Figure 3.3.1.3 shows the formation of the different aldehydes
during 6 hours heating. Alka-2,4-dienals and trans-2-alkenals (Figure 3.3.1.3a and
b) are the major products detected in heated oils. This indicates that the oxidation
site in acyl-9 positions is the preferred oxidation site with respect to other positions
(acyl- 10 and acyl-11 in oleic acid; acyl-13 in linoleic acid).
Figure 3.3.1.3. Quantitative evolution of alka-2,4-dienals (a), trans-2-alkenals (b), n-alkanals (c) and 4-hydroxy-trans-2-alkenals (d) in different vegetable oils subjected to heating at 180°C, as measured by 1HNMR spectroscopy .

CHAPTER 3 HYDROPEROXIDE DECOMPOSITION PRODUCTS IN THERMALLY OXIDIZED OILS
68
The production of trans-2-alkenals was similar in olive oil and seeds oils (Figure
3.3.1.3b), while n-alkanals were produced at the end of the heating in a larger
amount in olive oil (Figure 3.3.1.3c). The 4-hydroxy-2-alkenals were not detected
(threshold 0.1 mM/L) in olive oil (Figure 3.3.1.3d). The formation of these
compounds is, in fact, related to the decomposition of conjugated
hydroperoxydienes, arising from the oxidation of polyunsaturated fatty acids
(Claxson et al., 1994). In olive oil, the low amount of linoleic and linolenic acids
explain this findings. For the same reason, alka-2,4-dienals were also formed in very
small amounts (1.1 mM/L oil after 6 hours heating) with respect to polyunsaturated
seed oils.
3.3.2 Relationship between unsaturated aldehydes and methyl-octanoate
Oil samples collected during the 6 hours heating were analysed by HRGC to
follow methyl octanoate 1 and methyl-heptanoate formation (Figure 3.3.1). Methyl-
octanoate was detected just after 30 min heating for all studied oils, whilst methyl-
heptanoate formation was detectable only in virgin olive oil at the end of the 6-hours
heating. This finding was in agreement with data reported by Màrquez-Ruiz and
Dobarganes (1996), who observed a significant formation of heptanoate only after 10
hours heating in high-oleic oils. In order to correlate the formation of aldehydes
measured by NMR to the amount of octanoate 1, only unsaturated aldehydes like 2
and 3 have been considered on the basis of the hydroperoxide breakdown mechanism
described above (Figure 3.3.1). The octanoate 1 level determined by HRGC fits well
(R2= 0.941) with that of unsaturated aldehydes measured by NMR as shown in
Figure 3.3.2.1.
The regression analysis indicates that the aldehyde molar content determined by
NMR is almost twice that of the corresponding octanoate content derived from the
HRGC data. This is likely a consequence of linoleyl and linolenyl hydroperoxide
cleavages in position other than -9, which gives rise to unsaturated aldehydes but to
acyl residues different from octanoate (Frankel, 1998).

CHAPTER 3 HYDROPEROXIDE DECOMPOSITION PRODUCTS IN THERMALLY OXIDIZED OILS
69
Figure 3.3.2.1. Linear regression plot of methyl octanoate (mM/L of oil) determined by HRGC on total unsaturated aldehyde amount (mM/L of oil) determined by 1H-NMR spectroscopy.
3.3.3 Relationship between total aldehydes and total polar compounds
A good linear relationship (R2=0.918) was also found between the amount of total
aldehydes and total polar compounds (Figure 3.3.3.1).
Figure 3.3.3.1. Linear regression plot of total polar compounds (wheight, %) determined by silica column chromatography on total aldehydes amount (mM/L of oil) determined by 1H-NMR spectroscopy.
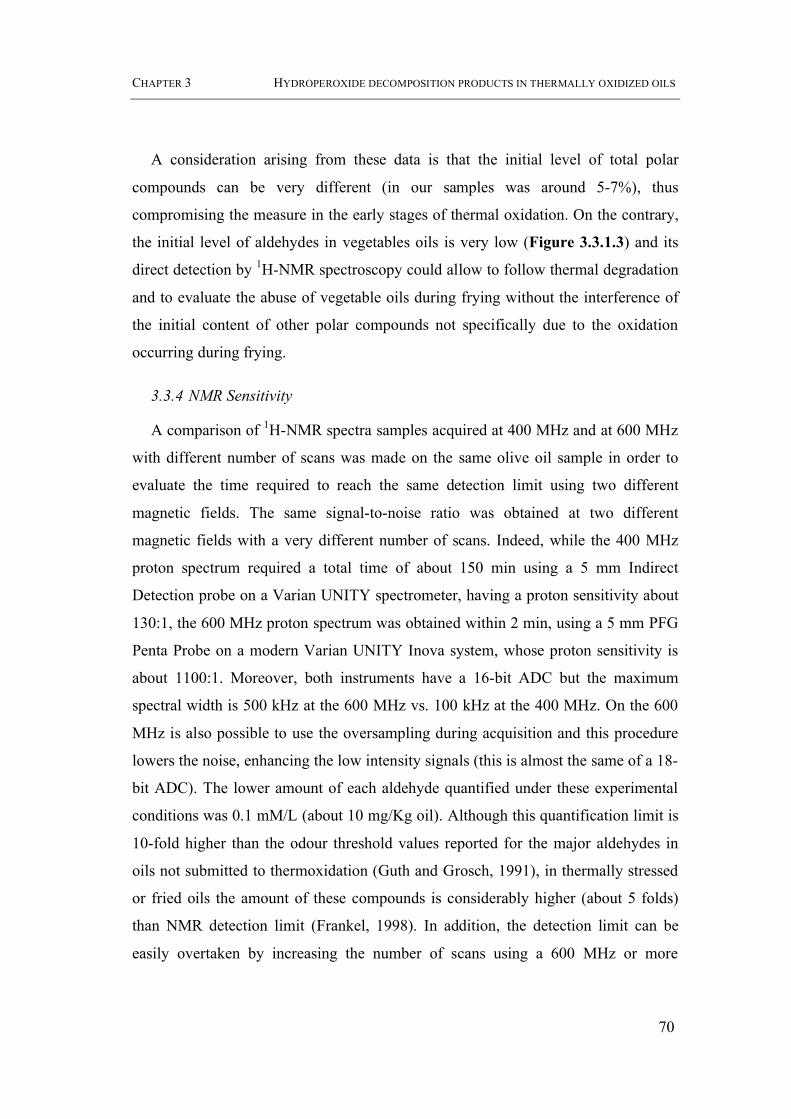
CHAPTER 3 HYDROPEROXIDE DECOMPOSITION PRODUCTS IN THERMALLY OXIDIZED OILS
70
A consideration arising from these data is that the initial level of total polar
compounds can be very different (in our samples was around 5-7%), thus
compromising the measure in the early stages of thermal oxidation. On the contrary,
the initial level of aldehydes in vegetables oils is very low (Figure 3.3.1.3) and its
direct detection by 1H-NMR spectroscopy could allow to follow thermal degradation
and to evaluate the abuse of vegetable oils during frying without the interference of
the initial content of other polar compounds not specifically due to the oxidation
occurring during frying.
3.3.4 NMR Sensitivity
A comparison of 1H-NMR spectra samples acquired at 400 MHz and at 600 MHz
with different number of scans was made on the same olive oil sample in order to
evaluate the time required to reach the same detection limit using two different
magnetic fields. The same signal-to-noise ratio was obtained at two different
magnetic fields with a very different number of scans. Indeed, while the 400 MHz
proton spectrum required a total time of about 150 min using a 5 mm Indirect
Detection probe on a Varian UNITY spectrometer, having a proton sensitivity about
130:1, the 600 MHz proton spectrum was obtained within 2 min, using a 5 mm PFG
Penta Probe on a modern Varian UNITY Inova system, whose proton sensitivity is
about 1100:1. Moreover, both instruments have a 16-bit ADC but the maximum
spectral width is 500 kHz at the 600 MHz vs. 100 kHz at the 400 MHz. On the 600
MHz is also possible to use the oversampling during acquisition and this procedure
lowers the noise, enhancing the low intensity signals (this is almost the same of a 18-
bit ADC). The lower amount of each aldehyde quantified under these experimental
conditions was 0.1 mM/L (about 10 mg/Kg oil). Although this quantification limit is
10-fold higher than the odour threshold values reported for the major aldehydes in
oils not submitted to thermoxidation (Guth and Grosch, 1991), in thermally stressed
or fried oils the amount of these compounds is considerably higher (about 5 folds)
than NMR detection limit (Frankel, 1998). In addition, the detection limit can be
easily overtaken by increasing the number of scans using a 600 MHz or more

CHAPTER 3 HYDROPEROXIDE DECOMPOSITION PRODUCTS IN THERMALLY OXIDIZED OILS
71
powerful spectrometers, where a remarkably high signal-to-noise ratio can be
obtained with a total acquisition time of 15 min or less. In addition, the higher
performances of the new multiple resonance probes can greatly improve the 1H
sensitivity, allowing a considerable experimental time reduction even on lower
magnetic fields (300-400 MHz).
3.4 CONCLUSIONS
The obtained results confirm the possibility of using NMR spectroscopy as an
useful method to follow the early stage of lipid thermoxidation and to assess on fried
oils the thermal stress. Moreover, the newly available instruments and the use of
cold-probes will represent a useful tool to monitor and investigate decomposition
products in vegetable oils well below the 1 mM threshold.
Information with the same significance and specificity is actually available only
by the chromatographic determination of tryacilglycerol polymers.

CHAPTER 4 GEOGRAPHICAL CHARACTERIZATION OF EXTRA VIRGIN OLIVE OILS
72
4 GEOGRAPHICAL CHARACTERIZATION OF EXTRA VIRGIN OLIVE OILS
4.1 INTRODUCTION
The determination of the geographical origin of extra virgin olive oils is a recent
problem: the quality of an olive oil is the result of several factors that can be
clustered into four main groups: environmental (soil, climate), agronomic (irrigation,
fertilisation), cultivation (harvesting, ripeness), and technological factors (post-
harvest storage and extraction system) (Solinas, 1987; Solinas et al., 1987;
Fontanazza et al., 1993). Therefore, for the careful determination of the place of
production based on chemical composition, many factors need to be taken into
account (Montedoro et al., 1992).
The diversity and inter-relationship of these factors makes it tremendously
difficult to carry out a complete characterisation of virgin olive oils either by their
chemical composition or their sensory descriptors. Consequently, the characterisation
cannot be carried out with a few series of chemical compounds or a simple data
manipulation. Rather should samples be identified by a large number of variables
(chemical compounds and/or sensory descriptors), and data should be analysed by
statistical techniques or artificial intelligence algorithms (Aparicio and Luna, 2002).
An important act of legislation, the “Protected Designation of Origin” (PDO)
(Reg. EC 2081/92), allows the labeling of some European extra virgin olive oils with
the names of the areas where they are produced. This certification improves the
commercial value of the product. Since the early nineties, many research institutions
devoted to the study of vegetable oils, especially olive oil, have explored and applied
various methods potentially capable of characterising PDO oils for their authenticity;
almost all these studies were based on the application of chemometrics (Aparicio et
al., 1988).
The supposed contribution of the area of olive production to the quality and the
peculiarity of the olive oil is particularly important in Italy, where more than 200
different cultivars are grown in different areas. Several attempts have been made to

CHAPTER 4 GEOGRAPHICAL CHARACTERIZATION OF EXTRA VIRGIN OLIVE OILS
73
identify the place of olive oil production by means of multivariate analysis of
suitable chemical parameters: using the principal component analysis (PCA) of fatty
acid composition and other chemical parameters Forina and Tiscornia (1982),
Alessandri et al., (1997) and Lanza et al., (1998) obtained a first classification of
Italian olive oils from different regions; Aparicio et al. (1988, 1990, 1996), using an
expert system (SEXIA), have studied data from different chemical analyses to
classify Spanish oils with respect to their origin and variety; Tsimidou et al. (1987)
applied the PCA of fatty acids and triacylglycerols for the geographical classification
of Greek olive oils. More recent studies have regarded statistical analysis applied to
fatty acids, triacylglycerols composition and NIR spectra in order to discriminate
French PDO olive oils (Galtier et al., 2007), fatty acids composition to ascertain the
geographical origin and the cultivar of Sicilian extra virgin olive oil (Di Bella et al.,
2007), visible spectra to trace the geographical origin of virgin olive oils coming
from several Mediterranean regions (Forina et al, 2007), volatiles compounds to
characterize virgin olive oils produced in northern Italy (Vichi et al., 2003) and to
determinate the quality of virgin olive oil applied to the classification of commercial
samples (López-Feria et al., 2007), electronic nose and electronic tongue analysis to
classify and describe extra virgin olive oils belong to Garda PDO (Cosio et al.,
2006), electronic nose and UV-Vis spectrophotometer data to differentiate the
geographical denominations of Liguria (Casale et al., 2007) and sensorial and
physico-chemical properties to characterize the virgin olive oils produced in the
geographic counties of Çanakkale region of Turkey, (Ögütçü et al., 2008).
Brescia et al., 2003,
These authentication methods, usually associated with chemometrics analysis, can
be classified as “with identification” and “without identification” (or “fingerprint”)
techniques. The former are focused on the existence or absence of certain chemical
compounds in the sample (e.g. major and minor components of virgin olive oils:
triacylglycerols, diacylglycerols, wax esters, free fatty acids, triterpenic alcohols,
hydrocarbons, sterols, phenols, flavonoids, pigments, tocopherols, volatile

CHAPTER 4 GEOGRAPHICAL CHARACTERIZATION OF EXTRA VIRGIN OLIVE OILS
74
compounds, etc.), the latter are based on a combination of measurements (e.g.
spectral fingerprints, multi-sensor array fingerprints, etc.) (Forina et al., 2007).
Chemometrics proved to be a powerful tool for answering complex questions such
as the geographical origin and it is generally believed to be applicable to food
products (Bianchi, et al., 2001). Chemometric techniques are especially suitable for
handling the large amounts of data produced by modern analytical methods
(Aparicio et al., 1988).
Nowadays, the analysis of vegetable oils is dominated by classic determinations,
such as acidity, peroxide value, ultraviolet absorption, etcetera, as well as by the use
of chromatographic procedures, including thin layer, gas, and high performance
liquid chromatography (Christie, 2003). These techniques are primarily used for
quantitative measurement of known compounds, and, with these analytical criteria,
different international regulations have been established to define oil genuineness
and quality. One drawback to these procedures is that there are too many different
assays to be applied to routine analysis. In addition, some of these methods require
the isolation and analysis of minor compounds from the unsaponifiable matter by
means of procedures that are laborious and time-consuming. Therefore, many studies
have been carried out to apply new analytical techniques that, with very little or
without any manipulation of the sample, can produce results similar or superior to
those obtained by the classical procedures.
In this context, spectroscopic techniques have emerged as potential tools in recent
years, although the complexity and intrinsic variability of biological samples such as
vegetable oils usually require the application of multivariate calibration or pattern-
recognition techniques to aid interpretation of the data obtained using these
instrumental methods (Shoolery, 1977; Cordella, 2002; Hidalgo and Zamora 2003;
Tapp et al., 2003). One spectroscopic technique with a high potential in this field is
High-Resolution Nuclear Magnetic Resonance (NMR) spectroscopy.
Different NMR experiments and equipment, such as High-Resolution
NMR, low-resolution NMR and Magnetic Resonance imaging, yield

CHAPTER 4 GEOGRAPHICAL CHARACTERIZATION OF EXTRA VIRGIN OLIVE OILS
75
different information. With High-Resolution NMR one can perform both
qualitative and quantitative analyses of samples in solution, which can be
used for structural studies and compositional analyses (Mannina et al.,
2003b).
So a NMR spectrum contains a great amount of information that can be obtained
in a short time period and employed as an alternative to many classic analytical
procedures. The different signals present in the NMR spectra provide two kinds of
information: the chemical shifts and the relative intensities. The former is of
qualitative value and it is related to the different atoms present in the analysed
sample. The latter provides quantitative information of the different signals (Hidalgo
and Zamora 2003).
In the last year NMR spectroscopy has been widely used in food analysis. With
High-Resolution NMR one can perform both qualitative and quantitative
analyses of samples in solution, which can be used for structural studies and
compositional analyses. To assess the role of NMR in food chemistry we
must know which specific problem it has to solve, how conclusive is the
evidence that derives from the NMR investigation and how it compares to
other methods that can be brought to bear on the same problems. In the
published literature, many NMR studies using various NMR techniques have
been reported on different types of food and drinks which include wine, olive
oil, coffee, fruit juices, tomatoes, milk, meat, egg, starch granules and flour
(Alberti et al., 2002; Mannina et al., 2003b; Sobolev et al., 2003; Lachenmeier et al.,
2005; Sacchi and Paolillo, 2007).
Numerous application are being described regarding to the determination of
authenticity and quality of vegetable oils by using high resolution NMR (Vlahov,
1999; Mannina et al., 2001a,b; Guillén and Ruiz, 2003; Hidalgo and Zamora 2003:
Mannina et al., 2005; Rezzi et al., 2005; Petrakis et al., 2008). High-resolution NMR
plays an important role in oil analysis. This is firstly due to the absence of sample
pretreatment, since oils are simply added to a deuterated solvent before analysis. 1H
NMR studies of oils have increased because of the great amount of information that

CHAPTER 4 GEOGRAPHICAL CHARACTERIZATION OF EXTRA VIRGIN OLIVE OILS
76
high field NMR instruments can provide with a single experiment and in a very short
time (Sacchi et al., 1996, 1997; Brescia and Sacco 2008). High-field 1HNMR
spectroscopy has been successfully employed to characterize olive oil, to the extent
of identifying many of its minor components including many volatile compounds
and discriminate oils from different varieties and from different regions of Italy
(Sacchi et al., 1996, 1997, 1998; Mannina, 2001a, 2005; Brescia and Sacco, 2008). 13C NMR has been used to monitor adulterations in olive oil and classify the samples
according to variety and geographical origin (Vlahov et al., 1999; Vlahov et al.,
2001). 13C-NMR has been applied to the study of the triacylglycerol structure of
palm oils (Ng, 1983, 1985, 2000), olive oils (Sacchi et al, 1992; Vlahov, 2006), seed
oils (Wollemberg, 1990) and some hydrogenated fats (Cengarle et al. 1992; Pfeffer
et al., 1977a; Gunstone, 1991a,b; 1993a,b).
All existing data suggest that with only one analysis, NMR allows the
determination of a large number of components with very little or without any
manipulation of the oil samples that nowadays need many different analyses. In
addition, the application of multivariate statistics to NMR spectral data increases
considerably the potential of the technique. However, because minor components of
the oils are playing an essential role in defining oil authenticity and quality,
concentration of these compounds (either by using a chromatographic procedure or
by the use of unsaponifiables) or their observation during routine analysis by using
more sensitive probes, seem to be a necessary requisite to achieve a routine
application of NMR to most aspects of oil analysis (Hidalgo and Zamora 2003).
Chemometrics is habitually used for exploring patterns of association in data, and
preparing and using multivariate classification models. The arrival of Chemometrics
techniques has allowed the quantitative as well as qualitative analysis of multivariate
data and, in consequence, it has allowed that we can now analyse and model a lot of
different types of experiments (Aparicio, 2002). Chemometrics methods have been
commonly applied for matching and discrimination, classification and prediction in
assessing authenticity of vegetable oils (Zhanga, 2006). The general concept of

CHAPTER 4 GEOGRAPHICAL CHARACTERIZATION OF EXTRA VIRGIN OLIVE OILS
77
authentication, on the other hand, is not only circumscribed to adulteration but also
include aspects as characterisation, geographical origin of foodstuffs, extraction and
processing systems among others. GC and LC methods in combination with
multivariate statistical techniques such as principal component analysis (PCA),
discriminant analysis (DA), cluster analysis (CA), K-nearest neighbor, partial least
squares (PLS) and artificial neural networks (ANN) have been applied successfully
to classify and discriminate the oils (Aparicio, 2002). Moreover, there have been
several other researches, using different chemical indices as descriptors, which
focused on the use of supervised chemometric techniques for discriminating olive oil
samples almost always in terms of their geographical origin (Marini et al., 2004).
In this part of the work NMR analysis has been applied to discriminate oils of
various geographic and varietal origin and to estimate the contribution of NMR
spectroscopy to the traceability of virgin olive oils. The study has been based on 1H-
NMR analysis of some minor compounds and on gas chromatographic analysis (GC)
of fatty acids composition of olive oils. This last information, in fact, already has
allowed to the discrimination of some Italian POD oils (Scarpa et al., 2005) and has
been applied in combination to NMR spectroscopy for the varietal and geographic
classification of olive oils (Mannina et al., 2001a,b, 2003a). 1H-NMR and GC data
obtained in this study were processed by means of statistics analysis (Principal
Component Analysis, Discriminant Analysis and Cluster analysis) to attempt of
classify oils obtained from different varieties and geographic areas (Calabria,
Campania, Basilicata, Puglia).
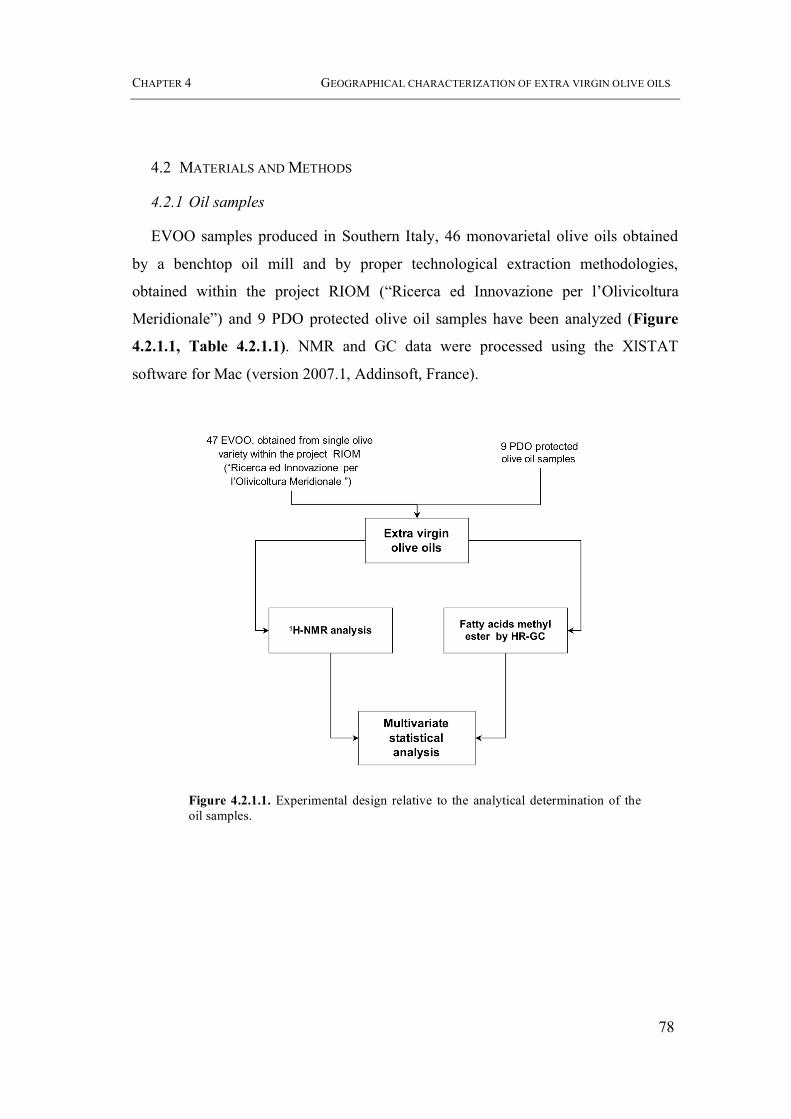
CHAPTER 4 GEOGRAPHICAL CHARACTERIZATION OF EXTRA VIRGIN OLIVE OILS
78
4.2 MATERIALS AND METHODS
4.2.1 Oil samples
EVOO samples produced in Southern Italy, 46 monovarietal olive oils obtained
by a benchtop oil mill and by proper technological extraction methodologies,
obtained within the project RIOM (“Ricerca ed Innovazione per l’Olivicoltura
Meridionale”) and 9 PDO protected olive oil samples have been analyzed (Figure
4.2.1.1, Table 4.2.1.1). NMR and GC data were processed using the XlSTAT
software for Mac (version 2007.1, Addinsoft, France).
Figure 4.2.1.1. Experimental design relative to the analytical determination of the oil samples.

CHAPTER 4 GEOGRAPHICAL CHARACTERIZATION OF EXTRA VIRGIN OLIVE OILS
79
Table 4.2.1.1. Origins and Cultivars of Extra Virgin Olive Oils
4.2.2 Standards and reagents
Chloroform-d was obtained from Aldrich Chemical Co. (Milwaukee, WIS, USA).
All other chemicals were GC or reagent grade and were purchased from Fluka
(Buchs, Switzerland).
sample cultivar origin sample cultivar origin
Rav Ravece Car Carolea
Rav Ravece Car Carolea
Rav Ravece Car Carolea
Ogl Ogliarola CdM Cima di Melfi
Car Carolea CdM Cima di Melfi
Car Carolea CdM Cima di Melfi
Cor Coratina CdM Cima di Melfi
Cor Coratina MdF Maiatica di Ferrandina
Cor Coratina MdF Maiatica di Ferrandina
Cor Coratina MdF Maiatica di Ferrandina
Cai Caiazzana Car Carolea
Cai Caiazzana Ott Ottobratica
Cai Caiazzana Ott Ottobratica
Cai Caiazzana Ott Ottobratica
Ton Tonda Rot Rotondella
Ton Tonda Rot Rotondella
Car Carolea Rot Rotondella
Car Carolea Rot Rotondella
Cas Cassanese
Cas Cassanese POD
DdR Dolce di Rossano AC1 Alto Crotonese
DdR Dolce di Rossano BZ1 Bruzio
DdR Dolce di Rossano Ci 03 Cilento
Tond Tondina CS 83 Collina Salernitane
Tond Tondina CB1 Colline di Brindisi Puglia
Tond Tondina ME 1 Monte Etna
Rog Roggianella MI 14 Monti Iblei
Car Carolea Krotone VM 6 Val di Mazara
Car Carolea Catanzaro VT 4 Valli Trapanesi
Potenza
Reggio
Calabria
Salerno
Catanzaro
Calabria
Campania
Sicilia
Avellino
Bari
Caserta
Cosenza

CHAPTER 4 GEOGRAPHICAL CHARACTERIZATION OF EXTRA VIRGIN OLIVE OILS
80
4.2.3 Preparation of FAMEs and Gas chromatography
Analysis of fatty acid methyl esters (FAMEs) were carried out by cold
transmethylation in KOH/methanol (EC Regulation No. 2568/91; Christie, 2003).
A quantity of 100 mg oil was weighed and dissolved in 10 ml n-hexane. 2 ml of
this solution was mixed with 1 ml sodium methylate solution (2 N in methanol) in a
sample vial and shaken vigorously for 1 min using a vortex mixer. The clear
supernatant was used for GC analysis.
Analyses of FAME were performed using a Shimadzu GC17A gas
chromatography (Shimadzu Italia, Milan, Italy) equipped with split/splitless injection
port, flame ionization detector and a 60 m fused-silica capillary column (Quadrex
Corporation, New Heaven, U.S.A.) coated with cyanopropyl methyl silicone (0.25
μm film thickness). Helium was used as the carrier gas and the flow rate was 1.8 ml
min±1 at a split ratio of 1:60. The temperature of both the injector and detector was
250 °C. The initial oven temperature was set at 170 °C for 20 min; it was then
programmed to increase at a rate of 10 °C min±1 until it reached 220 °C, maintained
for 10 min. The samples (1 μl) were injected using an automatic injector Shimadzu
AOC-20i (Shimadzu Italia, Milan, Italy). The individual FAMEs were identified by
comparison with the retention times of pure standards (mixture Olive, Larodan,
Malmoe, Sweden).
4.2.4 1H-NMR spectroscopy
The 1H-NMR procedure reported by Sacchi et al (1998) and Mannina et al.
(2001a), with some modification, was followed. Olive oils (6 mg) were placed into
5mm NMR tubes and dissolved in chloroform-d (600 μl). 1H-NMR spectra were
recorded on a Varian Unity INOVA 600 instrument operating at 600 MHz, with a
cold probe. 1H-NMR FIDs were recorded using the following acquisition parameters:
acquired points 16K, processed points 16K, spectral width 8 ppm, relaxation delay
1s, acquisition time 1.2s, number of scans 128. The intensities of the selected
resonances were compared to that of the methylene resonance at 1.602 ppm, the

CHAPTER 4 GEOGRAPHICAL CHARACTERIZATION OF EXTRA VIRGIN OLIVE OILS
81
intensity of which is set to 1000. The quantitative evaluation of peaks of interest was
performed after a careful baseline correction.

CHAPTER 4 GEOGRAPHICAL CHARACTERIZATION OF EXTRA VIRGIN OLIVE OILS
82
4.3 RESULTS AND DISCUSSION
From NMR spectra at 600 Mhz have been integrated 5 resonances of minor
compounds: -sitosterol (0.68 ppm), squalene (1.63 ppm) and terpenes (4.59, 4.66 e
4.72 ppm) (Figure 4.3.1).
Figura 4.3.1. Virgin olive oil 1H-NMR spectra at 600 MHz with expansion of the relative regions to the resonances of minor compounds.
Spectra, obtained with 128 scans in 6 minute of acquisition, have shown an good
signal/noise relation allowing the quantitative analysis of these minor resonances.
Before the quantitative evaluation of all peaks of interest, a careful baseline
correction was performed. The intensities of the selected resonances (see Figure
4.3.1) were compared to that of the methylene resonance at 1.60 ppm, the intensity of
which is set to 1000. This normalizing procedure gives for each resonance an index
proportional to the molar ratio between each compound and the total amount of the
fatty chains.
terpenes
squalene -sitosterol

CHAPTER 4 GEOGRAPHICAL CHARACTERIZATION OF EXTRA VIRGIN OLIVE OILS
83
The data matrix obtained arranging NMR data with that of fatty acids
composition, determined by gas chromatography, has been submitted to the
statistical analysis.
In Figure 4.3.2 are reported the score plot (samples distribution) and loading plot
(correlations between variables) coming out from the principal components analysis
(PCA) obtained from elaboration of NMR data (5 variable x 56 samples) and acidic
composition (16 variables for 56 samples). The first two principal components
explain approximately 46% of the variance.
Figure 4.3.2. Score plot (a) and Loading plot (b) of Principal Components Analysis (PCA) carried out on NMR data and fatty acids composition (gas chromatographic data) of oils samples.
a
b

CHAPTER 4 GEOGRAPHICAL CHARACTERIZATION OF EXTRA VIRGIN OLIVE OILS
84
The PCA shows the distribution of oil samples along the first two principal
components and their grouping in relation to the cultivars. In particular, the score
plot (Figure 4.3.2a) shows a clear distinction of the Carolea (Car) and Coratina
(Cor) cultivar along the first principal component (F1). NMR data, how shown in
loading plot (Figure 4.3.2b), contribute to differentiate the samples along the second
principal component (F2). The oil samples show a good dispersion, but not a clear
discrimination between oils from the various cultivars.
In Figure 4.3.3 the PCA, obtained with only fatty acids composition, shows how
the gas chromatographic data contribute mainly to the dispersion of samples in
relation to cultivars.
Figure 4.3.3. Score plot (a) and Loading plot (b) of Principal Components Analysis (PCA) carried out on fatty acids composition (gas chromatographic data) of oils samples.
a
b

CHAPTER 4 GEOGRAPHICAL CHARACTERIZATION OF EXTRA VIRGIN OLIVE OILS
85
Figure 4.3.3 shows the Tree clustering analysis (TCA) obtained on fatty acids
composition (gas chromatographic data).
Figura 4.3.3. Tree clustering analysis (TCA) carried out on fatty acids composition (gas chromatographic data) of oil samples. Dissimilarity: Euclidean distance, Agglomeration method: Ward's method.
In this analysis (dendogram) the samples are grouped on their dissimilarity in a
hierarchical diagram. Also using this analysis the Carolea (Car) and Coratina (Cor)
cultivas show an appreciable grouping.
The dendogram obtained from NMR and GC data (Figure 4.3.4 and Table 4.3.1)
shows a subdivision in 10 groups statistically distinguished. The oil samples of
Carolea (Car), Coratina (Cor), Caiazzana (Cai), Cima di Melfi (CdM), Maiatica di
Ferrandina (MdF), Tondina (Tond) and Tonda (Ton) cultivars are distinguished in
rather homogenous groups.

CHAPTER 4 GEOGRAPHICAL CHARACTERIZATION OF EXTRA VIRGIN OLIVE OILS
86
Figure 4.3.4. Tree clustering analysis (TCA) carried out on NMR data and fatty acids composition (gas chromatographic data) of oil samples. Dissimilarity: Chebychev distance, Agglomeration method: Ward's method.
Table 4.3.1. Results by class
Class 1 2 3 4 5 6 7 8 9 10
Objects 2 13 6 9 6 6 3 5 1 5
Sum of weights 2 13 6 9 6 6 3 5 1 5
Within-class variance 5,572 6,197 7,119 7,678 8,745 7,082 2,935 4,346 0,000 11,595
Minimum distance to centroid 1,669 1,065 1,148 0,958 1,469 0,991 1,366 0,682 0,000 2,435
Average distance to centroid 1,669 2,296 2,317 2,404 2,461 2,218 1,398 1,607 0,000 2,995
Maximum distance to centroid 1,669 3,431 3,108 4,127 4,295 3,856 1,461 3,185 0,000 3,999
Cai Cai Cai Car Car Cas CdM Cor Ott Tond
Cai Car Car DdR CdM MdF Rav Cor Tond
Car DdR Ott CdM MdF ME 1 Cor Ogl
Car Rot Ott CdM AC1 Cor Rog
Car BZ1 Rav Ton VM 6 Tond CS 83
Car MI 14 Rav Ton VT 4
Car Rot
Car CB1
Cas Ci 03
DdR
MdF
Rot
Rot

CHAPTER 4 GEOGRAPHICAL CHARACTERIZATION OF EXTRA VIRGIN OLIVE OILS
87
The other cultivars do not appear sufficiently differentiated from each other. They
show a fatty acids composition not much homogenous within the same cultivar
probably because of a different olives ripeness degree or different agronomic and
environment condition of harvesting. Furthermore the small samples number has not
allowed to carry out other hypothesis on variability observed.
Carrying out a Discriminant Analysis (Figure 4.3.5) on the NMR and GC data
matrix, a good differentiation of Tondina (Tond), Ottobratica (Ott), Caiazzana (Cai),
Ravece (Rav), Maiatica di Ferrandina (MdF) and Rotondella (Rot) varieties is
observed. The Coratina (Cor), Carolea (Car), Cassanese (Cas), Cima di Mola
(CdM), Tonda (Ton) and Dolce di Rossano (DdR) cultivars even if shown a partial
superimposition in the central zone of the plot, have a very characterized groups
potentially useful in order to verify, a posteriori, the oils varietal origin. Data
obtained from the determination of fatty acids and NMR, can contribute to an
objective definition of variety and geographic origin of virgin olive oil.
Figura 4.3.5. Discriminant analysis (DA) carried out on NMR data and fatty acids composition (gas chromatographic data) of oil samples.

CHAPTER 4 GEOGRAPHICAL CHARACTERIZATION OF EXTRA VIRGIN OLIVE OILS
88
4.4 CONCLUSIONS
The results obtained from the oil samples analysis confirm as a combination of
data obtained from different analytical techniques and their multivariate statistic
elaboration allow to characterize the varietal and geographic origin of virgin olive
oils. The data obtained from fatty acids composition, arranged with those deriving
from NMR analysis, can contribute to the objective definition of the cultivar and the
geographic origin of virgin olive oils. Other information will be able also to derive
from the use of other compositive data more correlated to varietal genetic profiling.
Moreover it is of fundamental importance the choice of suitable statistical techniques
for data elaboration to confirm the effectiveness of analytical results.
However, it must be considered which for being able analytically to estimate
virgin olive oils, and to allow that such approach can be useful to the objective
certification of the product, is necessary to refer to data-banks. Data-banks that
collect the analytical results of many oil samples, for each crop year, relatively to the
cultivars or geographical origins that have to be controlled. Certainly is more easy
the traceability of monovarietal oils, above all for the more typical varieties of
southern Italy regions, that of oils produced by olives mixture like PDO oils.
Anyway such approach, certainly complex and more expensive, will be able in
future to support the control organisms of PDO certification, and to contribute to the
“certification” and “traceability” of the olive oils productions. In any case a "typical
oil" will go assessed mainly on sensory and aromatic characteristics, which are the
key factors for the valuable productions of southern Italy.

CHAPTER 5 NEW HORIZONS
89
5 NEW HORIZONS
The development of cryo-probes in combination with ultra-high field magnets
(700-800 MHz) open new horizons with rispect the possibility of detec and quantify
minor compounds of oils and fats directly on the sample and without any treatment
or concetration.
Preliminary experiments carried out on a 700 MHz instrument (Facoltà di
Farmacia, Univerità di Napoli Federico II) revealed the extraordinary information
can be obtained by NMR analysis. Figure 5.1 shows, as an example, the low field
region of spectra recorded on extra virgin olive oils with different sensory profiles, in
which directly by NMR analysis the aldehydes and phenolic compounds, related to
bitter-pungent taste and fruity flavour, can be detected and assigned (Table 5.1).
Figure 5.1. Low field regions of high resolution NMR spectra (700 MHz) of virgin olive oil samples.
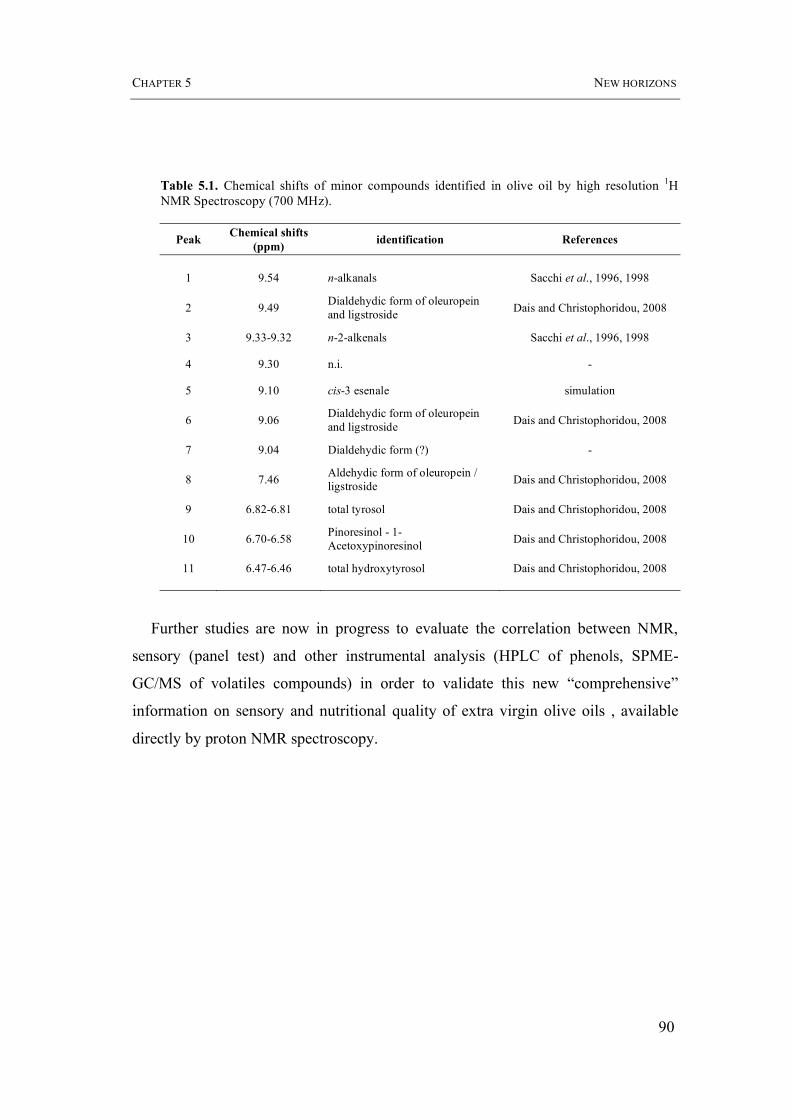
CHAPTER 5 NEW HORIZONS
90
Table 5.1. Chemical shifts of minor compounds identified in olive oil by high resolution 1H NMR Spectroscopy (700 MHz).
Peak Chemical shifts
(ppm) identification References
1 9.54 n-alkanals Sacchi et al., 1996, 1998
2 9.49 Dialdehydic form of oleuropein and ligstroside
Dais and Christophoridou, 2008
3 9.33-9.32 n-2-alkenals Sacchi et al., 1996, 1998
4 9.30 n.i. -
5 9.10 cis-3 esenale simulation
6 9.06 Dialdehydic form of oleuropein and ligstroside
Dais and Christophoridou, 2008
7 9.04 Dialdehydic form (?) -
8 7.46 Aldehydic form of oleuropein / ligstroside
Dais and Christophoridou, 2008
9 6.82-6.81 total tyrosol Dais and Christophoridou, 2008
10 6.70-6.58 Pinoresinol - 1-Acetoxypinoresinol
Dais and Christophoridou, 2008
11 6.47-6.46 total hydroxytyrosol Dais and Christophoridou, 2008
Further studies are now in progress to evaluate the correlation between NMR,
sensory (panel test) and other instrumental analysis (HPLC of phenols, SPME-
GC/MS of volatiles compounds) in order to validate this new “comprehensive”
information on sensory and nutritional quality of extra virgin olive oils , available
directly by proton NMR spectroscopy.

ACKNOWLEDGMENTS
91
ACKNOWLEDGMENTS
Thanks to Prof. Antonio Randazzo (Facoltà di Farmacia, Università di Napoli
Federico II) for the work carried out on 700 MHz NMR spectrometer and for its
collaboration and competence, Prof. Photis Dais for sending us data on NMR
assignment of chemical shift of phenolic compounds before publication, Prof. Livio
Paolillo and Prof. Lucia Falcigno for the illuminating suggestions on high resolution
NMR application on frying oils and Prof. Francesco Addeo for his continuous
advices.
Thanks are due also to Mr. Italo Giudicianni (CIMCF, Università di Napoli
Federico II) and Mr. Leopoldo Zona (CNR-IBB, Università di Napoli Federico II)
for the aid given in recording NMR spectra on milk fat samples and virgin olive oils.
The study on geographical characterization of olive oils has been carried out
within the project RIOM “Ricerca ed innovazione per l’olivicoltura meridionale”
financed by the MIPAAF and coordinated by Dr. Enzo Perri (CRA-OLI di Rende -
Cosenza).

BIBLIOGRAPHY
92
BIBLIOGRAPHY
Alais C. (2000). Scienza del latte, terza edizione, pubblicato da It. Tecniche Nuove, Milano.
Alberti E., Belton P.S. and Gil A.M. (2002) Application of NMR to Food Science. Annual Reports on NMR spectroscop. 47: 109-148.
Alemany L.B. (2002). Using simple 13C NMR linewidth and relaxation measurements to make detailed chemical shift assignments in triacylglycerols and related compounds. Chem.
Phys. Lipids, 120: 33-/44.
Alessandri, S., Cimato, A., Modi, G., Mattei, A., Crescenzi, A., Caselli S., Tracchi, S. (1997). Univariate models to classify Tuscan virgin olive oils by zone. Riv. Ital. Sost. Grasse
74, 155-163.
Andreotti G., Trivellone E., Lamanna R., Di Luccia A., and Motta A. (2000). Milk Identification of Different Species: 13C-NMR Spectroscopy of Triacylglycerols from Cows and Buffaloes’ Milks. J Dairy Sci, 83, 2432–2437
Andreotti G., Lamanna R., Trivellone E. and Motta A. (2002). 13C NMR Spectra of TAG:
An Easy Way to Distinguish Milks from Different Animal Species. JAOCS, 79, 123-127.
AOAC (2000). Official Method 982.27 – Polar Components In Frying Fats. AOAC International.
Aparicio, R.; Albi, T.; Cert, A.; Lanzon, A. (1988). SEXIA expert system: canonical equations to characterize Spanish olive oils by varieties. Grasas Aceites, 39, 219- 228.
Aparicio, R.; Ferreiro, L.; Cert, A.; Lanzon, A. (1990). Characterization of Andalusian Virgin olive oil. Grasas Aceites, 41, 23-39.
Aparicio, R.; Calvente, J. J.; Morales, M. T. (1996). Sensory authentication of European extra-virgin olive oil varieties by mathematical procedures. J. Sci. Food Agric., 72, 435-439.
Aparicio R., Mcintyre P., Aursand M., Eveleigh L., Marighetto N., Rossell B., Sacchi R., Wilson R., Woolfe M. (1999). Oils & Fats, in Food Authenticity: issues and methodologies, Published by Eurofins Scientific, Nantes, France. pp. 209-269.
Aparicio R. (2002). “Chemometrics as an Aid in Authentication” in Oils and Fats Authentication. Edited by Michel Jee, published by Blackwell. 1st edition, pp 156-178.
Aparicio R., Luna G. (2002). Characterisation of monovarietal virgin olive oils. Eur. J.
Lipid Sci. Technol. 104: 614-627.
Aursand M, Grasdalen H. (1992). Interpretation of the 13C-NMR spectra of omega-3 fatty acids extracted from the white muscle of Atlantic salmon (Salmo salar). Chem. Phys. Lipids, 62: 239-251.
Aursand M., Rainuzzo J., Grasdalen H. (1993). Quantitative high-resolution 13C and 1H nuclear magnetic resonance of fatty acids from white muscle of atlantic salmon (Salmo
salar). J. Am. Oil Chem. Soc., 70: 971-981.

BIBLIOGRAPHY
93
Aursand M., Jørgensen L., Grasdalen H. (1995). Positional distribution of -3 fatty acids in marine lipid triacylglycerols by high resolution 13C Nuclear magnetic resonance spectroscopy, J. Am. Oil Chem. Soc., 72 (3), 293-297.
Aursand M, Mabon F and Martin GJ. (2000). Characterization of farmed and wild Salmon (Salmo salar). J. Am. Oil Chem. Soc., 77: 659-666.
Aursand M and Alexon DE. (2001). Origin recognition of wild and farmed salmon (Norway and Scotland) using 13C-NMR spectroscopy in combination with pattern recognition techniques. In: Magnetic resonance in food science. A view to the future, Edited by Webb, G.A., Belton, B.S., Gil, A.M., and Delgadillo I. pp. 227-231, Royal Society of Chemistry, Cambridge (UK).
Bianchi G., Giansante L., Shaw A., Kell D.B. (2001). Chemometric criteria for the characterisation of Italian Protected Denomination of Origin (DOP) olive oils from their metabolic profiles Eur. J. Lipid Sci. Technol. 103:141-150.
Bianco A., Uccella N. (2000). Biophenolic components of olives. Food Res. Int. 33: 475-485.
Brenes M., Hidalgo F.J., Garcia A., Rios J.J., Garcia P., Zamora R., Garrido A., (2000). Pinoresinol and 1-acetoxypinoresinol, two new phenolic compounds identified in olive oil. J.
Am. Oil Chem. Soc. 77: 715- 720.
Brescia M.A., Alviti G., Liuzzi V. and Sacco A. (2003). Chemometric Classification of Olive Cultivars Based on Compositional Data of Oils. JAOCS, 80: 945-950.
Brescia M.A. and Sacco A. (2008). High-Resolution 1H Nuclear Magnetic Resonance in the Study of Oils. Mod. Magn. Res., 1645–1650.
Brühl L. and Matthäus B. (2008). Short-chain fatty acids as marker for the degradation of frying fats and oils. Lipid Tech., 20: 60-63.
Bonnet M., Denoyer C. and Renou J.P. (1990). High Resolution 13C NMR spectroscopy of rendered animal fats: degree of saturation of fatty acids chains and position on glycerol. Int. J. Food Sci. Tech., 25: 399-408.
Buchgraber M., Androni S. and Anklam E. (2007). Quantification of Milk Fat in Chocolate Fats by Triacylglycerol Analysis Using Gas-Liquid Chromatography. J. Agric.
Food Chem., 55: 3275-3283.
Casale M., Armanino C., Casolino C., Forina M. (2007). Combining information from headspace mass spectrometry and visible spectroscopy in the classification of the Ligurian olive oils. An. Chim. Acta, 589: 89–95
Cengarle L, Pranzetti P, Carta A. (1992). Utilizzazione della spettrometria NMR nella determinazione di trans isomeri in margarine commerciali. Riv. Ital. Sostanze Grasse 69:159.
Christie W.W. (2003). Lipid analysis - Third Edition. The Oily Press Lipid Library.
Claxson A.W.D., Hawkes G.E., Richardson D.P., Naughton D.P., Haywood R.M., Chander C.L., Atherton M., Lynch E.J., Grootveld M.C. (1994). Generation of lipid peroxidation products in culinaryoils and fats during episodes of thermal stressing: a high field 1H NMR study. FEBS Lett. 355: 81-90

BIBLIOGRAPHY
94
Council Regulation (EC) No 2991/94 of 5 December 1994 laying down standards for spreadable fats
Commission Regulation (EC) No 445/2007 of 23 April 2007 del 23 aprile 2007 laying down certain detailed rules for the application of Council Regulation (EC) No 2991/94 laying down standards for spreadable fats and of Council Regulation (EEC) No 1898/87 on the protection of designations used in the marketing of milk and milk products
Commission Regulation (EEC) No 4056/87 of 22 December 1987 laying down the methods of analysis and other technical provisions necessary for the implementation of Regulation (EEC) No 3035/80 laying down general rules for granting export refunds on certain agricultural products exported in the form of goods not covered by Annex II to the Treaty, and the criteria for fixing the amount of such refunds.
Commission Regulation (EEC) No 4154/87 of 22 December 1987 laying down the methods of analysis and other technical provisions necessary for the implementation of Regulation (EEC) No 3033/80 laying down the trade arrangements applicable to certain goods resulting from the processing of agricultural products.
Cordella C., Moussa I., Martel A.C., Sbirrazzuoli N. and Lizzani-Cuvelier L. (2002). Recent Developments in Food Characterization and Adulteration Detection: Technique-Oriented Perspectives. J. Agric. Food Chem., 50: 1751-1764.
Cosio M.S., Ballabio D., Benedetti S., Gigliotti C. (2006). Geographical origin and authentication of extra virgin olive oils by an electronic nose in combination with artificial neural networks. An. Chim. Acta, 567: 202–210.
Dais P. and Christophoridou S. (2008). Detection and Quantification of Phenolic Compounds in Olive Oil by Employing 1H High Resolution Nuclear Magnetic Resonance Spectroscopy. A proposal for on-line screening. 6th Euro Fed Lipid Congress, 07-10 September, Athens, Greece. Book of Abstracts, p. 129
Davis A.L., McNeill G.P., Caswell D.C. (1999). Analysis of conjugated linoleic acid isomers by 13C NMR spectroscopy. Chem. Phys. Lipids, 97: 155-165.
Dobarganes M.C., Velasco J., And Dieffenbacher A. (2000). Determination of polar compounds, polymerized and oxidized triacylglycerols, and diacylglycerols in oils and fats Results of Collaborative Studies and the Standardized Method (Technical Report). Pure
Appl. Chem., 72: 1563-1575.
Dobarganes M. C., Márquez-Ruiz G. (2003). Oxidised fats in foods. Curr. Opin. Clin.
Nutr. Metab. Care, 6: 157–163.
Di Bella G., Maisano R., La Pera L., Lo Turco V., Salvo F. and G. Dugo (2007). Statistical Characterization of Sicilian Olive Oils from the Peloritana and Maghrebian Zones According to the Fatty Acid Profile. J. Agric. Food Chem.. 55: 6568-6574
European Comunity. Regulation (1992). 2081/92. Official J. Eur. Communities
European Community Regulation No. 2568/91. EC Official J. September 5th, L248 (1991).
Esterbauer H. (1993). Cytotoxicity and genotoxicity of lipid-oxidation products. Am. J.
Clinic Nutr., 57: 779-786.

BIBLIOGRAPHY
95
Falch E. (2006). Lipids from residual fish raw materials - Quality assessment by advanced analytical methods. PhD Thesis - The Norwegian University of Science and Technology, NTNU, Department of Biotechnology.
Fan, T.W.M. (1996). Metabolite profiling by one- and two-dimensional NMR analysis of complex mixtures. Progr. Nuclear Mag. Res. Spectr.., 28, 161-219.
Fauhl C., Reniero F., Guillou C. (2000). 1H-NMR as a tool for the analysis of mixtures of virgin olive oil with oils of different botanical origin. Magn. Reson. Chem. 38: 436-443.
Fontanazza, G.; Patumi, M.; Solinas, M.; Serraiocco, A. (1993). Influence of cultivars of the composition and quality of olive oil. Acta Hortic.. 356: 358-361.
Forina, M.; Tiscornia, E. (1982). Pattern recognition methods in the prediction of Italian olive oil origin by their fatty acid content. Ann. Chim. 72, 143-155.
Forina, M., Boggia R., Casale M. (2007). The information content of visible spectra of extra virgin olive oil in the characterization of its origin. Annali di Chimica, 97: 615-633.
Frankel E.N. (1987). Secondary products of lipid oxidation. Chem. Phys. Lipids. 44: 73-85.
Frankel E.N. (1991). Recent advances in lipid oxidation. J. Sci. Food Agric. 54, 495-511.
Frankel E.N. (1998). Lipid oxidation. The Oily Press, Dundee, Scotland.
Galtier O., Dupuy N., Le Dréau Y., Ollivier D., Pinatel C., kister J., Artaud J. (2007). Geographic origins and compositions of virgin olive oils determinated by chemometric analysis of NIR spectra. An. Chim. Acta, 595: 136-144.
Glaeser H. (2002). Nota breve. Determination of the milk fat content of fat mixtures. Grasas y Aceites, 53: 357-358
Guillén M.D, Ruiz A (2003a). Edible oils: discrimination by 1H nuclear magnetic resonance. J. Sci. Food Agric., 83: 338-346.
Guillén M.D, Ruiz A (2003b). Rapid simultaneous determination by proton NMR of unsaturation and composition of acyl groups in vegetable oils. Eur. J. Lipid Sci. Technol. 105: 688-696.
Guillén M.D, Ruiz A (2005a). Monitoring the oxidation of unsaturated oils and formation of oxygenated aldehydes by proton NMR. Eur. J. Lipid Sci. Technol. 107: 36-47.
Guillén M.D, Ruiz A (2005b). Oxidation process of oils with high content of linoleic acyl groups and formation of toxic hydroperoxy- and hydroxyalkenals. A study by 1H nuclear magnetic resonance. J. Sci. Food Agric. 85: 2416-2420.
Guillén M.D, Ruiz A (2006). Study by means of 1H nuclear magnetic resonance of the oxidation process undergone by edible oils of different natures submitted to microwave action. Food Chemistry 96: 665–674.
Guillén M.D., and Goicoechea E. (2007). Detection of Primary and Secondary Oxidation Products by Fourier Transform Infrared Spectroscopy (FTIR) and 1H Nuclear Magnetic Resonance (NMR) in Sunflower Oil during Storage. .J Agr. Food Chem. 55: 10729-10736.
Guillén M.D., Ruiz A (2008). Monitoring of heat-induced degradation of edible oils by proton NMR. Eur. J. Lipid Sci. Technol., 110: 52–60.

BIBLIOGRAPHY
96
Gunstone F.D. (199la). The composition of hydrogenated fats determined by high resolution 13C-NMR spectroscopy. Chemistry & Industry 19:802.
Gunstone F.D. (1991b). 13C-NMR studies of mono-, di- and tri-acylglycerols leading to qualitative and semiquantitative information about mixtures of these glycerols esters. Chem.
Phys. Lipids 58:219.
Gunstone F.D. (1993a). Information on the composition of fats from their high resolution 13C Nuclear Magnetic Resonance spectra. J. Am. Oil Chem. Soc. 70:361.
Gunstone F.D. (1993b). The composition of hydrogenated fats by high resolution 13C Nuclear Magnetic Resonance spectroscopy. J. Am. Oil Chem. Soc. 70:965.
Gunstone F.D. (1994). High resolution 13C NMR spectroscopy of lipids. In Advances in lipid methodology-Two, edited by W.W. Christie, The Oily Press, Dundee, Scotland, pp.1-68.
Gunstone F.D., Harwood J.L. and Dijkstra A.J. (2007). The Lipid Handbook - Third Edition CRC Press Taylor & Francis Group.
Guth H., Grosch W. (1991). A comparative study of the potent odorantes of different virgin olive oils. Fat. Sci. Technol. 93: 335-339.
Haywood R.M., Claxson W.D., Hawkes G.E., Richardson D.P., Naughton D.P., Coumbarides G., Hawkes J., Lynch E.J. And Grootveld M.C., (1995). Detection of aldehydes and their conjugated hydroperoxydiene precursors in thermally-stressed culinary oils and fats: investigations using high resolution proton NMR spectroscopy. Free Radic.
Res. 22: 441-482.
Hidalgo F.J. and Zamora R. (2003). Edible oil analysis by high-resolution nuclear magnetic resonance spectroscopy: recent advances and future perspectives. Trends in Food
Science & Technology 14: 499–506.
Hopkins C.Y., Bernstein H.J. (1959). Applications of proton magnetic resonance spectra in fatty acid chemistry. Can. J. Chem. 37: 775-782.
Hu F., Furihata K., Ito-Ishida M., Kaminogawa S. and Tanokura M. (2004). Nondestructive Observation of Bovine Milk by NMR Spectroscopy: Analysis of Existing States of Compounds and Detection of New Compounds. J. Agric. Food Chem., 52, 4969-4974.
Hu F., Furihata K., Kato Y. and Tanokura M. (2007). Nondestructive Quantification of Organic Compounds in Whole Milk without Pretreatment by Two-Dimensional NMR Spectroscopy. J. Agric. Food Chem., 55, 4307-4311.
Hunter, C.A.; Packer, M.J.; Zonta, C. (2005). From structure to chemical shift and vice-versa. Progr. Nuclear Magnetic Res. Spectr., 47: 27-39.
Ichihara K., Shibahara A., Yamamoto K. and Nakayama T. (1996). An Improved Method for Rapid Analysis of the Fatty Acids of Glycerolipids. Lipids, 31: 535-539.
Igarashi T., Aursand M., Hirata Y., Gribbestad I.S., Wada S., Nonaka M. (2000). Nondestructive quantitative determination of docosahexaenoic acid and n-3 fatty acids in fish oils by high-resolution 1H-nuclear magnetic resonance spectroscopy. J. Am. Oil Chem.
Soc. 77: 737-748.

BIBLIOGRAPHY
97
Igarashi T., Aursand M., Sacchi R., Paolillo L., Nonaka M., Wada S. (2002). Determination of docosahexanenoic acid and n-3 fatty acids in refined fish oils by 1H-NMR spectroscopy: IUPAC Interlaboratory Study. J. AOAC Internat. 85: 1341-1354.
Jacobsen N.E. (2007). NMR Spectroscopy Explained. Simplified Theory, Applications and Examples for Organic Chemistry and Structural Biology. Published by John Wiley & Sons, Inc., Hoboken, New Jersey.
Johnsthon L.F., Shoolery J.N., (1962). Determination of unsaturation and average molecular weight of natural fats by Nuclear Magnetic Resonance. Anal. Chem. 34: 1136-1139.
Kalo P, Kempinnen A. and Kilpelainen I. (1996). Determination of positinal distribution of butyril groups in milkfat tiacylglycerols mixtures, and isolated positional isomers of triacylglycerols by gas chromatography and 1H nuclear magnetic resonance. Lipids, 31:331-336.
Kamm W., Dionisi F., Hischenhuber C., Engel K.H., (2001). Authenticity assessment of fats and oils. Food Rev. Int. 17: 249-290.
Kamm W. (2002). Authenticity control of edible fats and oils by analysis of minor constituents via on-line liquid chromatography-gas chromatography. PhD thesis, Technischen Universität München.
Katsuta I., Shimizu M., Yamaguchi T., Nakajima Y. (2008). Emission of Volatile Aldehydes from DAG-Rich and TAG-Rich Oils with Different Degrees of Unsaturation During Deep-Frying. J. Am. Oil Chem. Soc., 85: 513-519.
Knothe G., Lie Ken Jie M.S.F., Lam C.C., Bagby M.O. (1995). Short communication. Evaluation of the 3C-NMR signals of the unsaturated carbons of triacylglycerols. Chem.
Phys. Lipids, 77: 187-191.
Knothe G. and Kenar J.A. (2004). Determination of the fatty acid profile by 1H-NMR spectroscopy. Eur. J. Lipid Sci. Technol., 106: 88–96
Lachenmeier D.W., Frank W., Humpfer E., Schäfer H., Keller S., Mörtter M., Spraul M. (2005). Quality control of beer using high-resolution nuclear magnetic resonance spectroscopy and multivariate analysis. Eur Food Res Technol 220:215-221.
Lambert J.B. and Mazzola E.P. (2003). Nuclear Magnetic Resonance Spectroscopy. An Introduction to Principles, applications and experimental methods. Publisher: Prentice Hall, Pearson Education Inc., New Jersey.
Lanza C.M., Russo C. and Tomaselli F. (1998). Relationship between geographical origin and fatty acid composition of extra-virgin olive oils produced in three areas of eastern sicily. Ital. J. Food Sci. 10: 359-366.
Lanzetta R. (2002). “La spettroscopia di Risonanza Magnetica Nucleare” in La chimica organica in laboratorio. Piccin Editore, pp. 246-283.
López-Feria S., Cárdenas S., García-Mesa J.A., Valcárcel M. (2007). Usefulness of the direct coupling headspace–mass spectrometry for sensory quality characterization of virgin olive oil samples. An. Chim. Acta 583: 411–417.

BIBLIOGRAPHY
98
Lopez-Varela S., Sánchez-Muniz F.J. and Cuesta C. (1995). Decreased food efficiency ratio, growth retardation and changes in liver fatty acid composition in rats consuming thermally oxidized and polimerized sunflower oil used for frying. Fd. Chem. Toxic., 33: 181-189.
Lie Ken M.S.F. Jie and Mustafa J. (1997). High-Resolution Nuclear Magnetic Resonance Spectroscopy. Applications to Fatty Acids and Triacylglycerols. Lipids, 32, 1019-1034.
Lie Ken Jie M.S.F., Pasha M.K., and Alam M.S. (1997). Synthesis and Nuclear Magnetic Resonance Properties of All Geometrical Isomers of Conjugated Linoleic Acids. Lipids, 32: 1041-1044.
Mannina, L., Luchinat, C., Emanuele, M.C., and Segre, A. (1999). Acyl positional distribution of glycerol tri-esters in vegetable oils: a 13C NMR study. Chem. Phys. Lipids, 103: 47-55.
Mannina L., Luchinat C., Patumi M., Emanuele M.C., Rossi E. and Segre A. (2000). Concentration dependence of 13C NMR spectra of triglycerides: implications for the NMR analysis of olive oils. Magn. Reson. Chem., 38: 886-890.
Mannina L., Patumi M., Proietti N., Bassi D. and Segre A.L. (2001a). Geographical Characterization of Italian Extra Virgin Olive Oils Using High-Field 1H NMR Spectroscopy. J. Agr. Food Chem. 49, 2687-2696.
Mannina L., Fontanazza G., Patumi M., Ansanelli G. and Segre A.L. (2001b). Italian and Argentine olive oils: a NMR and gas chromatographic study. Grasas y Aceites, 52: 380-388.
Mannina, L. and Segre, A. (2002) High resolution nuclear magnetic resonance: from chemical structure to foodauthenticity. Grasas y Aceites, 53: 22-33.
Mannina L, Calcagni C, Rossi E, Segre A (2003a) Review about olive oil characterization using high-field nuclear magnetic resonance. Annali di Chimica by Società Chimica Italiana 93: 97-103
Mannina L., Sobolev A. and Segre A. (2003b). Olive oil as seen by NMR and chemometrics. Spectroscopy Europe 15: 6-14
Mannina L, D’Imperio M., Lava R., Schievano E. and Mammi S. (2005). Caratterizzazione NMR e analisi statistica di oli di oliva DOP veneti. Riv. Ital. Sostanze
Grasse. 82, 59-63.
Marini F., Balestrieri F., Bucci R., Magrì A.D., Magrì A.L., Marini D. (2004). Supervised pattern recognition to authenticate Italian extra virgin olive oil varieties. Chemometrics and
Intelligent Laboratory Systems. 73, 85– 93
Márquez-Ruiz G., Tasioula-Margari M., Dobarganes M.C. (1995). Quantitation and distribution of altered fatty acids in frying fats. J. Am. Oil Chem. Soc. 72, 1171-1176.
Marquez-Ruiz G., Dobarganes M.C. (1996). Short-chain fatty acid formation during thermoxidation and frying. J. Sci. Food Agric., 70: 120–126.
Medina I., Sacchi R. (1994). Acyl stereospecific analysis of tuna phospholipids via high resolution 13C-NMR spectroscopy. Chem. Phys. Lipids, 70: 53-61.
Montedoro, G.F.; Servili, M. (1992). I parametri di qualita` dell’olio di oliva ed i fattori agronomici e tecnologici che li condizionano. Riv. Ital. Sostanze Grasse. 69, 563-568.

BIBLIOGRAPHY
99
Montedoro G.F., Servili M., Baldioli M., Selvaggini R., Miniati E., Macchioni A. (1993). Simple and hydrolyzable phenolic compounds in olive oil. 3. Spectroscopic characterizations of the secoiridoid derivatives. J. Agric. Food Chem. 41: 2228-2234.
Molkentin J. and Precht D. (1997). Representative determination of the butyric acid content in European milk fats. Milchwissenschaft, 52: 82-85.
Molkentin J. and Precht D. (1998). Comparison of gas chromatographic methods for analysis of butyric acid in milk fat and fats containing milk fat. Z Lebensm Unters Forsch A , 206: 213-216
Molkentin J. and Precht D. (2000). Validation of a gas-chromatographic method for the determination of milk fat contents in mixed fats by butyric acid analysis. Eur. J. Lipid Sci.
Technol., 194–201.
Muuse, B. and Martens, R. (1993). Mixtures of milk fat with non-milk fat - Determination of the milk fat content. Bulletin of the IDF, 285: 65-69
Neff W.E., Frankel E.N., Fujimoto K. (1988). Autoxidative dimerization of methyl linolenate and its monohydroperoxides, hydroperoxy epidioxides and dihydroperoxides. J.
Am. Oil Chem. Soc. 65: 616-623.
Ng S (1983). High resolution 13C NMR spectra of the carbonyl carbons of the triglycerides of palm oil. J. Chem. Soc. Chem. Commun. 179.
Ng, S., & Ng, W.L. (1983). 13C NMR spectroscopic analysis of the fatty acid composition of palm oil. J. Am. Oil Chem. Soc. 60: 1266-1268.
Ng S (1985). Analysis of positional distribution of fatty acids in palm oil by 13C-NMR spectroscopy. Lipids 20: 778.
Ng S (2000). Quantitative Analysis of Partial Acylglycerols and Free Fatty Acids in Palm Oil by 13C Nuclear Magnetic Resonance Spectroscopy. J. Am. Oil Chem. Soc., 77: 749-755
Ögütçü M., Mendes M. ¸ Yilmaz E. (2008). Sensorial and Physico-Chemical Characterization of Virgin Olive Oils Produced in Çanakkale. J Am Oil Chem Soc., 85:441–456.
Petrakis P.V., Agiomyrgianaki A., Christophoridou S., Spyros A. and Dais P. (2008). Geographical Characterization of Greek Virgin Olive Oils (Cv. Koroneiki) Using 1H and 31P NMR Fingerprinting with Canonical Discriminant Analysis and Classification Binary Trees. J. Agric. Food Chem., 56: 3200-3207.
Pfeffer P.E., Luddy F.E. and Unruh J. (1977a). Analytical 13C-NMR: A rapid, nondestructive method for determining the cis, trans composition of catalytically treated unsaturated lipid mixtures. J. Am. Oil Chem. Soc. 54:380.
Pfeffer, P.E., Sampugna, J., Schwartz, D. P., & Shoolery, J. N. (1977b). Analytical 13C NMR: detection, quantitation, and positional analysis of butyrate in butter oil. Lipids, 12: 869-871.
Pocklington W. D. and Hautfenne A. (1986). Determination of butyric acid in fats containing butterfat. Results of a collaborative study and the standardised method. Pure &
AppL Chem., 58: 1419-1428.

BIBLIOGRAPHY
100
Reid L.M., O’Donnell C.P. and Downey G. (2006). Recent technological advances for the determination of food authenticity. Trends in Food Sci. & Tech. 17: 344–353.
Rezzi S., Axelson D.E., Héberger K., Reniero F., Mariani C., Guillou C. (2005). Classification of olive oils using high throughput flow 1H NMR fingerprinting with principal component analysis, linear discriminant analysis and probabilistic neural networks. Ana.
Chim. Acta, 552: 13-24.
Sacchi R., Addeo F., Giudicianni I., Paolillo L. (1989). La spettroscopia di risonanza magnetica nucleare nell'analisi degli oli di oliva. Riv. Ital. Sost. Grasse, 56: 171-178.
Sacchi R., Addeo F., Giudicianni I., Paolillo L. (1990). Applicazione della spettroscopia 13C-NMR alla determinazione di mono-digliceridi ed acidi grassi liberi nell'olio di oliva di pressione e nei rettificati. Riv. It. Sost. Grasse, 57: 245-252.
Sacchi R., Paolillo L., Giudicianni I., Addeo F. (1991). Rapid 1H-NMR determination of 1,2 and 1,3 diglycerides in virgin olive oils. Italian Journal of Food Science 3 (4), 253-262.
Sacchi R., Addeo F, Giudicianni I and Paolillo L. (1992). Analysis of the positional distribution of fatty acids in olive oil triacylglycerols by high resolution 13C-NMR of the carbonyl region. Ital. J. Food Sci. 4: 117-123.
Sacchi R., Medina I., Aubourg S.P., Addeo F., Paolillo L. (1993a). Proton nuclear magnetic resonance rapid and structurespecific determination of -3 polyunsaturated fatty acids in fish lipids. J. Am Oil Chem Soc., 70: 225-228.
Sacchi R, Medina I, Aubourg S, Addeo F, Giudicianni I and Paolillo L. (1993b). Quantitative high resolution 13C-NMR analysis of lipids extracted from the white muscle of Atlantic tuna. J. Agr. Food Chem. 41: 1247-1251.
Sacchi R, Medina I, Aubourg S, Paolillo L. Addeo F (1994). High-resolution 13C-NMR olefinic spectra of DHA and EPA acids, methyl esters and triacylglycerols. Chem. Phys.
Lipids, 69: 65-73.
Sacchi R, Addeo F, Spagna Musso S, Paolillo L and Giudicianni I (1995). High resolution 13C-NMR study of vegetable margarines. Italian J. of Food Sci. 7: 27-36.
Sacchi R, Patumi M, Fontanazza G, Barone P, Fiordiponti P, Mannina L, Rossi E and Segre AL (1996). A high field 1H-Nuclear Magnetic Resonance study of the minor components in virgin olive oils. J. Am. Oil Chem. Soc., 73: 747-758.
Sacchi R, Addeo F, Paolillo L (1997). 1H and 13C-NMR of virgin olive oil. An Overview. Magn. Res. Chem., 35: 133-145
Sacchi R, Mannina L, Fiordiponti P. Barone P. Paolillo L. Patumi M and Segre AL (1998). Characterization of Italian Extra Virgin Olive Oils using 1H-NMR spectroscopy. J.
Agr. Food Chem. 46: 3947-3951.
Sacchi R., Paduano A., Fiore F., Della Medaglia D., Ambrosino Ml., Medina I. (2002). Partition behavior of virgin olive oil phenolic compounds in oil-brine mixtures during thermal processing for fish canning. J. Agric. Food Chem. 50: 2830-2835.
Sacchi R., Falcigno L., Paduano A., Ambrosino M.L., Savarese M., De Giulio B., Addeo F. and Paolillo L. (2006a). Quantitative evaluation of the aldehydes formed in heated

BIBLIOGRAPHY
101
vegetable oils using high resolution proton-NMR spectroscopy. Riv. Ital. Sost. Grasse. 83: 257-263.
Sacchi R, Savarese M, Falcigno L, Giudicianni I, Paolillo L. (2006b). Proton NMR of fish oils and lipids. In Handbook of Modern magnetic Resonance, marine Science, Volume II. Edited by G.H. Webb, Kluwer Academic Publishers (UK).
Sacchi R. and Paolillo L. (2007). NMR for food quality and Traceability. In Advances in Food Diagnostics, Edited by Leo M.L. Nollet and Fidel Toldrá, Blackwell Publishing. 1st edition, pp 101-118.
Sacco A., Brescia M.A., Liuzzi V., Reniero F., Guillou C., Ghelli S., van der Meer P (2000). Characterization of Italian olive oils based on analytical and nuclear magnetic resonance determinations. J. Am. Oil Chem. Soc. 77: 619-625.
Scano P., Rosa A., Marincola F.C., Locci E., Melis M.P., Dessì M.A., Lai A. (2008). 13C NMR, GC and HPLC characterization of lipid components of the salted and dried mullet (Mugil cephalus) roe “bottarga”. Chem. Phys. Lipids, 151: 69-76.
Scarpa P., Ambrosino M.L., Paduano, Della Medaglia D., Amato S., Sacchi R. (2005). Contributo della composizione in acidi grassi alla determinazione dell’origine geografica degli oli extravergini di oliva DOP italiani. Annali della Facoltà di Agraria della Università
di Napoli Federico II, Serie quinta, 1: 115-125.
Selke E., Rohwedder W. K. and Dutton H. J. (1977). Volatile components from triolein heated in air. J. Am. Oil Chem. Soc. 54:62.
Selke E., Rohwedder W. K. and Dutton H. J. (1980). Volatile components from trilinolein in air. J. Am. Oil Chem. Soc. 57:25.
Shoolery J.N. (1977). Some quantitative applications of 13C NMR spectroscopy. Progress
NMR Spec., 11:79-93.
Silwood C.J.L. and Grootveld M. (1999). Application of High-Resolution, Two-Dimensional 1H and 13C Nuclear Magnetic Resonance Techniques to the Characterization of Lipid Oxidation Products in Autoxidized Linoleoyl/Linolenoylglycerols. Lipids, 34: 741-756.
Simova S., Ivanova G., Spassov S.L. (2003). Alternative NMR method for quantitative determination of acyl positional distribution in triacylglycerols and related compounds. Chem. Phys. Lipids, 126: 167-176.
Sobolev A.P., Segre AL and Lamanna R. (2003). Proton high-field NMR study of tomato juice. Magn. Reson. Chem. 41: 237–245
Solinas, M. (1987). HRGC analysis of virgin olive oil phenolic compounds in relation to olive ripening degree and variety. Riv. Ital. Sostanze Grasse. 64: 255-262.
Solinas M.; Marsilio V.; Angerosa F. (1987). Behaviour of some components of virgin olive oil flavour in relation to olive ripening. Riv. Ital. Sostanze Grasse. 64: 475-480.
Solinas M., Angerosa F., Camera L. (1988). Evoluzione ossidativa di oli vegetali durante la frittura: determinazione dei componenti volatili mediante HRGC e HPLC. Riv. Ital.
Sostanze Grasse. 65: 567-574.

BIBLIOGRAPHY
102
Spitzer V. (1999). Reviews. Screening analysis of unknown seed oils. Fett/Lipid, 101: 2-19.
Tapp H.S., Defernez M. and Kemsley E.K. (2003). FTIR Spectroscopy and Multivariate Analysis Can Distinguish the Geographic Origin of Extra Virgin Olive Oils. J. Agric. Food
Chem., 51: 6110-6115.
Tonolo G., Marzo S. (1989). Determinazione della vitamina E aggiunta e dei tocoferoli naturali negli oli di semi dietetici via HPLC. Riv. Ital. Sostanze Grasse 66: 3-6
Tsimidou, M.; Macrae, R.; Wilson, I. (1987). Authentication of virgin olive oils using principal components analysis of triglyceride and fatty acid profiles: part 1. Classification of Greek olive oils. Food Chem., 25, 227-239.
Tsimidou M., Papadopulos G., Bosku D. (1992). Determination of phenolic compounds in virgin olive oil by reversed-phase HPLC with emphasis on UV detection. Food. Chem. 44: 53-60.
Tyl C.E., Brecker L., Wagner K.-H. (2008). Research Paper. 1H NMR spectroscopy as tool to follow changes in the fatty acids of fish oils. Eur. J. Lipid Sci. Technol., 110: 141-148.
Ulberth F. (1995). Quantitation of foreign fat in foreign fat/milkfat mixtures by multivariate regression analysis of fatty acis data. J. Agric. Food Chem. 43: 1556-1560.
Ulberth F. (1998). A rapid headspace gas chromatographic method for the determination of the butyric acid content in edible fats. Z Lebensm Unters Forsch A, 206: 305-307.
Van Calsteren, M.R., Barr C., Angers P. and Arul J. (1996). 13C NMR of triglycerydes. Bull. Magn. Reson. 18:175-177.
Vatèle J.-M., Fenet B., Eynard T. (1998). Complete 13C assignments and structural elucidation of n-3 polyunsaturated fatty acids by the use of a new 2D NMR technique: SAPHIR-HSQC. Chem. Phys. Lipids, 94: 239-250.
Veazey R.L. (1986). Rapid analysis of dimer acid by HPLC/FID. J. Am. Oil Chem. Soc. 63: 1043-1046.
Vichi S., Pizzale L., Conte L.S., Buxaderas S. and López-Tamames E. (2003). Solid-Phase Microextraction in the Analysis of Virgin Olive Oil Volatile Fraction: Characterization of Virgin Olive Oils from wo Distinct Geographical Areas of Northern Italy. J. Agric. Food Chem., 51: 6572-6577
Vlahov G. (1999). Application of NMR to the study of olive oils. Progr. Nuclear Magn.
Res. Spectr., 35:341–357.
Vlahov, G., Shaw, A.D., and Kell, D.B. (1999). Use of 13C nuclear magnetic resonance distortionless enhancement by polatization tranfer pulse sequence and multivariate analysis to discriminate olive oil cultivars. J. Am. Oil Chem. Soc., 76: 1223-1231.
Vlahov G, Schiavone C and Simone N (2001). Quantitative 13CNMR method using the DEPT pulse sequence for the determination of the geographical origin (DOP) of olive oils. Magn. Reson. Chem. 39: 689–695.

BIBLIOGRAPHY
103
Vlahov G. (2006). Determination of the 1,3- and 2-positioinal distribution of fatty acids in olive oil triacylglycerols by 13C Nuclear Magnetic Resonances Spectroscopy. J. AOAC
Int., 89: 1071-1076.
Walking Al., Wessels M. (1981). Chromatografic separation of polar and non-polar components of frying fats. J. Assoc. Off. Anal. Chem., 62: 1329-1330.
Warner K. (2002). Chemistry of Frying Oils. In: Food Lipids - Chemistry, Nutrition, and Biotechnology. Press by Marcel Dekker, Inc., New York (US).
White P.J., Wang Y. (1986). A high performance size-exclusion chromatographic method for evaluating heated oils. J. Am. Oil Chem. Soc. 63: 914-920.
Wollenberg K.F. (1990). Quantitative high resolution 13C nuclear magnetic resonance of the olefinic and carbonyl carbons of edible vegetable oils. J. Am. Oil Chem. Soc. 67: 487-494.
Zhanga G., Nia Y., Churchillc J. and Kokotc S. (2006) Authentication of vegetable oils on the basis of their physico-chemical properties with the aid of chemometrics. Talanta, 70: 293-300.


![UNIVERSITA’ DI NAPOLI FEDERICO II - fedOA - fedOA Monica.pdf · 2014-03-28 · cholesterol [1,2]. Inherited defects in this enzyme reduce or abolish the transformation of 7-DHC](https://img.pdfslide.us/doc/110x75/5e5c41b805db18095d781df1/universitaa-di-napoli-federico-ii-fedoa-monicapdf-2014-03-28-cholesterol.jpg)