Embed Size (px)
Citation preview
0
Appendix to a report by Genesis Analytics in partnership with the Gordon Institute of Business Science and the Pathways for Prosperity Commission on Technology and Inclusive Development
Digital readiness assessment appendix DETAILED MEASUREMENT OF SOUTH AFRICA’S READINESS TO TAKE UP ECONOMIC OPPORTUNITIES IN THE DIGITAL AGE
SOUTH AFRICA in
th
e DIGITAL
AGE
Table of Contents
Table of Contents ...................................................................................................................... 1
Universal Digital Access ............................................................................................................ 1
An overview of internet usage ............................................................................................... 1
Infrastructure ......................................................................................................................... 2
Electricity coverage ............................................................................................................ 3
Undersea cables ................................................................................................................. 4
Fixed line coverage and quality ......................................................................................... 5
Mobile network coverage and quality ............................................................................... 7
Affordability ............................................................................................................................ 8
Data .................................................................................................................................... 8
Devices ............................................................................................................................. 10
Telecommunications regulation........................................................................................... 12
Human Capital ......................................................................................................................... 14
Raw talent supply for emerging jobs.................................................................................... 15
Basic and secondary schooling ............................................................................................. 16
Access to educational pathways .......................................................................................... 18
Providers of educational pathways ...................................................................................... 19
Higher Education Institutions .......................................................................................... 20
Technical and Vocational Education and Training ........................................................... 21
Accreditation of educational pathways qualifications ......................................................... 21
Business involvement in educational pathways .................................................................. 23
Retaining and Attracting Critical Skills.................................................................................. 24
Government Support .............................................................................................................. 27
Government as the foundation of the digital economy ...................................................... 28
Intellectual Property Regulation ...................................................................................... 28
Data and Cyber-Security Regulation ................................................................................ 29
Taxation Policy and Digital Business ................................................................................ 31
Government as a purchaser of business services ................................................................ 32
Government as an enabler ................................................................................................... 34
Financial and non-financial incentives ............................................................................. 34
Local government engagement with business ................................................................ 37
Government as a regulator .................................................................................................. 38
Sector-specific regulation ................................................................................................ 38
Labour regulation in the digital age ................................................................................. 40
Competition Policy in the Digital Age .............................................................................. 42
Innovative Business ................................................................................................................. 45
Innovation Financing ............................................................................................................ 46
Start-up and Early Stage Finance ..................................................................................... 46
Established Firm Finance ................................................................................................. 48
R&D Investment ............................................................................................................... 49
Non-financial Investment Support ....................................................................................... 50
Start-up ecosystem .......................................................................................................... 50
Open Architecture............................................................................................................ 52
Innovation Culture................................................................................................................ 53
Entrepreneurship ............................................................................................................. 53
Corporate Innovation ....................................................................................................... 54
Access to and adoption of digital technologies ................................................................... 57
Constructing Ecosystems......................................................................................................... 59
Business-to-business co-ordination ..................................................................................... 59
Public private solutioning ..................................................................................................... 60
Ecosystem stewardship ........................................................................................................ 62
Access to global markets ...................................................................................................... 64
Alternative Opportunities ....................................................................................................... 67
1
Universal Digital Access
Digital infrastructure, networks and universal access to the internet are foundational
requirements for a digitally enabled economy as they allow businesses and individuals to
participate in emerging economic opportunities. This access is predicated on the availab ility
of infrastructure, the quality of internet connections, well-functioning telco regulation and
the affordability of data and devices. These are the conditions measured in this pillar with a
snap-shot of internet usage preceding the condition measurement.
An overview of internet usage
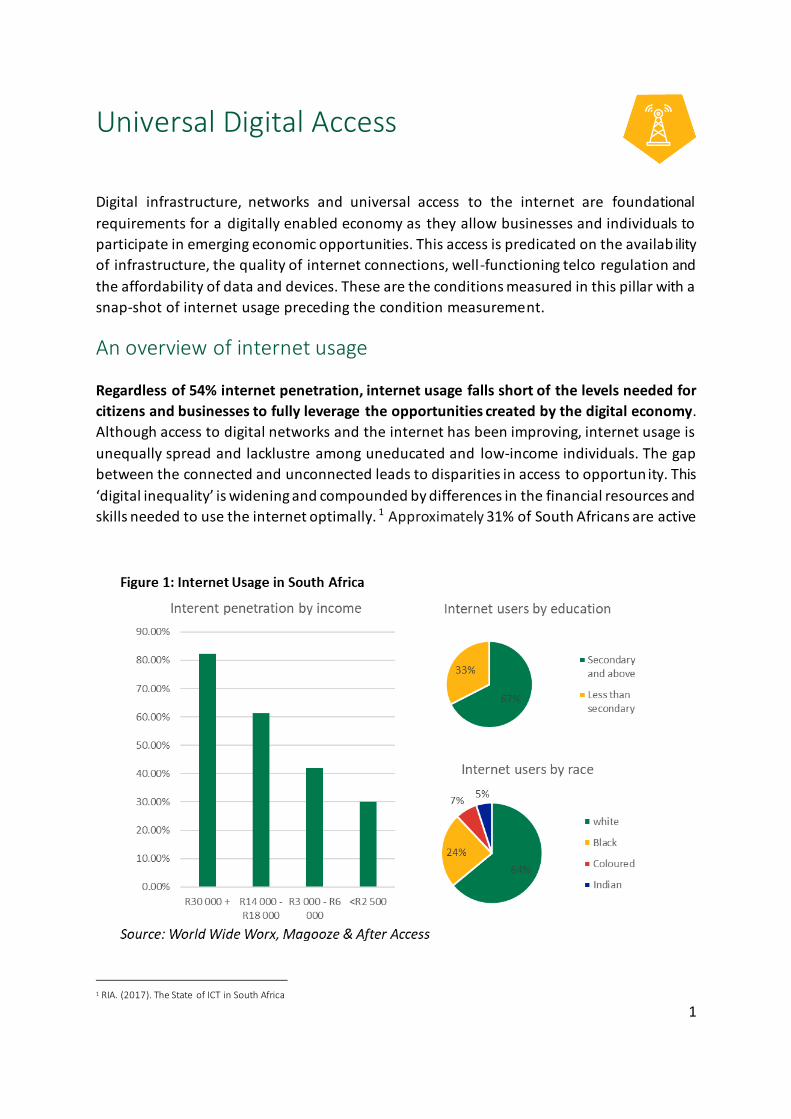
Regardless of 54% internet penetration, internet usage falls short of the levels needed for
citizens and businesses to fully leverage the opportunities created by the digital economy.
Although access to digital networks and the internet has been improving, internet usage is
unequally spread and lacklustre among uneducated and low-income individuals. The gap
between the connected and unconnected leads to disparities in access to opportun ity. This
‘digital inequality’ is widening and compounded by differences in the financial resources and
skills needed to use the internet optimally. 1 Approximately 31% of South Africans are active
1 RIA. (2017). The State of ICT in South Africa
2
internet users and 30% active mobile internet users. Figure 1 illustrates how access varies by
race, income and education.
The distribution of internet usage by race is severely skewed due to differences in earnings
between racial groups. On average the white population have high levels of access at 64%,
with far inferior levels of access for the black, coloured and Indian populations at 24%, 7%
and 5% respectively2. These figures are worrying given the socio-economic context of South
Africa - only 7.8% of the population are white while 80.9% are black3. On average, this white
minority earns nearly 5 times as much as the black population. These results correlate with
lower levels of internet penetration at lower levels of income, leading to the majority of those
excluded from the internet being low-income earners.4
A geographic view shows that a digital divide exists between major metros and non-metro
areas and between different cities and provinces. Internet penetration in the Western Cape
is at 75%, followed by Gauteng at 55%5. Internet usage in urban areas exceeds rural usage by
a relatively small gap of 8%6 which evidences the role access to mobile technologies have in
servicing non-urban communities. This has allowed rural communities to access services that
were previously inaccessible by overcoming the limitations of the fixed-line market which
faces high installation costs in rural areas where communities are dispersed or have low
density populations.
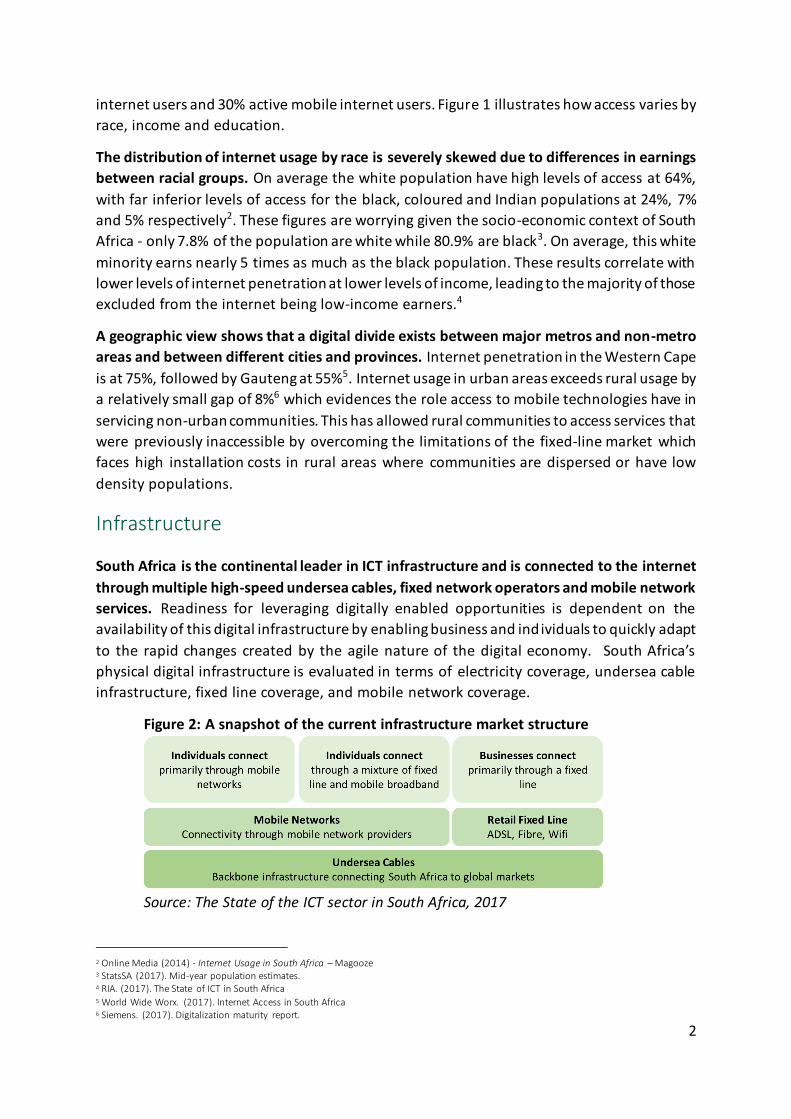
Infrastructure
South Africa is the continental leader in ICT infrastructure and is connected to the internet
through multiple high-speed undersea cables, fixed network operators and mobile network
services. Readiness for leveraging digitally enabled opportunities is dependent on the
availability of this digital infrastructure by enabling business and individuals to quickly adapt
to the rapid changes created by the agile nature of the digital economy. South Africa’s
physical digital infrastructure is evaluated in terms of electricity coverage, undersea cable
infrastructure, fixed line coverage, and mobile network coverage.
Figure 2: A snapshot of the current infrastructure market structure
Source: The State of the ICT sector in South Africa, 2017
2 Online Media (2014) - Internet Usage in South Africa – Magooze 3 StatsSA (2017). Mid-year population estimates. 4 RIA. (2017). The State of ICT in South Africa 5 World Wide Worx. (2017). Internet Access in South Africa 6 Siemens. (2017). Digitalization maturity report.
3
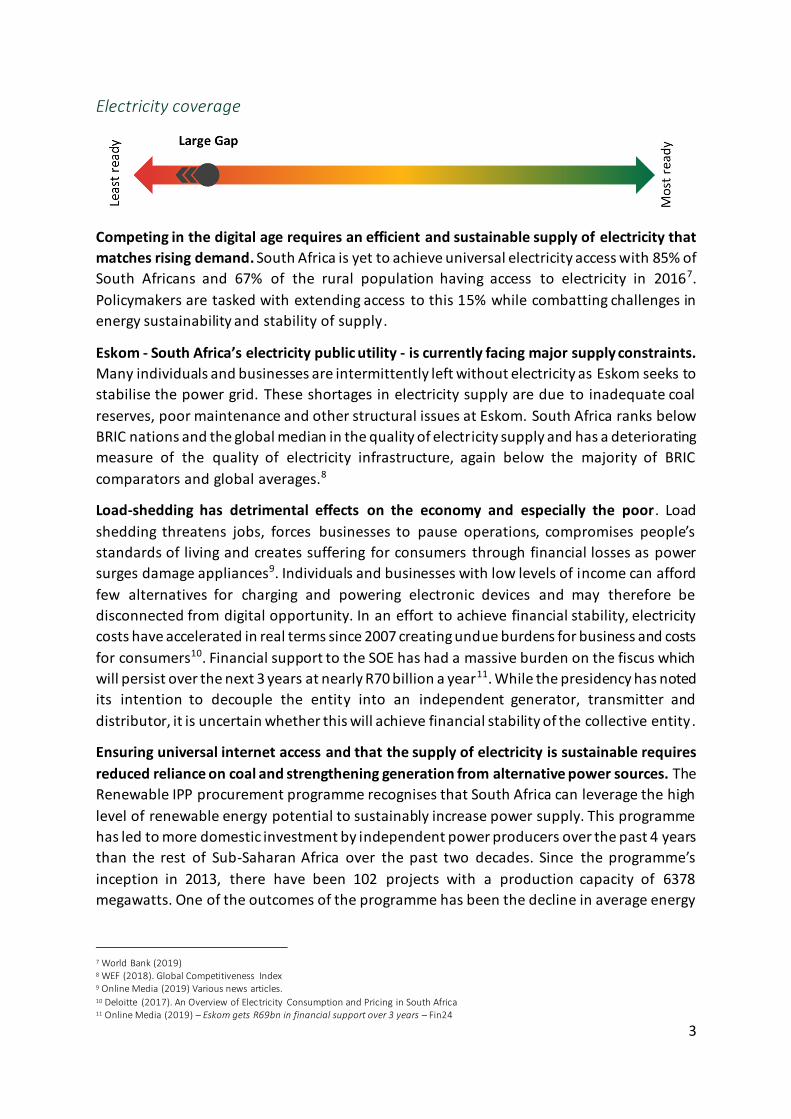
Electricity coverage
Competing in the digital age requires an efficient and sustainable supply of electricity that
matches rising demand. South Africa is yet to achieve universal electricity access with 85% of
South Africans and 67% of the rural population having access to electricity in 20167.
Policymakers are tasked with extending access to this 15% while combatting challenges in
energy sustainability and stability of supply .
Eskom - South Africa’s electricity public utility - is currently facing major supply constraints.
Many individuals and businesses are intermittently left without electricity as Eskom seeks to
stabilise the power grid. These shortages in electricity supply are due to inadequate coal
reserves, poor maintenance and other structural issues at Eskom. South Africa ranks below
BRIC nations and the global median in the quality of electricity supply and has a deteriorating
measure of the quality of electricity infrastructure, again below the majority of BRIC
comparators and global averages.8
Load-shedding has detrimental effects on the economy and especially the poor. Load
shedding threatens jobs, forces businesses to pause operations, compromises people’s
standards of living and creates suffering for consumers through financial losses as power
surges damage appliances9. Individuals and businesses with low levels of income can afford
few alternatives for charging and powering electronic devices and may therefore be
disconnected from digital opportunity. In an effort to achieve financial stability, electricity
costs have accelerated in real terms since 2007 creating undue burdens for business and costs
for consumers10. Financial support to the SOE has had a massive burden on the fiscus which
will persist over the next 3 years at nearly R70 billion a year11. While the presidency has noted
its intention to decouple the entity into an independent generator, transmitter and
distributor, it is uncertain whether this will achieve financial stability of the collective entity.
Ensuring universal internet access and that the supply of electricity is sustainable requires
reduced reliance on coal and strengthening generation from alternative power sources. The
Renewable IPP procurement programme recognises that South Africa can leverage the high
level of renewable energy potential to sustainably increase power supply. This programme
has led to more domestic investment by independent power producers over the past 4 years
than the rest of Sub-Saharan Africa over the past two decades. Since the programme’s
inception in 2013, there have been 102 projects with a production capacity of 6378
megawatts. One of the outcomes of the programme has been the decline in average energy
7 World Bank (2019) 8 WEF (2018). Global Competitiveness Index 9 Online Media (2019) Various news articles. 10 Deloitte (2017). An Overview of Electricity Consumption and Pricing in South Africa 11 Online Media (2019) – Eskom gets R69bn in financial support over 3 years – Fin24
4
prices.12 The programme was however put on pause for almost 3 years because of political
volatility. However, in April 2018 the programme resumed, with Eskom entering into an
agreement for 27 large-scale renewable energy projects. Investors will be looking for policy
certainty in the new integrated resources plan and signals that programmes such as the IPP
will not be subject to the same levels of political volatility as before.13
Undersea cables
With an international internet bandwidth of 149.5Kb/s per user, South Africa is ranked 18
of 139 countries and well placed to compete in the global digital market. Undersea cables
are required to support South Africa’s increasing demand for broadband as they transport
98% of global data14. Six undersea cables connect South Africa to the rest of the world.
Investment in new cable infrastructure has significantly reduced the price of international
bandwidth while a forthcoming undersea cable connecting South Africa to Brazil is expected
to decrease South Africa’s latency by up to 140 milliseconds15.
High speed internet is a comparative advantage that improves the speed and quality of
internet access for all. While this may not be directly relevant for everyday users it will benefit
individuals accessing markets that require an individual or a business to do real time, high
frequency operations such as trading.
12 Eberhard & Naude (2017). The South African Renewable energy IPP procurement programme 13 Online Media (2019) - IPP procurement programmes a powerful tool and investor confidence cannot be understated - Business Day 14 Online Media (2018) - New Cape Town/Brazil subsea cable to boost SA broadband - BIZCommunity 15 Online Media (2018) - Boosting SA broadband : New subsea cable will connect Cape Town to Brazil - BizNews
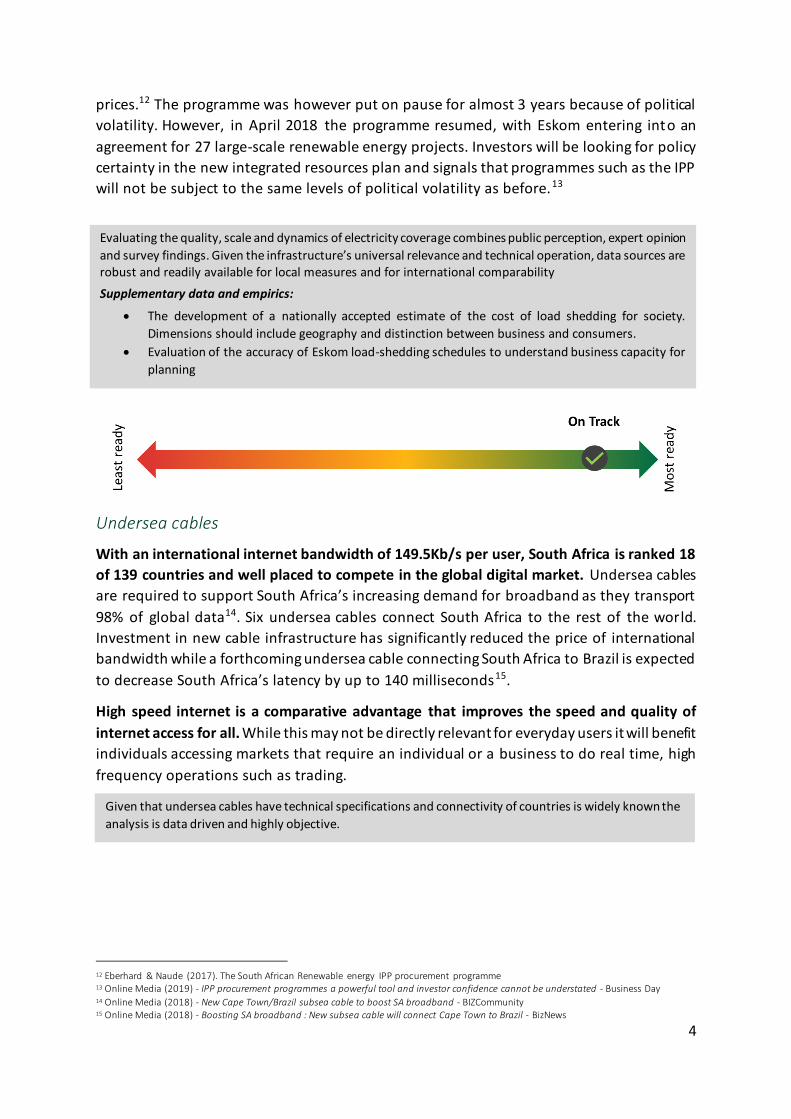
Evaluating the quality, scale and dynamics of electricity coverage combines public perception, expert opinion
and survey findings. Given the infrastructure’s universal relevance and technical operation, data sources are robust and readily available for local measures and for international comparability
Supplementary data and empirics:
The development of a nationally accepted estimate of the cost of load shedding for society.
Dimensions should include geography and distinction between business and consumers.
Evaluation of the accuracy of Eskom load-shedding schedules to understand business capacity for
planning
Given that undersea cables have technical specifications and connectivity of countries is widely known the
analysis is data driven and highly objective.
5
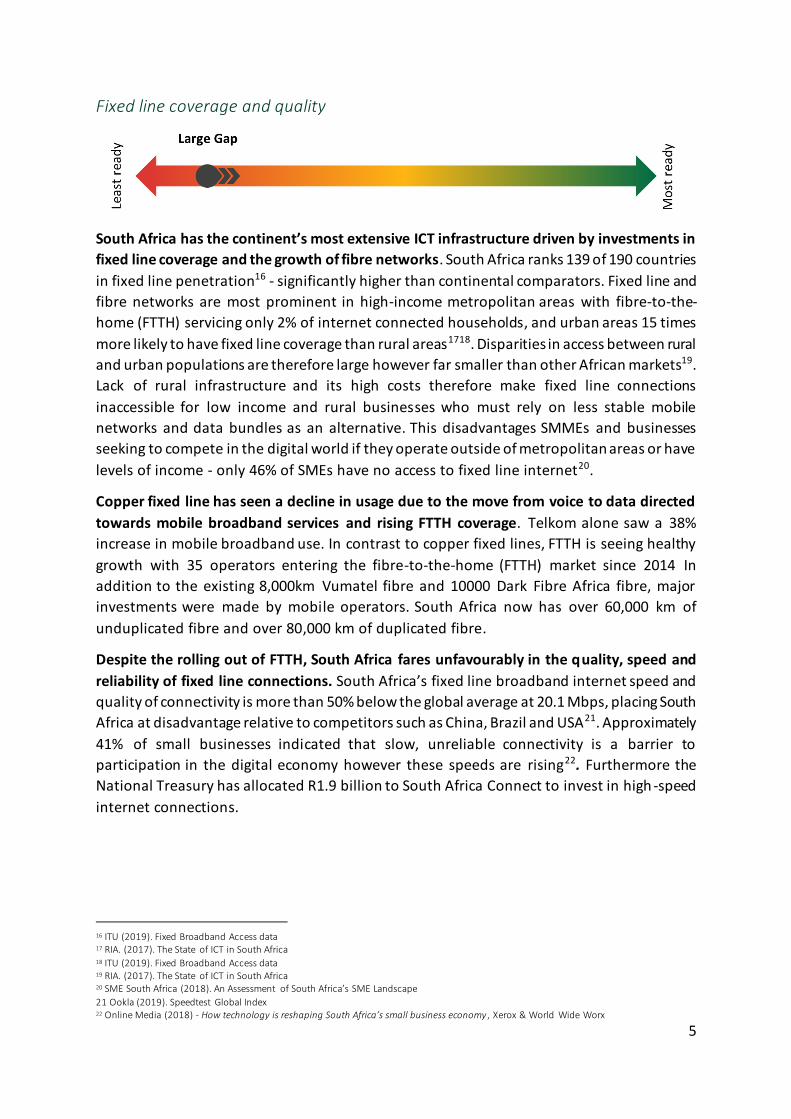
Fixed line coverage and quality
South Africa has the continent’s most extensive ICT infrastructure driven by investments in
fixed line coverage and the growth of fibre networks. South Africa ranks 139 of 190 countries
in fixed line penetration16 - significantly higher than continental comparators. Fixed line and
fibre networks are most prominent in high-income metropolitan areas with fibre-to-the-
home (FTTH) servicing only 2% of internet connected households, and urban areas 15 times
more likely to have fixed line coverage than rural areas1718. Disparities in access between rural
and urban populations are therefore large however far smaller than other African markets19.
Lack of rural infrastructure and its high costs therefore make fixed line connections
inaccessible for low income and rural businesses who must rely on less stable mobile
networks and data bundles as an alternative. This disadvantages SMMEs and businesses
seeking to compete in the digital world if they operate outside of metropolitan areas or have
levels of income - only 46% of SMEs have no access to fixed line internet20.
Copper fixed line has seen a decline in usage due to the move from voice to data directed
towards mobile broadband services and rising FTTH coverage. Telkom alone saw a 38%
increase in mobile broadband use. In contrast to copper fixed lines, FTTH is seeing healthy
growth with 35 operators entering the fibre-to-the-home (FTTH) market since 2014 In
addition to the existing 8,000km Vumatel fibre and 10000 Dark Fibre Africa fibre, major
investments were made by mobile operators. South Africa now has over 60,000 km of
unduplicated fibre and over 80,000 km of duplicated fibre.
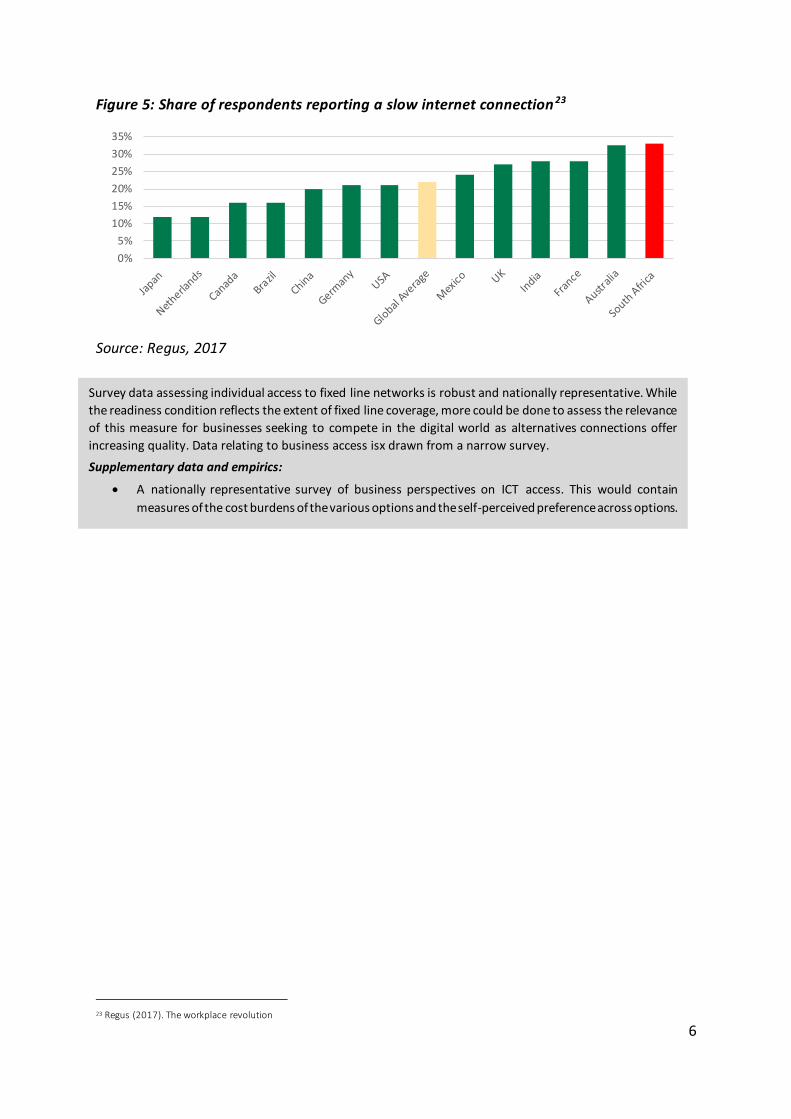
Despite the rolling out of FTTH, South Africa fares unfavourably in the quality, speed and
reliability of fixed line connections. South Africa’s fixed line broadband internet speed and
quality of connectivity is more than 50% below the global average at 20.1 Mbps, placing South
Africa at disadvantage relative to competitors such as China, Brazil and USA21. Approximately
41% of small businesses indicated that slow, unreliable connectivity is a barrier to
participation in the digital economy however these speeds are rising22. Furthermore the
National Treasury has allocated R1.9 billion to South Africa Connect to invest in high -speed
internet connections.
16 ITU (2019). Fixed Broadband Access data 17 RIA. (2017). The State of ICT in South Africa 18 ITU (2019). Fixed Broadband Access data 19 RIA. (2017). The State of ICT in South Africa 20 SME South Africa (2018). An Assessment of South Africa’s SME Landscape
21 Ookla (2019). Speedtest Global Index 22 Online Media (2018) - How technology is reshaping South Africa’s small business economy , Xerox & World Wide Worx
6
Figure 5: Share of respondents reporting a slow internet connection 23
Source: Regus, 2017
23 Regus (2017). The workplace revolution
Survey data assessing individual access to fixed line networks is robust and nationally representative. While
the readiness condition reflects the extent of fixed line coverage, more could be done to assess the relevance
of this measure for businesses seeking to compete in the digital world as alternatives connections offer
increasing quality. Data relating to business access isx drawn from a narrow survey.
Supplementary data and empirics:
A nationally representative survey of business perspectives on ICT access. This would contain
measures of the cost burdens of the various options and the self-perceived preference across options.
0%
5%
10%
15%
20%
25%
30%
35%
7
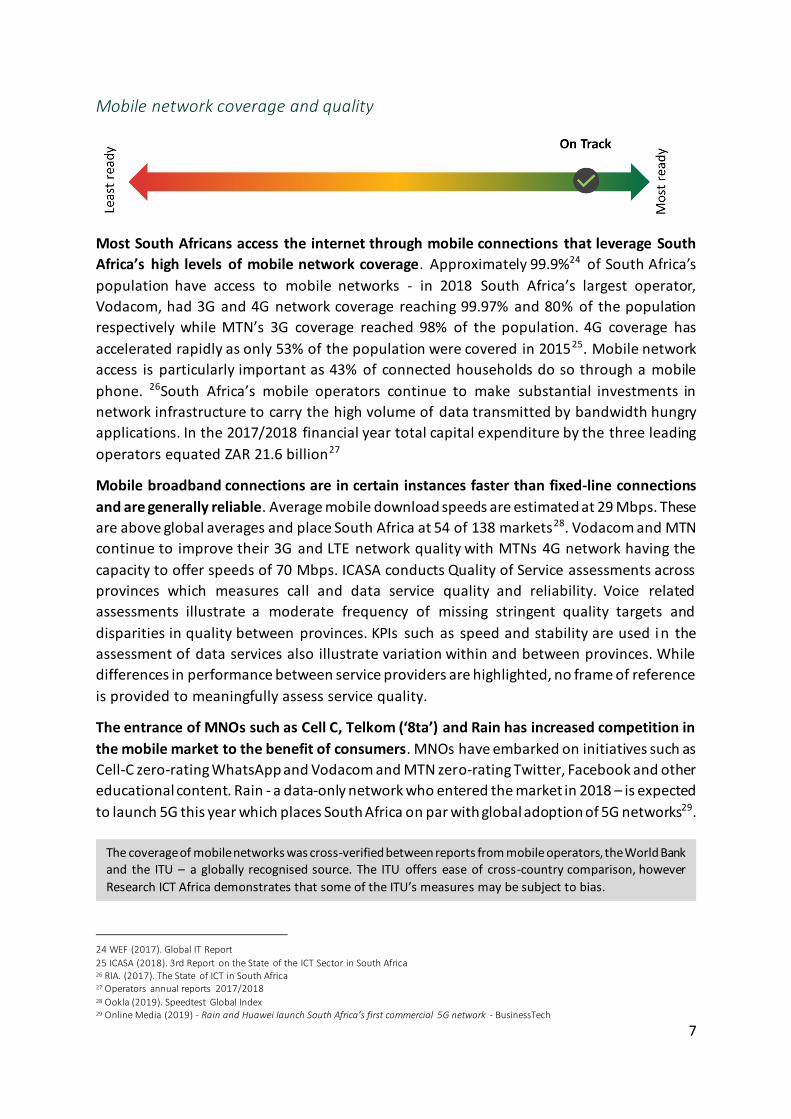
Mobile network coverage and quality
Most South Africans access the internet through mobile connections that leverage South
Africa’s high levels of mobile network coverage. Approximately 99.9%24 of South Africa’s
population have access to mobile networks - in 2018 South Africa’s largest operator,
Vodacom, had 3G and 4G network coverage reaching 99.97% and 80% of the population
respectively while MTN’s 3G coverage reached 98% of the population. 4G coverage has
accelerated rapidly as only 53% of the population were covered in 201525. Mobile network
access is particularly important as 43% of connected households do so through a mobile
phone. 26South Africa’s mobile operators continue to make substantial investments in
network infrastructure to carry the high volume of data transmitted by bandwidth hungry
applications. In the 2017/2018 financial year total capital expenditure by the three leading
operators equated ZAR 21.6 billion27
Mobile broadband connections are in certain instances faster than fixed-line connections
and are generally reliable. Average mobile download speeds are estimated at 29 Mbps. These
are above global averages and place South Africa at 54 of 138 markets28. Vodacom and MTN
continue to improve their 3G and LTE network quality with MTNs 4G network having the
capacity to offer speeds of 70 Mbps. ICASA conducts Quality of Service assessments across
provinces which measures call and data service quality and reliability. Voice related
assessments illustrate a moderate frequency of missing stringent quality targets and
disparities in quality between provinces. KPIs such as speed and stability are used i n the
assessment of data services also illustrate variation within and between provinces. While
differences in performance between service providers are highlighted, no frame of reference
is provided to meaningfully assess service quality.
The entrance of MNOs such as Cell C, Telkom (‘8ta’) and Rain has increased competition in
the mobile market to the benefit of consumers. MNOs have embarked on initiatives such as
Cell-C zero-rating WhatsApp and Vodacom and MTN zero-rating Twitter, Facebook and other
educational content. Rain - a data-only network who entered the market in 2018 – is expected
to launch 5G this year which places South Africa on par with global adoption of 5G networks29.
24 WEF (2017). Global IT Report
25 ICASA (2018). 3rd Report on the State of the ICT Sector in South Africa 26 RIA. (2017). The State of ICT in South Africa 27 Operators annual reports 2017/2018 28 Ookla (2019). Speedtest Global Index 29 Online Media (2019) - Rain and Huawei launch South Africa’s first commercial 5G network - BusinessTech
The coverage of mobile networks was cross-verified between reports from mobile operators, the World Bank and the ITU – a globally recognised source. The ITU offers ease of cross-country comparison, however
Research ICT Africa demonstrates that some of the ITU’s measures may be subject to bias.
8
Affordability
The ability for South Africans to use the internet to access economic opportunities depends
on the affordability of internet-enabled devices and data. South Africa ranks below the
world median and BRICS averages for the affordability of ICT services30 and suffers particularly
in terms of data costs. Given these high costs, lack of momentum and relevance data has in
everyday lives, the readiness gap remains large and static. Market structure, regulation and
policy will be key players in driving cheaper data prices.
Data
Poor price competition among MNOs is driving the high costs of prepaid mobile data
bundles. The cost of data is high relative to continental comparators - the cheapest domestic
1GB of prepaid mobile data bundle costs 600% more than the cheapest 1GB in Egypt and
134% more than BRICS nations.3132 Mobile data costs are a hindering factor for the poor and
average income individuals who are subsequently unable to access the full experience and
benefits of the internet. Approximately 15% of individuals reported that the main reason for
limited use of the internet was the cost of data while others estimate that more than half of
South Africans would need to spend 15% to 40% of their income to buy 1 Gb of data3334. While
data costs fell from 2014 to 2015, this decline halted and continues to remain too high.35
An oligopolistic market which lends to poor pricing competition between mobile operators
contributes to the high data costs. The mobile network’s Herfindahl-Hirschman index - a
measure of market concentration – reflects a concentrated market with Vodacom’s data
revenue share at 40%, followed by MTN at 34% and Cell C at 30%.
30 WEF (2017). Global Information Technology Report 31 RIA. (2017). The State of ICT in South Africa 32 Online Media (2018) - High Data Costs Challenged – Low Income Households Hit the Hardest – CityPress 33 Online Media (2018) - High Data Costs Challenged – Low Income Households Hit the Hardest – CityPress 34 Online Media (2018) - Data Must Fall: Inquiry hears how exclusionary data prices are - IOL 35 RIA. (2017). The State of ICT in South Africa
9
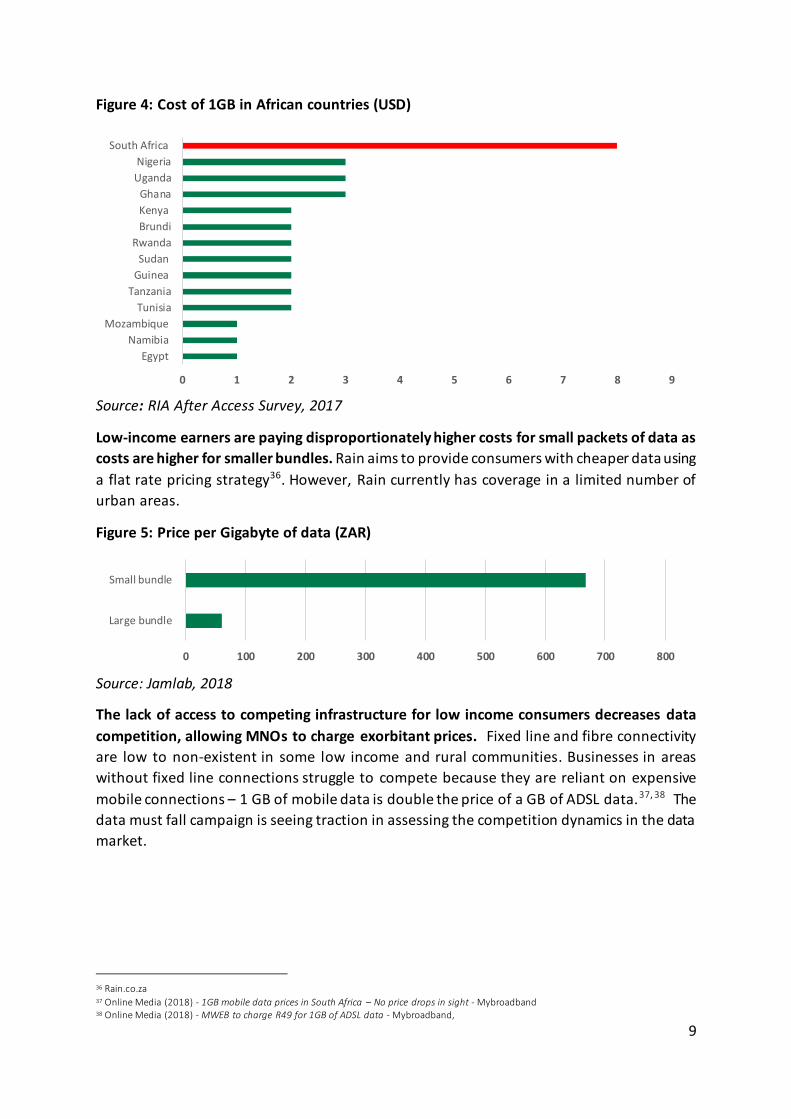
Figure 4: Cost of 1GB in African countries (USD)
Source: RIA After Access Survey, 2017
Low-income earners are paying disproportionately higher costs for small packets of data as
costs are higher for smaller bundles. Rain aims to provide consumers with cheaper data using
a flat rate pricing strategy36. However, Rain currently has coverage in a limited number of
urban areas.
Figure 5: Price per Gigabyte of data (ZAR)
Source: Jamlab, 2018
The lack of access to competing infrastructure for low income consumers decreases data
competition, allowing MNOs to charge exorbitant prices. Fixed line and fibre connectivity
are low to non-existent in some low income and rural communities. Businesses in areas
without fixed line connections struggle to compete because they are reliant on expensive
mobile connections – 1 GB of mobile data is double the price of a GB of ADSL data.37, 38 The
data must fall campaign is seeing traction in assessing the competition dynamics in the data
market.
36 Rain.co.za 37 Online Media (2018) - 1GB mobile data prices in South Africa – No price drops in sight - Mybroadband 38 Online Media (2018) - MWEB to charge R49 for 1GB of ADSL data - Mybroadband,
0 100 200 300 400 500 600 700 800
Large bundle
Small bundle
0 1 2 3 4 5 6 7 8 9
Egypt
Namibia
Mozambique
Tunisia
Tanzania
Guinea
Sudan
Rwanda
Brundi
Kenya
Ghana
Uganda
Nigeria
South Africa
10
Municipalities are providing residents with free, capped WiFi to increase access for
marginalised individuals to affordable and high-quality internet39. South Africa leads the
continent in the provision of free internet access to citizens with more than 2,000 hotspots in
nearly 60 cities40. The City of Tshwane had more than 1 million unique devices using free WiFi
in 776 public hotspots in 2018. The municipality provided residents with 1,500 km of free
broadband fibre capped at 500MB, allowing individuals to use the network for learning,
working and job-hunting. The City of Johannesburg provides free WiFi at over 300 hotspots
capped at 300MB per user with unlimited access to services. The City of Cape Town entitles
user to 250 MB of data and unlimited access to government websites. Residents can buy data
cheaper than through MNOs -R700 MB costs R5, 2GB costs R15 and 7GB costs R45. The City
of Durban provide residents with access to free WiFi with a key focus on providing this service
in townships and rural areas where the majority of access-constrained individuals reside.
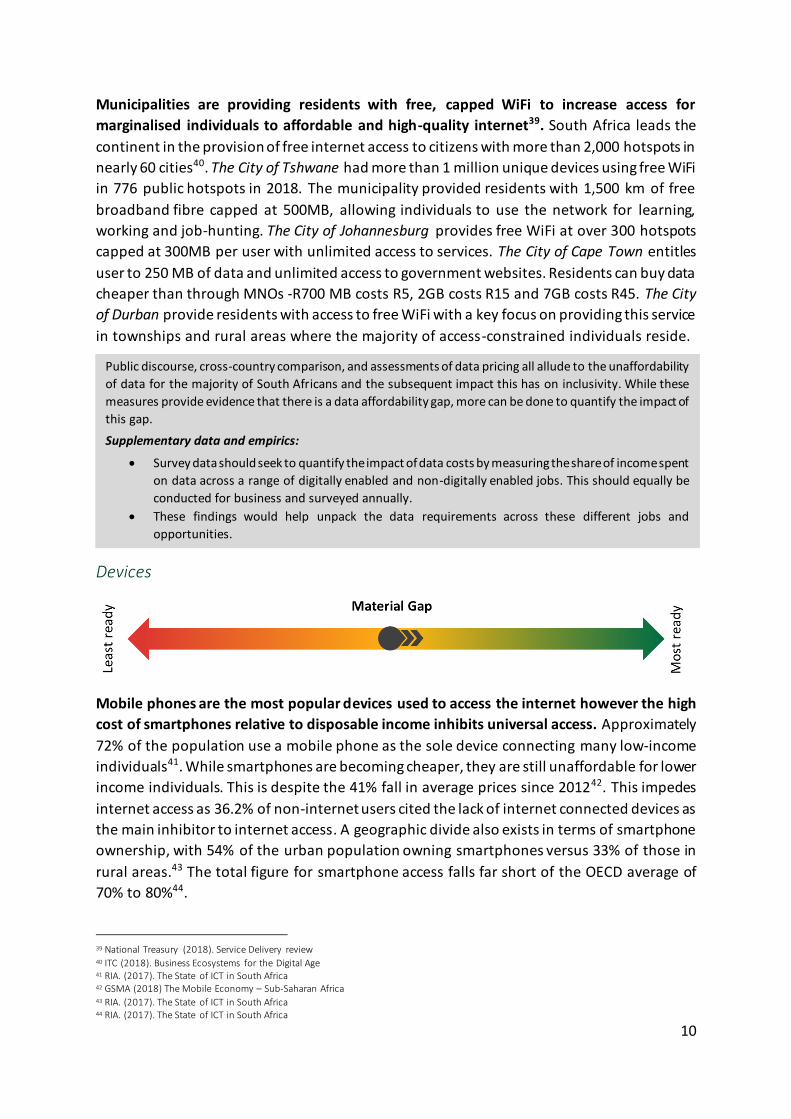
Devices
Mobile phones are the most popular devices used to access the internet however the high
cost of smartphones relative to disposable income inhibits universal access. Approximately
72% of the population use a mobile phone as the sole device connecting many low-income
individuals41. While smartphones are becoming cheaper, they are still unaffordable for lower
income individuals. This is despite the 41% fall in average prices since 201242. This impedes
internet access as 36.2% of non-internet users cited the lack of internet connected devices as
the main inhibitor to internet access. A geographic divide also exists in terms of smartphone
ownership, with 54% of the urban population owning smartphones versus 33% of those in
rural areas.43 The total figure for smartphone access falls far short of the OECD average of
70% to 80%44.
39 National Treasury (2018). Service Delivery review 40 ITC (2018). Business Ecosystems for the Digital Age 41 RIA. (2017). The State of ICT in South Africa 42 GSMA (2018) The Mobile Economy – Sub-Saharan Africa 43 RIA. (2017). The State of ICT in South Africa 44 RIA. (2017). The State of ICT in South Africa
Public discourse, cross-country comparison, and assessments of data pricing all allude to the unaffordability
of data for the majority of South Africans and the subsequent impact this has on inclusivity. While these
measures provide evidence that there is a data affordability gap, more can be done to quantify the impact of
this gap.
Supplementary data and empirics:
Survey data should seek to quantify the impact of data costs by measuring the share of income spent
on data across a range of digitally enabled and non-digitally enabled jobs. This should equally be
conducted for business and surveyed annually.
These findings would help unpack the data requirements across these different jobs and
opportunities.
11
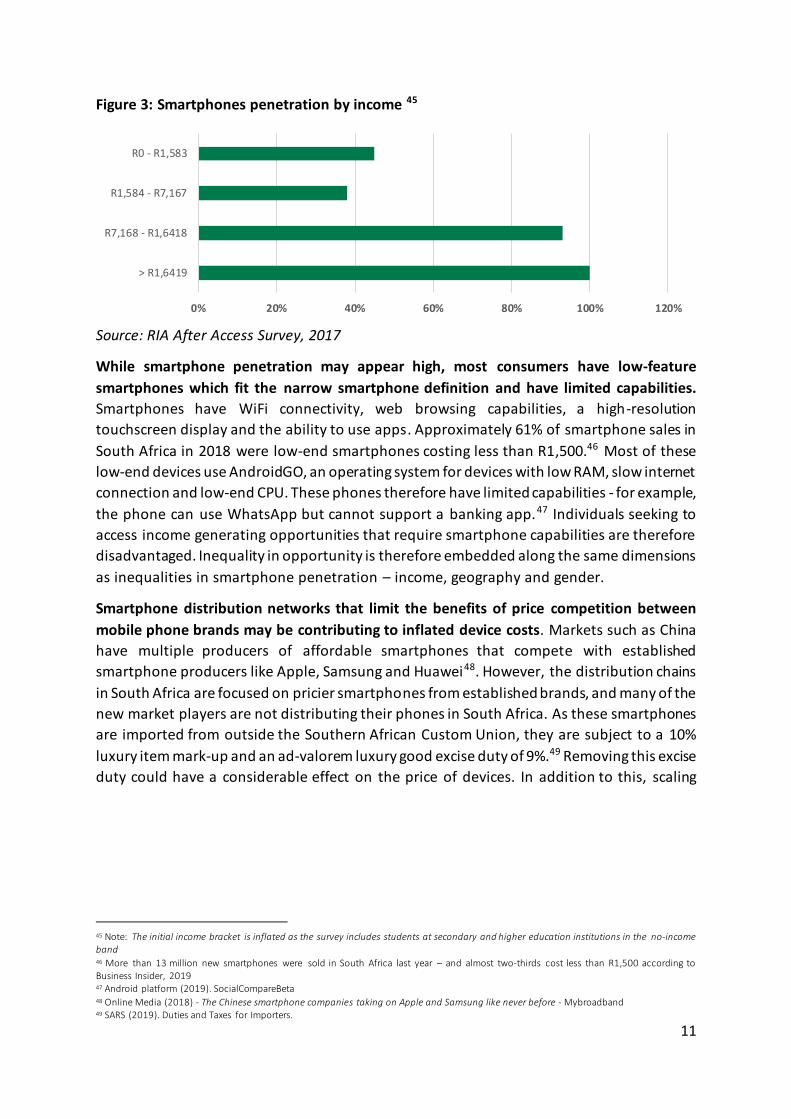
Figure 3: Smartphones penetration by income 45
Source: RIA After Access Survey, 2017
While smartphone penetration may appear high, most consumers have low-feature
smartphones which fit the narrow smartphone definition and have limited capabilities.
Smartphones have WiFi connectivity, web browsing capabilities, a high-resolution
touchscreen display and the ability to use apps. Approximately 61% of smartphone sales in
South Africa in 2018 were low-end smartphones costing less than R1,500.46 Most of these
low-end devices use AndroidGO, an operating system for devices with low RAM, slow internet
connection and low-end CPU. These phones therefore have limited capabilities - for example,
the phone can use WhatsApp but cannot support a banking app.47 Individuals seeking to
access income generating opportunities that require smartphone capabilities are therefore
disadvantaged. Inequality in opportunity is therefore embedded along the same dimensions
as inequalities in smartphone penetration – income, geography and gender.
Smartphone distribution networks that limit the benefits of price competition between
mobile phone brands may be contributing to inflated device costs. Markets such as China
have multiple producers of affordable smartphones that compete with established
smartphone producers like Apple, Samsung and Huawei48. However, the distribution chains
in South Africa are focused on pricier smartphones from established brands, and many of the
new market players are not distributing their phones in South Africa. As these smartphones
are imported from outside the Southern African Custom Union, they are subject to a 10%
luxury item mark-up and an ad-valorem luxury good excise duty of 9%.49 Removing this excise
duty could have a considerable effect on the price of devices. In addition to this, scaling
45 Note: The initial income bracket is inflated as the survey includes students at secondary and higher education institutions in the no-income band 46 More than 13 million new smartphones were sold in South Africa last year – and almost two-thirds cost less than R1,500 according to Business Insider, 2019 47 Android platform (2019). SocialCompareBeta 48 Online Media (2018) - The Chinese smartphone companies taking on Apple and Samsung like never before - Mybroadband 49 SARS (2019). Duties and Taxes for Importers.
0% 20% 40% 60% 80% 100% 120%
> R1,6419
R7,168 - R1,6418
R1,584 - R7,167
R0 - R1,583
12
affordable devices manufactured in South Africa such as the Mara smartphones, could
improve access to affordable, high-quality smartphones.50
Telecommunications regulation
The primary legislation governing the electronic communications sector in South Africa is the
Electronic Communications Act 36 of 2005 (the “ECA”). The Act together with the Electronic
Communications Amendment Act 1 of 2014 covers all aspects of the regulation of electronic
communications markets including licensing, infrastructure deployment and access, the
management and assignment of frequency spectrum, technical standards, interconnection
and competition. In addition, the Independent Communications Authority of South Africa
(ICASA) was established in 200051 to regulate the electronic communications sector and
perform the duties envisaged in the ECA.
Notwithstanding this regulatory regime, it is generally acknowledged that there are
significant regulatory bottlenecks and competition issues that are hindering affordable
access to electronic communication services. These issues were most recently highlighted in
the Competition Commission’s April 2019 Provisional Find ings and Recommendations in the
Data Services Market. 52 The report highlights the following regulatory bottlenecks as
hindering affordable access:53
First, a lack of spectrum and cost-based facilities access is driving high mobile service
provision costs. Significant delays in the release of high-demand, low frequency spectrum by
ICASA for use by mobile networks has resulted in increased costs for such operators. This is
because mobile network operators must compensate for the lack of spectrum via increasing
capital expenditure on physical base station infrastructure to cope with rising data traffic
demands on their networks. In addition, service provision costs are also impacted by a lack of
cost-based passive infrastructure sharing on the part of large incumbents. Whilst ICASA has
previously put in place regulations governing facilities access, these regulations do not cover
50 Online Media (2019) - South Africa to build first ‘affordable’ smartphone - BusinessTech 51 ICASA Act 13 of 2000 52 Competition Commission, Data Services Market Inquiry: Provisional Findings and Recommendations, 21 April 2019. 53 Competition Commission, Data Services Market Inquiry: Provisional Findings and Recommendations, 21 April 2019, p.8 -19.
Measures of device penetration are robust and derived from Research ICT Africa – an entity funded by the
IDRC and dedicated to measuring and assessing ICT access and dynamics. This is combined with insights
drawn from alternative sources however these measures can be supplemented to understand the specific
requirements users need in terms of functionality and therefore better determine the scale of the gap.
Supplementary data and empirics:
Interviews with consumers and businesses operating platforms would provide insight into device
requirements. This would unpack the degree to which low functionality phones are an impediment
and could be overlaid with the insights of local phone producers to coordinate development.
13
all facilities (such as ducts and poles), they do not deal with constructive refusals nor do they
regulate the price at which access is provided.
Second, competition could be improved, particularly in the case of mobile markets, by
regulating wholesale access. Retail electronic communication markets have remained
relatively concentrated over time with market failures and a lack of wholesale access
regulation tending to exacerbate first mover advantages. In particular, in the case of mobile
markets the terms on which roaming agreements and wholesale network access has been
provided by incumbents to smaller players have historically not been conducive to the
introduction of effective competition. This is also supported by the fact that the 2017 ICASA
Priority Markets Study found that wholesale fixed line access, upstream infrastructure
(national transmission and metropolitan connectivity and relevant facilities) and mobile
services are markets that are likely to exhibit ineffective competition and hence should be
prioritised for potential regulatory market reviews.54
There have been a number of indications that the sector regulator is seeking to address the
identified regulatory bottlenecks55 however, past experience and current regulatory and
policy uncertainty suggests that change is unlikely to be forthcoming. Indeed, the ICT policy
and regulatory landscape has been complicated by Departmental restructuring and the
withdrawal of the Electronic Communications Amendment Bill from parliament. Importantly,
the latter was set to be sector-changing legislation that sought to translate current
Government policy into legislation and also reduce what are seen as onerous pre-conditions
for regulation. Its withdrawal is thus likely to lead further delays in implementing regulatory
imperatives.
54 ICASA, Summary of the Findings on the Inquiry into Priority Markets in the Electronic Communications Sector, 17 August 2017, Government Gazette Vol. 638, No. 41847 p.7. 55 These include undertaking both a Priority Market Study to identify markets that should be prioritised for regulation and subs equently
initiating its own Data Market Inquiry (currently underway).
Telco regulation was analysed by an expert team of competition economists and relies both on nuanced
insight and interpretation of regulation.
14
Human Capital
The South African labour market has historically struggled with labour mismatches - there
are not enough graduates learning relevant skills for a digitally oriented economy.56 South
Africa ranks 88 of 130 countries in the WEF Human capital report, let down by performance
measures for young adults 57. In 2016 the total number of graduates in public Higher
Education and Training (HEI) institutions was little over 200,000, which is a 39.7% increase
from 2009. Private HEI contributed 40,000 graduates in 2016 with nearly a third graduating
with a bachelor’s degree or advanced diplomas.58 However, graduates trained in these areas
often lack practical work and the creation of relevant skills. This skill shortage has led to job
vacancies and has hindered economic growth.
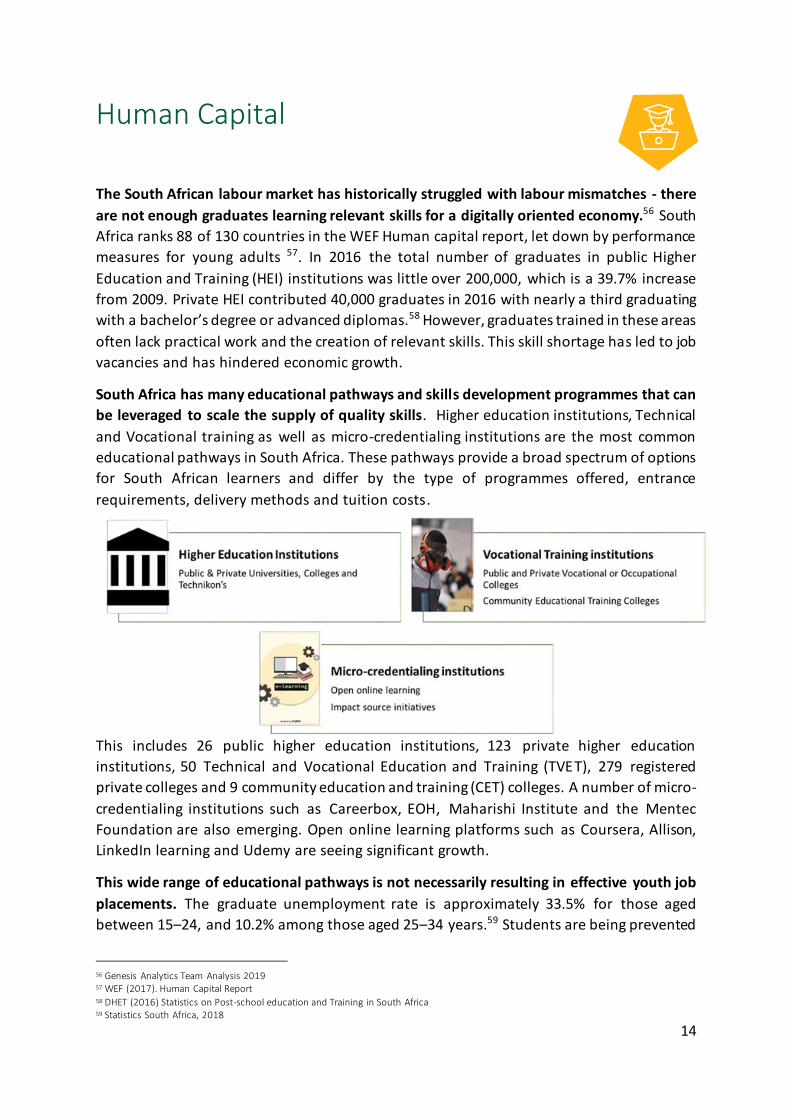
South Africa has many educational pathways and skills development programmes that can
be leveraged to scale the supply of quality skills. Higher education institutions, Technical
and Vocational training as well as micro-credentialing institutions are the most common
educational pathways in South Africa. These pathways provide a broad spectrum of options
for South African learners and differ by the type of programmes offered, entrance
requirements, delivery methods and tuition costs.
This includes 26 public higher education institutions, 123 private higher education
institutions, 50 Technical and Vocational Education and Training (TVET), 279 registered
private colleges and 9 community education and training (CET) colleges. A number of micro-
credentialing institutions such as Careerbox, EOH, Maharishi Institute and the Mentec
Foundation are also emerging. Open online learning platforms such as Coursera, Allison,
LinkedIn learning and Udemy are seeing significant growth.
This wide range of educational pathways is not necessarily resulting in effective youth job
placements. The graduate unemployment rate is approximately 33.5% for those aged
between 15–24, and 10.2% among those aged 25–34 years.59 Students are being prevented
56 Genesis Analytics Team Analysis 2019 57 WEF (2017). Human Capital Report 58 DHET (2016) Statistics on Post-school education and Training in South Africa 59 Statistics South Africa, 2018
15
from transitioning into educational pathways that translates into a jobs due to issues in
accessing educational pathways, poor articulation between pathways and a lack of flexible
and demand driven content.
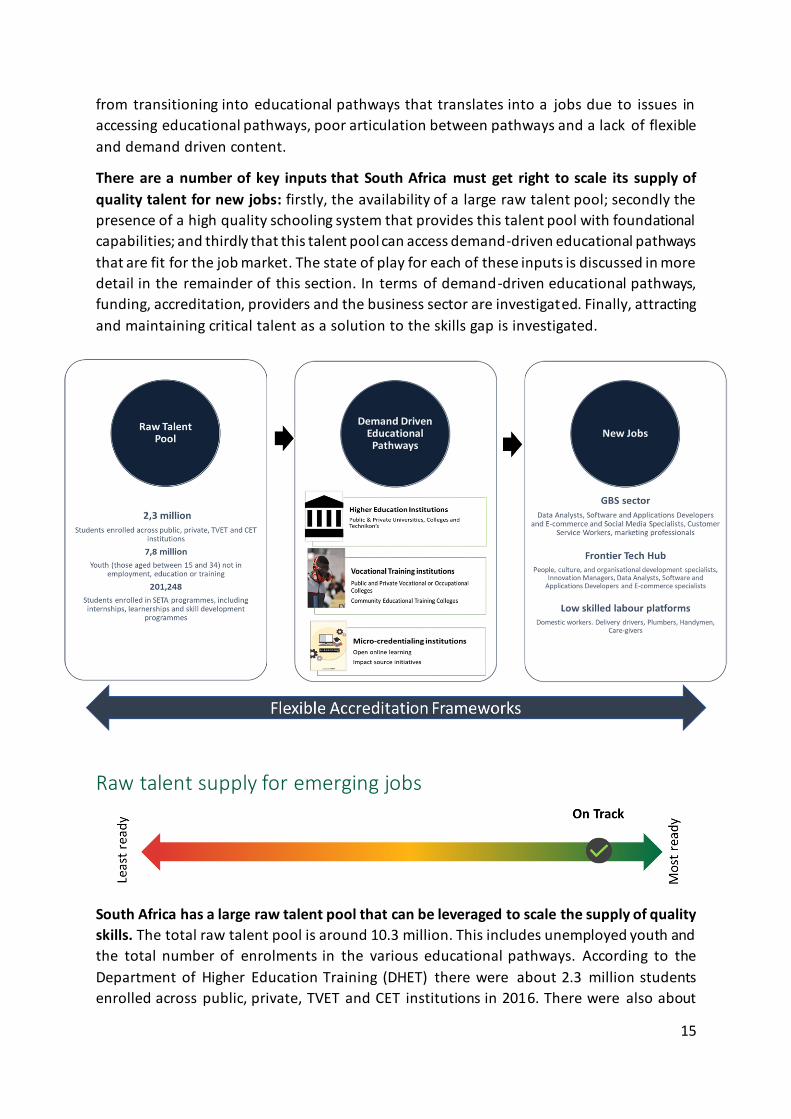
There are a number of key inputs that South Africa must get right to scale its supply of
quality talent for new jobs: firstly, the availability of a large raw talent pool; secondly the
presence of a high quality schooling system that provides this talent pool with foundational
capabilities; and thirdly that this talent pool can access demand-driven educational pathways
that are fit for the job market. The state of play for each of these inputs is discussed in more
detail in the remainder of this section. In terms of demand-driven educational pathways,
funding, accreditation, providers and the business sector are investigated. Finally, attracting
and maintaining critical talent as a solution to the skills gap is investigated.
Raw talent supply for emerging jobs
South Africa has a large raw talent pool that can be leveraged to scale the supply of quality
skills. The total raw talent pool is around 10.3 million. This includes unemployed youth and
the total number of enrolments in the various educational pathways. According to the
Department of Higher Education Training (DHET) there were about 2.3 million students
enrolled across public, private, TVET and CET institutions in 2016. There were also about
16
200,000 students enrolled in SETA programmes, including learnerships, internships and skills
development programmes. Approximately 30% of these students were enrolled in SET
Programmes.60The biggest source of this raw talent pool is the 7.8 million youth (aged
between 15 and 34) that are not in employment, education or training.
The Oxford School of Economics in their report on Global Talent consider South Africa
among the 10 countries expected to produce the largest skills supply by 2021. This puts
South Africa in 4th position in the global rankings after India, Indonesia and Columbia in terms
of skills that can be effectively tapped into.61 Whereas nations such as Japan and Canada
suffer from an aging population, South Africa is unlikely to be in shortage of talent and is at a
demographic advantage62. South Africa also has a large number of unemployed high school
drop-outs and matriculants.63This large raw talent pool can form part of the input into
demand driven educational pathways as the demand for new types of skills increases and new
economic opportunities emerge. However, this large supply of raw talent is an indication of
the availability of individuals who can be trained and not necessarily an indication of the
quality of skills. Education is required to deepen and enrich the capabilities of these
individuals.
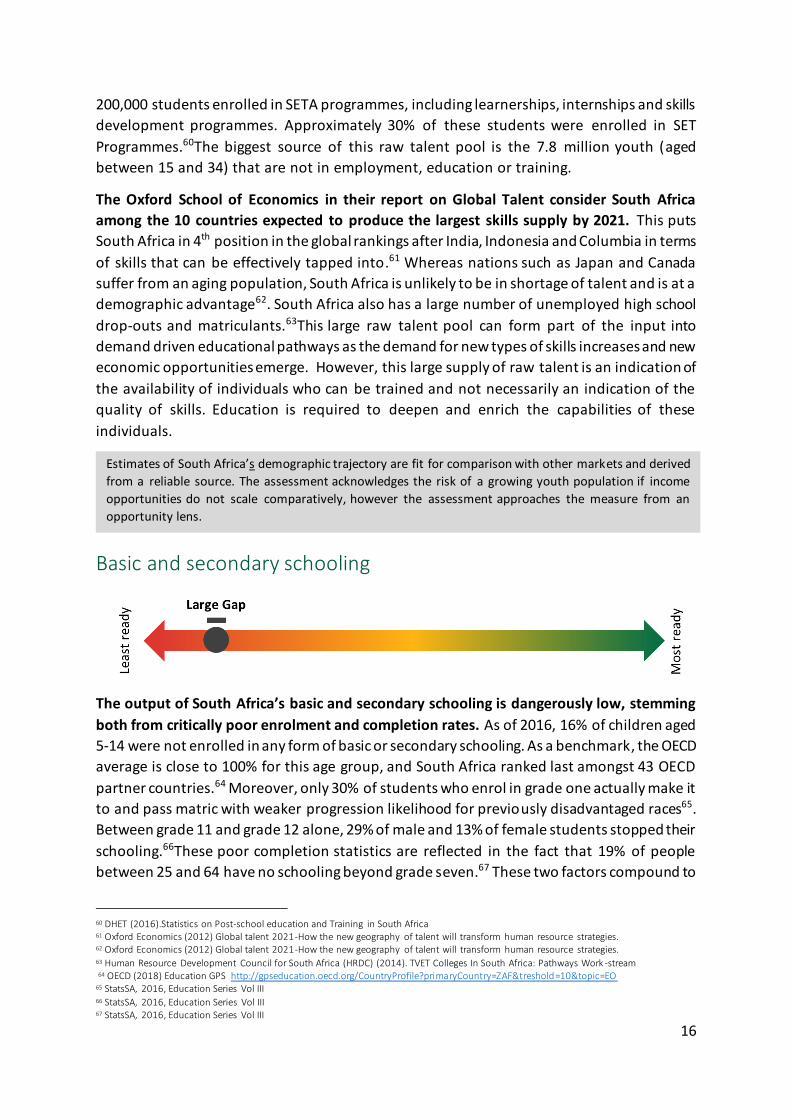
Basic and secondary schooling
The output of South Africa’s basic and secondary schooling is dangerously low, stemming
both from critically poor enrolment and completion rates. As of 2016, 16% of children aged
5-14 were not enrolled in any form of basic or secondary schooling. As a benchmark, the OECD
average is close to 100% for this age group, and South Africa ranked last amongst 43 OECD
partner countries.64 Moreover, only 30% of students who enrol in grade one actually make it
to and pass matric with weaker progression likelihood for previously disadvantaged races65.
Between grade 11 and grade 12 alone, 29% of male and 13% of female students stopped their
schooling.66These poor completion statistics are reflected in the fact that 19% of people
between 25 and 64 have no schooling beyond grade seven.67 These two factors compound to
60 DHET (2016).Statistics on Post-school education and Training in South Africa 61 Oxford Economics (2012) Global talent 2021-How the new geography of talent will transform human resource strategies. 62 Oxford Economics (2012) Global talent 2021-How the new geography of talent will transform human resource strategies. 63 Human Resource Development Council for South Africa (HRDC) (2014). TVET Colleges In South Africa: Pathways Work -stream 64 OECD (2018) Education GPS http://gpseducation.oecd.org/CountryProfile?primaryCountry=ZAF&treshold=10&topic=EO 65 StatsSA, 2016, Education Series Vol III 66 StatsSA, 2016, Education Series Vol III 67 StatsSA, 2016, Education Series Vol III
Estimates of South Africa’s demographic trajectory are fit for comparison with other markets and derived
from a reliable source. The assessment acknowledges the risk of a growing youth population if income
opportunities do not scale comparatively, however the assessment approaches the measure from an
opportunity lens.
17
create a crisis, leaving large percentages of the youth without even basic educational
training.68
Even for those who enrol in and complete primary education, the quality provided is very
poor. South Africa’s basic education systems are not effective at instilling even the most
fundamental numeracy and literacy skills. As of 2016, 78% of grade 4 learners were classified
as illiterate by The Progress in International Reading Literacy Study. This makes South Africa
the worst performing nation of the 50 that were measured.6970 Similarly, Nationally
representative surveys (TIMSS-N 2015) show that only 61% of Grade 5 learners could do basic
mathematics, while the quality of maths and science education is considered by surveyed
executives as far below BRICS averages.7172 This poor quality does not improve as learner’s
continue through basic and secondary schooling. In 47% of high schools no pupil performed
at the intermediate international mathematics benchmark. To contrast, this occurred in only
2% of high schools in Botswana. 73 Moreover, in 2017 only 29% of students pass matric with
high enough marks to qualify for university entry.74
There are instances of high performing public schools and generally better performing
private schools however capacity in these public schools is limited while a narrow portion
of the population can access private schools. The private schooling sector has its own
curriculum, is better staffed and resourced, and less prone to overcrowding. In 2018, the
system had matric pass rates of nearly 98% in contrast to the 78% of public schools. Of the
top performing 200 schools, 185 are former white only schools which are better resourced
and concentrated in urban and peri-urban locations75. Access to private education is
constrained by space and higher costs76. Inequality in access to performing institutions
translates into inequality in student performance – 84% of Grade 5 learners who attend
independent schools understand mathematics at international benchmarks in contrast to
67% in public schools charging fees and 25% in fee-free schools. This incurs discrepancies
along racial lines with 85% of white learners in contrast to 48% of black learners meeting these
benchmarks. This leads to imbalances in access to tertiary education - independent schools
have a bachelor pass rate of 51.3% while public schools have a rate of 37.6%77.
68 StatsSA, 2016, Education Series Vol III 69 Kubheka (2017) 78% of Grade 4 Pupils in SA Are Illiterate – Online at EyeWitness News 70 PIRLS (2016) International Results in Reading 71 Spaull (2019). Hijacked by the urgent, we neglect the important 72 WEF (2018). Global Competitiveness Survey 73 PIRLS (2016) International Results in Reading 74 Education Statistics (2019). South African Market Insights, https://www.southafricanmi.com/education-statistics.html 75 Vally (2019) – Educational Inequality: The Dark Side of SA’s Education System – Online Media – Daily Vox 76 Online Media (2019). – How Matric Results reflect the inequalities of public and private education – News24 77 StatsSA (2017) Education Series Volume V – Higher Education and Skills in South Africa
18
The schooling system provides inadequate support for helping learners plot their post-
school educational pathway. Learners choose subjects in grade 9 that will determine what
higher education programmes and institutions they will qualify to attend. These choices are
constrained by a lack of proper post-school guidance from schools and parents. School
guidance programmes are not comprehensive - particularly in disadvantaged schools - while
student decisions are at risk of being based on negative perceptions of some pathways, a
desire for white-collar jobs rather the blue-collar jobs and the experiences of respected
members in their communities. Colleges are seen as inferior institutions and TVETs are seen
as an easy alternative to finishing high school. TVETs are also regarded as institutions for
students with poor academic performance who will only be able to access menial artisan
jobs.4 As a result, many learners enter educational pathways that they are not prepared for,
which contributes to high drop-out rates.
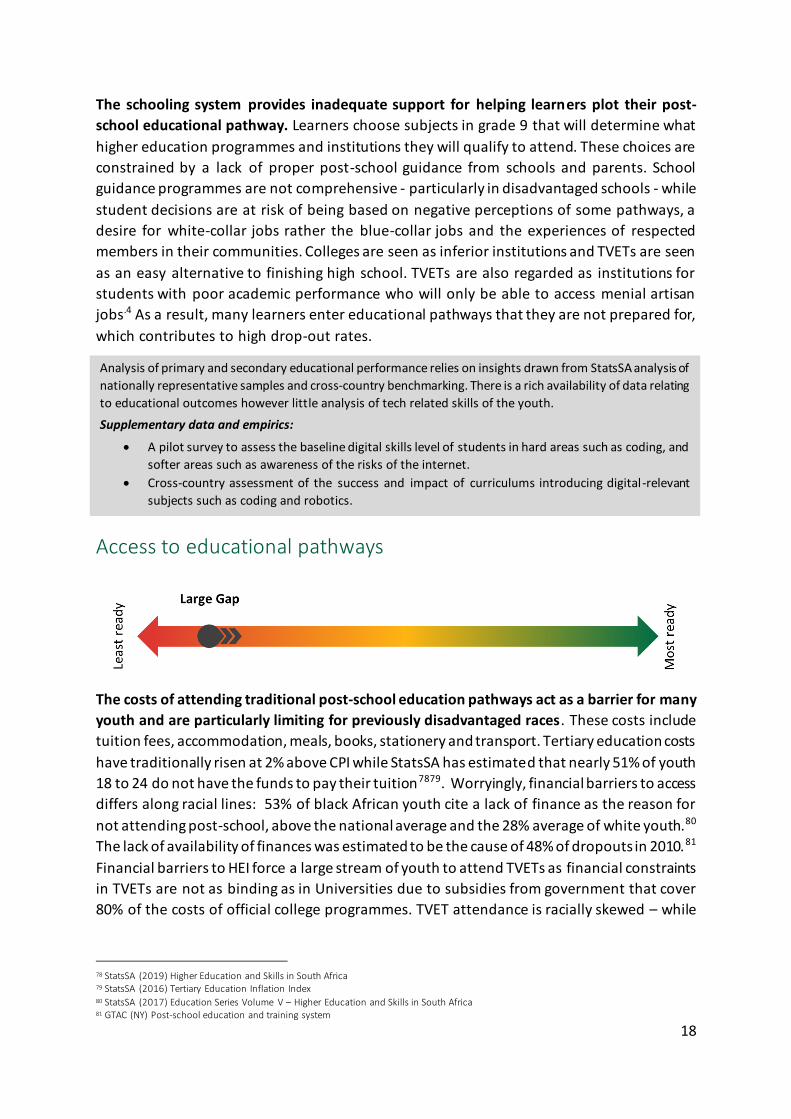
Access to educational pathways
The costs of attending traditional post-school education pathways act as a barrier for many
youth and are particularly limiting for previously disadvantaged races. These costs include
tuition fees, accommodation, meals, books, stationery and transport. Tertiary education costs
have traditionally risen at 2% above CPI while StatsSA has estimated that nearly 51% of youth
18 to 24 do not have the funds to pay their tuition7879. Worryingly, financial barriers to access
differs along racial lines: 53% of black African youth cite a lack of finance as the reason for
not attending post-school, above the national average and the 28% average of white youth.80
The lack of availability of finances was estimated to be the cause of 48% of dropouts in 2010.81
Financial barriers to HEI force a large stream of youth to attend TVETs as financial constraints
in TVETs are not as binding as in Universities due to subsidies from government that cover
80% of the costs of official college programmes. TVET attendance is racially skewed – while
78 StatsSA (2019) Higher Education and Skills in South Africa 79 StatsSA (2016) Tertiary Education Inflation Index 80 StatsSA (2017) Education Series Volume V – Higher Education and Skills in South Africa 81 GTAC (NY) Post-school education and training system
Analysis of primary and secondary educational performance relies on insights drawn from StatsSA analysis of
nationally representative samples and cross-country benchmarking. There is a rich availability of data relating
to educational outcomes however little analysis of tech related skills of the youth.
Supplementary data and empirics:
A pilot survey to assess the baseline digital skills level of students in hard areas such as coding, and
softer areas such as awareness of the risks of the internet.
Cross-country assessment of the success and impact of curriculums introducing digital-relevant
subjects such as coding and robotics.
19
nearly 72% of public HEI students are black African and 15.5% white, 92% of TVET students
are black African and 1% white82.
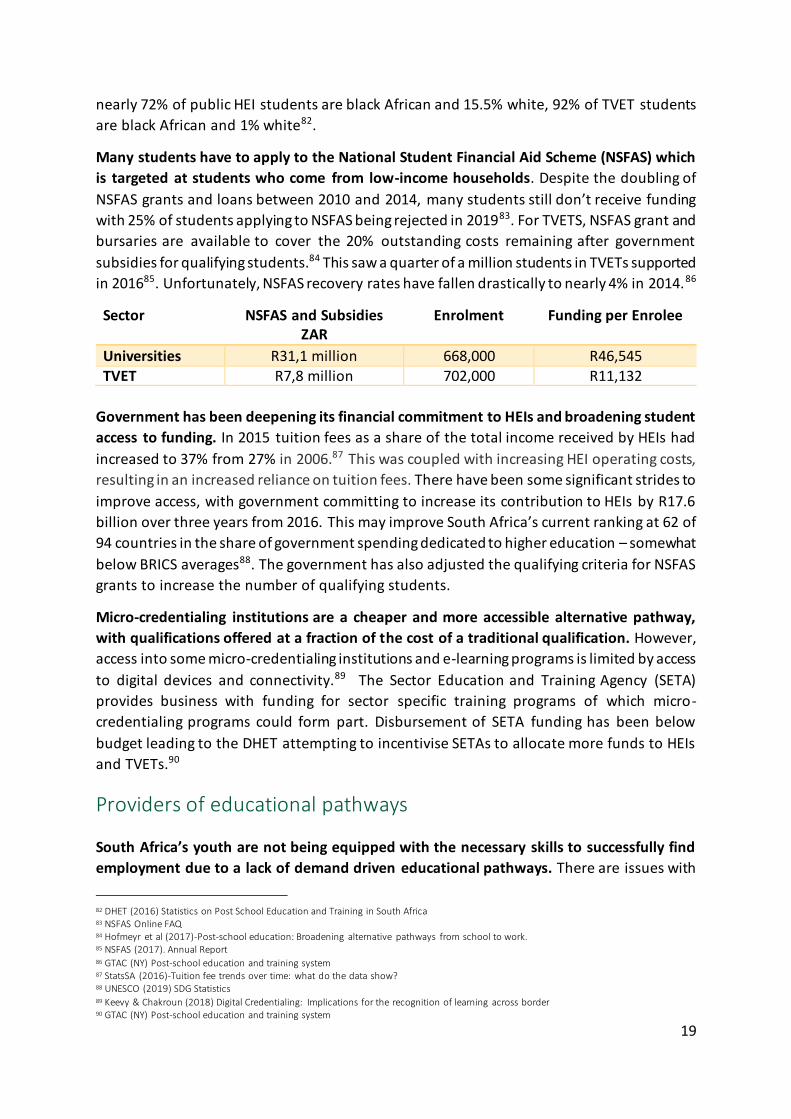
Many students have to apply to the National Student Financial Aid Scheme (NSFAS) which
is targeted at students who come from low-income households. Despite the doubling of
NSFAS grants and loans between 2010 and 2014, many students still don’t receive funding
with 25% of students applying to NSFAS being rejected in 201983. For TVETS, NSFAS grant and
bursaries are available to cover the 20% outstanding costs remaining after government
subsidies for qualifying students.84 This saw a quarter of a million students in TVETs supported
in 201685. Unfortunately, NSFAS recovery rates have fallen drastically to nearly 4% in 2014.86
Sector NSFAS and Subsidies ZAR
Enrolment Funding per Enrolee
Universities R31,1 million 668,000 R46,545 TVET R7,8 million 702,000 R11,132
Government has been deepening its financial commitment to HEIs and broadening student
access to funding. In 2015 tuition fees as a share of the total income received by HEIs had
increased to 37% from 27% in 2006.87 This was coupled with increasing HEI operating costs,
resulting in an increased reliance on tuition fees. There have been some significant strides to
improve access, with government committing to increase its contribution to HEIs by R17.6
billion over three years from 2016. This may improve South Africa’s current ranking at 62 of
94 countries in the share of government spending dedicated to higher education – somewhat
below BRICS averages88. The government has also adjusted the qualifying criteria for NSFAS
grants to increase the number of qualifying students.
Micro-credentialing institutions are a cheaper and more accessible alternative pathway,
with qualifications offered at a fraction of the cost of a traditional qualification. However,
access into some micro-credentialing institutions and e-learning programs is limited by access
to digital devices and connectivity.89 The Sector Education and Training Agency (SETA)
provides business with funding for sector specific training programs of which micro-
credentialing programs could form part. Disbursement of SETA funding has been below
budget leading to the DHET attempting to incentivise SETAs to allocate more funds to HEIs
and TVETs.90
Providers of educational pathways
South Africa’s youth are not being equipped with the necessary skills to successfully find
employment due to a lack of demand driven educational pathways. There are issues with
82 DHET (2016) Statistics on Post School Education and Training in South Africa 83 NSFAS Online FAQ 84 Hofmeyr et al (2017)-Post-school education: Broadening alternative pathways from school to work. 85 NSFAS (2017). Annual Report 86 GTAC (NY) Post-school education and training system 87 StatsSA (2016)-Tuition fee trends over time: what do the data show? 88 UNESCO (2019) SDG Statistics 89 Keevy & Chakroun (2018) Digital Credentialing: Implications for the recognition of learning across border 90 GTAC (NY) Post-school education and training system
20
University and TVET curricula that is considered outdated, inflexible and often unable to meet
the evolving skills demands of the labour market.4
Higher Education Institutions
South Africa has high-quality universities that provide graduates with labour market
advantages however there are limits to scale. In the Times Higher Education (THE) World
Universities Rankings in 2019, four of the top five universities in Africa are South African.91
The University Ranking by Academic Performance (URAP) ranks five South African universities
within the top 500 in the world.92 Youth aged 25-29 with a college qualification are 14% more
likely to be employed, while those with a university qualification are 36% more likely to be
employed.93 Similarly, students that hold a college or university qualification will likely earn
more. Universities have a fixed capacity with only 10% of youth (1.2 million students) enrolled
in a university or college94.
HEIs are producing skills relevant to the digital age however curriculum improvements are
necessary. There has been an upward trend in the number of graduates in Science,
Engineering and Technology (SET) resulting in the majority of graduates coming from these
programmes at 29.1%. UNESCO estimates that South Africa ranks 60 of 93 countries in the
share of students graduating with these degrees.95 Despite this, there are issues with
University curricula which are too inflexible to meet the labour market’s demand for rapidly
changing skills - curricula is outdated with the current structure adopted nearly a century
ago96,97. The scale, bureaucracy and legacy operations of universities limit institutional
flexibility and agility. Additionally, almost half of higher education students do not complete
their qualifications - deteriorating significantly over the past decade98. Rates of access,
success and completion are also worryingly racially skewed99,100
91 Times Higher Education (2019) Times Higher Education’s World University Rankings 92 Informatics Institute (2019) University Ranking by Academic Performance 93 Branson, Hofmeyr et al (2017)-Post-school education: Broadening alternative pathways from school to work. 94 DHET (2016)..Statistics on Post-school education and Training in South Africa 95 UNESCO (2019) SDG Statistics 96 Council for Higher Education (2013). A Proposal for Undergraduate Curriculum Reform in South Africa 97 Branson, Hofmeyr et al (2017)-Post-school education: Broadening alternative pathways from school to work. 98 GTAC (NY) Post-school education and training system 99 Council for Higher Education (2013)., A Proposal for Undergraduate Curriculum Reform in South Africa 100 Council on Higher Education (2016) Vital Stats Public Higher Education 2014
21
Technical and Vocational Education and Training
South Africa has a large TVET sector with complex institutions however there are significant
issues in the relevance of content.101 Although less than HEIs, enrolment in TVETs nearly
doubled between 2010 and 2016, reaching more the 700,000 students.102 TVETs have the
most significant curriculum issues among the educational pathways: these institutions have
limited autonomy in their education and training provision which affects their ability to
develop relevant pathways to (self) employment, occupations and further learning. Some
lecturers have also lost relevant ties to industry and are not always up to date with the latest
occupational skill demands.103 Frequently lecturers have emerged through the technical
qualification route and have little to no practical experience at all 104.
More than half of learners in TVET colleges are not getting any work experience while
throughput is alarmingly low.105 The lack of work experience provided to students is a
significant impediment as students with practical experience have 82% better odds of findings
work106. Colleges are not effectively managing the development of practical skills, either in
the workshops or in workplaces. As such there are only a few TVET colleges that are demand
driven and reflective of the interests and requirements of business.107 In addition certification
rates are poor – nearly 2% of students who begin an NC(V) at level 2 complete the
qualification in 3 years, and only 10% in six years.108 These rates are lowest for technically
demanding course such as IT or engineering. This leads to high costs per graduate – although
spending per learner per year is estimated at R27,000, the cost per graduate likely exceeds
R450,000.109 A ministerial task team is investigating the overhaul of the TVET system in
response to these challenges.110
Accreditation of educational pathways qualifications
The NQF sets the articulation between different qualifications while SETA defines funding
allowances for sector-specific continued learning. For the NQF, this is achieved through an
101 DHE (2018) TVET Sub-Sector Report for the 2019/2020 Sector Skills Plan 102 DHE (2016) Statistics on Post-School Education and Training in South Africa 103 Human Resource Development Council for South Africa (HRDC) (2014) TVET Colleges In South Africa: Pathways Work -stream 104 DHE (2018) TVET Sub-Sector Report for the 2019/2020 Sector Skills Plan 105 DHE (2018) TVET Sub-Sector Report for the 2019/2020 Sector Skills Plan 106 DHE (2018) TVET Sub-Sector Report for the 2019/2020 Sector Skills Plan 107Interviews with Stakeholders conducted by Genesis Analytics, February-March 2019. 108 GTAC (NY) Post-school education and training system 109 GTAC (NY) Post-school education and training system 110 Interviews with Stakeholders conducted by Genesis Analytics, February-March 2019.
22
integrated national framework for learning achievements across institutions. Under the NQF,
degrees can only be attained from universities (traditional, comprehensive or university of
technology), while diplomas and certificates are attained from universities and colleges.
SETAs provide funding for sector specific skill development programmes such as in the
banking sector and in the media and ICT sectors.
The transition from TVETs to universities is constrained by the lack of cooperation between
these institutions. Some universities are reluctant to enrol graduates with a National
Certificate-Vocational (NCV) and argue that their qualification is equal to a matric.111 This
forms part of a lack of clarity regarding entry routes and exit routes in and out of TVETs,
specifically whether it be to HEI, employment or self-employment. The private sector also
holds negative perceptions about the quality of these graduates and thus these graduates
struggle to find employment. This inadequate articulation between qualifications as well as
programmes that span more than one sub-qualification framework, leads to dead ends for
learners. This highlights the need for clear institutional arrangements that are binding to all
institutions. SAQA is currently prioritising the promotion of articulation between
qualifications across the 3 sub-frameworks of the NQF to facilitate lifelong learning and access
to the workplace. Universities have also created bridging programmes to assist
underprepared students gain the skills that weren’t transferred in previous learning
pathways. However, these efforts have not yet translated into a smooth articulation between
pathways.
Inflexible accreditation frameworks limit the ability for alternative educational pathways
to absorb the large availability of raw talent and prepare them for the job market .
Accreditation mechanisms remain inflexible leading to a lack of recognition and support for
non-traditional educational pathways and micro-credentialing. Micro-credentialing
institutions are considered the most flexible and demand driven with some being sector
specific and others being open content providers. The acceptance of micro-credentialing
initiatives in South Africa is behind global trends however there is evidence of growing
appetite from business. Most micro-credentialing institutions struggle for recognition under
the national qualification framework (NQF) or Sector Education & Training Authority (SETA)
accreditation framework: the NQF recognises degrees, diplomas and certificates from
universities, colleges and TVETs while SETA funding requires that programmes fall under their
accreditation standards.112 It appears that there is no clear plan to integrate emerging micro-
credentialing programmes into the SETA accreditation standards, and without this
accreditation, businesses find it difficult to access SETA funding to scale training partnerships
with these micro-credentialing institutions.8113 There are instances of demand driven micro-
credentialing institutions that have been successful in producing accelerated skills for
businesses however the industry is yet to scale. Accreditation mechanism will need to become
more flexible to respond to rapidly changing labour market demands and to allow the training
111 Makura & Nkonki (2017)-Constraints and enablers of articulation from further education and training colleges to Universities: Perceptions from South Africa 112 Interviews with Stakeholders conducted by Genesis Analytics, February-March 2019. 113 Interviews with Stakeholders conducted by Genesis Analytics, February-March 2019.
23
sector to offer a variety of programmes that accommodate emerging and forthcoming digital
jobs.
The cost of developing within-business upskilling programs has been a key inhibitor to
uptake. The lack of SETA accreditation of cost-effective micro-credentialing institutions may
be a contributor to inflated skills training costs for business. South African business spends
nearly 4 times the payroll expenditure required by the Skills Development Levies Act while
firm investment in staff training is on par with BRICS nations ranking 55 of 140
countries114,115,116. In select instances SETA has accommodated these costs however SETA
accreditation expectations are restrictive. As of 2014/15, approximately 12,000 learners were
funded through SETA – down from ~19,000 in 2012/13.117 Business use of cost-effective open
digital content and the development of internal micro-learning content has been neglected
relative to the reliance on external service providers who may however be providing more
bespoke solutions.118
Business contribution to educational pathways
The private sector participates in the development of youth human capital through three
channels. Firstly, industry can support students’ studies through bursaries and scholarships.
Secondly, business can support the readiness of students for business through internships
and practical experience during studies. Finally, business maintains and deepens staff
capabilities through on the job-learning.
The private sector is a key source of student support however better coordination with the
education cluster is required. South African corporates disburse bursaries and scholarships
for students studying in relevant fields. These bursaries may cover all or part of a student’s
studying expenses. As of 2013, a representative sample of corporate funders disbursed nearly
ZAR 500 million to more than 100,000 students.119 As the number of high achieving students
from financially disadvantaged backgrounds is limited, these corporate funders compete for
a relatively small pool of qualifying subsidy/bursary recipients.120 Lack of coordination
between corporate funders and between corporates and educational institutions often sees
high performing, qualifying students being awarded multiple bursaries. 121
South African businesses are developing student readiness for the workforce through
internship programs. While empirical data on the South African internship landscape is scant,
114 WEF (2017). Global Competitiveness Index 115 Interviews with Stakeholders conducted by Genesis Analytics, February-March 2019 116 Online Media (2019). - South African Board for People Practices - State of the South African Training Industry Report. – TD Magazine 117 GTAC (NY) Post-school education and training system 118 Deloitte. 2016. Human Capital Trends Report for South Africa 119 HRDC (2013), Status of the Bursary/Scholarship Funding Landscape in South Africa. 120 GTAC (NY) Post-school education and training system 121 Genesis analytics interview
24
international studies demonstrate the value of internship programs for students: they provide
to-be employees with networks, experience, mentorship, soft-skills and increase the
likelihood of receiving full-time job offers.122 In South Africa, more than 50% of a sample of
graduate interns felt that it provided support in the development of their career paths. 123
Unfortunately, interns are also a transient and cheap source of labour which in many
instances leads business to make use of interns without the explicit intent of hiring them –
42% of graduates that completed internships remained unemployed following completion.124
In another study, only 8% of newly employed graduates attributed their job to a previous
internship.125 In addition, interns often earn far below subsistence level incomes.126
The need for a dynamic labour force is partially being met through on the job learning
however more scale is required. Surveyed South African enterprise is aware of the need for
programs that keep staff skills relevant, improve their ability to pivot to new tasks, and embed
a staff-wide innovation mindset – as of 2017, 83% of executives considered the concept of
continued learning and career development as important or very important.127,128 These
programs improve business agility and readiness in the digital age. Despite this recognition,
only 28% of organisation are actively helping employees develop their skills.129
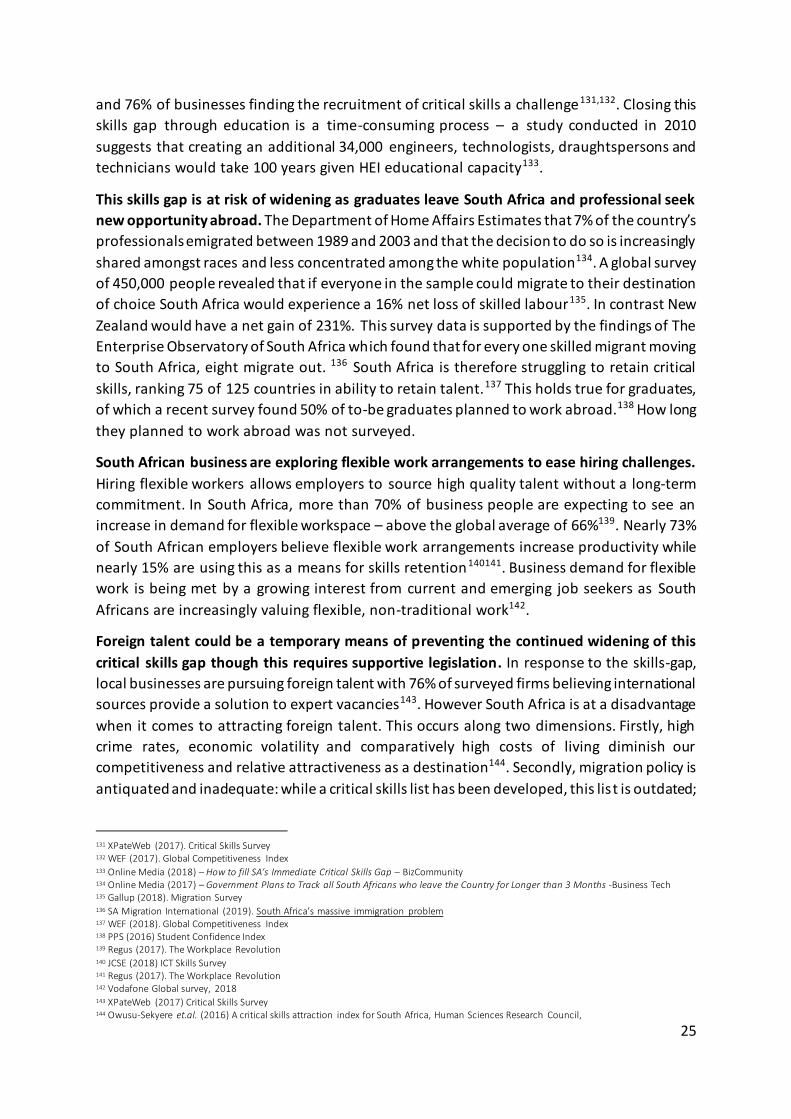
Retaining and Attracting Critical Skills
South Africa suffers from a critical skills gap that will be challenging to close in the short
term. Three sources of labour mismatch plague the South Africa economy and contribute to
this gap130. Firstly, there is a demand mismatch where there is surplus low skills labour and a
demand for high-skill labour. Secondly there is an education supply mismatch where there are
an insufficient amount of graduates with key skills in STEM being produced by educational
pathways. Finally, there is a qualification-job mismatch which sees graduates taking up work
that does not reflect their qualification. This gap is an impediment to business with South
Africa ranking 77 of 140 globally in business ability to find the skills required for vaca ncies,
122 Judy-Marie Smith (2014). Internships – helping young people get a foot in the door. You might just be impressed by whom you let in. –
Online DGMT 123 SAGDA (2013) Final Report on the Internship Baseline Study 124 SAGDA (2013) Final Report on the Internship Baseline Study 125 CHEC (2013) Pathways from University to Work 126 SAGDA (2013) Final Report on the Internship Baseline Study 127 BCG (2017). Human Capital Trends South Africa 128 Ibid. 129 BCG (2017). Human Capital Trends South Africa 130 HSRC (2016). Skills Supply and Demand in South Africa
Data regarding the effectiveness and scale of business involvement with academia is limited. Conclusions rely on
interviews with academic coordinators. The impact and effectiveness of internships and on the job-learning is also little
documented with insights drawn from a narrow survey and findings from established research bodies.
25
and 76% of businesses finding the recruitment of critical skills a challenge131,132. Closing this
skills gap through education is a time-consuming process – a study conducted in 2010
suggests that creating an additional 34,000 engineers, technologists, draughtspersons and
technicians would take 100 years given HEI educational capacity133.
This skills gap is at risk of widening as graduates leave South Africa and professional seek
new opportunity abroad. The Department of Home Affairs Estimates that 7% of the country’s
professionals emigrated between 1989 and 2003 and that the decision to do so is increasingly
shared amongst races and less concentrated among the white population134. A global survey
of 450,000 people revealed that if everyone in the sample could migrate to their destination
of choice South Africa would experience a 16% net loss of skilled labour135. In contrast New
Zealand would have a net gain of 231%. This survey data is supported by the findings of The
Enterprise Observatory of South Africa which found that for every one skilled migrant moving
to South Africa, eight migrate out. 136 South Africa is therefore struggling to retain critical
skills, ranking 75 of 125 countries in ability to retain talent.137 This holds true for graduates,
of which a recent survey found 50% of to-be graduates planned to work abroad.138 How long
they planned to work abroad was not surveyed.
South African business are exploring flexible work arrangements to ease hiring challenges.
Hiring flexible workers allows employers to source high quality talent without a long-term
commitment. In South Africa, more than 70% of business people are expecting to see an
increase in demand for flexible workspace – above the global average of 66%139. Nearly 73%
of South African employers believe flexible work arrangements increase productivity while
nearly 15% are using this as a means for skills retention140141. Business demand for flexible
work is being met by a growing interest from current and emerging job seekers as South
Africans are increasingly valuing flexible, non-traditional work142.
Foreign talent could be a temporary means of preventing the continued widening of this
critical skills gap though this requires supportive legislation. In response to the skills-gap,
local businesses are pursuing foreign talent with 76% of surveyed firms believing international
sources provide a solution to expert vacancies143. However South Africa is at a disadvantage
when it comes to attracting foreign talent. This occurs along two dimensions. Firstly, high
crime rates, economic volatility and comparatively high costs of living diminish our
competitiveness and relative attractiveness as a destination144. Secondly, migration policy is
antiquated and inadequate: while a critical skills list has been developed, this list is outdated;
131 XPateWeb (2017). Critical Skills Survey 132 WEF (2017). Global Competitiveness Index 133 Online Media (2018) – How to fill SA’s Immediate Critical Skills Gap – BizCommunity 134 Online Media (2017) – Government Plans to Track all South Africans who leave the Country for Longer than 3 Months -Business Tech 135 Gallup (2018). Migration Survey 136 SA Migration International (2019). South Africa’s massive immigration problem 137 WEF (2018). Global Competitiveness Index 138 PPS (2016) Student Confidence Index 139 Regus (2017). The Workplace Revolution 140 JCSE (2018) ICT Skills Survey 141 Regus (2017). The Workplace Revolution 142 Vodafone Global survey, 2018 143 XPateWeb (2017) Critical Skills Survey 144 Owusu-Sekyere et.al. (2016) A critical skills attraction index for South Africa, Human Sciences Research Council,
26
cumbersome bureaucratic processes impede the successful application of skilled individuals
seeking to migrate to South Africa, and; South Africa lacks proactive programs and
mechanisms for profiling, targeting, attracting and recruiting critical skills. In 2016 the DHA
acknowledged that “South Africa has not yet put in place adequate policies, strategies,
institutions and capacity for attracting, recruiting and retaining international migrants with
the necessary skills and resources”145.
Reliance on foreign skills may crowd-out local job seekers however not doing so comes at
the risk of foregone opportunity. Incoming migrants create competition for local job seekers
however they also bring with them expertise from foreign markets that can be ut ilised
immediately and diffused locally. Business and government can reduce reliance on foreign
talent by creating an attractive environment for local graduates, creating incentives for local
graduates exploring foreign markets to return home and drawing expatriates back to South
Africa. While countries such as Vietnam, India and China are actively seeking to recruit people
from their diasporas, there seems to be no such activity in South Africa146. Instead emphasis
seems placed on creating barriers to exit.
145 Owusu-Sekyere et.al. (2016) A critical skills attraction index for South Africa, Human Sciences Research Council, 146 Online Media (2018) – Why SA Needs a More Migrant Friendly Policy While also luring back expats, Biznews
27
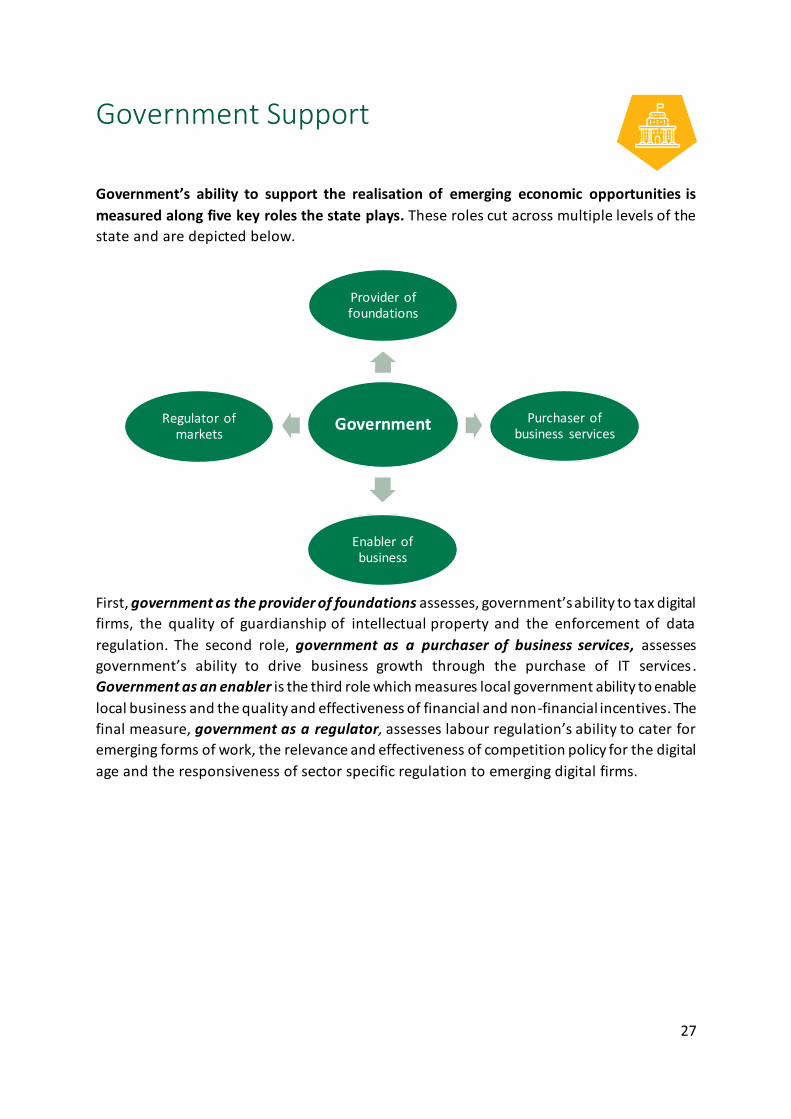
Government Support
Government’s ability to support the realisation of emerging economic opportunities is
measured along five key roles the state plays. These roles cut across multiple levels of the
state and are depicted below.
First, government as the provider of foundations assesses, government’s ability to tax digital
firms, the quality of guardianship of intellectual property and the enforcement of data
regulation. The second role, government as a purchaser of business services, assesses
government’s ability to drive business growth through the purchase of IT services .
Government as an enabler is the third role which measures local government ability to enable
local business and the quality and effectiveness of financial and non-financial incentives. The
final measure, government as a regulator, assesses labour regulation’s ability to cater for
emerging forms of work, the relevance and effectiveness of competition policy for the digital
age and the responsiveness of sector specific regulation to emerging digital firms.
Government
Provider of foundations
Purchaser of business services
Enabler of business
Regulator of markets
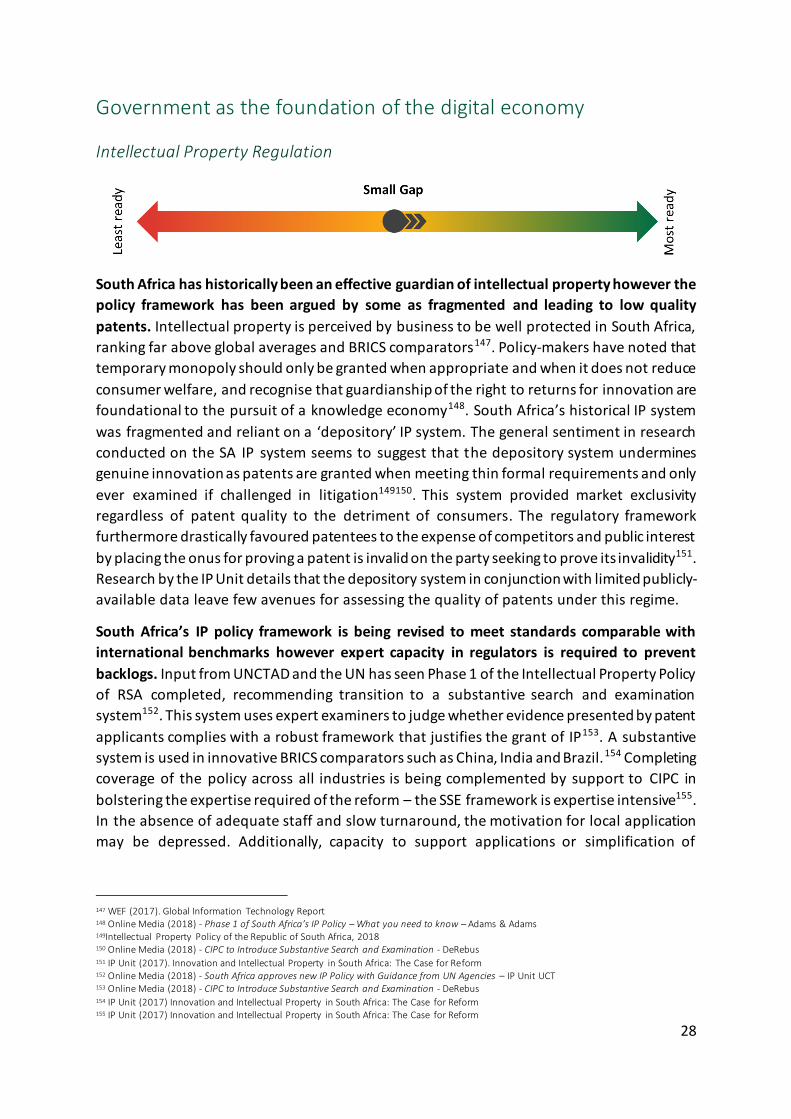
28
Government as the foundation of the digital economy
Intellectual Property Regulation
South Africa has historically been an effective guardian of intellectual property however the
policy framework has been argued by some as fragmented and leading to low quality
patents. Intellectual property is perceived by business to be well protected in South Africa,
ranking far above global averages and BRICS comparators147. Policy-makers have noted that
temporary monopoly should only be granted when appropriate and when it does not reduce
consumer welfare, and recognise that guardianship of the right to returns for innovation are
foundational to the pursuit of a knowledge economy148. South Africa’s historical IP system
was fragmented and reliant on a ‘depository’ IP system. The general sentiment in research
conducted on the SA IP system seems to suggest that the depository system undermines
genuine innovation as patents are granted when meeting thin formal requirements and only
ever examined if challenged in litigation149150. This system provided market exclusivity
regardless of patent quality to the detriment of consumers. The regulatory framework
furthermore drastically favoured patentees to the expense of competitors and public interest
by placing the onus for proving a patent is invalid on the party seeking to prove its invalidity151.
Research by the IP Unit details that the depository system in conjunction with limited publicly-
available data leave few avenues for assessing the quality of patents under this regime.
South Africa’s IP policy framework is being revised to meet standards comparable with
international benchmarks however expert capacity in regulators is required to prevent
backlogs. Input from UNCTAD and the UN has seen Phase 1 of the Intellectual Property Policy
of RSA completed, recommending transition to a substantive search and examination
system152. This system uses expert examiners to judge whether evidence presented by patent
applicants complies with a robust framework that justifies the grant of IP153. A substantive
system is used in innovative BRICS comparators such as China, India and Brazil.154 Completing
coverage of the policy across all industries is being complemented by support to CIPC in
bolstering the expertise required of the reform – the SSE framework is expertise intensive155.
In the absence of adequate staff and slow turnaround, the motivation for local application
may be depressed. Additionally, capacity to support applications or simplification of
147 WEF (2017). Global Information Technology Report 148 Online Media (2018) - Phase 1 of South Africa’s IP Policy – What you need to know – Adams & Adams 149Intellectual Property Policy of the Republic of South Africa, 2018 150 Online Media (2018) - CIPC to Introduce Substantive Search and Examination - DeRebus 151 IP Unit (2017). Innovation and Intellectual Property in South Africa: The Case for Reform 152 Online Media (2018) - South Africa approves new IP Policy with Guidance from UN Agencies – IP Unit UCT 153 Online Media (2018) - CIPC to Introduce Substantive Search and Examination - DeRebus 154 IP Unit (2017) Innovation and Intellectual Property in South Africa: The Case for Reform 155 IP Unit (2017) Innovation and Intellectual Property in South Africa: The Case for Reform
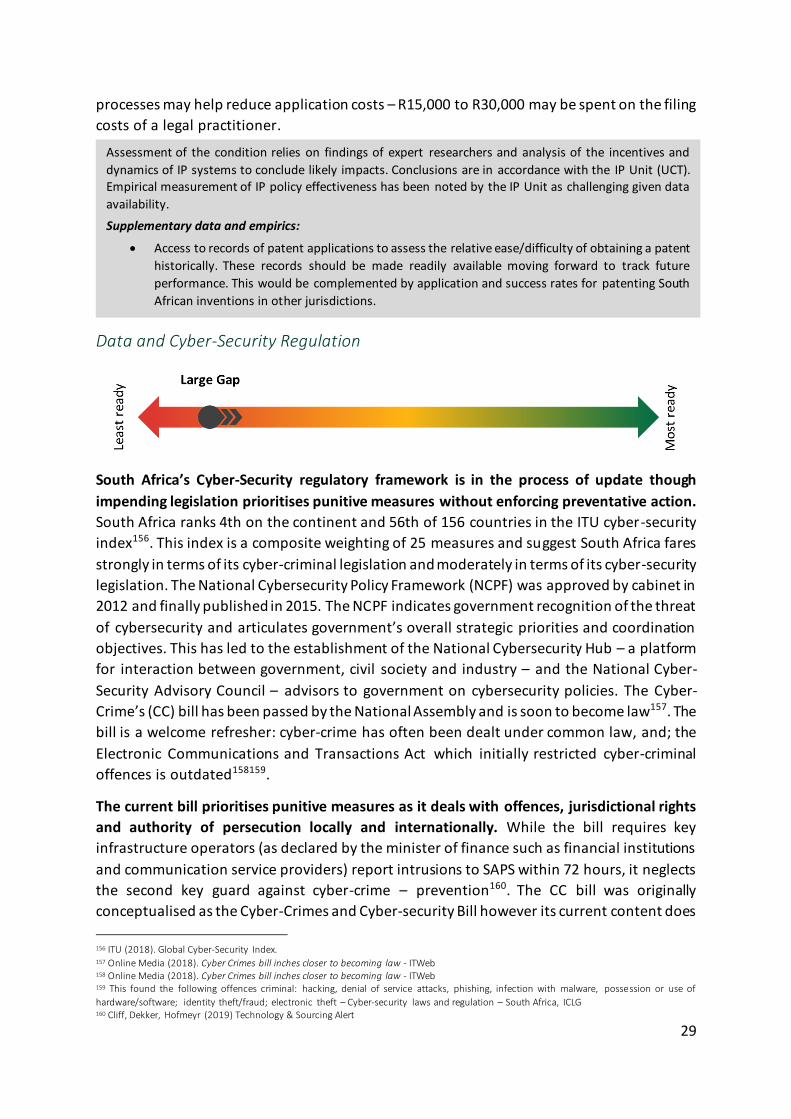
29
processes may help reduce application costs – R15,000 to R30,000 may be spent on the filing
costs of a legal practitioner.
Data and Cyber-Security Regulation
South Africa’s Cyber-Security regulatory framework is in the process of update though
impending legislation prioritises punitive measures without enforcing preventative action.
South Africa ranks 4th on the continent and 56th of 156 countries in the ITU cyber-security
index156. This index is a composite weighting of 25 measures and suggest South Africa fares
strongly in terms of its cyber-criminal legislation and moderately in terms of its cyber-security
legislation. The National Cybersecurity Policy Framework (NCPF) was approved by cabinet in
2012 and finally published in 2015. The NCPF indicates government recognition of the threat
of cybersecurity and articulates government’s overall strategic priorities and coordination
objectives. This has led to the establishment of the National Cybersecurity Hub – a platform
for interaction between government, civil society and industry – and the National Cyber-
Security Advisory Council – advisors to government on cybersecurity policies. The Cyber-
Crime’s (CC) bill has been passed by the National Assembly and is soon to become law157. The
bill is a welcome refresher: cyber-crime has often been dealt under common law, and; the
Electronic Communications and Transactions Act which initially restricted cyber-criminal
offences is outdated158159.
The current bill prioritises punitive measures as it deals with offences, jurisdictional rights
and authority of persecution locally and internationally. While the bill requires key
infrastructure operators (as declared by the minister of finance such as financial institutions
and communication service providers) report intrusions to SAPS within 72 hours, it neglects
the second key guard against cyber-crime – prevention160. The CC bill was originally
conceptualised as the Cyber-Crimes and Cyber-security Bill however its current content does
156 ITU (2018). Global Cyber-Security Index. 157 Online Media (2018). Cyber Crimes bill inches closer to becoming law - ITWeb 158 Online Media (2018). Cyber Crimes bill inches closer to becoming law - ITWeb 159 This found the following offences criminal: hacking, denial of service attacks, phishing, infection with malware, possession or use of
hardware/software; identity theft/fraud; electronic theft – Cyber-security laws and regulation – South Africa, ICLG 160 Cliff, Dekker, Hofmeyr (2019) Technology & Sourcing Alert
Assessment of the condition relies on findings of expert researchers and analysis of the incentives and
dynamics of IP systems to conclude likely impacts. Conclusions are in accordance with the IP Unit (UCT). Empirical measurement of IP policy effectiveness has been noted by the IP Unit as challenging given data
availability.
Supplementary data and empirics:
Access to records of patent applications to assess the relative ease/difficulty of obtaining a patent
historically. These records should be made readily available moving forward to track future
performance. This would be complemented by application and success rates for patenting South
African inventions in other jurisdictions.
30
not impose security obligations. Whether the bill will be appended to deepen its coverage or
motivate business to proactively guard data is yet to be seen.
The yet to be enforced Protection of Personal Information (POPI) Act will position South
Africa well for participation in global data flows, however compliance will be challenging
for many businesses, readiness for compliance is unevenly spread and uncertainties of
government effectiveness in enforcement have been raised. The final POPI Act was
published in December 2018. The act requires entities that use and store an individual’s
personal information to act responsibly: consent for the use of individually identifiable data
must be obtained; detail as to the use of this information must be provided, and; this data
must be destroyed upon request and can only be held for a limited period of time. This
legislation is crafted after the General Data Protection Regulation (GDPR) of the EU. The cross-
border nature of data and the move to universal data laws is reflected in similarities between
GDPR and POPI – locally sourced personal data can only be exported to/shared with nations
and institutions compliant with acceptable legislation. POPI therefore brings South Africa to
compliance with global benchmarks. This eases local business engagement with data drawn
from Europe and other GDPR compliant markets161. However, flows of South African data to
lower compliant regions and institutions will be deterred while local direct marketing will
require consumer consent which may have disproportionate effects on SMMEs162.
There is a gap in enterprise readiness as many businesses require process and procedure
overhauls, financing and expertise to capacitate and be able secure, source and extract
data. This is despite Business having had visibility of the act for 6 years and having 1 year to
comply following a yet to be announced commencement163.164165. A sample of business
perceptions of POPI illustrates the recognition of the reputational need for compliance at
77%, 62% considering it a high priority, and a strong state of compliance readiness: 34% will
definitely be prepared, 33% will likely be prepared, 10% are already compliant, 8% will
probably not be ready and 3% will definitely not be ready.166. The bulk of businesses consider
compliance costly167 while as at 2015, the bulk of SMMEs were non-complaint underpinning
the need for training and support due to the bill’s complexity168. This gap is paralleled by
uncertainty as to effective enforcement: the development of the bill was sluggish while
effective enforcement requires the full capacitation of an information regulator.
161 Luck (2014). POPI – is South Africa keeping up with international trends 162 Botha et. Al. (2015). The Effects of the POPI Act on Small and Medium Enterprises in South Africa 163 Online Media (2019) - POPI Commencement Date or POPI Effective Date Starts the Clock – Michalsons 164 Online Media (2019) - Only 34% of South African Organisations Ready to Comply with POPI Act – ITWeb 165 Kandeh et. Al. (2018). Enforcement of the Protection of Personal Information Act: Perspective of Data Management Professionals 166 Online Media (2019) - Only 34% of South African Organisations Ready to Comply with POPI Act – ITWeb 167 Kandeh et. Al. (2018) Enforcement of the Protection of Personal Information Act: Perspective of Data Management Professionals 168 Botha et. Al. (2015). The Effects of the POPI Act on Small and Medium Enterprises in South Africa
Data and cyber-security assessments were conducted through interpretation of regulation, expert research
and globally comparable indexes. Survey data detailing business readiness for POPIA is drawn from a small
sample of businesses largely concentrated in the IT industry which may suggest overestimation of business
readiness.
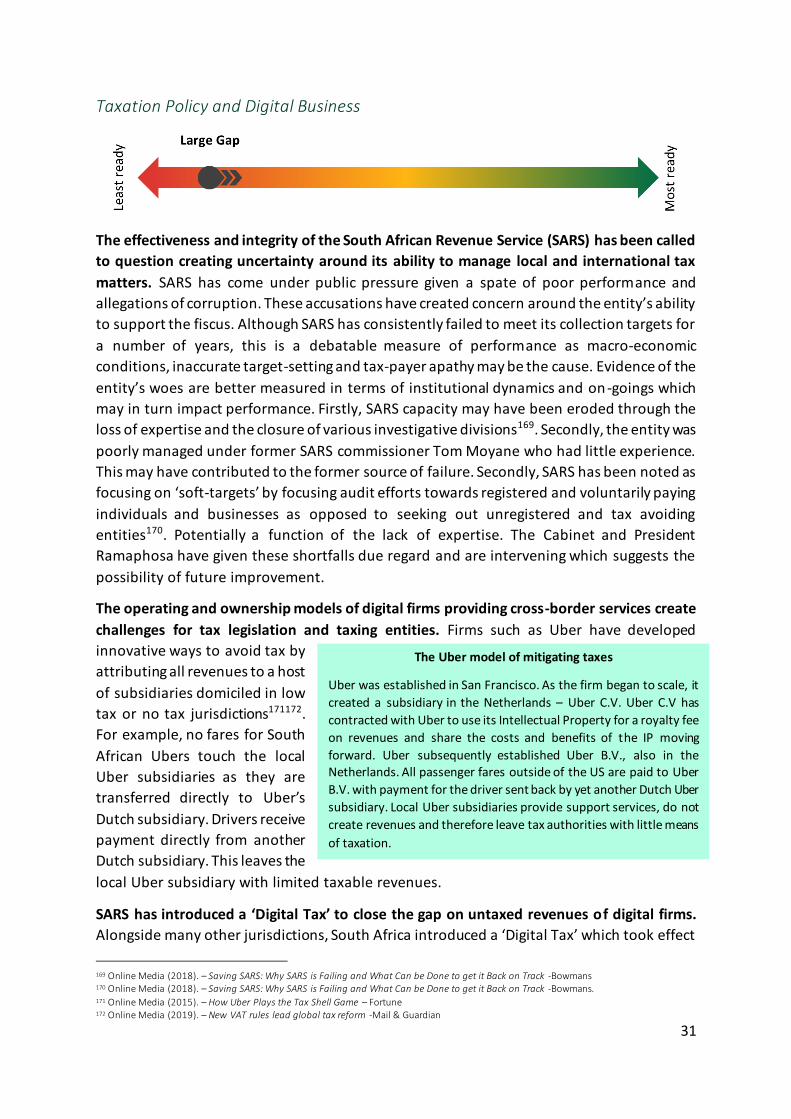
31
Taxation Policy and Digital Business
The effectiveness and integrity of the South African Revenue Service (SARS) has been called
to question creating uncertainty around its ability to manage local and international tax
matters. SARS has come under public pressure given a spate of poor performance and
allegations of corruption. These accusations have created concern around the entity’s ability
to support the fiscus. Although SARS has consistently failed to meet its collection targets for
a number of years, this is a debatable measure of performance as macro-economic
conditions, inaccurate target-setting and tax-payer apathy may be the cause. Evidence of the
entity’s woes are better measured in terms of institutional dynamics and on -goings which
may in turn impact performance. Firstly, SARS capacity may have been eroded through the
loss of expertise and the closure of various investigative divisions169. Secondly, the entity was
poorly managed under former SARS commissioner Tom Moyane who had little experience.
This may have contributed to the former source of failure. Secondly, SARS has been noted as
focusing on ‘soft-targets’ by focusing audit efforts towards registered and voluntarily paying
individuals and businesses as opposed to seeking out unregistered and tax avoiding
entities170. Potentially a function of the lack of expertise. The Cabinet and President
Ramaphosa have given these shortfalls due regard and are intervening which suggests the
possibility of future improvement.
The operating and ownership models of digital firms providing cross-border services create
challenges for tax legislation and taxing entities. Firms such as Uber have developed
innovative ways to avoid tax by
attributing all revenues to a host
of subsidiaries domiciled in low
tax or no tax jurisdictions171172.
For example, no fares for South
African Ubers touch the local
Uber subsidiaries as they are
transferred directly to Uber’s
Dutch subsidiary. Drivers receive
payment directly from another
Dutch subsidiary. This leaves the
local Uber subsidiary with limited taxable revenues.
SARS has introduced a ‘Digital Tax’ to close the gap on untaxed revenues of digital firms.
Alongside many other jurisdictions, South Africa introduced a ‘Digital Tax’ which took effect
169 Online Media (2018). – Saving SARS: Why SARS is Failing and What Can be Done to get it Back on Track -Bowmans 170 Online Media (2018). – Saving SARS: Why SARS is Failing and What Can be Done to get it Back on Track -Bowmans. 171 Online Media (2015). – How Uber Plays the Tax Shell Game – Fortune 172 Online Media (2019). – New VAT rules lead global tax reform -Mail & Guardian
The Uber model of mitigating taxes
Uber was established in San Francisco. As the firm began to scale, it
created a subsidiary in the Netherlands – Uber C.V. Uber C.V has
contracted with Uber to use its Intellectual Property for a royalty fee
on revenues and share the costs and benefits of the IP moving
forward. Uber subsequently established Uber B.V., also in the Netherlands. All passenger fares outside of the US are paid to Uber
B.V. with payment for the driver sent back by yet another Dutch Uber
subsidiary. Local Uber subsidiaries provide support services, do not
create revenues and therefore leave tax authorities with little means
of taxation.
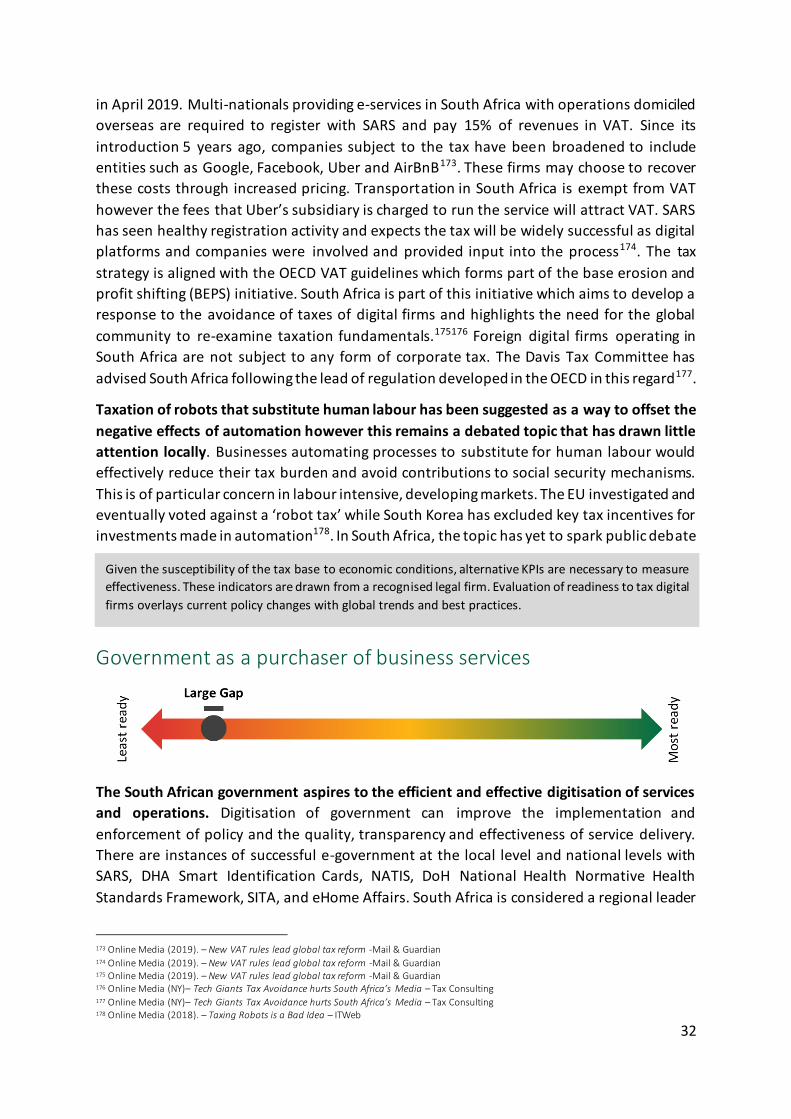
32
in April 2019. Multi-nationals providing e-services in South Africa with operations domiciled
overseas are required to register with SARS and pay 15% of revenues in VAT. Since its
introduction 5 years ago, companies subject to the tax have been broadened to include
entities such as Google, Facebook, Uber and AirBnB173. These firms may choose to recover
these costs through increased pricing. Transportation in South Africa is exempt from VAT
however the fees that Uber’s subsidiary is charged to run the service will attract VAT. SARS
has seen healthy registration activity and expects the tax will be widely successful as digital
platforms and companies were involved and provided input into the process174. The tax
strategy is aligned with the OECD VAT guidelines which forms part of the base erosion and
profit shifting (BEPS) initiative. South Africa is part of this initiative which aims to develop a
response to the avoidance of taxes of digital firms and highlights the need for the global
community to re-examine taxation fundamentals.175176 Foreign digital firms operating in
South Africa are not subject to any form of corporate tax. The Davis Tax Committee has
advised South Africa following the lead of regulation developed in the OECD in this regard177.
Taxation of robots that substitute human labour has been suggested as a way to offset the
negative effects of automation however this remains a debated topic that has drawn little
attention locally. Businesses automating processes to substitute for human labour would
effectively reduce their tax burden and avoid contributions to social security mechanisms.
This is of particular concern in labour intensive, developing markets. The EU investigated and
eventually voted against a ‘robot tax’ while South Korea has excluded key tax incentives for
investments made in automation178. In South Africa, the topic has yet to spark public debate
Government as a purchaser of business services
The South African government aspires to the efficient and effective digitisation of services
and operations. Digitisation of government can improve the implementation and
enforcement of policy and the quality, transparency and effectiveness of service delivery.
There are instances of successful e-government at the local level and national levels with
SARS, DHA Smart Identification Cards, NATIS, DoH National Health Normative Health
Standards Framework, SITA, and eHome Affairs. South Africa is considered a regional leader
173 Online Media (2019). – New VAT rules lead global tax reform -Mail & Guardian 174 Online Media (2019). – New VAT rules lead global tax reform -Mail & Guardian 175 Online Media (2019). – New VAT rules lead global tax reform -Mail & Guardian 176 Online Media (NY)– Tech Giants Tax Avoidance hurts South Africa’s Media – Tax Consulting 177 Online Media (NY)– Tech Giants Tax Avoidance hurts South Africa’s Media – Tax Consulting 178 Online Media (2018). – Taxing Robots is a Bad Idea – ITWeb
Given the susceptibility of the tax base to economic conditions, alternative KPIs are necessary to measure
effectiveness. These indicators are drawn from a recognised legal firm. Evaluation of readiness to tax digital
firms overlays current policy changes with global trends and best practices.
33
in e-Government development and falls slightly short of the continental leader of Mauritius
in the UN e-Government Development Index179.
Approximately 17% of national GDP is spent on procurement with a large share of this
spend allocated to ICT. The R500 to R800 billion government procurement bill is generous
relative to benchmarks at 4% higher than 2015 OECD averages and 10% higher than
Mexico180. The bulk of government purchases of goods and services is driven by provincial
government, followed by national government and finally municipalities.181182 During 2016,
approximately ZAR 14 billion was spent on ICT in the form of computer services,
communication and software.183 Despite the scale of this spend, there remain structural
weaknesses in quality and effectiveness of government’s digital infrastructure.184
The effectiveness of this spend is offset by leakages and potential corruption. Unfortunately
the effectiveness of this spend is imperfect with Treasury Chief Willie Mathebula’s statement
at the State of Capture Inquiry: nearly 50% of government procurement does not follow
proper regulatory processes and is at risk of loss to corruption. 185 This is nearly half of the
target value to be raised by SARS in the 2017/18 financial year186. Furthermore, South Africa
scores poorly relative to comparator countries on the Global Innovation Policy Index measure
of government procurement. South Africa scores particularly poorly on indicators of
corruption.187. Government departments can develop procurement processes as long as they
are compliant with the national regulatory framework however this offers avenues for
unethical practice.188 Leakage in state spending is driven by poor accountability, political
interference, lack of expertise in service providers and bid committees, and non-compliance
with the regulatory framework189.
Government have deployed a host of digital platforms to improve procurement process
transparency and improve business access to opportunity however fragmentation of the
supply chain management system persists. There are 36 supply chain management systems
in government which are poorly integrated and poorly automated. The complexity of this
system, its outdated nature, and the way internal controls are not adhered to have
contributed to process non-compliance. E-procurement platforms are a means for improving
efficiency and transparency by providing a single point of interaction and improving bidder
visibility of the bidder process.190 The government launched an e-tender application portal
and centralised database where tenders from all spheres of government are published.191 This
in conjunction with the integrated financial management system (IFMS) would reduce space
for unethical practice and fraud. The IFMS – a unified financial management suite envisioned
179 UN (2018) e-Government Development Index 180 OurWorld in Data (2019) 181 StatsSA (2017). Financial Statistics of Consolidated Government 182 Online Media (2017) - If government pays on time, SMMEs will engage in droves - IOL 183 TechCentral (2016) – Where government ICT spending goes – Online Media – TechCentral 184 TechCentral (2016) – Where government ICT spending goes – Online Media – TechCentral 185 Online Media (2018) - R400bn lost to flawed tenders – Press Reader 186 Online Media (2018) - R400bn lost to flawed tenders – Press Reader 187 ITIF (2013). Global Innovation Policy Index 188 Mazibuko (2018). Analysis of the Administration of Procurement Practices in the South African Public Sector 189 Mazibuko (2018). Analysis of the Administration of Procurement Practices in the South African Public Sector 190 Anthony (2018). The Use of E-procurement in South African Public Procurement Law: Challenges and Prospects 191 Anthony (2018). The Use of E-procurement in South African Public Procurement Law: Challenges and Prospects
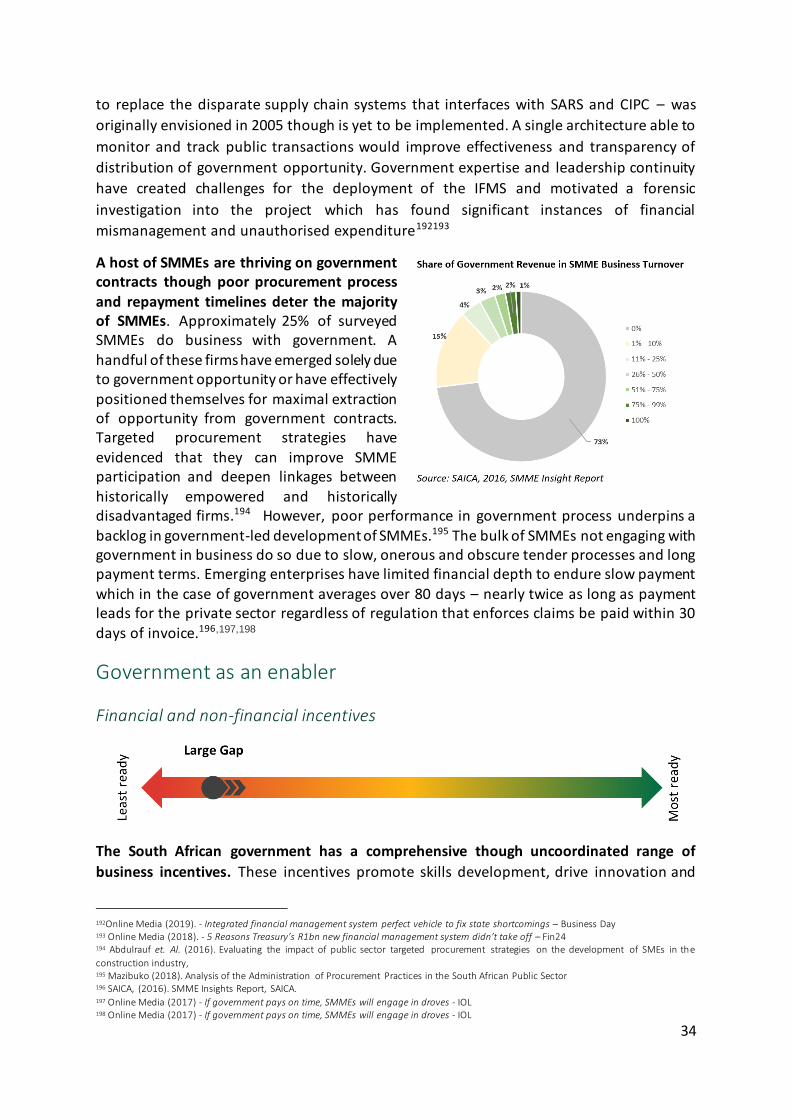
34
to replace the disparate supply chain systems that interfaces with SARS and CIPC – was
originally envisioned in 2005 though is yet to be implemented. A single architecture able to
monitor and track public transactions would improve effectiveness and transparency of
distribution of government opportunity. Government expertise and leadership continuity
have created challenges for the deployment of the IFMS and motivated a forensic
investigation into the project which has found significant instances of financial
mismanagement and unauthorised expenditure192193
A host of SMMEs are thriving on government contracts though poor procurement process
and repayment timelines deter the majority of SMMEs. Approximately 25% of surveyed SMMEs do business with government. A
handful of these firms have emerged solely due to government opportunity or have effectively
positioned themselves for maximal extraction of opportunity from government contracts. Targeted procurement strategies have evidenced that they can improve SMME participation and deepen linkages between
historically empowered and historically disadvantaged firms.194 However, poor performance in government process underpins a
backlog in government-led development of SMMEs.195 The bulk of SMMEs not engaging with government in business do so due to slow, onerous and obscure tender processes and long payment terms. Emerging enterprises have limited financial depth to endure slow payment
which in the case of government averages over 80 days – nearly twice as long as payment leads for the private sector regardless of regulation that enforces claims be paid within 30
days of invoice.196,197,198
Government as an enabler
Financial and non-financial incentives
The South African government has a comprehensive though uncoordinated range of
business incentives. These incentives promote skills development, drive innovation and
192Online Media (2019). - Integrated financial management system perfect vehicle to fix state shortcomings – Business Day 193 Online Media (2018). - 5 Reasons Treasury’s R1bn new financial management system didn’t take off – Fin24 194 Abdulrauf et. Al. (2016). Evaluating the impact of public sector targeted procurement strategies on the development of SMEs in the
construction industry, 195 Mazibuko (2018). Analysis of the Administration of Procurement Practices in the South African Public Sector 196 SAICA, (2016). SMME Insights Report, SAICA. 197 Online Media (2017) - If government pays on time, SMMEs will engage in droves - IOL 198 Online Media (2017) - If government pays on time, SMMEs will engage in droves - IOL
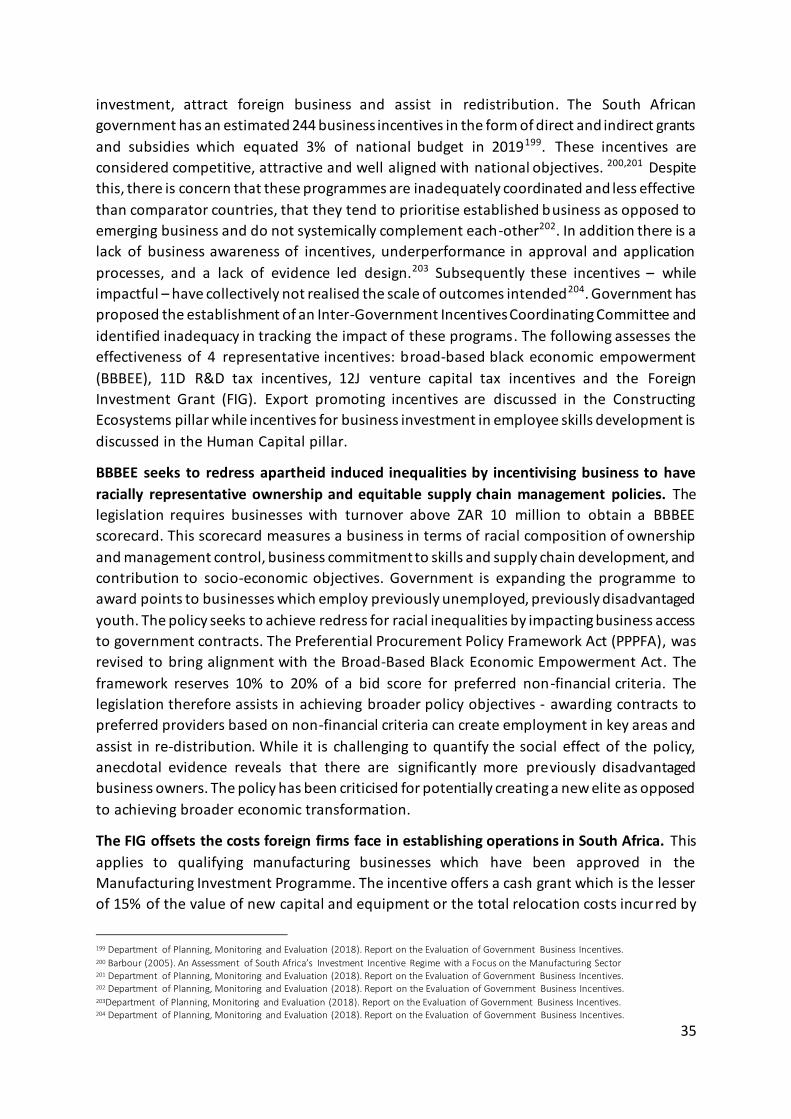
35
investment, attract foreign business and assist in redistribution. The South African
government has an estimated 244 business incentives in the form of direct and indirect grants
and subsidies which equated 3% of national budget in 2019199. These incentives are
considered competitive, attractive and well aligned with national objectives. 200,201 Despite
this, there is concern that these programmes are inadequately coordinated and less effective
than comparator countries, that they tend to prioritise established business as opposed to
emerging business and do not systemically complement each-other202. In addition there is a
lack of business awareness of incentives, underperformance in approval and application
processes, and a lack of evidence led design.203 Subsequently these incentives – while
impactful – have collectively not realised the scale of outcomes intended204. Government has
proposed the establishment of an Inter-Government Incentives Coordinating Committee and
identified inadequacy in tracking the impact of these programs. The following assesses the
effectiveness of 4 representative incentives: broad-based black economic empowerment
(BBBEE), 11D R&D tax incentives, 12J venture capital tax incentives and the Foreign
Investment Grant (FIG). Export promoting incentives are discussed in the Constructing
Ecosystems pillar while incentives for business investment in employee skills development is
discussed in the Human Capital pillar.
BBBEE seeks to redress apartheid induced inequalities by incentivising business to have
racially representative ownership and equitable supply chain management policies. The
legislation requires businesses with turnover above ZAR 10 million to obtain a BBBEE
scorecard. This scorecard measures a business in terms of racial composition of ownership
and management control, business commitment to skills and supply chain development, and
contribution to socio-economic objectives. Government is expanding the programme to
award points to businesses which employ previously unemployed, previously disadvantaged
youth. The policy seeks to achieve redress for racial inequalities by impacting business access
to government contracts. The Preferential Procurement Policy Framework Act (PPPFA), was
revised to bring alignment with the Broad-Based Black Economic Empowerment Act. The
framework reserves 10% to 20% of a bid score for preferred non-financial criteria. The
legislation therefore assists in achieving broader policy objectives - awarding contracts to
preferred providers based on non-financial criteria can create employment in key areas and
assist in re-distribution. While it is challenging to quantify the social effect of the policy,
anecdotal evidence reveals that there are significantly more previously disadvantaged
business owners. The policy has been criticised for potentially creating a new elite as opposed
to achieving broader economic transformation.
The FIG offsets the costs foreign firms face in establishing operations in South Africa. This
applies to qualifying manufacturing businesses which have been approved in the
Manufacturing Investment Programme. The incentive offers a cash grant which is the lesser
of 15% of the value of new capital and equipment or the total relocation costs incurred by
199 Department of Planning, Monitoring and Evaluation (2018). Report on the Evaluation of Government Business Incentives. 200 Barbour (2005). An Assessment of South Africa’s Investment Incentive Regime with a Focus on the Manufacturing Sector 201 Department of Planning, Monitoring and Evaluation (2018). Report on the Evaluation of Government Business Incentives. 202 Department of Planning, Monitoring and Evaluation (2018). Report on the Evaluation of Government Business Incentives. 203Department of Planning, Monitoring and Evaluation (2018). Report on the Evaluation of Government Business Incentives. 204 Department of Planning, Monitoring and Evaluation (2018). Report on the Evaluation of Government Business Incentives.
36
moving capital and equipment to a maximum of ZAR 10 million. The 12I incentive - which
directs investment into manufacturing and resulted in a 50% lift in manufacturing output –
also offers financial support to local manufacturing firms.205
South Africa’s key innovation tax deductions are competitive relative to global leaders and
BRICS nations. The Section 11D R&D tax incentive allows a maximum of 150% tax deduction
on expenditure on research on an invention, or on new or improved product designs and
functionalities and allows for accelerated depreciation of capital expenditure. This is a
competitive policy when benchmarked to innovation leaders: Israel allows qualifying large
enterprises a corporate tax rate of 5-8% and between 7.5% and 16% for SMEs; the US gives a
non-refundable tax credit to reduce income tax up to 9.1%. Benchmarked to more
comparable BRICS states finds tax policies are also relatively competitive - Brazil offers a 200%
incentive, China offers a 75% maximum deduction, Russia, offers 150%, while India allows
only 15%.206
The 11D tax incentive has had a positive impact on investment in R&D however it s
inefficiently administered. Between its introduction in 2006 and June 2017 292 companies
have received approval for the tax deduction. The government is estimated to have spent
R36.1 billion on R&D through the incentive. Data from 2012 shows that 75% of companies
whose application was approved attributed the creation of new products to the tax
incentive207. A further 42% of companies attributed an increased scale and pace of pre-
planned R&D to the scheme. This resulted in a net 2.9% increase in R&D expenditure.208 The
2015 National Treasury budget review found severe backlogs in the process of approving
applications attributed to capacity constrains in the DST.209 This is reflected in decreasing
applications being adjudicated –218 adjudications in 2012 steadily declined to 97 in 2014.210
These imperfections have been identified as the cause of a 70% drop in forgone government
revenue from approved tax deductions in 2013.211 Progress in achieving efficiency seems to
have been made212 As of November 2018 potential structural reforms to improve
administrative efficiency were being considered, but no reforms have been implemented.213
Section 12J venture capital funds are funnelling investment towards employment creating
SMMEs and growing rapidly in popularity. The 12J tax incentive allows individuals,
corporates and funds investing in qualifying venture capital companies (VCCs) to offset their
income tax burden by 45% of the investment. The incentive seeks to drive SMME growth in
key sectors that offer high employment growth opportunity.214. In 2015 an estimated 30 funds
were registered for the 12J incentive. This accelerated to over 100 in 2018 illustrating the
attractiveness of the fund and its recent recognition among investors leading to an estimated
205 A study of the section 12J VCC regime as a capital procurement instrument for SMMEs, Ngwenya, 2014 206 Deloitte (2018). Survey of Global Investment and Innovation Incentives 207 National Advisory Council on Innovation (2015) Review of The White Paper on Science and Technology 208 National Advisory Council on Innovation (2015) Review of The White Paper on Science and Technology 209 Deloitte (2018). Survey of Global Investment and Innovation Incentives 210 Status update on processing of application for the R&D tax incentive – Presentation to the Standing Committee on Finance (SCOF). 211 DST (2016). Science and Technology on Research and Development Tax Incentive report, Polity - Issued by Department of Science and Technology 212 Parliamentary Monitoring Group (2017). Research and Development (R&D) Tax Incentives; Indigenous Knowledge Systems Bill: briefing 213 Deloitte (2018). Survey of Global Investment and Innovation Incentives 214 This excludes SMMEs operating in the following: trade of immovable property, financial services, advisory services, gambling and casinos, manufacturing of liquor, tobacco or firearms, and trade carried out outside of South Africa
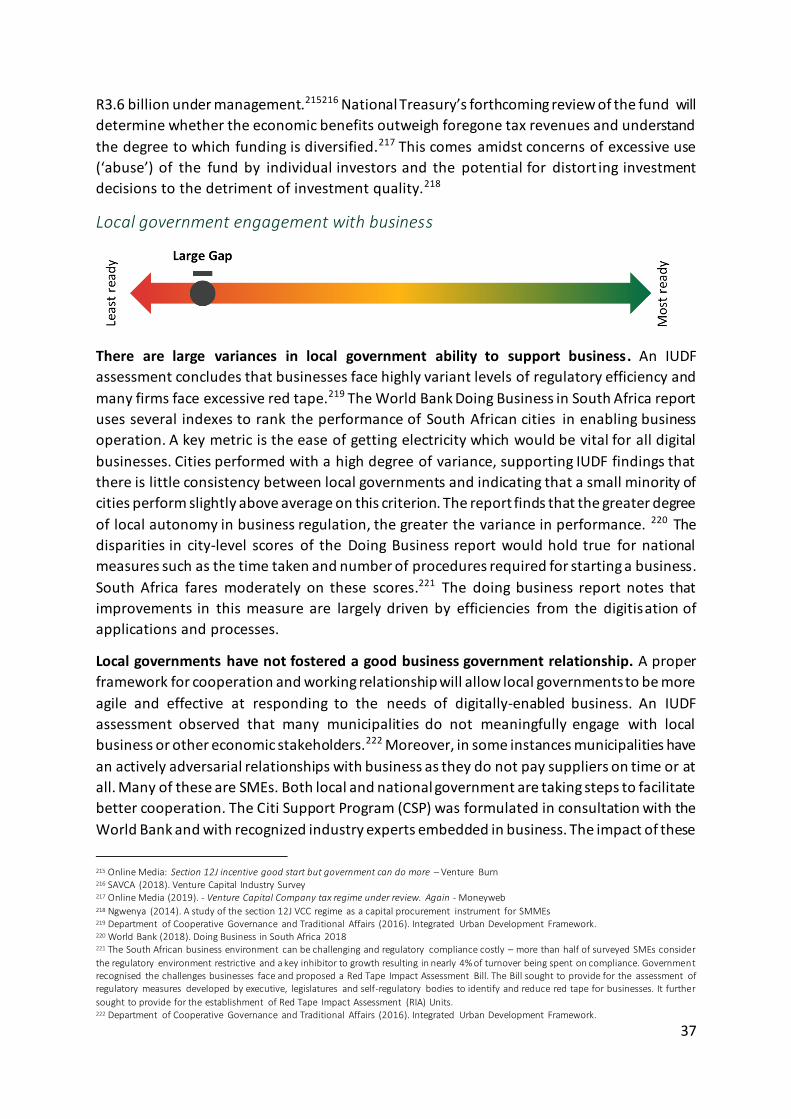
37
R3.6 billion under management.215216 National Treasury’s forthcoming review of the fund will
determine whether the economic benefits outweigh foregone tax revenues and understand
the degree to which funding is diversified.217 This comes amidst concerns of excessive use
(‘abuse’) of the fund by individual investors and the potential for distort ing investment
decisions to the detriment of investment quality.218
Local government engagement with business
There are large variances in local government ability to support business. An IUDF
assessment concludes that businesses face highly variant levels of regulatory efficiency and
many firms face excessive red tape.219 The World Bank Doing Business in South Africa report
uses several indexes to rank the performance of South African cities in enabling business
operation. A key metric is the ease of getting electricity which would be vital for all digital
businesses. Cities performed with a high degree of variance, supporting IUDF findings that
there is little consistency between local governments and indicating that a small minority of
cities perform slightly above average on this criterion. The report finds that the greater degree
of local autonomy in business regulation, the greater the variance in performance. 220 The
disparities in city-level scores of the Doing Business report would hold true for national
measures such as the time taken and number of procedures required for starting a business.
South Africa fares moderately on these scores.221 The doing business report notes that
improvements in this measure are largely driven by efficiencies from the digitisation of
applications and processes.
Local governments have not fostered a good business government relationship. A proper
framework for cooperation and working relationship will allow local governments to be more
agile and effective at responding to the needs of digitally-enabled business. An IUDF
assessment observed that many municipalities do not meaningfully engage with local
business or other economic stakeholders.222 Moreover, in some instances municipalities have
an actively adversarial relationships with business as they do not pay suppliers on time or at
all. Many of these are SMEs. Both local and national government are taking steps to facilitate
better cooperation. The Citi Support Program (CSP) was formulated in consultation with the
World Bank and with recognized industry experts embedded in business. The impact of these
215 Online Media: Section 12J incentive good start but government can do more – Venture Burn 216 SAVCA (2018). Venture Capital Industry Survey 217 Online Media (2019). - Venture Capital Company tax regime under review. Again - Moneyweb 218 Ngwenya (2014). A study of the section 12J VCC regime as a capital procurement instrument for SMMEs 219 Department of Cooperative Governance and Traditional Affairs (2016). Integrated Urban Development Framework. 220 World Bank (2018). Doing Business in South Africa 2018 221 The South African business environment can be challenging and regulatory compliance costly – more than half of surveyed SMEs consider
the regulatory environment restrictive and a key inhibitor to growth resulting in nearly 4% of turnover being spent on compliance. Government recognised the challenges businesses face and proposed a Red Tape Impact Assessment Bill. The Bill sought to provide for the assessment of regulatory measures developed by executive, legislatures and self-regulatory bodies to identify and reduce red tape for businesses. It further
sought to provide for the establishment of Red Tape Impact Assessment (RIA) Units. 222 Department of Cooperative Governance and Traditional Affairs (2016). Integrated Urban Development Framework.
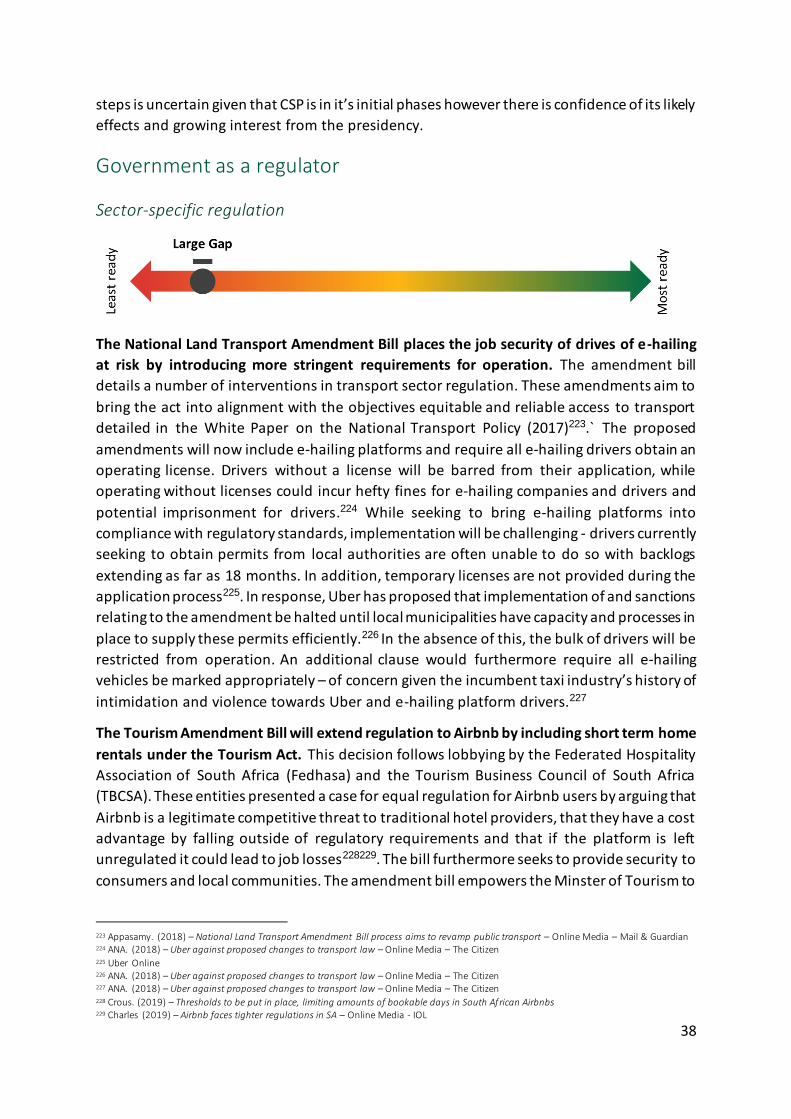
38
steps is uncertain given that CSP is in it’s initial phases however there is confidence of its likely
effects and growing interest from the presidency.
Government as a regulator
Sector-specific regulation
The National Land Transport Amendment Bill places the job security of drives of e-hailing
at risk by introducing more stringent requirements for operation. The amendment bill
details a number of interventions in transport sector regulation. These amendments aim to
bring the act into alignment with the objectives equitable and reliable access to transport
detailed in the White Paper on the National Transport Policy (2017)223.` The proposed
amendments will now include e-hailing platforms and require all e-hailing drivers obtain an
operating license. Drivers without a license will be barred from their application, while
operating without licenses could incur hefty fines for e-hailing companies and drivers and
potential imprisonment for drivers.224 While seeking to bring e-hailing platforms into
compliance with regulatory standards, implementation will be challenging - drivers currently
seeking to obtain permits from local authorities are often unable to do so with backlogs
extending as far as 18 months. In addition, temporary licenses are not provided during the
application process225. In response, Uber has proposed that implementation of and sanctions
relating to the amendment be halted until local municipalities have capacity and processes in
place to supply these permits efficiently.226 In the absence of this, the bulk of drivers will be
restricted from operation. An additional clause would furthermore require all e-hailing
vehicles be marked appropriately – of concern given the incumbent taxi industry’s history of
intimidation and violence towards Uber and e-hailing platform drivers.227
The Tourism Amendment Bill will extend regulation to Airbnb by including short term home
rentals under the Tourism Act. This decision follows lobbying by the Federated Hospitality
Association of South Africa (Fedhasa) and the Tourism Business Council of South Africa
(TBCSA). These entities presented a case for equal regulation for Airbnb users by arguing that
Airbnb is a legitimate competitive threat to traditional hotel providers, that they have a cost
advantage by falling outside of regulatory requirements and that if the platform is left
unregulated it could lead to job losses228229. The bill furthermore seeks to provide security to
consumers and local communities. The amendment bill empowers the Minster of Tourism to
223 Appasamy. (2018) – National Land Transport Amendment Bill process aims to revamp public transport – Online Media – Mail & Guardian 224 ANA. (2018) – Uber against proposed changes to transport law – Online Media – The Citizen 225 Uber Online 226 ANA. (2018) – Uber against proposed changes to transport law – Online Media – The Citizen 227 ANA. (2018) – Uber against proposed changes to transport law – Online Media – The Citizen 228 Crous. (2019) – Thresholds to be put in place, limiting amounts of bookable days in South African Airbnbs 229 Charles (2019) – Airbnb faces tighter regulations in SA – Online Media - IOL
39
establish regulatory requirements for platform participants. This might subject homeowners
renting their property on platforms to inspections and audits and require they have
appropriate licenses, insurance and certificates necessary for operation 230. This may
furthermore include limits on the number of nights a guest may stay and what business hours
they may operate, how much a home-owner may earn and what zones home-owners may
operate in.231232 The Minister of Tourism has stated that the objective is not to overregulate,
but to create minimum standards and regulatory consistency across municipalities.233 The
proposed amendment may however reduce the number of home-owners who might be
willing and able to use Airbnb as ease of use is reduced and barriers to access introduced. In
addition, there is the potential for rising prices as costs are passed onto the consumer.
Subsequently, the Minister of Economic Opportunities and the Western Cape government
have voiced concern over the content of the bill while some academic observers have
suggested it anti-competitive.234235
Emerging financial technology providers are subject to stringent regulation however
regulatory bodies are investigating potential alternatives. South Africa is recognised for a
world class financial services sector. This is underpinned by sophisticated and comprehensive
regulation which is overseen by effective regulatory bodies. ‘Fintechs’ are often agile firms
that emerge independently of incumbent financial services players. These businesses use
technology in innovative and disruptive ways to reduce the cost of and expand access to
financial services. The South African Reserve Bank (SARB) and associated regulators have
adopted a cautious approach to regulating these firms through engagement with industry and
the establishment of a FinTech programme resourced with full-time staff. The programme –
which runs parallel to the Inter-Governmental Fintech Working Group, National Treasury and
a potential regulatory sandbox for experimentation – assesses the implications of Fintechs on
the stability of the sector and consumer wellbeing to develop appropriate regulatory and
policy responses236. While markets such as the UK, Australia and Kenya have developed
bespoke regulation for various fintech delivered products, these are uncommon in South
Africa. Subsequently, innovation is rife in permissible areas such as payments. However, the
stringency of foundational regulation such as the Banking Act and the National Credit Act in
combination with the lack of bespoke regulation has seen limited activity in products such as
peer-to-peer lending, mobile money and non-donation crowd-funding. Regulation relating to
these products either prohibits them outright or creates demands for compliance that
emerging businesses are unable to meet. Fintechs therefore face regulatory certainty if their
products are similar to those governed by existing regulation but face significant barriers
should their products fall outside of what is common237.
230 Charles (2018) – Hospitality industry pushes to have Airbnb regulated – Online Media - IOL 231 Vegter, (2019) – Hotel industry captures the state and targets competitors – Online Media – Daily Maverick 232 Charles (2019) – Airbnb faces tighter regulations in SA – Online Media - IOL 233 Crous. (2019) – Thresholds to be put in place, limiting amounts of bookable days in South African Airbnbs – Online Media – Traveller24 234 702 (2019) – Airbnb regulations are anti-competitive – TUT lecturer – Online Media – 702 236 Da Silva (2019). South Africa Lays Groundwork for FinTech Regulation 237 AlphaCode (2019) – Navigating Regulation to Achieve Innovation – Online Media – AlphaCode
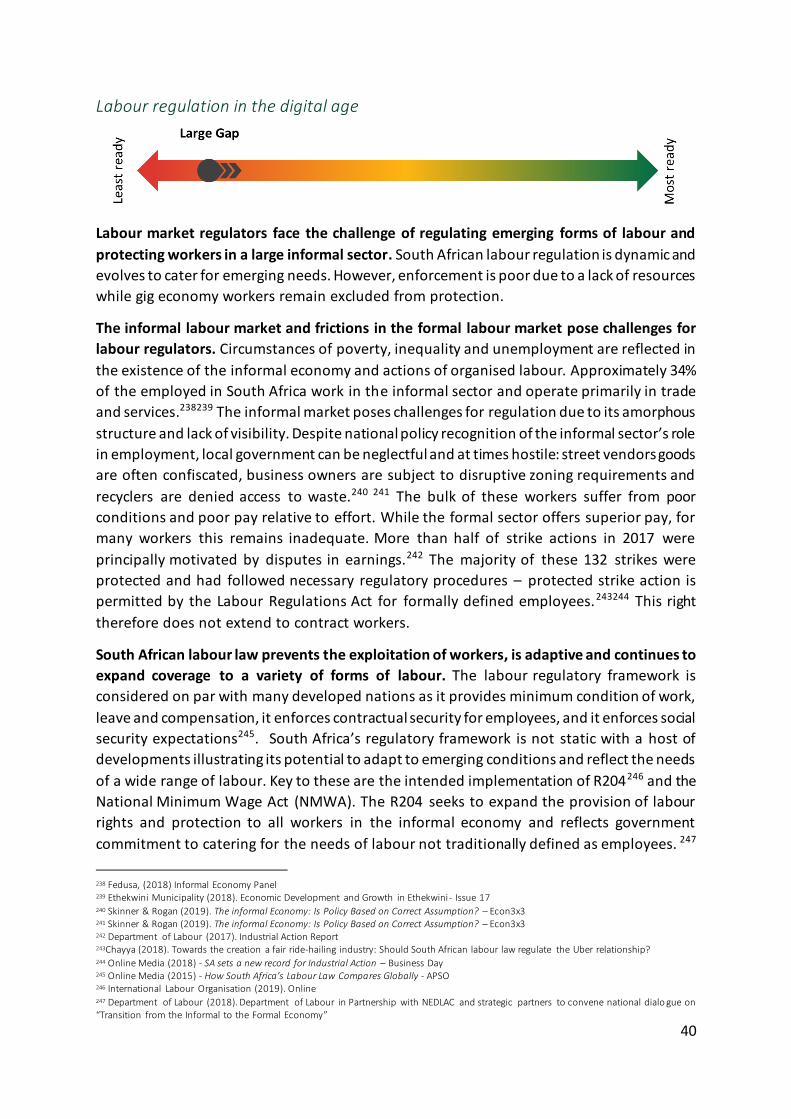
40
Labour regulation in the digital age
Labour market regulators face the challenge of regulating emerging forms of labour and
protecting workers in a large informal sector. South African labour regulation is dynamic and
evolves to cater for emerging needs. However, enforcement is poor due to a lack of resources
while gig economy workers remain excluded from protection.
The informal labour market and frictions in the formal labour market pose challenges for
labour regulators. Circumstances of poverty, inequality and unemployment are reflected in
the existence of the informal economy and actions of organised labour. Approximately 34%
of the employed in South Africa work in the informal sector and operate primarily in trade
and services.238239 The informal market poses challenges for regulation due to its amorphous
structure and lack of visibility. Despite national policy recognition of the informal sector’s role
in employment, local government can be neglectful and at times hostile: street vendors goods
are often confiscated, business owners are subject to disruptive zoning requirements and
recyclers are denied access to waste.240 241 The bulk of these workers suffer from poor
conditions and poor pay relative to effort. While the formal sector offers superior pay, for
many workers this remains inadequate. More than half of strike actions in 2017 were
principally motivated by disputes in earnings.242 The majority of these 132 strikes were
protected and had followed necessary regulatory procedures – protected strike action is
permitted by the Labour Regulations Act for formally defined employees.243244 This right
therefore does not extend to contract workers.
South African labour law prevents the exploitation of workers, is adaptive and continues to
expand coverage to a variety of forms of labour. The labour regulatory framework is
considered on par with many developed nations as it provides minimum condition of work,
leave and compensation, it enforces contractual security for employees, and it enforces social
security expectations245. South Africa’s regulatory framework is not static with a host of
developments illustrating its potential to adapt to emerging conditions and reflect the needs
of a wide range of labour. Key to these are the intended implementation of R204246 and the
National Minimum Wage Act (NMWA). The R204 seeks to expand the provision of labour
rights and protection to all workers in the informal economy and reflects government
commitment to catering for the needs of labour not traditionally defined as employees. 247
238 Fedusa, (2018) Informal Economy Panel 239 Ethekwini Municipality (2018). Economic Development and Growth in Ethekwini- Issue 17 240 Skinner & Rogan (2019). The informal Economy: Is Policy Based on Correct Assumption? – Econ3x3 241 Skinner & Rogan (2019). The informal Economy: Is Policy Based on Correct Assumption? – Econ3x3 242 Department of Labour (2017). Industrial Action Report 243Chayya (2018). Towards the creation a fair ride-hailing industry: Should South African labour law regulate the Uber relationship? 244 Online Media (2018) - SA sets a new record for Industrial Action – Business Day 245 Online Media (2015) - How South Africa’s Labour Law Compares Globally - APSO 246 International Labour Organisation (2019). Online 247 Department of Labour (2018). Department of Labour in Partnership with NEDLAC and strategic partners to convene national dialo gue on “Transition from the Informal to the Formal Economy”
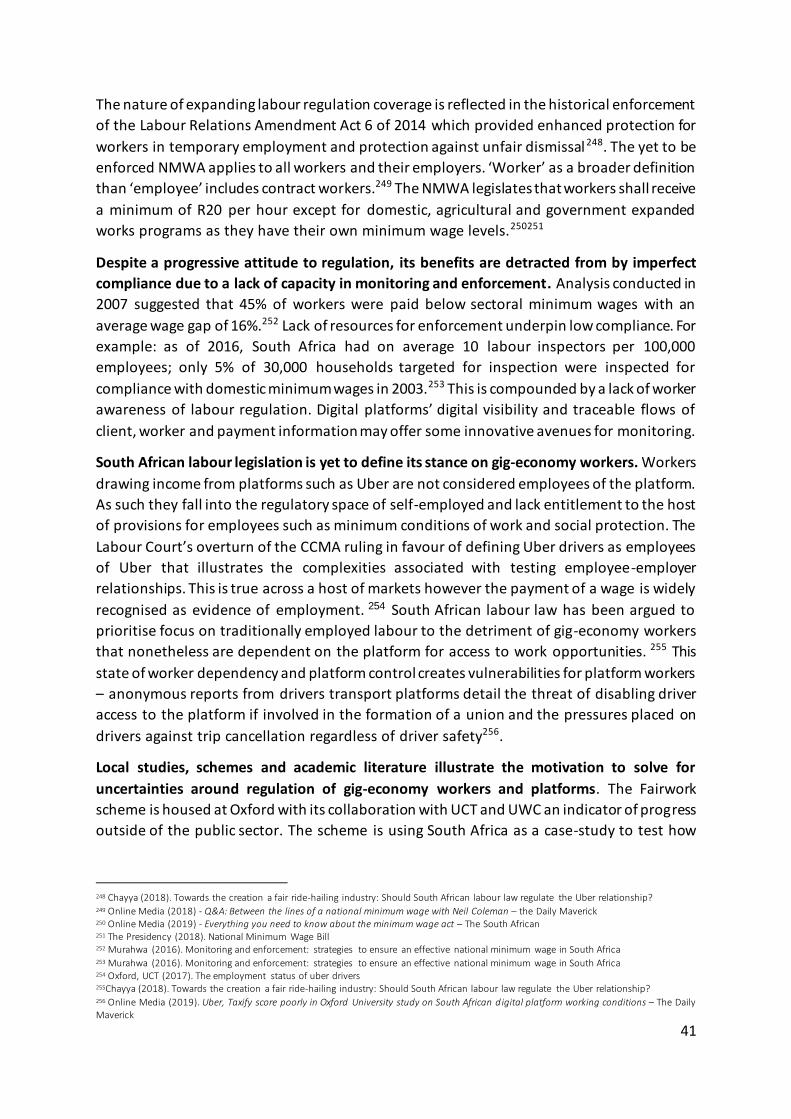
41
The nature of expanding labour regulation coverage is reflected in the historical enforcement
of the Labour Relations Amendment Act 6 of 2014 which provided enhanced protection for
workers in temporary employment and protection against unfair dismissal248. The yet to be
enforced NMWA applies to all workers and their employers. ‘Worker’ as a broader definition
than ‘employee’ includes contract workers.249 The NMWA legislates that workers shall receive
a minimum of R20 per hour except for domestic, agricultural and government expanded
works programs as they have their own minimum wage levels.250251
Despite a progressive attitude to regulation, its benefits are detracted from by imperfect
compliance due to a lack of capacity in monitoring and enforcement. Analysis conducted in
2007 suggested that 45% of workers were paid below sectoral minimum wages with an
average wage gap of 16%.252 Lack of resources for enforcement underpin low compliance. For
example: as of 2016, South Africa had on average 10 labour inspectors per 100,000
employees; only 5% of 30,000 households targeted for inspection were inspected for
compliance with domestic minimum wages in 2003.253 This is compounded by a lack of worker
awareness of labour regulation. Digital platforms’ digital visibility and traceable flows of
client, worker and payment information may offer some innovative avenues for monitoring.
South African labour legislation is yet to define its stance on gig-economy workers. Workers
drawing income from platforms such as Uber are not considered employees of the platform.
As such they fall into the regulatory space of self-employed and lack entitlement to the host
of provisions for employees such as minimum conditions of work and social protection. The
Labour Court’s overturn of the CCMA ruling in favour of defining Uber drivers as employees
of Uber that illustrates the complexities associated with testing employee-employer
relationships. This is true across a host of markets however the payment of a wage is widely
recognised as evidence of employment. 254 South African labour law has been argued to
prioritise focus on traditionally employed labour to the detriment of gig-economy workers
that nonetheless are dependent on the platform for access to work opportunities. 255 This
state of worker dependency and platform control creates vulnerabilities for platform workers
– anonymous reports from drivers transport platforms detail the threat of disabling driver
access to the platform if involved in the formation of a union and the pressures placed on
drivers against trip cancellation regardless of driver safety256.
Local studies, schemes and academic literature illustrate the motivation to solve for
uncertainties around regulation of gig-economy workers and platforms. The Fairwork
scheme is housed at Oxford with its collaboration with UCT and UWC an indicator of progress
outside of the public sector. The scheme is using South Africa as a case-study to test how
248 Chayya (2018). Towards the creation a fair ride-hailing industry: Should South African labour law regulate the Uber relationship? 249 Online Media (2018) - Q&A: Between the lines of a national minimum wage with Neil Coleman – the Daily Maverick 250 Online Media (2019) - Everything you need to know about the minimum wage act – The South African 251 The Presidency (2018). National Minimum Wage Bill 252 Murahwa (2016). Monitoring and enforcement: strategies to ensure an effective national minimum wage in South Africa 253 Murahwa (2016). Monitoring and enforcement: strategies to ensure an effective national minimum wage in South Africa 254 Oxford, UCT (2017). The employment status of uber drivers 255Chayya (2018). Towards the creation a fair ride-hailing industry: Should South African labour law regulate the Uber relationship? 256 Online Media (2019). Uber, Taxify score poorly in Oxford University study on South African d igital platform working conditions – The Daily Maverick
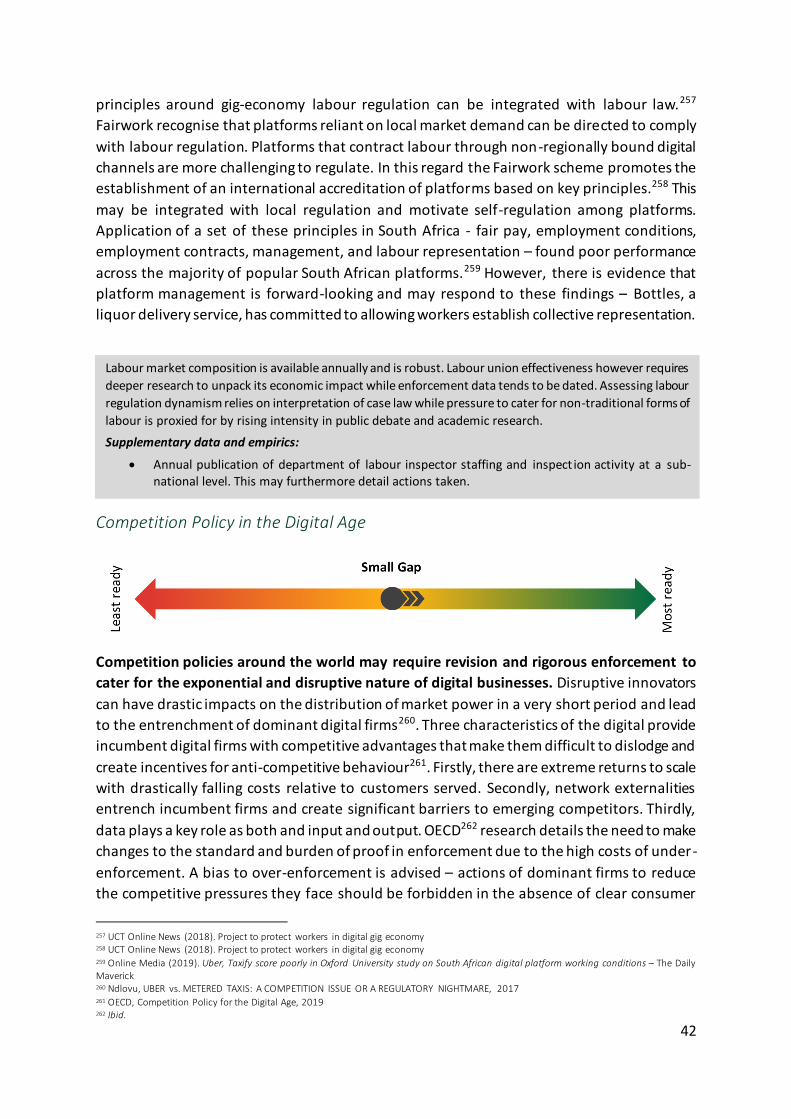
42
principles around gig-economy labour regulation can be integrated with labour law.257
Fairwork recognise that platforms reliant on local market demand can be directed to comply
with labour regulation. Platforms that contract labour through non-regionally bound digital
channels are more challenging to regulate. In this regard the Fairwork scheme promotes the
establishment of an international accreditation of platforms based on key principles.258 This
may be integrated with local regulation and motivate self-regulation among platforms.
Application of a set of these principles in South Africa - fair pay, employment conditions,
employment contracts, management, and labour representation – found poor performance
across the majority of popular South African platforms.259 However, there is evidence that
platform management is forward-looking and may respond to these findings – Bottles, a
liquor delivery service, has committed to allowing workers establish collective representation.
Competition Policy in the Digital Age
Competition policies around the world may require revision and rigorous enforcement to
cater for the exponential and disruptive nature of digital businesses. Disruptive innovators
can have drastic impacts on the distribution of market power in a very short period and lead
to the entrenchment of dominant digital firms260. Three characteristics of the digital provide
incumbent digital firms with competitive advantages that make them difficult to dislodge and
create incentives for anti-competitive behaviour261. Firstly, there are extreme returns to scale
with drastically falling costs relative to customers served. Secondly, network externalities
entrench incumbent firms and create significant barriers to emerging competitors. Thirdly,
data plays a key role as both and input and output. OECD262 research details the need to make
changes to the standard and burden of proof in enforcement due to the high costs of under-
enforcement. A bias to over-enforcement is advised – actions of dominant firms to reduce
the competitive pressures they face should be forbidden in the absence of clear consumer
257 UCT Online News (2018). Project to protect workers in digital gig economy 258 UCT Online News (2018). Project to protect workers in digital gig economy 259 Online Media (2019). Uber, Taxify score poorly in Oxford University study on South African digital platform working conditions – The Daily Maverick 260 Ndlovu, UBER vs. METERED TAXIS: A COMPETITION ISSUE OR A REGULATORY NIGHTMARE, 2017 261 OECD, Competition Policy for the Digital Age, 2019 262 Ibid.
Labour market composition is available annually and is robust. Labour union effectiveness however requires
deeper research to unpack its economic impact while enforcement data tends to be dated. Assessing labour
regulation dynamism relies on interpretation of case law while pressure to cater for non-traditional forms of
labour is proxied for by rising intensity in public debate and academic research.
Supplementary data and empirics:
Annual publication of department of labour inspector staffing and inspect ion activity at a sub-national level. This may furthermore detail actions taken.
43
welfare gains even if consumer harm is difficult to clearly measure; in highly concentrated
markets with high barriers to entry it may be necessary to require incumbent firms prove their
actions pro-competitive.
Competition commissions need to play an increasingly active role in the oversight of
markets. Given the dynamism of digital firms, the uncertain impacts they may have on
competition and consumer welfare and range of markets they can impact, i t is increasingly
necessary for competition commissions to conduct inquiries into markets in which these firms
operate on a case by case basis263. This acknowledges the peculiarities of emerging digital
firms whereby the blanket application of regulation may unfairly discriminate against
innovating firms to the detriment of consumers. These agencies will need to interject when
appropriate and investigate when necessary.264
South African competition policy and its enforcement is of a high quality and has
contributed to an environment that motivates innovation. The Competition Act of 1998 is
the bedrock legislation governing competition policy and law in South Africa. The Act seeks
to promote efficient and competitive markets that guard consumers, achieve social and
economic welfare gains and provide businesses of all sizes with equitable opportunity to
compete265. The act saw the establishment of The Competition Commission of South Africa
(CCSA), Competition Tribunal and Competition Appeal Court. entities in the oversight of South
African markets. These three entities have been largely effective in achieving their mandate.
A novel study by Truen and Rateiwa of demonstrates the relationship between innovation
and growth in South Africa and then confirms that competition policy and the actions of the
CCSA have had positive impact on the extent of innovation and contributed to an
environment that stimulates firms to innovate266.
Amendments to the competition act improve the CCSA’s ability to monitor and regulate
digital firms and the markets that they disrupt. The Competition Amendment Bill was
recently signed into law. The Bill strengthens the CCSAs powers in terms of market inquiries
and the ability to involve itself actively in markets. The Bill empowers the CCSA to ma ke
recommendations to the Competition Tribunal and mandates the CCSA publish a report to
the minister detailing recommendations267. In addition, the burden of proof is shifting to
dominant firms to demonstrate that pricing is not anti-competitive. This action seems aligned
with the OECDs recommendations. While it is yet to be seen whether the amendments will
lead to better oversight of digital business, oversight of digital firms is not alien to the CCMA
– the SA Meter Taxi complaint against Uber as operating anti-competitively was rejected by
263 Ndlovu, UBER vs. METERED TAXIS: A COMPETITION ISSUE OR A REGULATORY NIGHTMARE, 2017 264 Ibid. 265 Competition Commission of South Africa (2019) – Online 266 Truen & Rateiwa (2017) Competition Policy and Innovation: What does evidence in South Africa Show? 267 Online Media (2019) -South Africa: What the New Competition Amendment Act Means for South Africa’s Economy -Mondaq
44
the Commission in 2016; the CCSA market inquiry into data services from 2017 to 2019
illustrates the CCSA’s ability to engage with the nuances of digital markets 268.
268 Competition Commission of South Africa (2019). Media Address on the Provisional Report of the Data Services Market Inquiry
Assessment of the condition relies on interpretation of policy changes relative to emerging best practice. The
quality and effect of South African competition draws from general sentiments and an innovative empirical study. A small set of indicators of the competition environment are available for international comparison
however these would serve as proxies.
Supplementary data and empirics:
Interviews with competition commission officials to asses self-perceived capacities and anticipated
trajectory of competition law and enforcement in South Africa.
45
Innovative Business
South Africa has a strong though under-utilised foundation for innovation and the ability to
respond to changing conditions. The Global Innovation Index (GII) uses a variety of indicators
to measure the presence of innovation inputs and outputs in a country. South Africa ranks
58th of 126 nations and first on the continent in its combined input and output score269. A
strong innovation input ranking at 48 is driven by the sophistication and maturity of its
business environment and markets and the presence of strong academic and financial
institutions. These inputs are being transformed into innovation outputs. For example,
product and process innovations exceed continental averages while patents per person are
higher than regional competitors and markets of comparable income270271272. Although
impressive, South Africa’s strong foundation for innovation is not being leveraged to its full
capacity – South Africa’s GII output score ranks 17 places lower than its input score, South
Africa’s ratio of technology imports to exports is most severe in high technology areas, and
total factor productivity (a measure of the effective use of technology in production) has been
deteriorating273274. This pillar investigates business innovation and flexibility to unpack the
mechanisms that unlock business innovation.
This category looks at access to innovation finance and conditions that make innovation
finance effective. These together come to create an environment where new products,
processes and business models are conceptualised and have the opportunity to be tested and
scaled. The pillar is broken into four clusters. The first cluster, innovative finance, measures
the availability and effectiveness of innovation finance in four key areas: firstly, start-up and
early stage finance for emerging business; secondly the availability of finance for established
business through the banking sector and capital markets; thirdly business investment in R&D;
and finally government investment in R&D and tax incentives facilitating private R&D
investment. An Accenture report found that companies that are leaders in innovation enjoy
an average of 42% return to innovation investment - 3 times higher than market averages275.
The subsequent conditions measure aspects of innovative business that facilitate productivity
in innovation investments and avoids wastage. The second cluster, non-financial investment
support firstly reviews the South African start-up ecosystem and secondly assess the state of
between business collaboration and cooperation. The third cluster, innovation culture
measures business affinity to and process around innovation. This firstly assesses the state of
innovation in South African entrepreneurs and secondly the state of innovation culture in
South African corporates. The final cluster - access to and adoption of digital technology - is
measured for emerging and established businesses.
269 WIPO (2018) Global Innovation Index. 270 WEF (2018) Global Information Technology Report. 271 GEDI (2017). The Entrepreneurial Ecosystem of South Africa: A strategy for Global Leadership 272 HSRC (2008). South Africa Innovation Survey Main Results 273 Department Science & Technology, NACI (2017). South African Science, Technology and Innovation Indicators. 274 World Bank (2017) South African Economic Update: Innovation for Productivity and Inclusiveness 275 Accenture (2016). SA Companies slow to innovate, Shows Accenture Innovation Index – Online report
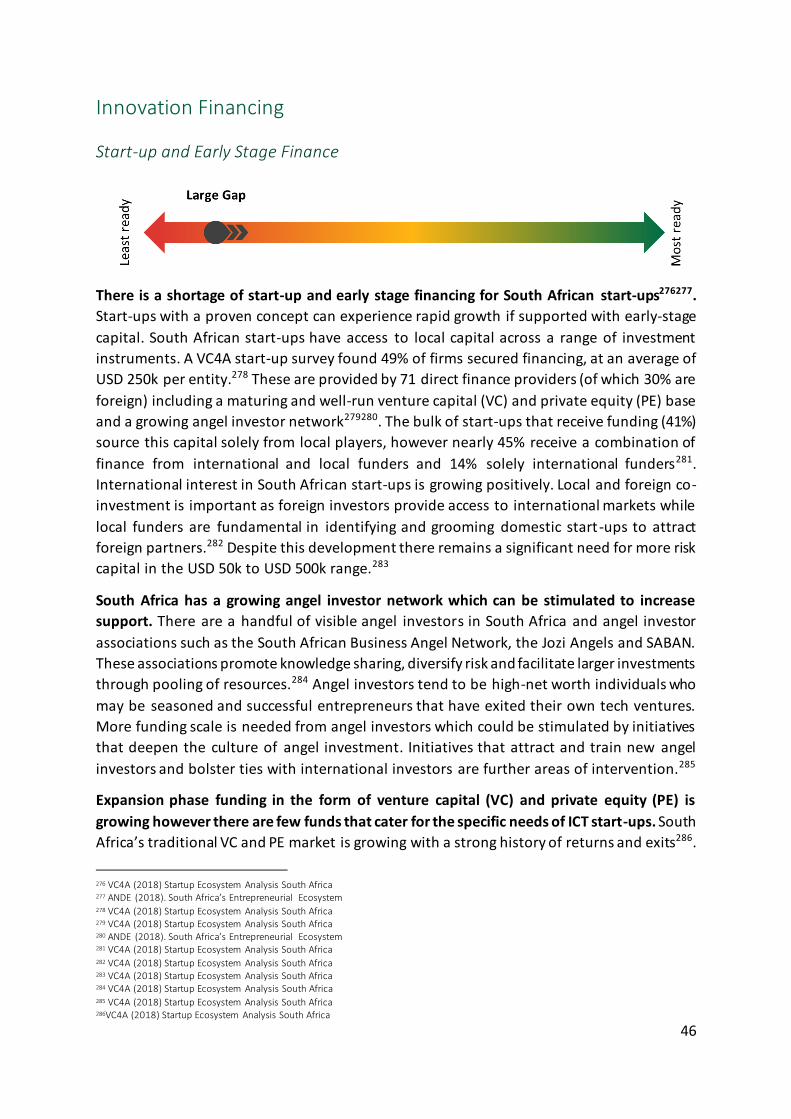
46
Innovation Financing
Start-up and Early Stage Finance
There is a shortage of start-up and early stage financing for South African start-ups276277.
Start-ups with a proven concept can experience rapid growth if supported with early-stage
capital. South African start-ups have access to local capital across a range of investment
instruments. A VC4A start-up survey found 49% of firms secured financing, at an average of
USD 250k per entity.278 These are provided by 71 direct finance providers (of which 30% are
foreign) including a maturing and well-run venture capital (VC) and private equity (PE) base
and a growing angel investor network279280. The bulk of start-ups that receive funding (41%)
source this capital solely from local players, however nearly 45% receive a combination of
finance from international and local funders and 14% solely international funders281.
International interest in South African start-ups is growing positively. Local and foreign co-
investment is important as foreign investors provide access to international markets while
local funders are fundamental in identifying and grooming domestic start-ups to attract
foreign partners.282 Despite this development there remains a significant need for more risk
capital in the USD 50k to USD 500k range.283
South Africa has a growing angel investor network which can be stimulated to increase
support. There are a handful of visible angel investors in South Africa and angel investor
associations such as the South African Business Angel Network, the Jozi Angels and SABAN.
These associations promote knowledge sharing, diversify risk and facilitate larger investments
through pooling of resources.284 Angel investors tend to be high-net worth individuals who
may be seasoned and successful entrepreneurs that have exited their own tech ventures.
More funding scale is needed from angel investors which could be stimulated by initiatives
that deepen the culture of angel investment. Initiatives that attract and train new angel
investors and bolster ties with international investors are further areas of intervention.285
Expansion phase funding in the form of venture capital (VC) and private equity (PE) is
growing however there are few funds that cater for the specific needs of ICT start-ups. South
Africa’s traditional VC and PE market is growing with a strong history of returns and exits286.
276 VC4A (2018) Startup Ecosystem Analysis South Africa 277 ANDE (2018). South Africa’s Entrepreneurial Ecosystem 278 VC4A (2018) Startup Ecosystem Analysis South Africa 279 VC4A (2018) Startup Ecosystem Analysis South Africa 280 ANDE (2018). South Africa’s Entrepreneurial Ecosystem 281 VC4A (2018) Startup Ecosystem Analysis South Africa 282 VC4A (2018) Startup Ecosystem Analysis South Africa 283 VC4A (2018) Startup Ecosystem Analysis South Africa 284 VC4A (2018) Startup Ecosystem Analysis South Africa 285 VC4A (2018) Startup Ecosystem Analysis South Africa 286VC4A (2018) Startup Ecosystem Analysis South Africa
47
Access to VC funding is considered above global averages and in line with BRICS comparators
with 42% of the R1,160 million invested in 2017 considered growth capital and 57% seed and
start-up287288. The PE market has grown at a 9.4% CAGR since 1994 to reach R158.6 million in
funds under management in 2017289. Nearly 30% of PE investments were targeted at start-up
and early-stage firms while 27.5% focus on expansion. There are only a handful of players
dedicated to ICT and technology who have a grounded understanding of the specific needs of
these kinds of businesses. RaizCorp incubate nearly 3,000 entrepreneurs a year and have seed
funding available following POC while Cortex Logic is introducing a VC arm and developing a
network of service providers by taking partial ownership of and nurturing emerging
technology business.290
Despite these opportunities, the VC industry remains nascent while entrepreneurs remain
relatively unsophisticated and struggle to motivate for and secure funding. Start-up and
early stage funding would be bolstered significantly through government and donor
investment in the VC sector as well as increased interest from institutional funders 291. This
may increase availability of Round B funding and improve what tends to be an illiquid market
with relatively few exits292. Support can furthermore be provided to entrepreneurs seeking to
source start-up finance. The bulk of entrepreneurs approaching VC and angel finance are ‘first
rounders’ who lack skills in pitching and deter investors through unrealistic expectations and
valuations, insufficiently developed growth strategies, and a lack of detailed competitor and
market analysis which recognise the global scale of markets.293
Alternative financing sources are gaining traction and offer an innovative solution to the
finance shortfall. Crowdfunding platforms have emerged as possible sources of working and
growth capital for SMEs regardless of the regulatory uncertainty around them. The People’s
Fund targets black owned business and has raised over R1.5 million for 12 campaigns. This
includes MySurfer – a provider of low-cost internet access solutions – that required capital to
install wireless access in 175 buildings and have since been successfully paying out investors.
The People’s Fund is furthermore raising a working capital base for SMEs servicing
government that suffer from long payment leads. The nascent industry provides a much
needed (albeit costly) source of finance for SMEs. Promotion of the industry would improve
visibility for SMEs and expand coverage however this should be paired with mentorship
around the opportunities and risks of taking on alternative financing sources.
287 SAVCA (2018) Venture Capital Industry Survey 288 WEF (2017). Global Information Technology Report 289 SAVCA (2018). Private Equity Industry Report 290 World Bank (2017). South African Economic Update: Innovation for Productivity and Inclusiveness 291VC4A (2018) Startup Ecosystem Analysis South Africa 292 VC4A (2018) Startup Ecosystem Analysis South Africa 293 VC4A (2018) Startup Ecosystem Analysis South Africa
A host of surveys and market observations were used in the assessment of the condition. Surveys were
constructed by industry associations. The growth of 12J is proxied by growth in the number of registered funds.
Supplementary data and empirics:
Supplementary data should support National Treasury assessment of the funds and include the
financials and employment records of firms invested in to track impact.
48
Established Firm Finance
South Africa has a sophisticated and high quality banking sector which provides established
business with access to finance. South Africa has a world-class financial system which ranks
18 of 140 markets in its efficiency, trustworthiness and confidence.294 This quality is reflected
in the deep availability of credit, with domestic credit provided to the private sector estimated
at 144% of GDP - in line with OECD averages295. South Africa’s banking sector is a key financer
of this credit at 66% of GDP and nearly 10% above global averages296. The banking sector is
robust given its strong regulatory and legal framework and is competitive with a host of well-
established and emerging institutions. The sector’s quality is reflected in global awards. For
example, the Lafferty banking 500 benchmarks 500 global banks in terms of their quality.
South Africa graded 6th of 38 markets, with Capitec being one of eight banks to receive the
highest possible rating.
Capital markets are well developed and provide established firms with a valuable public
source of finance. South Africa’s capital markets are large relative to global benchmarks with
listed domestic companies’ market capitalisation estimated at 321% of GDP – secondly only
to Hong Kong297. South Africa subsequently ranks 25th globally in ease of raising capital
through the public sale of shares.298 The Johannesburg Stock Exchange is recognised globally
not only for its scale but also the quality of its reporting expectations of listed firms. Integrated
reporting provides investors with clear and accurate details of business operations and
financial health so as to judge their efficacy. The International Integrated Reporting Council
ranked South Africa the top performing country in this regard. While the JSE is the
cornerstone exchange, alternatives such as ZAR X and 4 Africa Exchange are slowing gaining
traction.299 These platforms broaden business access to finance by altering the stringency of
listing requirements and providing secondary listing opportunities to the JSE300.
294 WEF (2018) Global Competitiveness Index 295 World Bank (2018) 296 World Bank (2018) 297 World Bank (2018) 298 WEF (2018) Global Competitiveness Index 299 COEFS (2017) The Impact of the 4 th Industrial Revolution on the South African Financial Services Market 300 COEFS (2017) The Impact of the 4 th Industrial Revolution on the South African Financial Services Market
South Africa is well recognised for the quality of its financial system and depth of capital markets.
Internationally comparable surveys and indexes are used to demonstrate this and validated against a select
sample of awards.
49
R&D Investment
Government has set ambitious targets for GERD which has been growing in real terms since
2010 though falls short of benchmark countries. As of 2017, GERD equated 0.77% of GDP –
akin to global and Indian averages however far below top performing BRICS nations and the
OECD average of 2.5%301. Government has set ambitious targets for GERD, seeking to double
the 0.77% of GDP spent on R&D to 1.5% by 2020302.
The scale of government expenditure on R&D is competitive relative to comparators and
has been growing in real terms. Government accounted for 44.6% of gross expenditure on
R&D in 2015 – aligned with the average of a sample of 68 countries including OECD
benchmarks.303304 This share has been growing since 2013. Government prioritises spend on
sectors that provide broad national benefits such as agriculture, education and medicine.
Government expenditure on R&D has positive effects by contributing to GDP growth and
sustaining ~40,000 jobs directly and indirectly in 2012305. This is far larger than the ~3,000
direct R&D personnel employed by government in 2012, illustrating the significance of its
knock-on effects306.
Business is a key financier of R&D however spend falls short of leading innovative nations.
The business sector is a key source of investment contributing 38.9% to GERD in 2016 and
prioritising areas such as engineering, ICT and medicine.307 This places South Africa at 37 of
63 countries in business share of GERD and slightly below sample averages.308 Business
expenditure on R&D has grown in Rand terms since the impacts of the global financial crisis
waned in 2010 however business’ share of GERD has slid by 3% since 2012.309 Business spend
remains in shortage as access to finance has been noted as a common hindrance to innovation
projects.310 Innovation leading markets such as South Korea and China which have high GERD
to GDP ratios are driven by spending by the business sector311. In these markets business
contribution to GERD tends to account for over 70%312. South African business seems to be
under-investing with an R&D to sales ratio far below OECD averages.313
301 UNESCO (2018). Institute for Statistics 302 Online Media (2017). – Government Aims to Double R&D Spend by 2020 – University World News 303 HSRC (2016) South African National Survey of Research and Experimental Development 304 UNESCO (2018). Institute for Statistics 305 Perrot et. Al. (2012) Government R&D Impacts on the South African macro-economy. 306 HSRC (2016) South African National Survey of Research and Experimental Development 307 HSRC (2016) South African National Survey of Research and Experimental Development 308 UNESCO (2019). Research & Development Spending 309 HSRC (2016) South African National Survey of Research and Experimental Development 310 CLC Africa (2018). The State of Innovation Capabilities Report. 311 UNESCO (2019). Research & Development Spending 312 UNESCO (2019). Research & Development Spending 313 World Bank (2018). Innovation activity in South Africa: Measuring the Returns to R&D
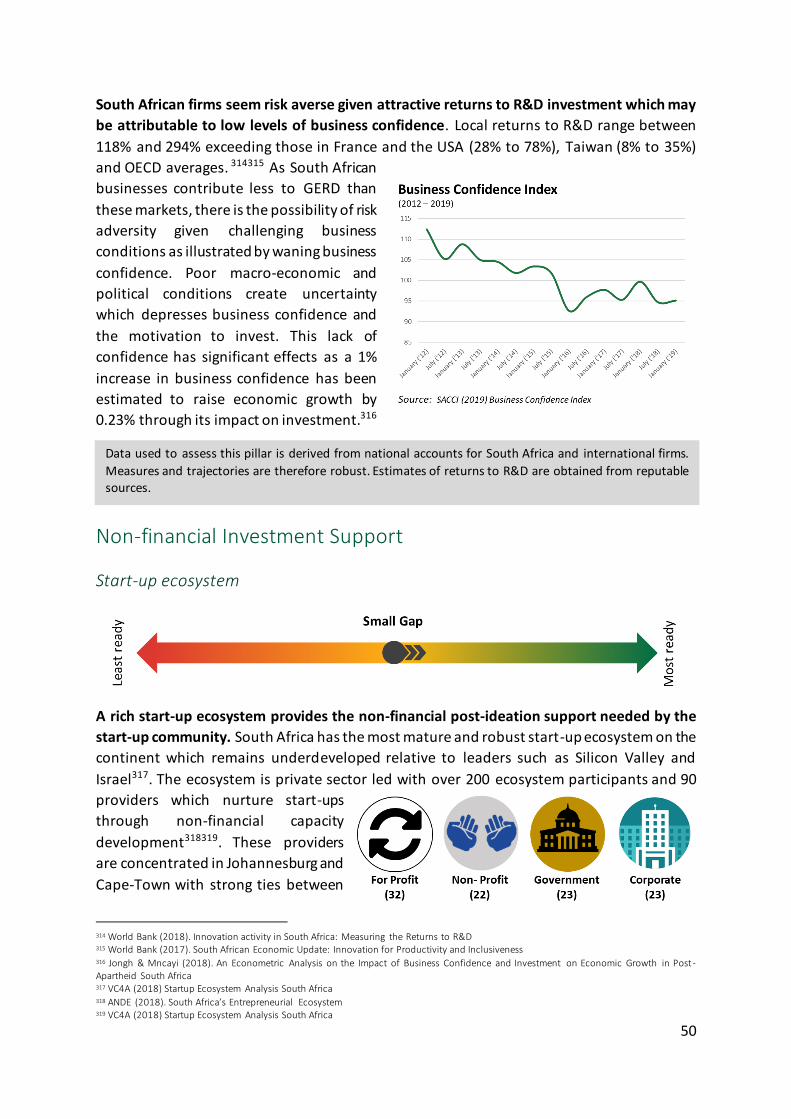
50
South African firms seem risk averse given attractive returns to R&D investment which may
be attributable to low levels of business confidence. Local returns to R&D range between
118% and 294% exceeding those in France and the USA (28% to 78%), Taiwan (8% to 35%)
and OECD averages. 314315 As South African
businesses contribute less to GERD than
these markets, there is the possibility of risk
adversity given challenging business
conditions as illustrated by waning business
confidence. Poor macro-economic and
political conditions create uncertainty
which depresses business confidence and
the motivation to invest. This lack of
confidence has significant effects as a 1%
increase in business confidence has been
estimated to raise economic growth by
0.23% through its impact on investment.316
Non-financial Investment Support
Start-up ecosystem
A rich start-up ecosystem provides the non-financial post-ideation support needed by the
start-up community. South Africa has the most mature and robust start-up ecosystem on the
continent which remains underdeveloped relative to leaders such as Silicon Valley and
Israel317. The ecosystem is private sector led with over 200 ecosystem participants and 90
providers which nurture start-ups
through non-financial capacity
development318319. These providers
are concentrated in Johannesburg and
Cape-Town with strong ties between
314 World Bank (2018). Innovation activity in South Africa: Measuring the Returns to R&D 315 World Bank (2017). South African Economic Update: Innovation for Productivity and Inclusiveness 316 Jongh & Mncayi (2018). An Econometric Analysis on the Impact of Business Confidence and Investment on Economic Growth in Post-Apartheid South Africa 317 VC4A (2018) Startup Ecosystem Analysis South Africa 318 ANDE (2018). South Africa’s Entrepreneurial Ecosystem 319 VC4A (2018) Startup Ecosystem Analysis South Africa
Data used to assess this pillar is derived from national accounts for South Africa and international firms.
Measures and trajectories are therefore robust. Estimates of returns to R&D are obtained from reputable sources.
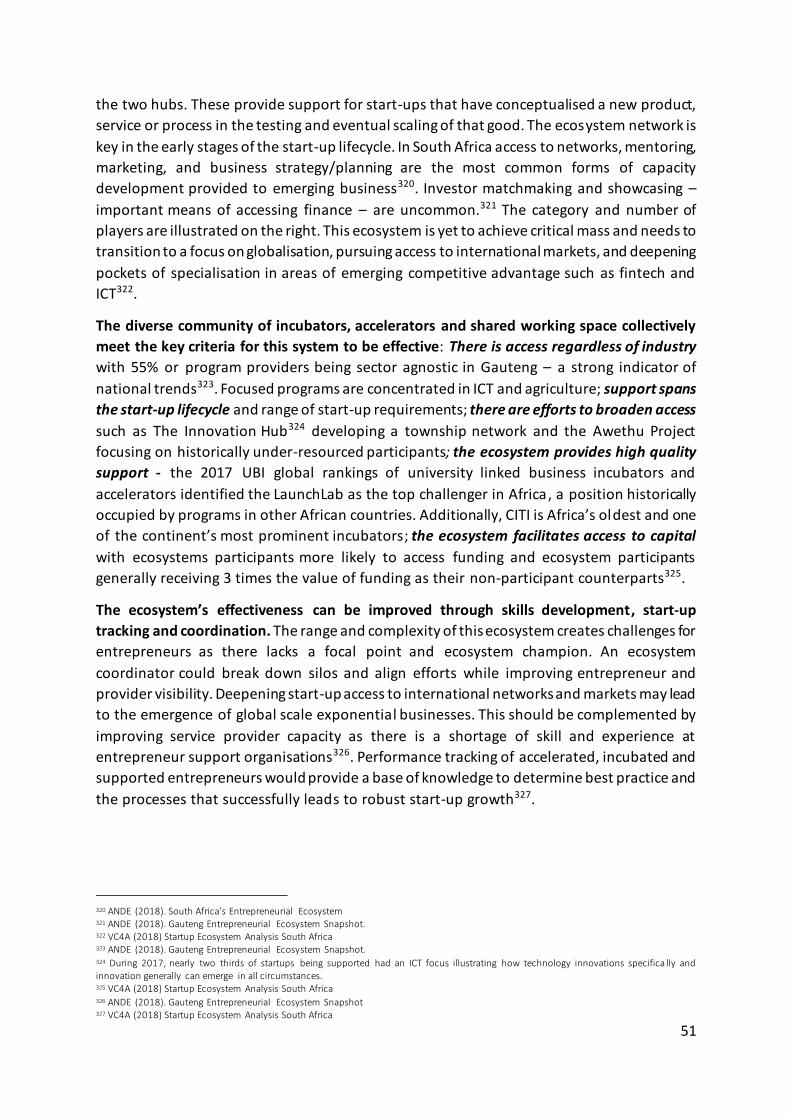
51
the two hubs. These provide support for start-ups that have conceptualised a new product,
service or process in the testing and eventual scaling of that good. The ecosystem network is
key in the early stages of the start-up lifecycle. In South Africa access to networks, mentoring,
marketing, and business strategy/planning are the most common forms of capacity
development provided to emerging business320. Investor matchmaking and showcasing –
important means of accessing finance – are uncommon.321 The category and number of
players are illustrated on the right. This ecosystem is yet to achieve critical mass and needs to
transition to a focus on globalisation, pursuing access to international markets, and deepening
pockets of specialisation in areas of emerging competitive advantage such as fintech and
ICT322.
The diverse community of incubators, accelerators and shared working space collectively
meet the key criteria for this system to be effective: There is access regardless of industry
with 55% or program providers being sector agnostic in Gauteng – a strong indicator of
national trends323. Focused programs are concentrated in ICT and agriculture; support spans
the start-up lifecycle and range of start-up requirements; there are efforts to broaden access
such as The Innovation Hub324 developing a township network and the Awethu Project
focusing on historically under-resourced participants; the ecosystem provides high quality
support - the 2017 UBI global rankings of university linked business incubators and
accelerators identified the LaunchLab as the top challenger in Africa, a position historically
occupied by programs in other African countries. Additionally, CITI is Africa’s oldest and one
of the continent’s most prominent incubators; the ecosystem facilitates access to capital
with ecosystems participants more likely to access funding and ecosystem participants
generally receiving 3 times the value of funding as their non-participant counterparts325.
The ecosystem’s effectiveness can be improved through skills development, start-up
tracking and coordination. The range and complexity of this ecosystem creates challenges for
entrepreneurs as there lacks a focal point and ecosystem champion. An ecosystem
coordinator could break down silos and align efforts while improving entrepreneur and
provider visibility. Deepening start-up access to international networks and markets may lead
to the emergence of global scale exponential businesses. This should be complemented by
improving service provider capacity as there is a shortage of skill and experience at
entrepreneur support organisations326. Performance tracking of accelerated, incubated and
supported entrepreneurs would provide a base of knowledge to determine best practice and
the processes that successfully leads to robust start-up growth327.
320 ANDE (2018). South Africa’s Entrepreneurial Ecosystem 321 ANDE (2018). Gauteng Entrepreneurial Ecosystem Snapshot. 322 VC4A (2018) Startup Ecosystem Analysis South Africa 323 ANDE (2018). Gauteng Entrepreneurial Ecosystem Snapshot. 324 During 2017, nearly two thirds of startups being supported had an ICT focus illustrating how technology innovations specifica lly and innovation generally can emerge in all circumstances. 325 VC4A (2018) Startup Ecosystem Analysis South Africa 326 ANDE (2018). Gauteng Entrepreneurial Ecosystem Snapshot 327 VC4A (2018) Startup Ecosystem Analysis South Africa
52
Open Architecture
Appetite for collaboration between emerging and established businesses drive knowledge
diffusion however challenges to engagement remain. At nearly 90% of surveyed firms, South
African corporates have a keen desire to collaborate with emerging business, are intent on
learning from competing firms, service providers and academic institutions and rank 28 of
119 countries in collaboration between industry and academia328329330 South Africa
subsequently ranks 59 of 126 countries in innovation linkages.331 Both emerging and
established firms that are strong collaborators achieve higher levels of reported revenue
growth – effective collaboration could raise SMME revenues by between 3% and 18% and
established firm revenues by between 3% and 7%332. However two points of friction remain:
entrepreneurs have the perception that corporates are limited in their culture of
entrepreneurship; large companies consider themselves committed to collaboration with
entrepreneurs however entrepreneurs do not consider these large companies truly
committed.333 In select circumstances cooperation has seen emerging firms embed
themselves in larger corporations, the benefits of which are often diffused within the
institution.
Innovation platforms that deepen links between emerging and corporate businesses are
quickly being realised as key sources of co-creation and ideation. The majority of surveyed
innovation leaders believe these platforms are core to business idea generation Dimension
Data’s collaboration with Silicon Cape seeks to improve entrepreneur knowledge of and
comfort with collaboration and a platform for new thinking. This process is indicative of the
rising value innovation leaders place in innovation networks and key to sensitising both
players to the others’ cultural norms and expectations.334 Open innovation platforms such as
Zindi, Openix and the NTT Data Open Innovation Contest are gaining traction. These processes
reflect business engagement with opening institution data architectures. The challenges of
doing so are largest for incumbent firms with legacy infrastructure. However the use of APIs
is increasingly common while a number of established entities (such as Standard Bank for
example), are migrating to modern digital platforms that enable the efficient and safe flow of
information within the business and with other businesses. While innovation platforms are
328 WEF (2018), Global Competitiveness Report 329 Accenture. (2016). Harnessing the Power of Open Innovation through Digital Collaboration – a $12 billion Opportunity for South Africa. 330 PWC (2017). Global Digital IQ Survey. 331 WEF (2018). Global Innovation Index 332 Accenture (2016). Harnessing the Power of Open Innovation through Digital Collaboration – a $12 billion Opportunity for South Africa. 333 Accenture (2016). Harnessing the Power of Open Innovation through Digital Collaboration – a $12 billion Opportunity for South Africa. 334 Accenture (2016). SA Companies slow to innovate, Shows Accenture Innovation Index – Online report
The assessment drew on industry reports and research conducted by a renowned multi-national entity that
conducts research on and advocates for entrepreneurs. Findings are a strongly guided interpretation of
available anecdotal evidence regarding the scale and perceived quality of the ecosystem.
Supplementary data and empirics:
Co-creation with incubators of an annual performance and trajectory tracker for incubated and accelerated businesses. This should further detail the nature and extent of support provided and
business perceptions of the role the incubation program had in their failure/success.
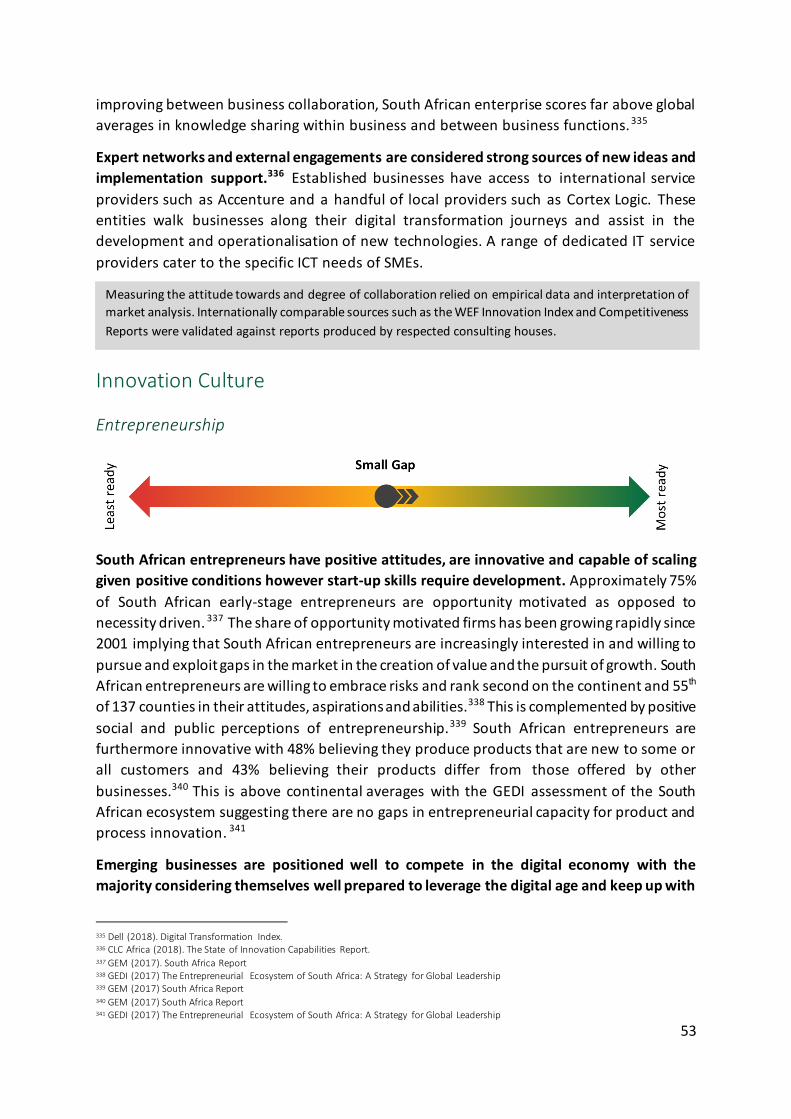
53
improving between business collaboration, South African enterprise scores far above global
averages in knowledge sharing within business and between business functions.335
Expert networks and external engagements are considered strong sources of new ideas and
implementation support.336 Established businesses have access to international service
providers such as Accenture and a handful of local providers such as Cortex Logic. These
entities walk businesses along their digital transformation journeys and assist in the
development and operationalisation of new technologies. A range of dedicated IT service
providers cater to the specific ICT needs of SMEs.
Innovation Culture
Entrepreneurship
South African entrepreneurs have positive attitudes, are innovative and capable of scaling
given positive conditions however start-up skills require development. Approximately 75%
of South African early-stage entrepreneurs are opportunity motivated as opposed to
necessity driven. 337 The share of opportunity motivated firms has been growing rapidly since
2001 implying that South African entrepreneurs are increasingly interested in and willing to
pursue and exploit gaps in the market in the creation of value and the pursuit of growth. South
African entrepreneurs are willing to embrace risks and rank second on the continent and 55th
of 137 counties in their attitudes, aspirations and abilities.338 This is complemented by positive
social and public perceptions of entrepreneurship.339 South African entrepreneurs are
furthermore innovative with 48% believing they produce products that are new to some or
all customers and 43% believing their products differ from those offered by other
businesses.340 This is above continental averages with the GEDI assessment of the South
African ecosystem suggesting there are no gaps in entrepreneurial capacity for product and
process innovation. 341
Emerging businesses are positioned well to compete in the digital economy with the
majority considering themselves well prepared to leverage the digital age and keep up with
335 Dell (2018). Digital Transformation Index. 336 CLC Africa (2018). The State of Innovation Capabilities Report. 337 GEM (2017). South Africa Report 338 GEDI (2017) The Entrepreneurial Ecosystem of South Africa: A Strategy for Global Leadership 339 GEM (2017) South Africa Report 340 GEM (2017) South Africa Report 341 GEDI (2017) The Entrepreneurial Ecosystem of South Africa: A Strategy for Global Leadership
Measuring the attitude towards and degree of collaboration relied on empirical data and interpretation of
market analysis. Internationally comparable sources such as the WEF Innovation Index and Competitiveness
Reports were validated against reports produced by respected consulting houses.
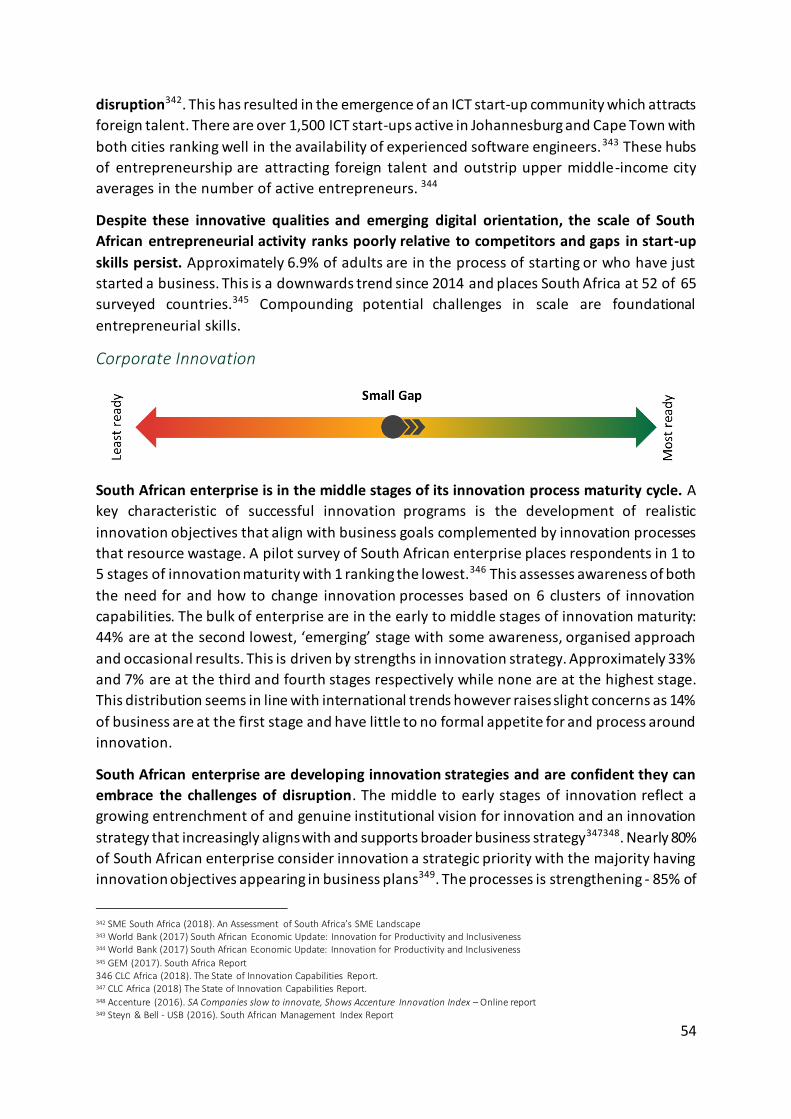
54
disruption342. This has resulted in the emergence of an ICT start-up community which attracts
foreign talent. There are over 1,500 ICT start-ups active in Johannesburg and Cape Town with
both cities ranking well in the availability of experienced software engineers.343 These hubs
of entrepreneurship are attracting foreign talent and outstrip upper middle-income city
averages in the number of active entrepreneurs. 344
Despite these innovative qualities and emerging digital orientation, the scale of South
African entrepreneurial activity ranks poorly relative to competitors and gaps in start-up
skills persist. Approximately 6.9% of adults are in the process of starting or who have just
started a business. This is a downwards trend since 2014 and places South Africa at 52 of 65
surveyed countries.345 Compounding potential challenges in scale are foundational
entrepreneurial skills.
Corporate Innovation
South African enterprise is in the middle stages of its innovation process maturity cycle. A
key characteristic of successful innovation programs is the development of realistic
innovation objectives that align with business goals complemented by innovation processes
that resource wastage. A pilot survey of South African enterprise places respondents in 1 to
5 stages of innovation maturity with 1 ranking the lowest.346 This assesses awareness of both
the need for and how to change innovation processes based on 6 clusters of innovation
capabilities. The bulk of enterprise are in the early to middle stages of innovation maturity:
44% are at the second lowest, ‘emerging’ stage with some awareness, organised approach
and occasional results. This is driven by strengths in innovation strategy. Approximately 33%
and 7% are at the third and fourth stages respectively while none are at the highest stage.
This distribution seems in line with international trends however raises slight concerns as 14%
of business are at the first stage and have little to no formal appetite for and process around
innovation.
South African enterprise are developing innovation strategies and are confident they can
embrace the challenges of disruption. The middle to early stages of innovation reflect a
growing entrenchment of and genuine institutional vision for innovation and an innovation
strategy that increasingly aligns with and supports broader business strategy347348. Nearly 80%
of South African enterprise consider innovation a strategic priority with the majority having
innovation objectives appearing in business plans349. The processes is strengthening - 85% of
342 SME South Africa (2018). An Assessment of South Africa’s SME Landscape 343 World Bank (2017) South African Economic Update: Innovation for Productivity and Inclusiveness 344 World Bank (2017) South African Economic Update: Innovation for Productivity and Inclusiveness 345 GEM (2017). South Africa Report 346 CLC Africa (2018). The State of Innovation Capabilities Report. 347 CLC Africa (2018) The State of Innovation Capabilities Report. 348 Accenture (2016). SA Companies slow to innovate, Shows Accenture Innovation Index – Online report 349 Steyn & Bell - USB (2016). South African Management Index Report
55
Accenture surveyed firms are deploying dedicated innovation teams while a manager survey
found 97% consider innovation an opportunity350. Regardless of the presence of laggards in
the cultural readiness for innovation, business is generally confident that it will be able to
meet changing customer expectations and the demand for trustworthiness. 351,352,353
Sophisticated and well-developed innovation processes are necessary to avoid investment
wastage. Companies considered superior innovators with embedded strategies and
committed programs realise nearly 3 times the returns on R&D as less effective innovators.354
Differences in innovation maturity therefore create important differences in innovation
success. This may contribute to the fact that the number of South African enterprises that
have experienced genuine bottom line growth due to investment in innovation are in the
minority355 Maturing innovation processes and culture will see the emergence of lean
innovation as a norm as opposed to an exception and the broader adoption of a fail-fast
mindset356.
South African firms having varying abilities to leverage technology in their innovation
efforts with the bulk of local firms in middle stages of digital maturity. The Dell digital
transformation index is a business level survey that evaluates a market’s digital maturity by
ranking the digital transformation performance of companies from 1 to 5 with 1 being the
lowest. South African firms fare well by global standards - 39% are in the middle or ‘evaluator’
stage with a gradual embracement of digital transformation and investment. Approximately
8% of firms are considered digital leaders at the top end – above global averages – while the
instances of digital laggards that have little to no commitment to digital transformation are
below global averages. The South African appetite for digitisation has led to some cases of
exponential business however these are far less common than in leading markets, with local
firms frequently emulating digital strategies of businesses in developed nations as opposed
to building pathways appropriate for their own organisation.357 With 23% of business at the
digital adopter stage – just before digital leader - there is a strong base of firms primed to
build on learnings from digital leaders.
South African corporate leadership have an eye for innovation and digital strategy however
more can be done to future-proof these talents Leaders in established businesses are
enabling innovation and are a key strength in established business’ innovation landscape358359
Clear leadership commitment to innovation is supporting business competitiveness, however
surveyed business suggests the innovation competencies of leaders are sometimes
inadequate and can create obstacles.360 South African CIOs and CEOs are believed to score
below continental and global averages in their perceived ability to assimilate new
350 Steyn & Bell - USB (2016). South African Management Index Report 351 PWC (2017). Global Digital IQ Survey. 352 WEF (2018). Global Innovation Index 353 Dell (2018). Digital Transformation Index. 354 Accenture (2016). SA Companies slow to innovate, Shows Accenture Innovation Index – Online report 355 Accenture (2016). SA Companies slow to innovate, Shows Accenture Innovation Index – Online report 356 Interviews with Stakeholders conducted by Genesis Analytics, June - July 2019 357 Online Media. 2019. Accenture & GIBS report of digital competitiveness 358 CLC Africa (2018). The State of Innovation Capabilities Report. 359 PWC (2017). Global Digital IQ Survey. 360 CLC Africa (2018). The State of Innovation Capabilities Report.
56
technologies into an organisation361. This translates into only 60% of managers believing top
organisational leaders have the talent to address future challenges the business will come to
face362. Uncertainty around ‘what it takes’ for digital innovations to be operationalised and
‘what these can achieve’ can create misalignment in expectations between decision makers
and service providers/ staff expected to execute on digitisation plans.363 This talent gap is
compounded by the under-development of digital leadership programs in nearly 50% of
business despite 67% of businesses considering digital leadership as at least important364.
South African enterprise are strengthening the innovative capabilities of their staff through
flexible work arrangements and on the job learning365. These functions improve staff ability
to pivot to new tasks and embed a staff-wide innovation mindset. Business access to skills are
considered a key impediment to innovation processes.366367368369. Approximately 44% of
South African enterprise believe their staff have the skills necessary to compete in the digital
economy in contrast to 65% globally370. South African firms recognise the need to respond to
this challenge with 76% believing a more fluid work force will improve innovation.371
Employers are recognising the benefits of hiring freelancers at an on-demand basis to improve
the rate at which skills can be sourced. Business is also increasingly investing in on the job
leaning, as discussed in the human capital pillar.
361 PWC (2017). Global Digital IQ Survey 362 Steyn & Bell - USB (2016). South African Management Index Report 363 Interviews with Stakeholders conducted by Genesis Analytics, February-March 2019 364 BCG (2017) Human Capital Trends Report for South Africa 365 Accenture (2016). SA Companies slow to innovate, Shows Accenture Innovation Index – Online report 366 CLC Africa (2018). The State of Innovation Capabilities Report. 367 Dell (2018) Digital Transformation Index 368 PWC (2017). Global Digital IQ Survey. 369 Interviews with Stakeholders conducted by Genesis Analytics, February-March 2019 370 PWC (2017). Global Digital IQ Survey. 371 Accenture (2016). SA Companies slow to innovate, Shows Accenture Innovation Index – Online report
Findings relating to innovation maturity were primarily derived from a targeted survey of business enterprise
and bolstered with support material. While sample size is small and sampling methodology uncertain, findings
are internally consistent. Digital maturity is equally derived from surveys that rely on business perceptions.
Supplementary data and empirics:
The State of Innovation Capabilities Report is a rich source of data for assessing business innovation
processes and capabilities. The survey was a pilot. Scaling the number of businesses would
contribute to representative outputs that complement research such as the HSRC Innovation Survey
and data detailing spend on R&D and innovation.
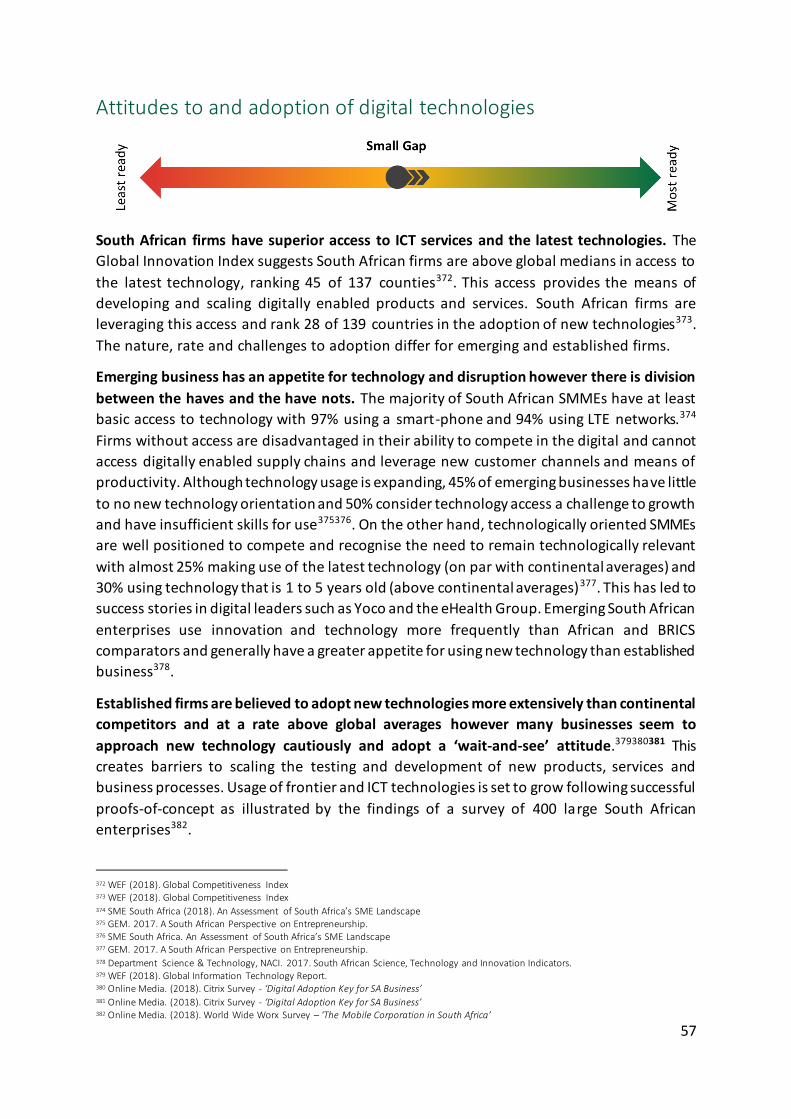
57
Attitudes to and adoption of digital technologies
South African firms have superior access to ICT services and the latest technologies. The
Global Innovation Index suggests South African firms are above global medians in access to
the latest technology, ranking 45 of 137 counties372. This access provides the means of
developing and scaling digitally enabled products and services. South African firms are
leveraging this access and rank 28 of 139 countries in the adoption of new technologies373.
The nature, rate and challenges to adoption differ for emerging and established firms.
Emerging business has an appetite for technology and disruption however there is division
between the haves and the have nots. The majority of South African SMMEs have at least
basic access to technology with 97% using a smart-phone and 94% using LTE networks.374
Firms without access are disadvantaged in their ability to compete in the digital and cannot
access digitally enabled supply chains and leverage new customer channels and means of
productivity. Although technology usage is expanding, 45% of emerging businesses have little
to no new technology orientation and 50% consider technology access a challenge to growth
and have insufficient skills for use375376. On the other hand, technologically oriented SMMEs
are well positioned to compete and recognise the need to remain technologically relevant
with almost 25% making use of the latest technology (on par with continental averages) and
30% using technology that is 1 to 5 years old (above continental averages)377. This has led to
success stories in digital leaders such as Yoco and the eHealth Group. Emerging South African
enterprises use innovation and technology more frequently than African and BRICS
comparators and generally have a greater appetite for using new technology than established
business378.
Established firms are believed to adopt new technologies more extensively than continental
competitors and at a rate above global averages however many businesses seem to
approach new technology cautiously and adopt a ‘wait-and-see’ attitude.379380381 This
creates barriers to scaling the testing and development of new products, services and
business processes. Usage of frontier and ICT technologies is set to grow following successful
proofs-of-concept as illustrated by the findings of a survey of 400 large South African
enterprises382.
372 WEF (2018). Global Competitiveness Index 373 WEF (2018). Global Competitiveness Index 374 SME South Africa (2018). An Assessment of South Africa’s SME Landscape 375 GEM. 2017. A South African Perspective on Entrepreneurship. 376 SME South Africa. An Assessment of South Africa’s SME Landscape 377 GEM. 2017. A South African Perspective on Entrepreneurship. 378 Department Science & Technology, NACI. 2017. South African Science, Technology and Innovation Indicators. 379 WEF (2018). Global Information Technology Report. 380 Online Media. (2018). Citrix Survey - ‘Digital Adoption Key for SA Business’ 381 Online Media. (2018). Citrix Survey - ‘Digital Adoption Key for SA Business’ 382 Online Media. (2018). World Wide Worx Survey – ‘The Mobile Corporation in South Africa’
58
Internet-of-Things (IOT) is the most commonly adopted frontier tech. IOT has the
largest appetite for non-user adoption while 100% of current users plan to increase
use;
Big data and Machine Learning has been explored by a small share of business. Over
70% of current users aim to expand usage while 60% of non-users intend on adopting;
Virtual reality has been tested by a handful of businesses however the desire for
further adoption seems limited relative to other technologies;
Robotics is in its nascency with a moderate intent for further expansion;
Blockchain technology is little used and shows low levels of interest relative to other
frontier technologies however adopters embrace the opportunity for further
expansion.
While frontier technologies gain traction, the pervasive use of cloud computing
continues to expand in emerging and established businesses. The technology is being
used to enhance productivity as it is considered by business as a means of
international expansion and improving time to market and speed of development.383
Across all frontier technologies (with the exception of robotics) cost was not the most
common impediment to adoption. This implies that deeper factors such as attitudes to
innovation, institutional culture and skills are key in unlocking the effective use of technology.
These capabilities would support institutions’ abilities to identify processes that can benefit
from the application of technology.
383 Online Media. (2019). World Wide Worx Survey – ‘Cloud Africa 2018’.
Assessing emerging business use and access to new technologies relies on respected international sources
that enable cross-country comparison. The use of frontier technologies and general access to new
technologies are derived from surveys that rely on business perceptions, have small or unknown sample sizes
and may therefore suffer from bias.
Supplementary data and empirics:
An enterprise survey with a representative sample size targeted at businesses of all sizes should be used to assess: the extent and nature of technology usage; the firm perceived abilities to adopt
further technologies; and barriers inhibiting adoption
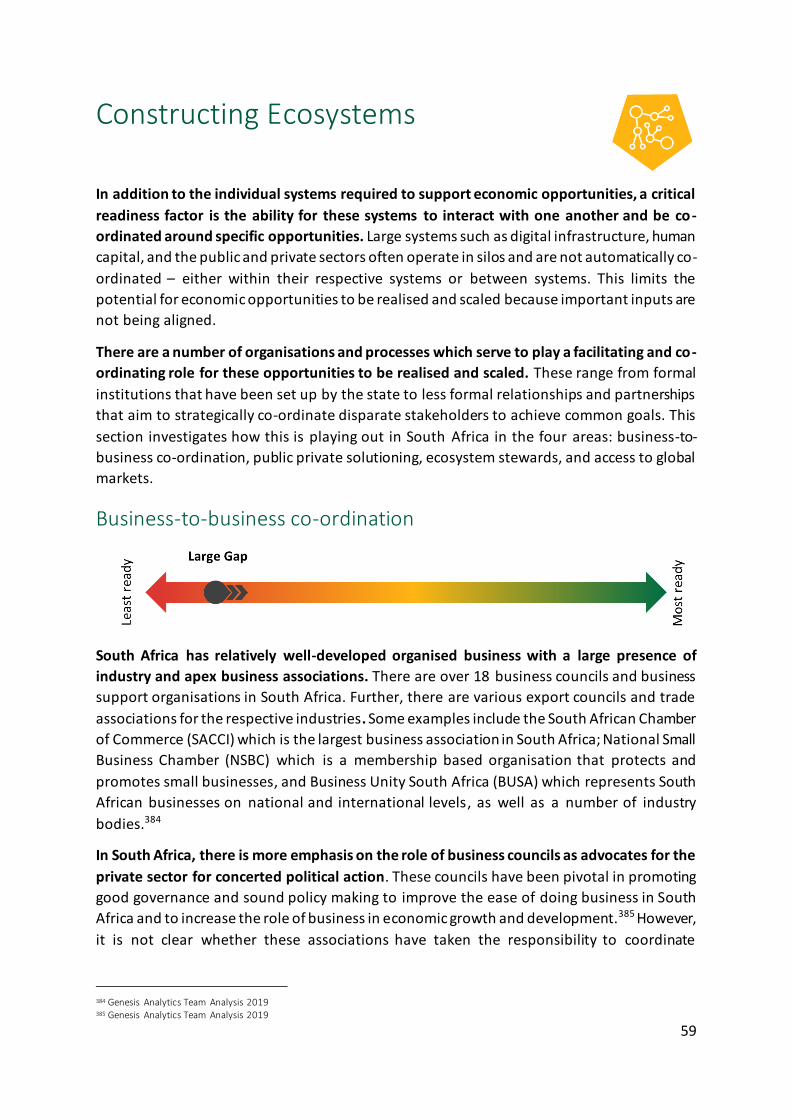
59
Constructing Ecosystems
In addition to the individual systems required to support economic opportunities, a critical
readiness factor is the ability for these systems to interact with one another and be co-
ordinated around specific opportunities. Large systems such as digital infrastructure, human
capital, and the public and private sectors often operate in silos and are not automatically co-
ordinated – either within their respective systems or between systems. This limits the
potential for economic opportunities to be realised and scaled because important inputs are
not being aligned.
There are a number of organisations and processes which serve to play a facilitating and co-
ordinating role for these opportunities to be realised and scaled. These range from formal
institutions that have been set up by the state to less formal relationships and partnerships
that aim to strategically co-ordinate disparate stakeholders to achieve common goals. This
section investigates how this is playing out in South Africa in the four areas: business-to-
business co-ordination, public private solutioning, ecosystem stewards, and access to global
markets.
Business-to-business co-ordination
South Africa has relatively well-developed organised business with a large presence of
industry and apex business associations. There are over 18 business councils and business
support organisations in South Africa. Further, there are various export councils and trade
associations for the respective industries. Some examples include the South African Chamber
of Commerce (SACCI) which is the largest business association in South Africa; National Small
Business Chamber (NSBC) which is a membership based organisation that protects and
promotes small businesses, and Business Unity South Africa (BUSA) which represents South
African businesses on national and international levels, as well as a number of industry
bodies.384
In South Africa, there is more emphasis on the role of business councils as advocates for the
private sector for concerted political action. These councils have been pivotal in promoting
good governance and sound policy making to improve the ease of doing business in South
Africa and to increase the role of business in economic growth and development.385 However,
it is not clear whether these associations have taken the responsibility to coordinate
384 Genesis Analytics Team Analysis 2019 385 Genesis Analytics Team Analysis 2019
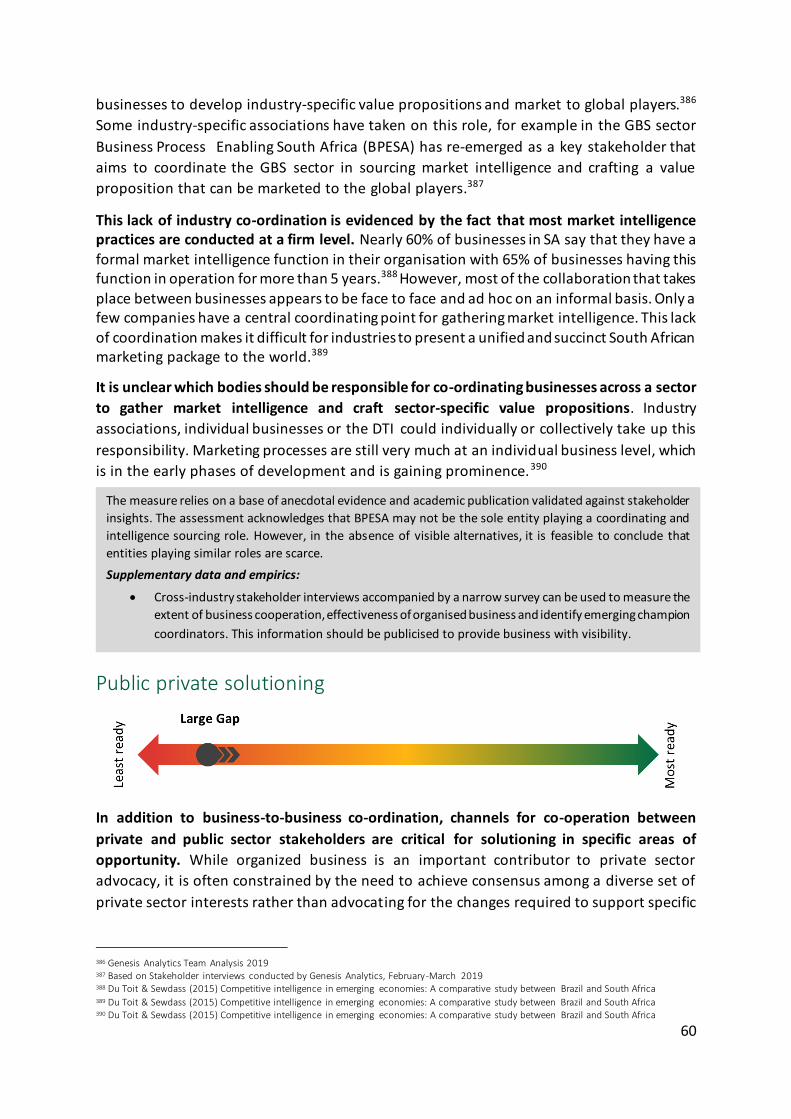
60
businesses to develop industry-specific value propositions and market to global players.386
Some industry-specific associations have taken on this role, for example in the GBS sector
Business Process Enabling South Africa (BPESA) has re-emerged as a key stakeholder that
aims to coordinate the GBS sector in sourcing market intelligence and crafting a value
proposition that can be marketed to the global players.387
This lack of industry co-ordination is evidenced by the fact that most market intelligence practices are conducted at a firm level. Nearly 60% of businesses in SA say that they have a
formal market intelligence function in their organisation with 65% of businesses having this function in operation for more than 5 years.388
However, most of the collaboration that takes
place between businesses appears to be face to face and ad hoc on an informal basis. Only a few companies have a central coordinating point for gathering market intelligence. This lack of coordination makes it difficult for industries to present a unified and succinct South African marketing package to the world.389
It is unclear which bodies should be responsible for co-ordinating businesses across a sector
to gather market intelligence and craft sector-specific value propositions. Industry
associations, individual businesses or the DTI could individually or collectively take up this
responsibility. Marketing processes are still very much at an individual business level, which
is in the early phases of development and is gaining prominence.390
Public private solutioning
In addition to business-to-business co-ordination, channels for co-operation between
private and public sector stakeholders are critical for solutioning in specific areas of
opportunity. While organized business is an important contributor to private sector
advocacy, it is often constrained by the need to achieve consensus among a diverse set of
private sector interests rather than advocating for the changes required to support specific
386 Genesis Analytics Team Analysis 2019 387 Based on Stakeholder interviews conducted by Genesis Analytics, February-March 2019 388 Du Toit & Sewdass (2015) Competitive intelligence in emerging economies: A comparative study between Brazil and South Africa 389 Du Toit & Sewdass (2015) Competitive intelligence in emerging economies: A comparative study between Brazil and South Africa 390 Du Toit & Sewdass (2015) Competitive intelligence in emerging economies: A comparative study between Brazil and South Africa
The measure relies on a base of anecdotal evidence and academic publication validated against stakeholder
insights. The assessment acknowledges that BPESA may not be the sole entity playing a coordinating and
intelligence sourcing role. However, in the absence of visible alternatives, it is feasible to conclude that
entities playing similar roles are scarce.
Supplementary data and empirics:
Cross-industry stakeholder interviews accompanied by a narrow survey can be used to measure the
extent of business cooperation, effectiveness of organised business and identify emerging champion
coordinators. This information should be publicised to provide business with visibility.
61
opportunities.391 As such, there is a need for organisations and structures which allow public
and private sector stakeholders involved in a specific sector/opportunity area to co-develop
solutions to specific problems that are constraining inclusive growth.
South Africa has a number of institutions and ad-hoc structures designed to facilitate public
private engagement. Broad stakeholder consultation for economic policymaking is legislated
through the National Economic Development and Labour Council (NEDLAC) Act of 1994.
NEDLAC is a vehicle through which government, labour, business and community
organisations can co-operate on economic, labour and development issues in the country.392
In addition to this permanent structure, there are also ad-hoc structures which provide a
similar role for specific national development objectives. For example, the Presidential Jobs
Summit held in 2018 under the auspices of NEDLAC brought together representatives of
government, private sector, unions, and community organisations to deliberate on solutions
for South Africa’s employment crisis. The outcome of the Summit was a Framework
Agreement consisting of high-impact actions to drive job creation, job retention, and
economic growth.393
However, these institutions and structures are often not effective at arriving at solutions
for specific areas of opportunity. The nature of nationally-representative consultation and
bargaining is such that actions required around specific opportunities are often lost. A recent
development in South Africa is aiming to address this issue directly. The Public Private Growth
Initiative (PPGI) brings together business and government leaders in specific sectors to design
5 year growth strategies in each sector by identifying specific projects and the public sector
enablers required for them to scale. More detail on the initiative is provided in the box below.
The recent Public Private Growth Initiative is a good example of a structure set up to create public private
solutioning around specific opportunities The PPGI has been convened by the Minister in the Presidency to bring together business and government leaders to identify and plan for specific growth projects within each sector.394 There are 24 sectors that are represented by the initiative which was inspired by the sector-based reconstruction and development model adopted by Japan after the Second World War.395 Business leaders and the Director Generals of relevant government departments have been meeting to discuss projects with the potential to unlock growth in each sector, and identify the enablers that government must have in place for these project to succeed. The outcome of the initiative will be a consolidated plan detailing identified projects in each sector and the required actions for these projects to scale. This will be incorporated into the country’s economic planning process after the May 2019 elections. The PPGI represents a fundamentally different approach to public private co-ordination where the focus is on deriving sector-specific strategies rather than national consensus-building and negotiating between various stakeholders.
391 Nelson (2014). Innovative Platforms for Public-Private Dialogue, 2014 Brookings Blum Roundtable, The Brooking Institute 392 NEDLAC (2017). Growth Equity and Participation 393 NEDLAC (2018). The Presidential Jobs Summit Framework Agreement, 4 October 2018 394 The Presidency (2019). Public-Private Growth Initiative believe high-growth South Africa within reach, Presidency on the Public-Private
Growth Initiative meeting, 29 January 2019 395 Online Media (2019). - Public-Private Growth Initiative identifies 18 priority projects to unlock growth - Engineering News
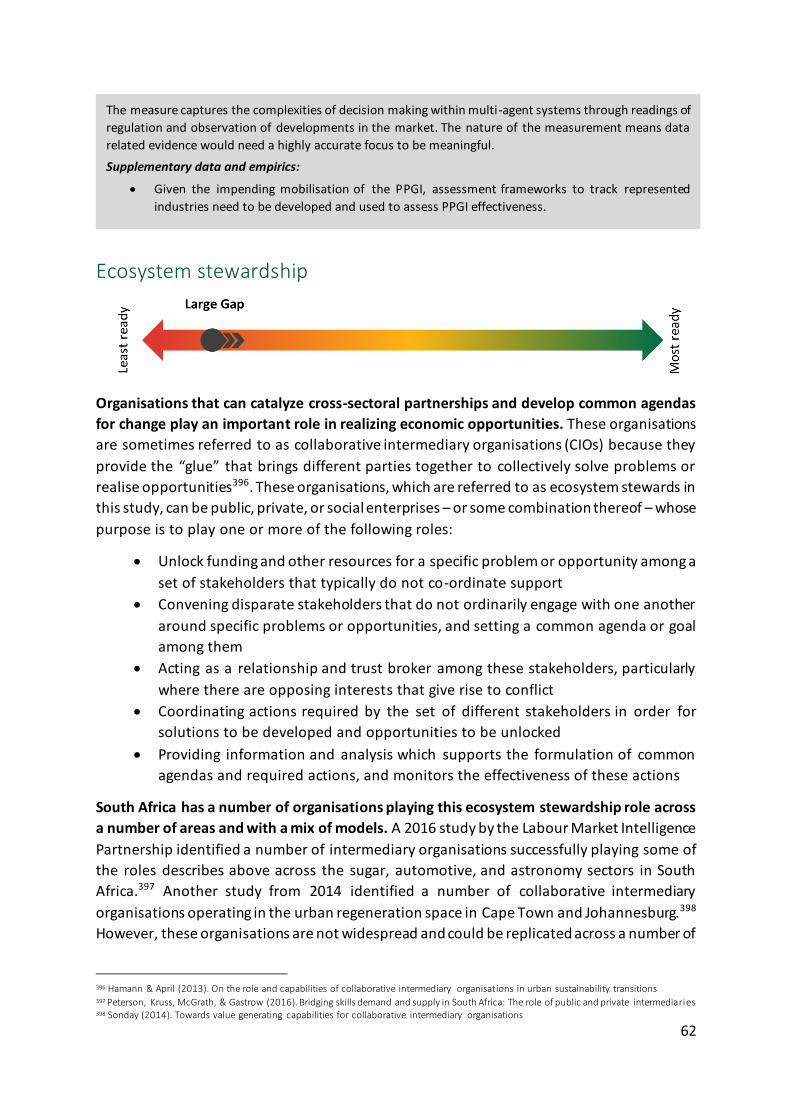
62
Ecosystem stewardship
Organisations that can catalyze cross-sectoral partnerships and develop common agendas
for change play an important role in realizing economic opportunities. These organisations
are sometimes referred to as collaborative intermediary organisations (CIOs) because they
provide the “glue” that brings different parties together to collectively solve problems or
realise opportunities396. These organisations, which are referred to as ecosystem stewards in
this study, can be public, private, or social enterprises – or some combination thereof – whose
purpose is to play one or more of the following roles:
Unlock funding and other resources for a specific problem or opportunity among a
set of stakeholders that typically do not co-ordinate support
Convening disparate stakeholders that do not ordinarily engage with one another
around specific problems or opportunities, and setting a common agenda or goal
among them
Acting as a relationship and trust broker among these stakeholders, particularly
where there are opposing interests that give rise to conflict
Coordinating actions required by the set of different stakeholders in order for
solutions to be developed and opportunities to be unlocked
Providing information and analysis which supports the formulation of common
agendas and required actions, and monitors the effectiveness of these actions
South Africa has a number of organisations playing this ecosystem stewardship role across
a number of areas and with a mix of models. A 2016 study by the Labour Market Intelligence
Partnership identified a number of intermediary organisations successfully playing some of
the roles describes above across the sugar, automotive, and astronomy sectors in South
Africa.397 Another study from 2014 identified a number of collaborative intermediary
organisations operating in the urban regeneration space in Cape Town and Johannesburg.398
However, these organisations are not widespread and could be replicated across a number of
396 Hamann & April (2013). On the role and capabilities of collaborative intermediary organisations in urban sustainability transitions 397 Peterson, Kruss, McGrath, & Gastrow (2016). Bridging skills demand and supply in South Africa: The role of public and private intermediaries 398 Sonday (2014). Towards value generating capabilities for collaborative intermediary organisations
The measure captures the complexities of decision making within multi-agent systems through readings of
regulation and observation of developments in the market. The nature of the measurement means data
related evidence would need a highly accurate focus to be meaningful.
Supplementary data and empirics:
Given the impending mobilisation of the PPGI, assessment frameworks to track represented
industries need to be developed and used to assess PPGI effectiveness.
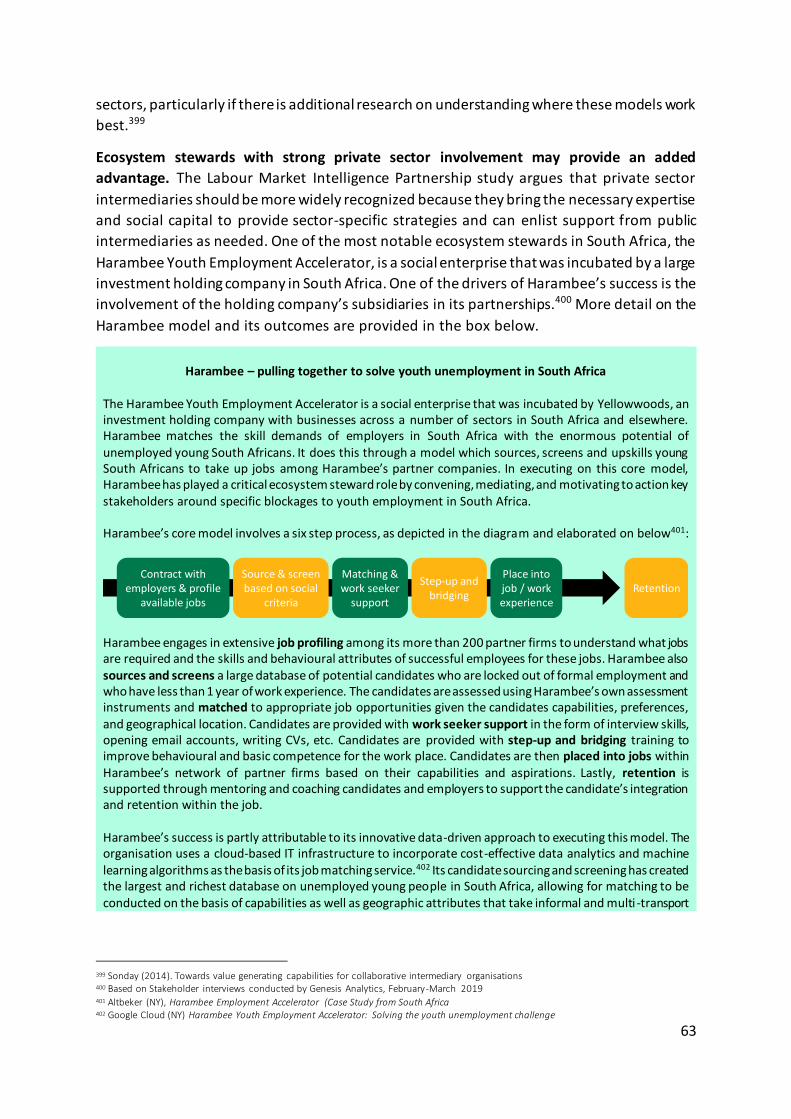
63
sectors, particularly if there is additional research on understanding where these models work
best.399
Ecosystem stewards with strong private sector involvement may provide an added
advantage. The Labour Market Intelligence Partnership study argues that private sector
intermediaries should be more widely recognized because they bring the necessary expertise
and social capital to provide sector-specific strategies and can enlist support from public
intermediaries as needed. One of the most notable ecosystem stewards in South Africa, the
Harambee Youth Employment Accelerator, is a social enterprise that was incubated by a large
investment holding company in South Africa. One of the drivers of Harambee’s success is the
involvement of the holding company’s subsidiaries in its partnerships.400 More detail on the
Harambee model and its outcomes are provided in the box below.
Harambee – pulling together to solve youth unemployment in South Africa
The Harambee Youth Employment Accelerator is a social enterprise that was incubated by Yellowwoods, an investment holding company with businesses across a number of sectors in South Africa and elsewhere. Harambee matches the skill demands of employers in South Africa with the enormous potential of unemployed young South Africans. It does this through a model which sources, screens and upskills young South Africans to take up jobs among Harambee’s partner companies. In executing on this core model, Harambee has played a critical ecosystem steward role by convening, mediating, and motivating to action key stakeholders around specific blockages to youth employment in South Africa. Harambee’s core model involves a six step process, as depicted in the diagram and elaborated on below401:
Harambee engages in extensive job profiling among its more than 200 partner firms to understand what jobs are required and the skills and behavioural attributes of successful employees for these jobs. Harambee also sources and screens a large database of potential candidates who are locked out of formal employment and who have less than 1 year of work experience. The candidates are assessed using Harambee’s own assessment instruments and matched to appropriate job opportunities given the candidates capabilities, preferences, and geographical location. Candidates are provided with work seeker support in the form of interview skills, opening email accounts, writing CVs, etc. Candidates are provided with step-up and bridging training to improve behavioural and basic competence for the work place. Candidates are then placed into jobs within Harambee’s network of partner firms based on their capabilities and aspirations. Lastly, retention is supported through mentoring and coaching candidates and employers to support the candidate’s integration and retention within the job. Harambee’s success is partly attributable to its innovative data-driven approach to executing this model. The organisation uses a cloud-based IT infrastructure to incorporate cost-effective data analytics and machine learning algorithms as the basis of its job matching service.402 Its candidate sourcing and screening has created the largest and richest database on unemployed young people in South Africa, allowing for matching to be conducted on the basis of capabilities as well as geographic attributes that take informal and multi -transport
399 Sonday (2014). Towards value generating capabilities for collaborative intermediary organisations 400 Based on Stakeholder interviews conducted by Genesis Analytics, February-March 2019 401 Altbeker (NY), Harambee Employment Accelerator (Case Study from South Africa 402 Google Cloud (NY) Harambee Youth Employment Accelerator: Solving the youth unemployment challenge
Contract with employers & profile
available jobs
Source & screen based on social
criteria
Matching & work seeker
support
Step-up and bridging
Place into job / work experience
Retention
64
routes into account. It includes predictions of behavioural metrics, such as which candidates are most likely to leave a job within the first year of employment.403 Another central driver of Harambee’s success has been its ability to construct partnerships. The Harambee model depends specifically on partnership with the employing companies in its network. Having been incubated by a large investment holding company that directs a number of companies in South Africa, Harambee was able to show how its model unlocked value for these companies in order to get other companies to join the partnership. In addition, Harambee has built strong partnerships with the Department of Higher Education, Department of Monitoring and Evaluation, the National Youth Development Agency, and a number of provincial and local stakeholders to unlock resources and tackle specific issues acting as
blockages to youth employment creation in specific sectors.404
Access to global markets
South Africa have incentives, marketing and support structures that are crucial for export
promotion. These channels allow South African capabilities to be signalled and marketed to
the global market. While there is evidence of success, a gap remains in access for small scale
enterprise and coordination amongst export promoting entities.
South Africa has an export promotion capability through its dedicated export promotion
vehicles such as BrandSA and InvestSA. InvestSA is a division of the DTI and South Africa’s
national investment promotion agency which provides interested investors with information
and support in accessing the South African market. The entity was recently recognised for its
performance winning the global Investment Promotion Award at the 2019 Annual Investment
Meeting and received an UNCTAD award of excellence in 2016405. InvestSA houses ‘a one-
stop shop’ where information about sector-specific skill value propositions can be accessed
and used for marketing SA capabilities to the global market. BrandSA is the official marketing
agency tasked with developing and implementing a proactive marketing and communication
strategy for South Africa. Its role is to create a positive, unified image of South Africa, promote
403 Google Cloud (NY) Harambee Youth Employment Accelerator: Solving the youth unemployment challenge 404 Wilson-Prangley and Ngosi (NY) Urban Youth Unemployment – The case of Harambee, a Youth Employment Accelerator 405 South African Government (2019). – Trade and Industry on Investment Promotion Award – Online Media - South African Government
Ecosystem stewards are an emerging organisational form. Measuring the impact of these organisations is
simpler when their effects are direct (as with Harambee) though more complex if effects are indirect and less
visible (as with the successful coordination of entities) The condition therefore considers the prevalence,
importance and trajectory of stewards in key systems.
Supplementary data and empirics:
A broad enterprise level survey assessing business awareness of relevant stewards that come into contact with their operation. This should be coupled with assessment of where stewards have been
effective. Results should be publicised.
65
investment and tourism, and help new enterprises access foreign opportunities. However,
BrandSA does not have a specific targeted marketing strategy for new and emerging industry
capabilities, and there are very few official publications on South Africa’s sector and skill value
propositions that can be easily accessed.406This suggests there is room for improvement in
coordination.
The DTI has been taking on a few of these roles and assisting businesses through the Export
Marketing & Investment Assistance Scheme (EMIA). This scheme provides export marketing
and investment assistance to businesses that develop export markets for South African
products and services and recruit offshore opportunities to South Africa. It assists with the
identification of new export markets through market research and helps companies
strengthen their competitive advantage by supporting patent registrations, quality marks and
product marks.407
Accessing the global market for businesses is supported by the DTI through international
investment missions and facilitation by DTI representatives stationed world-wide. The DTI
together with industry and businesses, facilitates joint marketing trips to investor countries.
The goal of these marketing trips is to allow South African companies to meet analysts,
consultants, advisors and business executives from destination countries and outsourcing
vendors. During these visits businesses get to exhibit their offerings at tech expos and
conference events and promote South Africa as a competitive offshoring destination.408
Another marketing channel available to businesses are the relationship brokers who facilitate
connections between South African businesses and potential customers in specific markets,
such as the business process outsourcing industry.
Access to these marketing channels is limited for smaller players who lack awareness of
these services or the capital to pay for such connections. However, the DTI compensates
businesses for costs incurred recruiting in new FDI into South Africa.409 This contributes to
broadening access and may facilitate the growth of emerging firms. In order to scale these
initiatives the DTI would have to increase its capacity to support emerging industries as well
those that might emerge in the future.
There are some pockets of coordination and marketing excellence outside of InvestSA. Cape
Town is the largest outsourcing destination in South Africa and is currently ranked 21st in the
world by the Financial Times for its investment promotion brand strategy.410 This
achievement has been largely attributed to the Invest in Cape Town Strategy that identifies
opportunities for businesses and provides information on eight high-growth sectors of the
406 Genesis Analytics Team Analysis 2019 407 DTI (2019) Trade, Exports & Investment 408 DTI (2019) Trade, Exports & Investment 409 DTI (2019) Export Marketing and Investment Assistance 410 CFO South Africa (2017)
66
economy for investment.411 This makes business decision making easier and has seen a
number of companies setting up their headquarters in Cape Town.412
411 City of Cape Town (2018)-Invest in Cape Town 412 City of Cape Town (2018)-Invest in Cape Town
Access to global markets is evaluated in terms of the presence and perceived effectiveness of coordinating
and dedicated entities. The direct economic impact of export and investment promotion is difficult to
estimate and divorce from trends.
Supplementary data and empirics:
A targeted survey of firms to which South Africa exports and firms recently invested in SA to
determine the role export and investment promoting agencies played in the decision.
67
Alternative Opportunities
A host of alternative opportunities not contained in the opportunity zones were identified.
These were not included as they either did not meet the employment creating criteria of an
opportunity, shared characteristics and dynamics with other opportunities or are embedded
in the current opportunity zones. These opportunities and the motivation behind not
including them are summarised below:
Improving educational outcomes through digital content delivery and shared
educational resources – employment effects are limited while education is better
characterised as a core system upon which other opportunities rest. Digitisation of
entities is captured within the frontier tech opportunity zone.
Improving the delivery of government services – the primary gains are efficiency and
service delivery. The levers of change are limited while the means of change captured
in the frontier tech opportunity zone.
Supporting resilience in agriculture and growth of smallholder farmers– the primary
sources of employment growth in the agricultural sector are through providing small-
holder farmers with access to supply chains and improving the productivity of small-
holder farmers. The prior is reflected in the digital platforms opportunity and the latter
largely matter of access to information that can improve productivity, again captured
in the digital platforms opportunity. The use of frontier technologies to improve
resilience to changing weather conditions is reflected in the frontier tech opportunity
zone.
Pursuing the future of production in PGM manufacturing – the sector is capital
intensive and therefore offers limited employment opportunity. The dynamics of
achieving this are captured in the frontier technology hub opportunity zone.
Social sharing and central help facilities – these are similar in nature to digital
platforms that deliver knowledge-based services.
Solving the shortage of healthcare practitioners through remote diagnostics – the
use of technology for remote diagnostics can broaden public access outside of cities,
improve the quality of services offered and reduce congestion at top tier facilities.
However, this comes with limited direct employment gains with the mechanisms
largely captured in the current opportunity zones.
Improving the distribution of medication along the medical supply chain – effective
supply chain management with predictive capabilities at the distribution-point level
can improve consumer access to medication and avoid shortages. However,
employment creation is limited, the mechanisms are largely captured in the current
opportunity zones and there is ongoing efforts to improve operation of these supply
chains through technology.