Embed Size (px)
Citation preview

Per�l deMinas Gerais
2013
A Guide to the Economyof Minas Gerais
Elaborado pelo Centro de Estatística e Informações (CEI), com a colaboração do Centro de Estudos de Políticas Públicas (CEPP) e do Centro de Pesquisas
Aplicadas (CPA), da Fundação João Pinheiro (FJP).
Produced by the Centre for Statistics and Information (CEI),
with the collaboration of the Centre for Public Policy Studies
(CEPP) and the Centre for Applied Research (CPA), at the
João Pinheiro Foundation (FJP).

2 3
16ª EdiçãoTodos os direitos autorais desta obra pertencem à CBMM, nos termos do Art. 15 e para os efeitos da Lei nº 5.988 de 14/12/1973.
CBMM - Companhia Brasileira de Metalurgia e Mineração
Governo do Estado de Minas GeraisGovernador - Alberto Pinto Coelho
Secretaria de Estado de Planejamento e GestãoSecretária - Renata Maria Paes de Vilhena
Fundação João PinheiroPresidente - Marilena Chaves
Centro de Estatística e InformaçõesDiretor - Frederico Poley Martins Ferreira
Assessoria de Comunicação SocialAssessora-Chefe - Olívia Bittencourt
16th EditionAll authorial rights belong to CBMM, according to the terms of Article 15 of the Law nº 5988 of the 14th of December 1973.
CBMM - Companhia Brasileira de Metalurgia e Mineração
Government of the State of Minas GeraisGovernor - Alberto Pinto Coelho
State Department of Planning and ManagementSecretary - Renata Maria Paes de Vilhena
João Pinheiro FoundationPresident - Marilena Chaves
Centre for Statistics and InformationDirector - Frederico Poley Martins Ferreira
Social Communication DepartmentChief Advisor - Olívia Bittencourt
2 3
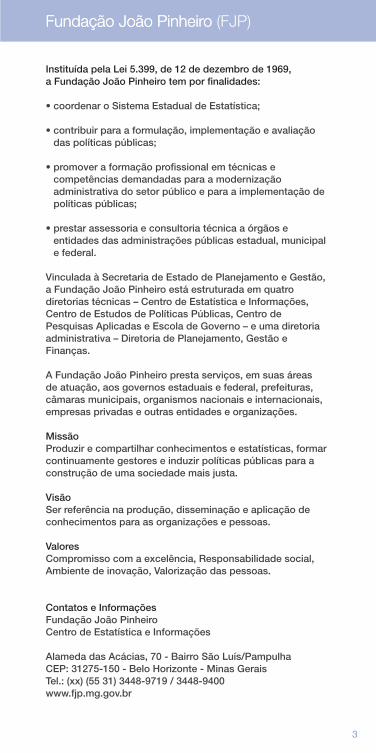
Instituída pela Lei 5.399, de 12 de dezembro de 1969, a Fundação João Pinheiro tem por finalidades:
• coordenar o Sistema Estadual de Estatística;
• contribuir para a formulação, implementação e avaliação das políticas públicas;
• promover a formação profissional em técnicas e competências demandadas para a modernização administrativa do setor público e para a implementação de políticas públicas;
• prestar assessoria e consultoria técnica a órgãos e entidades das administrações públicas estadual, municipal e federal.
Vinculada à Secretaria de Estado de Planejamento e Gestão, a Fundação João Pinheiro está estruturada em quatro diretorias técnicas – Centro de Estatística e Informações, Centro de Estudos de Políticas Públicas, Centro de Pesquisas Aplicadas e Escola de Governo – e uma diretoria administrativa – Diretoria de Planejamento, Gestão e Finanças.
A Fundação João Pinheiro presta serviços, em suas áreas de atuação, aos governos estaduais e federal, prefeituras, câmaras municipais, organismos nacionais e internacionais, empresas privadas e outras entidades e organizações.
MissãoProduzir e compartilhar conhecimentos e estatísticas, formar continuamente gestores e induzir políticas públicas para a construção de uma sociedade mais justa.
VisãoSer referência na produção, disseminação e aplicação de conhecimentos para as organizações e pessoas.
ValoresCompromisso com a excelência, Responsabilidade social, Ambiente de inovação, Valorização das pessoas.
Contatos e InformaçõesFundação João PinheiroCentro de Estatística e Informações
Alameda das Acácias, 70 - Bairro São Luís/PampulhaCEP: 31275-150 - Belo Horizonte - Minas GeraisTel.: (xx) (55 31) 3448-9719 / 3448-9400www.fjp.mg.gov.br
Fundação João PinheiroFundação João Pinheiro (FJP)

44
5
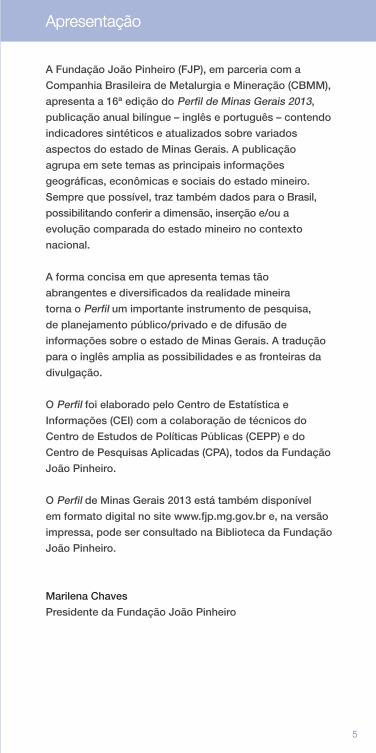
A Fundação João Pinheiro (FJP), em parceria com a
Companhia Brasileira de Metalurgia e Mineração (CBMM),
apresenta a 16ª edição do Perfil de Minas Gerais 2013,
publicação anual bilíngue – inglês e português – contendo
indicadores sintéticos e atualizados sobre variados
aspectos do estado de Minas Gerais. A publicação
agrupa em sete temas as principais informações
geográficas, econômicas e sociais do estado mineiro.
Sempre que possível, traz também dados para o Brasil,
possibilitando conferir a dimensão, inserção e/ou a
evolução comparada do estado mineiro no contexto
nacional.
A forma concisa em que apresenta temas tão
abrangentes e diversificados da realidade mineira
torna o Perfil um importante instrumento de pesquisa,
de planejamento público/privado e de difusão de
informações sobre o estado de Minas Gerais. A tradução
para o inglês amplia as possibilidades e as fronteiras da
divulgação.
O Perfil foi elaborado pelo Centro de Estatística e
Informações (CEI) com a colaboração de técnicos do
Centro de Estudos de Políticas Públicas (CEPP) e do
Centro de Pesquisas Aplicadas (CPA), todos da Fundação
João Pinheiro.
O Perfil de Minas Gerais 2013 está também disponível
em formato digital no site www.fjp.mg.gov.br e, na versão
impressa, pode ser consultado na Biblioteca da Fundação
João Pinheiro.
Marilena Chaves
Presidente da Fundação João Pinheiro
ApresentaçãoApresentação

66
7
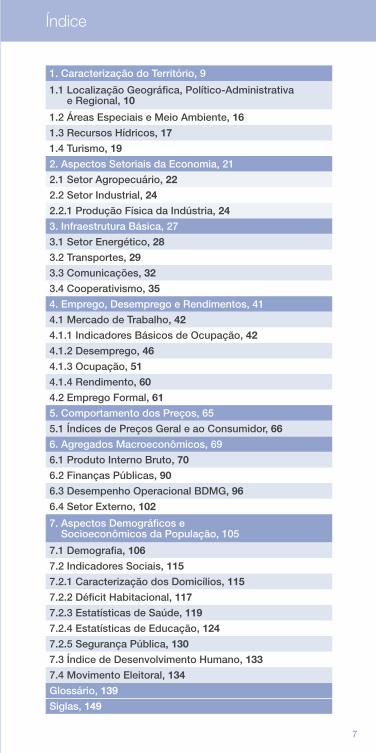
1. Caracterização do Território, 9
1.1 Localização Geográfica, Político-Administrativa e Regional, 10
1.2 Áreas Especiais e Meio Ambiente, 16
1.3 Recursos Hídricos, 17
1.4 Turismo, 19
2. Aspectos Setoriais da Economia, 21
2.1 Setor Agropecuário, 22
2.2 Setor Industrial, 24
2.2.1 Produção Física da Indústria, 24
3. Infraestrutura Básica, 27
3.1 Setor Energético, 28
3.2 Transportes, 29
3.3 Comunicações, 32
3.4 Cooperativismo, 35
4. Emprego, Desemprego e Rendimentos, 41
4.1 Mercado de Trabalho, 42
4.1.1 Indicadores Básicos de Ocupação, 42
4.1.2 Desemprego, 46
4.1.3 Ocupação, 51
4.1.4 Rendimento, 60
4.2 Emprego Formal, 61
5. Comportamento dos Preços, 65
5.1 Índices de Preços Geral e ao Consumidor, 66
6. Agregados Macroeconômicos, 69
6.1 Produto Interno Bruto, 70
6.2 Finanças Públicas, 90
6.3 Desempenho Operacional BDMG, 96
6.4 Setor Externo, 102
7. Aspectos Demográficos e Socioeconômicos da População, 105
7.1 Demografia, 106
7.2 Indicadores Sociais, 115
7.2.1 Caracterização dos Domicílios, 115
7.2.2 Déficit Habitacional, 117
7.2.3 Estatísticas de Saúde, 119
7.2.4 Estatísticas de Educação, 124
7.2.5 Segurança Pública, 130
7.3 Índice de Desenvolvimento Humano, 133
7.4 Movimento Eleitoral, 134
Glossário, 139
Siglas, 149
Índice
8 9
Sinais convencionais utilizados Key to symbols
- Dado numérico igual a zero não resultante de arredondamento; Numerical data equal to zero (not the result of rounding);
... Dado numérico não disponível; Unavailable numerical data;
.. Não se aplica dado numérico; Non-applicable numerical data;
0,0 Dado numérico igual a zero resultante de arredondamento de um dado numérico originalmente positivo. Numerical data equal to zero resulting from the rounding down of a number which was originally positive.
Apresentação de pontos no tempoPresentation of temporal moments
(De acordo com a ABNT – NB 113 – “Normas para Datar”) (According to ABNT – NB 113 – “Dating Norms”)
As séries temporais consecutivas são apresentadas nas tabelas e gráficos por seus pontos inicial e final ligados por hífen (-); as não consecutivas, ligadas por barra (/). Consecutive temporal series are presented in the tables and graphs with their starting and finishing points connected by a hyphen (-); non-consecutive moments are connected by a slash (/).

8 99
Caracterizaçãodo Território
1
10 1110 11
Amazonas Pará
Mato Grosso
Mato Grossodo Sul
Bahia
São Paulo
Paraná
Rio Grandedo Sul
Maranhão
Piauí
Ceará
RoraimaAmapá
Tocantins
Goiás
Acre
Rondônia
Rio Grande do Norte
Paraíba
Pernambuco
Alagoas
Sergipe
Espírito Santo
Rio de Janeiro
Santa Catarina
Minas Gerais
NORTE
SUL
NORDESTE
CENTRO-OESTE
SUDESTE
0 200 400 600 km
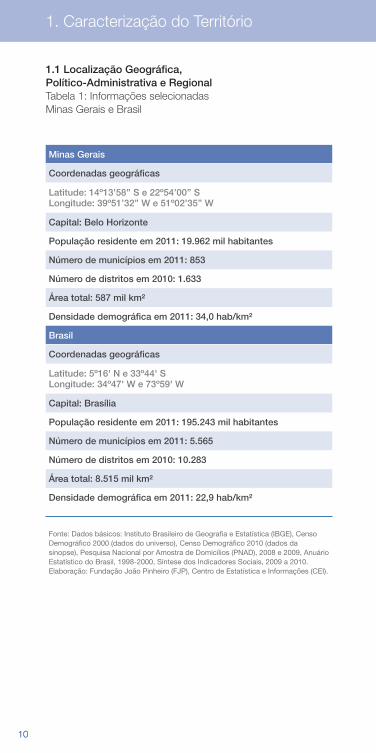
Minas Gerais
Coordenadas geográficas
Latitude: 14º13’58’’ S e 22º54’00’’ SLongitude: 39º51’32’’ W e 51º02’35’’ W
Capital: Belo Horizonte
População residente em 2011: 19.962 mil habitantes
Número de municípios em 2011: 853
Número de distritos em 2010: 1.633
Área total: 587 mil km²
Densidade demográfica em 2011: 34,0 hab/km²
Brasil
Coordenadas geográficas
Latitude: 5º16' N e 33º44' SLongitude: 34º47' W e 73º59' W
Capital: Brasília
População residente em 2011: 195.243 mil habitantes
Número de municípios em 2011: 5.565
Número de distritos em 2010: 10.283
Área total: 8.515 mil km²
Densidade demográfica em 2011: 22,9 hab/km²
1. Caracterização do Território
Fonte: Dados básicos: Instituto Brasileiro de Geografia e Estatística (IBGE), Censo Demográfico 2000 (dados do universo), Censo Demográfico 2010 (dados da sinopse), Pesquisa Nacional por Amostra de Domicílios (PNAD), 2008 e 2009, Anuário Estatístico do Brasil, 1998-2000, Síntese dos Indicadores Sociais, 2009 a 2010. Elaboração: Fundação João Pinheiro (FJP), Centro de Estatística e Informações (CEI).
1.1 Localização Geográfica,Político-Administrativa e Regional Tabela 1: Informações selecionadas Minas Gerais e Brasil
10 1110 11
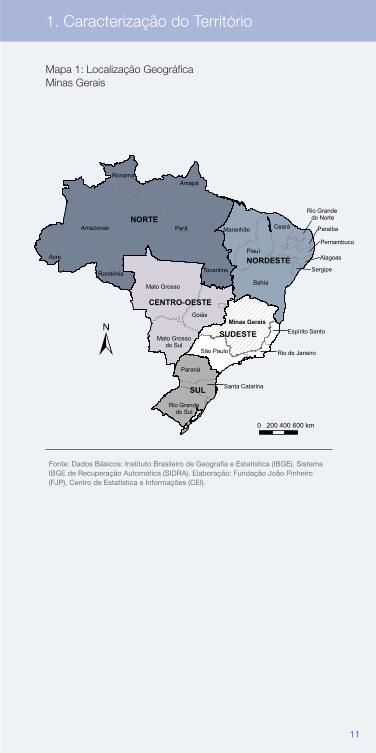
Mapa 1: Localização GeográficaMinas Gerais
Amazonas Pará
Mato Grosso
Mato Grossodo Sul
Bahia
São Paulo
Paraná
Rio Grandedo Sul
Maranhão
Piauí
Ceará
RoraimaAmapá
Tocantins
Goiás
Acre
Rondônia
Rio Grande do Norte
Paraíba
Pernambuco
Alagoas
Sergipe
Espírito Santo
Rio de Janeiro
Santa Catarina
Minas Gerais
NORTE
SUL
NORDESTE
CENTRO-OESTE
SUDESTE
0 200 400 600 km
Fonte: Dados Básicos: Instituto Brasileiro de Geografia e Estatística (IBGE), Sistema IBGE de Recuperação Automática (SIDRA). Elaboração: Fundação João Pinheiro (FJP), Centro de Estatística e Informações (CEI).
1. Caracterização do Território
12 1312 13
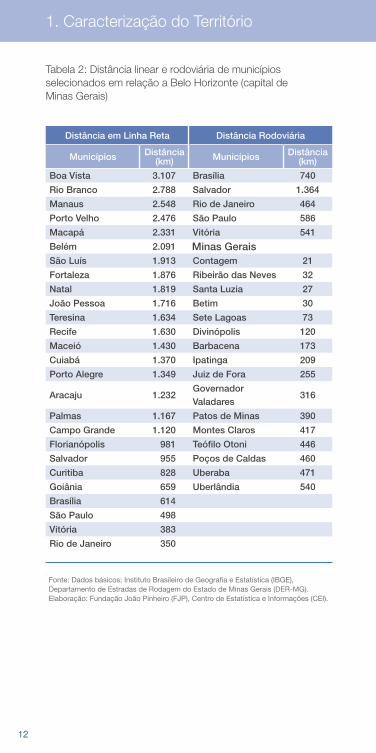
Distância em Linha Reta Distância Rodoviária
Municípios Distância (km) Municípios Distância
(km)
Boa Vista 3.107 Brasília 740
Rio Branco 2.788 Salvador 1.364
Manaus 2.548 Rio de Janeiro 464
Porto Velho 2.476 São Paulo 586
Macapá 2.331 Vitória 541
Belém 2.091 Minas GeraisSão Luís 1.913 Contagem 21
Fortaleza 1.876 Ribeirão das Neves 32
Natal 1.819 Santa Luzia 27
João Pessoa 1.716 Betim 30
Teresina 1.634 Sete Lagoas 73
Recife 1.630 Divinópolis 120
Maceió 1.430 Barbacena 173
Cuiabá 1.370 Ipatinga 209
Porto Alegre 1.349 Juiz de Fora 255
Aracaju 1.232Governador Valadares
316
Palmas 1.167 Patos de Minas 390
Campo Grande 1.120 Montes Claros 417
Florianópolis 981 Teófilo Otoni 446
Salvador 955 Poços de Caldas 460
Curitiba 828 Uberaba 471
Goiânia 659 Uberlândia 540
Brasília 614
São Paulo 498
Vitória 383
Rio de Janeiro 350
Fonte: Dados básicos: Instituto Brasileiro de Geografia e Estatística (IBGE), Departamento de Estradas de Rodagem do Estado de Minas Gerais (DER-MG). Elaboração: Fundação João Pinheiro (FJP), Centro de Estatística e Informações (CEI).
Tabela 2: Distância linear e rodoviária de municípios selecionados em relação a Belo Horizonte (capital de Minas Gerais)
1. Caracterização do Território
12 1312 13
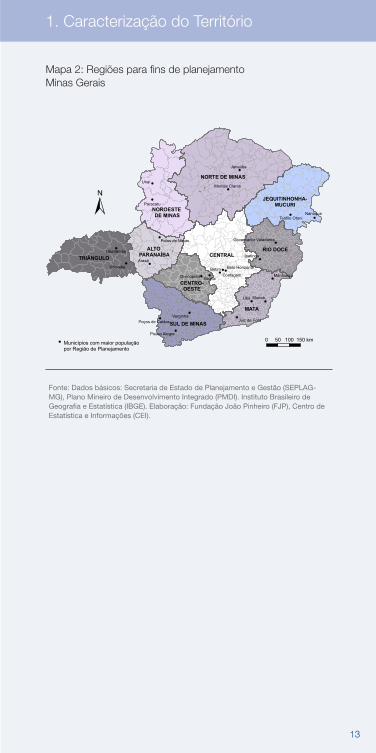
Fonte: Dados básicos: Secretaria de Estado de Planejamento e Gestão (SEPLAG-MG), Plano Mineiro de Desenvolvimento Integrado (PMDI). Instituto Brasileiro de Geografia e Estatística (IBGE). Elaboração: Fundação João Pinheiro (FJP), Centro de Estatística e Informações (CEI).
CENTRAL
NORTE DE MINAS
JEQUITINHONHA-MUCURI
TRIÂNGULO
NOROESTE DE MINAS
ALTO PARANAÍBA
SUL DE MINAS
CENTRO-OESTE
MATA
RIO DOCE
Unaí
Paracatu
Uberaba
Uberlândia
Teófilo Otoni
Janaúba
Montes Claros
Patos de Minas
Araxá
Nanuque
Muriaé
Juiz de Fora
Ubá
Governador Valadares
ItaúnaDivinópolis
BetimManhuaçu
Varginha
Pouso Alegre
Poços de Caldas
Belo Horizonte
Ipatinga
0 50 100 150 kmMunicípios com maior populaçãopor Região de Planejamento
Contagem
Mapa 2: Regiões para fins de planejamentoMinas Gerais
1. Caracterização do Território
14 1514 15
TRIÂNGULO/ALTO PARANAÍBACENTRAL MINEIRA
SUL/SUDOESTEDE MINAS
NOROESTEDE MINAS
METROPOLITANAVALE DO
RIO DOCE
JEQUITINHONHA
VALE DO MUCURI
OESTE DE MINASZONA DA
MATA
NORTE DE MINAS
DE BELOHORIZONTE
CAMPODASVERTENTES
Ubá
Unaí
Betim
Muriaé
Itaúna
Lavras
Nanuque
Janaúba
Curvelo
UberabaIpatinga
Almenara
Paracatu
Contagem
Varginha
Barbacena
Diamantina
Uberlândia
Divinópolis
Juiz de Fora
Pouso Alegre
Teófilo Otoni
Montes Claros
Belo HorizonteLagoa da Prata
Poços de Caldas
Governador Valadares
0 50 100 150 kmMunicípios mais populosospor Mesorregião
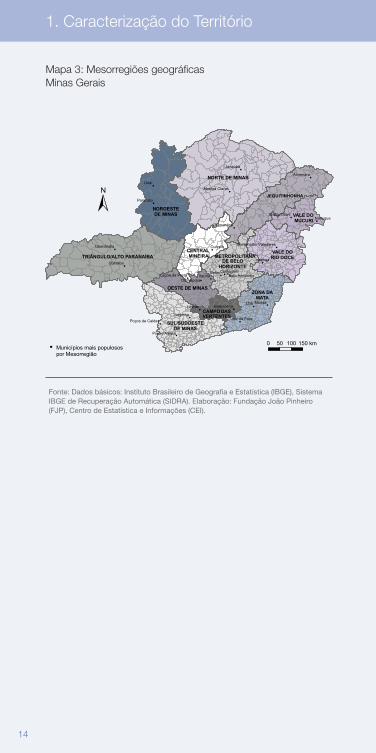
Mapa 3: Mesorregiões geográficasMinas Gerais
Fonte: Dados básicos: Instituto Brasileiro de Geografia e Estatística (IBGE), Sistema IBGE de Recuperação Automática (SIDRA). Elaboração: Fundação João Pinheiro (FJP), Centro de Estatística e Informações (CEI).
1. Caracterização do Território
14 1514 15
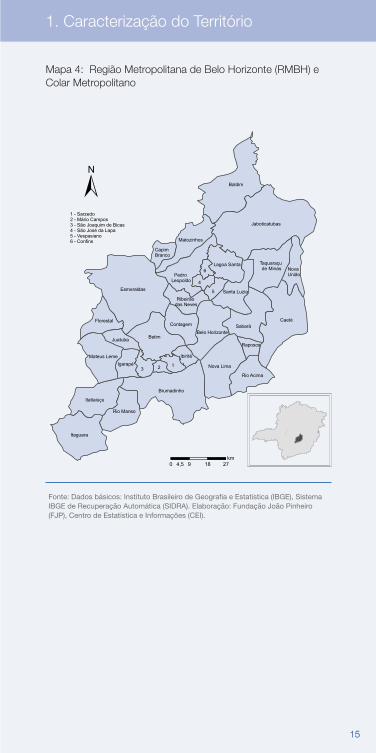
Mapa 4: Região Metropolitana de Belo Horizonte (RMBH) e Colar Metropolitano
12
Taquaraçu de Minas
Pedro Leopoldo
Capim Branco
Ribeirão das Neves
3
Nova União
Raposos
4
5
6
Caeté
Baldim
Esmeraldas
Jaboticatubas
Betim
Brumadinho
Itaguara
Sabará
Nova Lima
Itatiaiuçu
Mateus Leme
Rio Manso
Rio Acima
Matozinhos
Belo Horizonte
Florestal
Santa Luzia
Contagem
Lagoa Santa
Igarapé
Juatuba
Ibirité
1 - Sarzedo2 - Mário Campos3 - São Joaquim de Bicas 4 - São José da Lapa5 - Vespasiano6 - Confins
0 9 18 274,5km
Fonte: Dados básicos: Instituto Brasileiro de Geografia e Estatística (IBGE), Sistema IBGE de Recuperação Automática (SIDRA). Elaboração: Fundação João Pinheiro (FJP), Centro de Estatística e Informações (CEI).
1. Caracterização do Território
16 17
Esp
ecifi
caçã
oN
úmer
oÁ
rea
(ha)
Áre
a M
G (%
)To
tal d
e U
Cs
Est
adua
is29
42.
986.
228
100,
0P
rote
ção
Inte
gra
l73
477.
972
16,0
Par
que
Est
adua
l38
417.
592
14,0
ab
erto
s à
visi
taçã
o p
úblic
a8
66.4
532,
2
fech
ado
s à
visi
taçã
o p
úblic
a30
351.
139
11,8
Est
ação
Eco
lóg
ica
Est
adua
l (E
EE
)11
12.5
290,
4R
eser
va B
ioló
gic
a9
16.9
770,
6M
onu
men
to N
atur
al E
stad
ual
118.
582
0,3
Ref
úgio
Est
adua
l de
Vid
a S
ilves
tre
422
.293
0,7
Uso
Sus
tent
ável
201
2.31
0.36
877
,4Á
rea
de
Pro
teçã
o A
mb
ient
al (A
PA
)16
2.15
4.70
672
,2R
eser
va P
artic
ular
do
Pat
rim
ôni
o N
atur
al E
stad
ual (
RP
PN
)18
290
.148
3,0
Res
erva
de
Des
envo
lvim
ento
Sus
tent
ável
160
.975
2,0
Flo
rest
a E
stad
ual (
FLO
E)
24.
539
0,2
Áre
a d
e P
rote
ção
Esp
ecia
l Est
adua
l (A
PE
E)
2019
7.88
76,
6
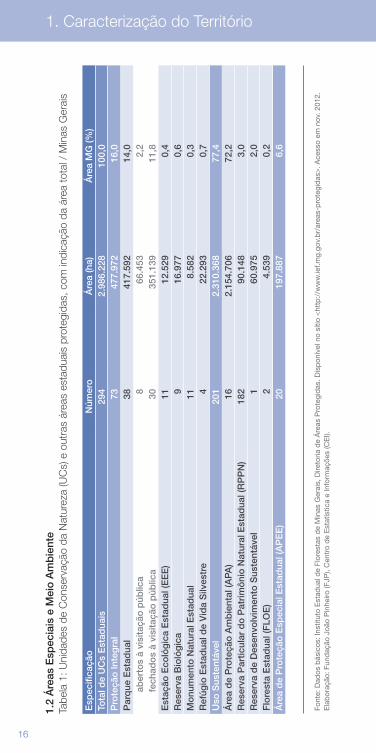
1.2
Áre
as E
spec
iais
e M
eio
Am
bie
nte
Tabe
la 1
: Uni
dade
s de
Con
serv
ação
da
Nat
urez
a (U
Cs)
e o
utra
s ár
eas
esta
duai
s pr
oteg
idas
, com
indi
caçã
o da
áre
a to
tal /
Min
as G
erai
s
Font
e: D
ados
bás
icos
: Ins
titut
o E
stad
ual d
e Fl
ores
tas
de
Min
as G
erai
s, D
ireto
ria d
e Á
reas
Pro
tegi
das
. Dis
pon
ível
no
sítio
<ht
tp:/
/ww
w.ie
f.mg.
gov.
br/
area
s-p
rote
gid
as>
. Ace
sso
em n
ov. 2
012.
E
lab
oraç
ão: F
und
ação
Joã
o P
inhe
iro (F
JP),
Cen
tro
de
Est
atís
tica
e In
form
açõe
s (C
EI).
1. Caracterização do Território
16 17
Esp
ecifi
caçã
oLo
caliz
ação
da
nasc
ente
Fo
zLo
caliz
ação
da
foz
Ext
ensã
o (k
m)
Est
adua
l
Rio
das
Vel
has
Our
o P
reto
Rio
São
Fra
ncis
coVá
rzea
da
Pal
ma
787,
2
Rio
Par
aop
eba
Cri
stia
no O
toni
Rep
resa
de
Três
Mar
ias
Fel
ixlâ
ndia
541,
3
Rio
Ara
gua
riS
ão R
oq
ue d
e M
inas
Rep
resa
de
Itum
bia
raA
rag
uari
523,
0
Rio
Par
acat
uLa
gam
arR
io S
ão F
ranc
isco
Bur
itize
iro51
3,8
Rio
Ara
çuaí
Rio
Ver
mel
hoR
io J
equi
tinho
nha
Ara
çuaí
388,
9
Rio
Ab
aeté
Rio
Par
anaí
ba
Rio
São
Fra
ncis
coS
ão G
onç
alo
do
Ab
aeté
306,
1
Rio
Sua
çuí G
rand
eM
ater
lând
iaR
io D
oce
Go
vern
ado
r Va
lad
ares
297,
8
Rio
Pir
ang
aR
essa
qui
nha
Rio
Do
ceP
ont
e N
ova
294,
3
Rio
Par
áD
este
rro
de
Ent
re R
ios
Rio
São
Fra
ncis
coP
om
péu
291,
0
Rio
Tiju
coU
ber
aba
Rep
resa
de
São
Sim
ãoIt
uiut
aba
289,
2
Fed
eral
Rio
São
Fra
ncis
coS
ão R
oq
ue d
e M
inas
(MG
)O
cean
o A
tlânt
ico
Pia
çab
uçu
(AL)
(1)
2.69
4,3
Rio
Gra
nde
Bo
cain
a d
e M
inas
(MG
)R
io P
aran
áC
arne
irin
ho (M
G) (
2)1.
412,
0
Rio
Par
anaí
ba
Rio
Par
anaí
ba
(MG
)R
io P
aran
áC
arne
irin
ho (M
G) (
2)1.
142,
5
Rio
Jeq
uitin
honh
aS
erro
(MG
)O
cean
o A
tlânt
ico
Bel
mo
nte
(BA
)1.
003,
8(Con
tinua
)
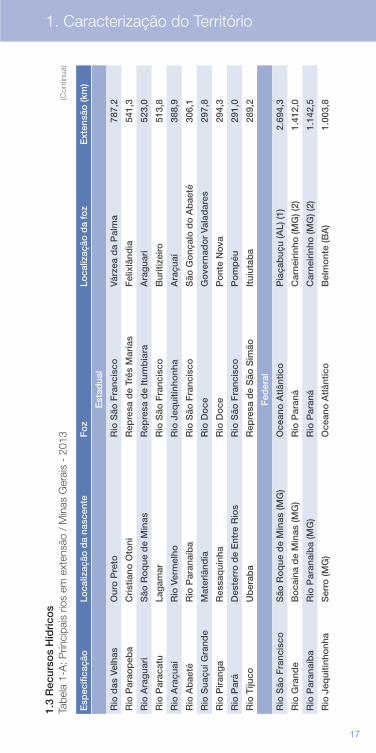
1.3
Rec
urso
s H
ídri
cos
Tabe
la 1
-A: P
rinci
pais
rio
s em
ext
ensã
o /
Min
as G
erai
s -
2013
1. Caracterização do Território
18 19
Esp
ecifi
caçã
oLo
caliz
ação
da
nasc
ente
Fo
zLo
caliz
ação
da
foz
Ext
ensã
o (k
m)
Fed
eral
Rio
Par
aíb
a d
o S
ulP
arai
bun
a (S
P)
Oce
ano
Atlâ
ntic
oS
ão J
oão
da
Bar
ra (R
J)78
5,5
Rio
Par
do
Mo
ntez
uma
(MG
)O
cean
o A
tlânt
ico
Can
avie
iras
(BA
)73
6,6
Rio
Ver
de
Gra
nde
Mo
ntes
Cla
ros
(MG
)R
io S
ão F
ranc
isco
Mat
ias
Car
do
so (M
G) (
3)55
2,3
Rio
Do
ceS
anta
Cru
z d
o E
scal
vad
o (M
G)
Oce
ano
Atlâ
ntic
oLi
nhar
es (E
S)
550,
7
Rio
São
Mar
cos
Cri
stal
ina
(GO
)R
epre
sa d
e E
mb
orc
ação
D
avin
óp
olis
(GO
)49
4,4
Rio
Sap
ucaí
Cam
po
s d
o J
ord
ão (S
P)
Rep
resa
de
Fur
nas
Cap
itólio
(MG
)47
8,7
Rio
Car
inha
nha
Fo
rmo
so (G
O)
Rio
São
Fra
ncis
coJu
vení
lia (M
G) (
4)45
6,2
Rio
Pre
toB
rasí
lia (D
F)
Rio
Par
acat
uU
naí (
MG
)43
2,4
Rio
Muc
uri
Lad
ainh
a (M
G)
Oce
ano
Atlâ
ntic
oM
ucur
i (B
A)
377,
0
Rio
Itan
hém
Fro
ntei
ra d
os
Vale
s (M
G)
Oce
ano
Atlâ
ntic
oA
lco
baç
a (B
A)
245,
9
Rio
Juc
uruç
uF
elis
bur
go
(MG
)O
cean
o A
tlânt
ico
Pra
do
(BA
)19
8,0
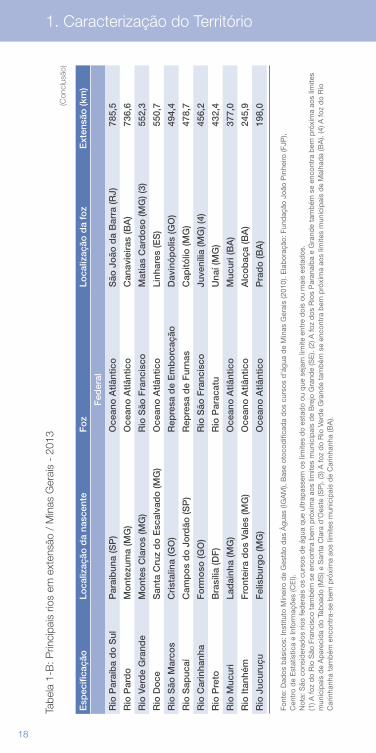
Tabe
la 1
-B: P
rinci
pais
rio
s em
ext
ensã
o /
Min
as G
erai
s -
2013
(Con
clus
ão)
Font
e: D
ados
bás
icos
: Ins
titut
o M
inei
ro d
e G
estã
o d
as Á
guas
(IG
AM
), B
ase
otoc
odifi
cad
a d
os c
urso
s d
’águ
a d
e M
inas
Ger
ais
(201
0). E
lab
oraç
ão: F
und
ação
Joã
o P
inhe
iro (F
JP),
C
entr
o d
e E
stat
ístic
a e
Info
rmaç
ões
(CE
I).N
ota:
São
con
sid
erad
os r
ios
fed
erai
s os
cur
sos
de
água
que
ultr
apas
sem
os
limite
s d
o es
tad
o ou
que
sej
am li
mite
ent
re d
ois
ou m
ais
esta
dos
. (1
) A fo
z d
o R
io S
ão F
ranc
isco
tam
bém
se
enco
ntra
bem
pró
xim
a ao
s lim
ites
mun
icip
ais
de
Bre
jo G
rand
e (S
E).
(2) A
foz
dos
Rio
s P
aran
aíb
a e
Gra
nde
tam
bém
se
enco
ntra
bem
pró
xim
a ao
s lim
ites
mun
icip
ais
de
Ap
arec
ida
do
Tab
oad
o (M
S) e
San
ta C
lara
d’O
este
(SP
). (3
) A fo
z d
o R
io V
erd
e G
rand
e ta
mb
ém s
e en
cont
ra b
em p
róxi
ma
aos
limite
s m
unic
ipai
s d
e M
alha
da
(BA
). (4
) A fo
z d
o R
io
Car
inha
nha
tam
bém
enc
ontr
a-se
bem
pró
xim
a ao
s lim
ites
mun
icip
ais
de
Car
inha
nha
(BA
).
1. Caracterização do Território
18 19
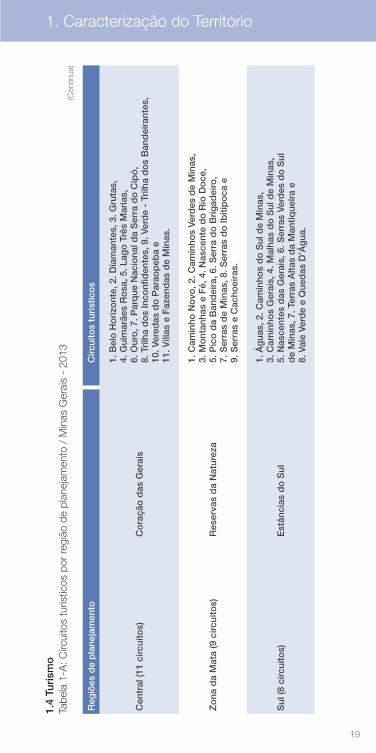
1.4
Turi
smo
Tabe
la 1
-A: C
ircui
tos
turís
ticos
por
regi
ão d
e pl
anej
amen
to /
Min
as G
erai
s -
2013
Reg
iões
de
pla
neja
men
toC
ircui
tos
turí
stic
os
Cen
tral
(11
circ
uito
s)C
ora
ção
das
Ger
ais
1. B
elo
Ho
rizo
nte,
2. D
iam
ante
s, 3
. Gru
tas,
4.
Gui
mar
ães
Ro
sa, 5
. Lag
o T
rês
Mar
ias,
6.
Our
o, 7
. Par
que
Nac
iona
l da
Ser
ra d
o C
ipó
, 8.
Tri
lha
do
s In
conf
iden
tes,
9. V
erd
e -
Trilh
a d
os
Ban
dei
rant
es,
10. V
ered
as d
o P
arao
peb
a e
11
. Vill
as e
Faz
end
as d
e M
inas
.
Zo
na d
a M
ata
(9 c
ircui
tos)
Res
erva
s d
a N
atur
eza
1. C
amin
ho N
ovo
, 2. C
amin
hos
Verd
es d
e M
inas
, 3.
Mo
ntan
has
e F
é, 4
. Nas
cent
e d
o R
io D
oce
, 5.
Pic
o d
a B
and
eira
, 6. S
erra
do
Bri
gad
eiro
, 7.
Ser
ras
de
Min
as, 8
. Ser
ras
do
Ibiti
po
ca e
9.
Ser
ras
e C
acho
eira
s.
Sul
(8 c
ircui
tos)
E
stân
cias
do
Sul
1. Á
gua
s, 2
. Cam
inho
s d
o S
ul d
e M
inas
, 3.
Cam
inho
s G
erai
s, 4
. Mal
has
do
Sul
de
Min
as,
5. N
asce
ntes
das
Ger
ais,
6. S
erra
s Ve
rdes
do
Sul
d
e M
inas
, 7. T
erra
s A
ltas
da
Man
tique
ira
e
8. V
ale
Verd
e e
Que
das
D’Á
gua
.
(Con
tinua
)
Font
e: D
ados
bás
icos
: Ins
titut
o M
inei
ro d
e G
estã
o d
as Á
guas
(IG
AM
), B
ase
otoc
odifi
cad
a d
os c
urso
s d
’águ
a d
e M
inas
Ger
ais
(201
0). E
lab
oraç
ão: F
und
ação
Joã
o P
inhe
iro (F
JP),
C
entr
o d
e E
stat
ístic
a e
Info
rmaç
ões
(CE
I).N
ota:
São
con
sid
erad
os r
ios
fed
erai
s os
cur
sos
de
água
que
ultr
apas
sem
os
limite
s d
o es
tad
o ou
que
sej
am li
mite
ent
re d
ois
ou m
ais
esta
dos
. (1
) A fo
z d
o R
io S
ão F
ranc
isco
tam
bém
se
enco
ntra
bem
pró
xim
a ao
s lim
ites
mun
icip
ais
de
Bre
jo G
rand
e (S
E).
(2) A
foz
dos
Rio
s P
aran
aíb
a e
Gra
nde
tam
bém
se
enco
ntra
bem
pró
xim
a ao
s lim
ites
mun
icip
ais
de
Ap
arec
ida
do
Tab
oad
o (M
S) e
San
ta C
lara
d’O
este
(SP
). (3
) A fo
z d
o R
io V
erd
e G
rand
e ta
mb
ém s
e en
cont
ra b
em p
róxi
ma
aos
limite
s m
unic
ipai
s d
e M
alha
da
(BA
). (4
) A fo
z d
o R
io
Car
inha
nha
tam
bém
enc
ontr
a-se
bem
pró
xim
a ao
s lim
ites
mun
icip
ais
de
Car
inha
nha
(BA
).
1. Caracterização do Território
20
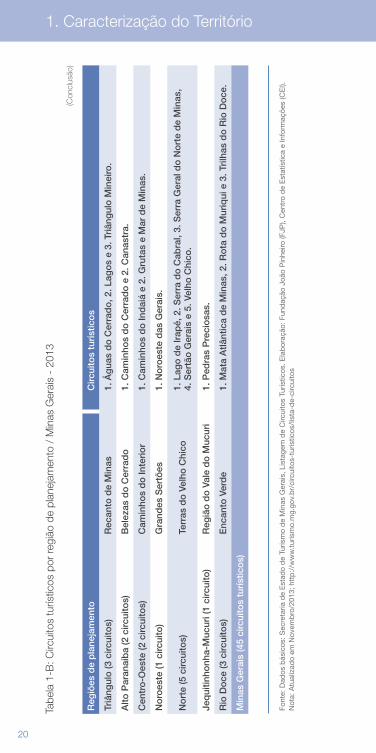
Tabe
la 1
-B: C
ircui
tos
turís
ticos
por
regi
ão d
e pl
anej
amen
to /
Min
as G
erai
s -
2013
Reg
iões
de
pla
neja
men
toC
ircui
tos
turí
stic
os
Triâ
ngul
o (3
circ
uito
s)R
ecan
to d
e M
inas
1. Á
gua
s d
o C
erra
do
, 2. L
ago
s e
3. T
riân
gul
o M
inei
ro.
Alto
Par
anaí
ba
(2 c
ircui
tos)
Bel
ezas
do
Cer
rad
o1.
Cam
inho
s d
o C
erra
do
e 2
. Can
astr
a.
Cen
tro
-Oes
te (2
circ
uito
s)C
amin
hos
do
Inte
rio
r1.
Cam
inho
s d
o In
dai
á e
2. G
ruta
s e
Mar
de
Min
as.
No
roes
te (1
circ
uito
)G
rand
es S
ertõ
es1.
No
roes
te d
as G
erai
s.
No
rte
(5 c
ircui
tos)
Terr
as d
o V
elho
Chi
co1.
Lag
o d
e Ir
apé,
2. S
erra
do
Cab
ral,
3. S
erra
Ger
al d
o N
ort
e d
e M
inas
, 4.
Ser
tão
Ger
ais
e 5.
Vel
ho C
hico
.
Jeq
uitin
honh
a-M
ucur
i (1
circ
uito
)R
egiã
o d
o V
ale
do
Muc
uri
1. P
edra
s P
reci
osa
s.
Rio
Do
ce (3
circ
uito
s)E
ncan
to V
erd
e1.
Mat
a A
tlânt
ica
de
Min
as, 2
. Ro
ta d
o M
uriq
ui e
3. T
rilh
as d
o R
io D
oce
.
Min
as G
erai
s (4
5 ci
rcui
tos
turí
stic
os)
(Con
clus
ão)
Font
e: D
ados
bás
icos
: Sec
reta
ria d
e E
stad
o d
e Tu
rism
o d
e M
inas
Ger
ais,
Lis
tage
m d
e C
ircui
tos
Turís
ticos
. Ela
bor
ação
: Fun
daç
ão J
oão
Pin
heiro
(FJP
), C
entr
o d
e E
stat
ístic
a e
Info
rmaç
ões
(CE
I).
Not
a: A
tual
izad
o em
Nov
emb
ro/2
013;
htt
p:/
/ww
w.t
uris
mo.
mg.
gov.
br/
circ
uito
s-tu
ristic
os/li
sta-
de-
circ
uito
s
1. Caracterização do Território
21
Aspectos Setoriais da Economia
2
22 23
2. Aspectos Setoriais da Economia
Pro
dut
oU
nid
.M
inas
Ger
ais
Bra
sil
MG
/BR
(%)
Po
siçã
o M
G/B
R
2009
2010
2011
2012
2009
2010
2011
2012
2012
Ab
acax
i m
ilhõ
es d
e fr
uto
s25
622
222
925
11.
471
1.47
01.
577
1.69
814
,83º
Alh
o
mil
t22
1941
1887
104
143
107
16,9
3º
Ban
ana
cach
os
(mil
t)62
165
465
568
76.
783
6.96
97.
329
6.90
210
,04º
Bat
ata-
ing
lesa
mil
t1.
134
1.14
41.
275
1.18
23.
444
3.54
83.
917
3.73
231
,71º
Caf
é em
grã
o (m
il t)
1.19
51.
504
1.33
61.
596
2.44
02.
907
2.70
13.
038
52,5
1º
Can
a-d
e-aç
úcar
mil
t58
.384
60.6
0367
.732
70.5
2169
1.60
671
7.46
473
4.00
672
1.07
79,
82º
Fei
jão
mil
t60
262
458
363
43.
487
3.15
93.
435
2.79
522
,72º
Lara
nja
mil
t75
081
782
486
417
.618
18.5
0319
.811
18.0
134,
84º
Man
dio
cam
il t
864
795
816
824
24.4
0424
.967
25.3
5023
.045
3,6
9º
Milh
om
il t
6.53
76.
090
6.53
67.
625
50.7
2055
.364
55.6
6071
.073
10,7
4º
So
jam
il t
2.75
12.
902
2.94
13.
073
57.3
4568
.756
74.8
1565
.849
4,7
7º
Tom
ate
mil
t47
849
247
644
54.
310
4.10
74.
417
3.87
411
,53º
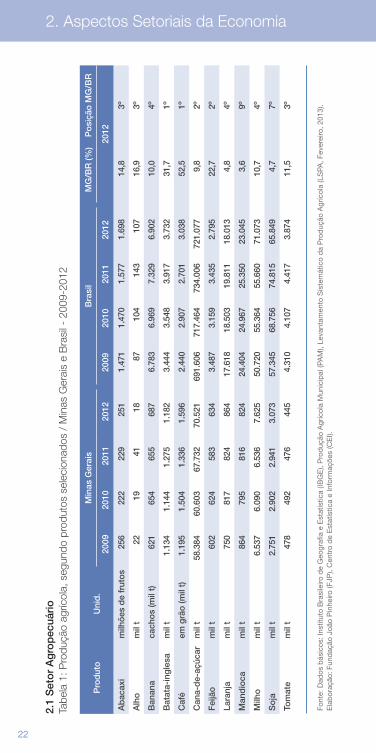
2.1
Set
or
Ag
rop
ecuá
rio
Tabe
la 1
: Pro
duçã
o ag
rícol
a, s
egun
do p
rodu
tos
sele
cion
ados
/ M
inas
Ger
ais
e B
rasi
l - 2
009-
2012
Font
e: D
ados
bás
icos
: Ins
titut
o B
rasi
leiro
de
Geo
graf
ia e
Est
atís
tica
(IBG
E),
Pro
duç
ão A
gríc
ola
Mun
icip
al (P
AM
), Le
vant
amen
to S
iste
mát
ico
da
Pro
duç
ão A
gríc
ola
(LS
PA, F
ever
eiro
, 201
3).
Ela
bor
ação
: Fun
daç
ão J
oão
Pin
heiro
(FJP
), C
entr
o d
e E
stat
ístic
a e
Info
rmaç
ões
(CE
I).
22 23
Pro
dut
oM
inas
Ger
ais
Bra
sil
MG
/BR
(%)
Po
siçã
o M
G/B
R20
0920
1020
1120
1220
0920
1020
1120
1220
12R
eban
hos
(mil
cab
eças
)A
sini
no31
2828
271.
030
1.00
297
590
32,
98º
Bo
vino
22.4
7022
.698
23.9
0823
.966
205.
308
209.
541
212.
815
211.
279
11,3
2ºB
ubal
ino
38
4249
561.
135
1.18
51.
278
1.26
24,
47º
Cap
rino
12
011
911
311
59.
164
9.31
39.
386
8.64
61,
39º
Co
do
rnas
743
902
1.11
81.
376
11.4
8512
.992
15.5
6816
.436
8,4
4ºC
oel
hos
1718
1715
236
226
234
205
7,2
4ºE
qui
no
800
802
787
785
5.49
75.
514
5.51
15.
363
14,6
1ºG
alin
has
23.1
8621
.761
21.6
5821
.266
208.
871
210.
761
216.
220
213.
230
10,0
3ºG
alo
s, f
rang
as, f
rang
os
e p
into
s74
.958
75.2
1194
.347
94.3
661.
021.
215
1.02
8.15
11.
051.
990
1.03
2.03
99,
15º
Mua
r 16
015
815
715
41.
276
1.27
71.
269
1.22
212
,62º
Ovi
no
223
228
221
226
16.8
1217
.381
17.6
6816
.789
1,3
14º
Suí
no4.
640
5.02
25.
014
5.15
738
.045
38.9
5739
.307
38.7
9613
,34º
Pro
dut
os
de
Ori
gem
Ani
mal
Lã (m
il kg
)8
98
711
.395
11.6
4611
.805
11.9
940,
16º
Leite
(milh
ões
de
litro
s)
7.93
18.
388
8.75
68.
906
29.0
8530
.715
32.0
9632
.304
27,6
1ºM
el d
e ab
elha
(mil
kg)
2.60
63.
076
3.07
63.
399
39.0
3038
.073
41.7
9333
.932
10,0
4ºO
vos
de
cod
orn
a (m
ilhõ
es d
e d
úzia
s)14
1822
2619
223
226
028
59,
32º
Ovo
s d
e g
alin
ha (m
ilhõ
es d
e d
úzia
s)38
537
536
636
63.
188
3.24
73.
394
3.47
310
,53º
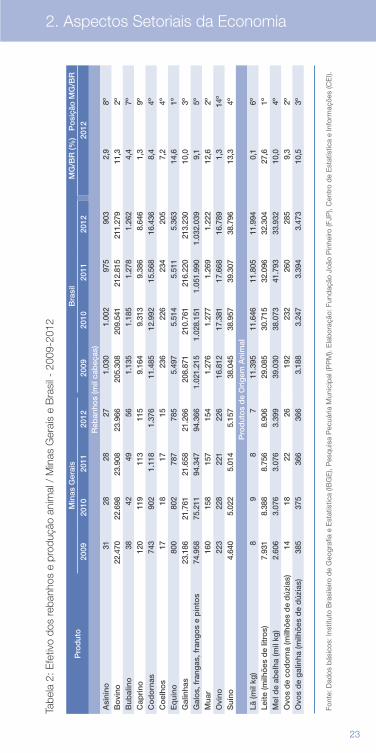
Tabe
la 2
: Efe
tivo
dos
reba
nhos
e p
rodu
ção
anim
al /
Min
as G
erai
s e
Bra
sil -
200
9-20
12
Font
e: D
ados
bás
icos
: Ins
titut
o B
rasi
leiro
de
Geo
graf
ia e
Est
atís
tica
(IBG
E),
Pro
duç
ão A
gríc
ola
Mun
icip
al (P
AM
), Le
vant
amen
to S
iste
mát
ico
da
Pro
duç
ão A
gríc
ola
(LS
PA, F
ever
eiro
, 201
3).
Ela
bor
ação
: Fun
daç
ão J
oão
Pin
heiro
(FJP
), C
entr
o d
e E
stat
ístic
a e
Info
rmaç
ões
(CE
I).
Font
e: D
ados
bás
icos
: Ins
titut
o B
rasi
leiro
de
Geo
graf
ia e
Est
atís
tica
(IBG
E),
Pes
qui
sa P
ecuá
ria M
unic
ipal
(PP
M).
Ela
bor
ação
: Fun
daç
ão J
oão
Pin
heiro
(FJP
), C
entr
o d
e E
stat
ístic
a e
Info
rmaç
ões
(CE
I).
2. Aspectos Setoriais da Economia
24 25
2. Aspectos Setoriais da Economia
Pro
dut
oU
nid
.M
inas
Ger
ais
Bra
sil
MG
/BR
(%)
2009
2010
2011
2012
2013
2009
2010
2011
2012
2013
2012
2013
Fer
ro-g
usa
mil
t10
.663
13
.780
10
.651
10
.552
10
.282
20
.862
25
.837
27
.591
26
.900
26
.200
39
,239
,2
Lam
inad
os
e se
mia
cab
ado
s p
ara
vend
asm
il t
8.34
5 10
.979
10
.994
10
.643
10
.045
25
.684
31
.571
33
.278
32
.834
31
.885
32
,431
,5
Aço
bru
tom
il t
8.70
5 11
.634
11
.704
11
.780
11
.522
26
.506
32
.948
35
.220
34
.524
34
.163
34
,133
,7
Cim
ento
mil
t12
.979
14
.162
15
.240
16
.465
14
.587
51.6
16
59.1
17
64.0
93
68.8
09
70.2
20
23,9
20,8
Veíc
ulo
s (1
)m
il un
id.
764
788
788
847
796
3.18
3 3.
647
3.44
3 3.
431
3.73
7 24
,721
,3
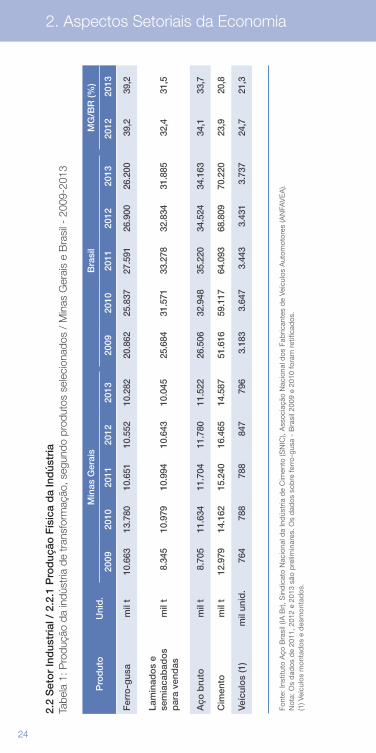
2.2
Set
or
Ind
ustr
ial /
2.2
.1 P
rod
ução
Fís
ica
da
Ind
ústr
iaTa
bela
1: P
rodu
ção
da in
dúst
ria d
e tr
ansf
orm
ação
, seg
undo
pro
duto
s se
leci
onad
os /
Min
as G
erai
s e
Bra
sil -
200
9-20
13
Font
e: In
stitu
to A
ço B
rasi
l (IA
Br)
, Sin
dic
ato
Nac
iona
l da
Ind
ústr
ia d
e C
imen
to (S
NIC
), A
ssoc
iaçã
o N
acio
nal d
os F
abric
ante
s d
e Ve
ícul
os A
utom
otor
es (A
NFA
VE
A).
Not
a: O
s d
ados
de
2011
, 201
2 e
2013
são
pre
limin
ares
. Os
dad
os s
obre
ferr
o-gu
sa -
Bra
sil 2
009
e 20
10 fo
ram
ret
ifica
dos
. (1
) Veí
culo
s m
onta
dos
e d
esm
onta
dos
.
24 25
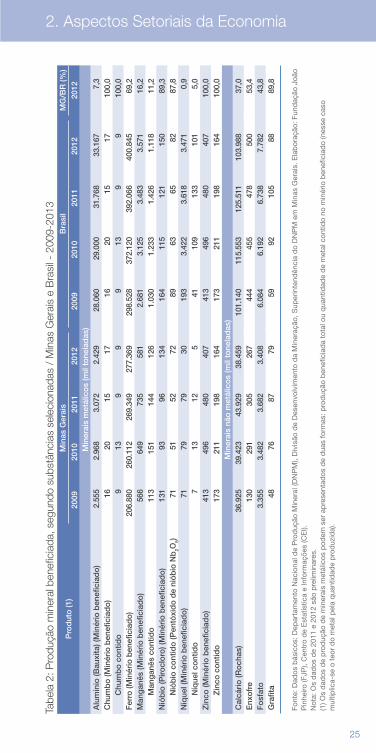
Tabe
la 2
: Pro
duçã
o m
iner
al b
enef
icia
da, s
egun
do s
ubst
ânci
as s
elec
iona
das
/ M
inas
Ger
ais
e B
rasi
l - 2
009-
2013
Font
e: D
ados
bás
icos
: Dep
arta
men
to N
acio
nal d
e P
rod
ução
Min
eral
(DN
PM
), D
ivis
ão d
e D
esen
volv
imen
to d
a M
iner
ação
, Sup
erin
tend
ênci
a d
o D
NP
M e
m M
inas
Ger
ais.
Ela
bor
ação
: Fun
daç
ão J
oão
Pin
heiro
(FJP
), C
entr
o d
e E
stat
ístic
a e
Info
rmaç
ões
(CE
I).
Not
a: O
s d
ados
de
2011
e 2
012
são
pre
limin
ares
. (1
) Os
dad
os d
e p
rod
ução
de
min
erai
s m
etál
icos
pod
em s
er a
pre
sent
ados
de
dua
s fo
rmas
: pro
duç
ão b
enef
icia
da
tota
l ou
qua
ntid
ade
de
met
al c
ontid
o no
min
ério
ben
efic
iad
o (n
esse
cas
o m
ultip
lica-
se o
teo
r d
o m
etal
pel
a q
uant
idad
e p
rod
uzid
a).
2. Aspectos Setoriais da Economia
Pro
dut
o (1
)M
inas
Ger
ais
Bra
sil
MG
/BR
(%)
2009
2010
2011
2012
2009
2010
2011
2012
2012
Min
erai
s m
etál
ico
s (m
il to
nela
das
)A
lum
ínio
(Bau
xita
) (M
inér
io b
enef
icia
do
)2.
555
2.96
83.
072
2.42
928
.060
29.0
0031
.768
33.1
677,
3C
hum
bo
(Min
ério
ben
efic
iad
o)
1620
1517
1620
1517
100,
0
Chu
mb
o c
ont
ido
913
99
913
99
100,
0F
erro
(Min
ério
ben
efic
iad
o)
206.
880
260.
112
269.
349
277.
369
298.
528
372.
120
392.
066
400.
845
69,2
Man
gan
ês (M
inér
io b
enef
icia
do
)56
664
973
558
12.
681
3.12
53.
483
3.57
116
,2
Man
gan
ês c
ont
ido
113
151
144
126
1.03
01.
233
1.42
61.
118
11,2
Nió
bio
(Piro
clo
ro) (
Min
ério
ben
efic
iad
o)
131
9396
134
164
115
121
150
89,3
N
iób
io c
ont
ido
(Pen
tóxi
do
de
nió
bio
Nb
2O5)
7151
5272
8963
6582
87,8
Níq
uel (
Min
ério
ben
efic
iad
o)
7179
7930
193
3.42
23.
618
3.47
10,
9
Níq
uel c
ont
ido
713
125
4110
913
310
15,
0Z
inco
(Min
ério
ben
efic
iad
o)
413
496
480
407
413
4
96
480
4
07
100,
0
Zin
co c
ont
ido
173
211
198
164
173
2
11
198
1
64
100,
0M
iner
ais
não
met
álic
os
(mil
tone
lad
as)
Cal
cári
o (R
och
as)
36.9
2539
.423
43.9
2938
.459
101.
140
115.
553
125.
511
103.
988
37,0
Enx
ofr
e13
029
130
526
744
445
547
850
053
,4F
osf
ato
3.35
53.
482
3.68
23.
408
6.08
46.
192
6.73
87.
782
43,8
Gra
fita
4876
8779
5992
105
8889
,8

26

27
InfraestruturaBásica
3
28 29
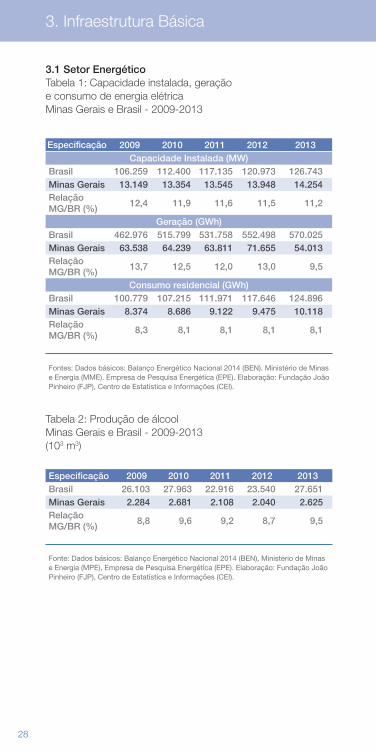
3.1 Setor EnergéticoTabela 1: Capacidade instalada, geração e consumo de energia elétricaMinas Gerais e Brasil - 2009-2013
Tabela 2: Produção de álcoolMinas Gerais e Brasil - 2009-2013(103 m3)
Especificação 2009 2010 2011 2012 2013Capacidade Instalada (MW)
Brasil 106.259 112.400 117.135 120.973 126.743Minas Gerais 13.149 13.354 13.545 13.948 14.254Relação MG/BR (%)
12,4 11,9 11,6 11,5 11,2
Geração (GWh)Brasil 462.976 515.799 531.758 552.498 570.025Minas Gerais 63.538 64.239 63.811 71.655 54.013Relação MG/BR (%)
13,7 12,5 12,0 13,0 9,5
Consumo residencial (GWh)Brasil 100.779 107.215 111.971 117.646 124.896Minas Gerais 8.374 8.686 9.122 9.475 10.118Relação MG/BR (%)
8,3 8,1 8,1 8,1 8,1
Especificação 2009 2010 2011 2012 2013Brasil 26.103 27.963 22.916 23.540 27.651Minas Gerais 2.284 2.681 2.108 2.040 2.625Relação MG/BR (%)
8,8 9,6 9,2 8,7 9,5
Fonte: Dados básicos: Balanço Energético Nacional 2014 (BEN), Ministério de Minas e Energia (MPE), Empresa de Pesquisa Energética (EPE). Elaboração: Fundação João Pinheiro (FJP), Centro de Estatística e Informações (CEI).
Fontes: Dados básicos: Balanço Energético Nacional 2014 (BEN). Ministério de Minas e Energia (MME). Empresa de Pesquisa Energética (EPE). Elaboração: Fundação João Pinheiro (FJP), Centro de Estatística e Informações (CEI).
3. Infraestrutura Básica
28 29
3. Infraestrutura Básica
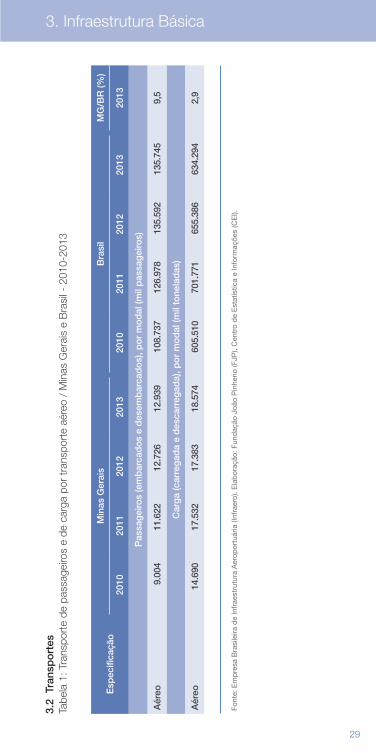
3.2
Tra
nsp
ort
esTa
bela
1: T
rans
port
e de
pas
sage
iros
e de
car
ga p
or tr
ansp
orte
aér
eo /
Min
as G
erai
s e
Bra
sil -
201
0-20
13
Font
e: E
mp
resa
Bra
sile
ira d
e In
frae
stru
tura
Aer
opor
tuár
ia (I
nfra
ero)
. Ela
bor
ação
: Fun
daç
ão J
oão
Pin
herio
(FJP
), C
entr
o d
e E
stat
ístic
a e
Info
rmaç
ões
(CE
I).
Esp
ecifi
caçã
oM
inas
Ger
ais
Bra
sil
MG
/BR
(%)
2010
2011
2012
2013
2010
2011
2012
2013
2013
Pas
sag
eiro
s (e
mb
arca
do
s e
des
emb
arca
do
s), p
or
mo
dal
(mil
pas
sag
eiro
s)
Aér
eo9.
004
11.6
2212
.726
12.9
3910
8.73
712
6.97
813
5.59
213
5.74
59,
5
Car
ga
(car
reg
ada
e d
esca
rreg
ada)
, po
r m
od
al (m
il to
nela
das
)
Aér
eo14
.690
17.5
3217
.383
18.5
7460
5.51
070
1.77
165
5.38
663
4.29
42,
9
30 3130 31
3. Infraestrutura Básica
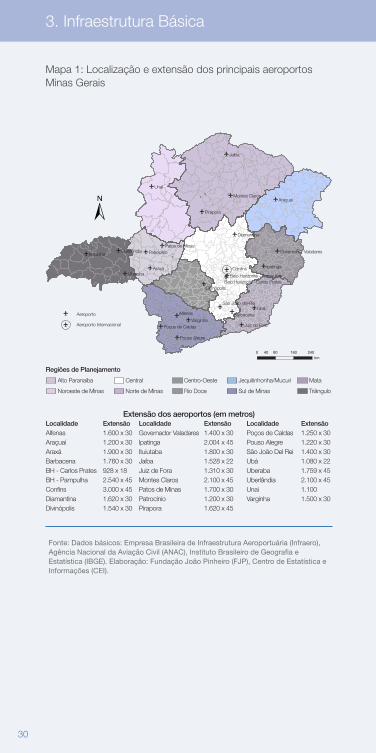
Mapa 1: Localização e extensão dos principais aeroportos Minas Gerais
Fonte: Dados básicos: Empresa Brasileira de Infraestrutura Aeroportuária (Infraero), Agência Nacional da Aviação Civil (ANAC), Instituto Brasileiro de Geografia e Estatística (IBGE). Elaboração: Fundação João Pinheiro (FJP), Centro de Estatística e Informações (CEI).
Ituiutaba Uberlândia
Araxá
UbáBarbacena
Uberaba
Patos de Minas
Pirapora
Unaí
Araçuaí
Jaíba
Diamantina
Montes Claros
Governador Valadares
Ipatinga
Belo Horizonte - PampulhaBelo Horizonte - Carlos Prates
São João del-Rei
Juiz de ForaVarginha
Poços de Caldas
Pouso Alegre
Patrocínio
Divinópolis
AlfenasAeroporto
Extensão dos aeroportos (em metros)Localidade Extensão Localidade Extensão Localidade ExtensãoAlfenas 1.600 x 30 Governador Valadares 1.400 x 30 Poços de Caldas 1.250 x 30Araçuaí 1.200 x 30 Ipatinga 2.004 x 45 Pouso Alegre 1.220 x 30Araxá 1.900 x 30 Ituiutaba 1.800 x 30 São João Del Rei 1.400 x 30Barbacena 1.760 x 30 Jaíba 1.528 x 22 Ubá 1.080 x 22BH - Carlos Prates 928 x 18 Juiz de Fora 1.310 x 30 Uberaba 1.759 x 45BH - Pampulha 2.540 x 45 Montes Claros 2.100 x 45 Uberlândia 2.100 x 45Confins 3.000 x 45 Patos de Minas 1.700 x 30 Unaí 1.100Diamantina 1.620 x 30 Patrocínio 1.200 x 30 Varginha 1.500 x 30Divinópolis 1.540 x 30 Pirapora 1.620 x 45
Aeroporto Internacional
Regiões de Planejamento
Alto Paranaíba Central Centro-Oeste Jequitinhonha/Mucuri Mata
Noroeste de Minas Norte de Minas Rio Doce Sul de Minas Triângulo
Confins
0 40 80 160 240km
30 3130 31
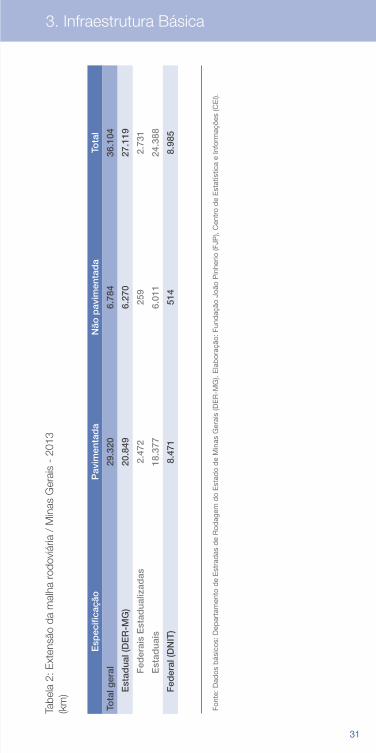
3. Infraestrutura Básica
Esp
ecifi
caçã
oP
avim
enta
da
Não
pav
imen
tad
aTo
tal
Tota
l ger
al
29.3
206.
784
36.1
04
E
stad
ual (
DE
R-M
G)
20.8
496.
270
27.1
19
Fed
erai
s E
stad
ualiz
adas
2.47
225
92.
731
Est
adua
is18
.377
6.01
124
.388
F
eder
al (D
NIT
)8.
471
514
8.98
5
Tabe
la 2
: Ext
ensã
o da
mal
ha ro
dovi
ária
/ M
inas
Ger
ais
- 20
13
(km
)
Font
e: D
ados
bás
icos
: Dep
arta
men
to d
e E
stra
das
de
Rod
agem
do
Est
ado
de
Min
as G
erai
s (D
ER
-MG
). E
lab
oraç
ão: F
und
ação
Joã
o P
inhe
rio (F
JP),
Cen
tro
de
Est
atís
tica
e In
form
açõe
s (C
EI).
32 33
3. Infraestrutura Básica
Esp
ecifi
caçã
oM
inas
Ger
ais
Bra
sil
MG
/BR
(%)
2009
2010
2011
2012
2013
2009
2010
2011
2012
2013
2013
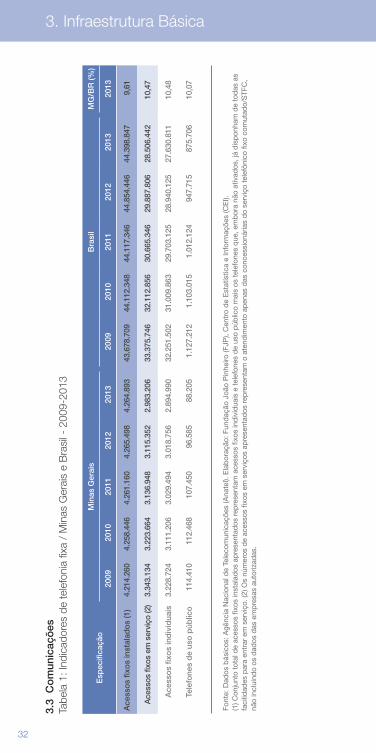
Ace
sso
s fix
os
inst
alad
os
(1)
4.21
4.26
04.
258.
446
4.26
1.16
04.
265.
498
4.26
4.89
343
.678
.709
44
.112
.348
44
.117
.346
44
.854
.446
44
.398
.847
9,
61
A
cess
os fi
xos
em s
ervi
ço (2
)3.
343.
134
3.22
3.66
43.
136.
948
3.11
5.35
22.
983.
206
33.3
75.7
46
32.1
12.8
56
30.6
65.3
46
29.8
87.8
06
28.5
06.4
42
10,4
7
Ace
sso
s fix
os
ind
ivid
uais
3.22
8.72
43.
111.
206
3.02
9.49
43.
018.
756
2.89
4.99
032
.251
.502
31
.009
.863
29
.703
.125
28
.940
.125
27
.630
.811
10
,48
Tele
fone
s d
e us
o p
úblic
o11
4.41
011
2.46
810
7.45
096
.585
88.2
051.
127.
212
1.10
3.01
5 1.
012.
124
947.
715
875.
706
10,0
7
3.3
Co
mun
icaç
ões
Tabe
la 1
: Ind
icad
ores
de
tele
foni
a fix
a /
Min
as G
erai
s e
Bra
sil -
200
9-20
13
Font
e: D
ados
bás
icos
: Agê
ncia
Nac
iona
l de
Tele
com
unic
açõe
s (A
nate
l). E
lab
oraç
ão: F
und
ação
Joã
o P
inhe
iro (F
JP),
Cen
tro
de
Est
atís
tica
e In
form
açõe
s (C
EI).
(1
) Con
junt
o to
tal d
e ac
esso
s fix
os in
stal
ados
ap
rese
ntad
os re
pre
sent
am a
cess
os fi
xos
ind
ivid
uais
e te
lefo
nes
de
uso
púb
lico
mai
s os
tele
fone
s q
ue, e
mb
ora
não
ativ
ados
, já
dis
pon
ham
de
tod
as a
s fa
cilid
ades
par
a en
trar
em
ser
viço
. (2)
Os
núm
eros
de
aces
sos
fixos
em
ser
viço
s ap
rese
ntad
os re
pre
sent
am o
ate
ndim
ento
ap
enas
das
con
cess
ioná
rias
do
serv
iço
tele
fôni
co fi
xo c
omut
ado/
STF
C,
não
incl
uind
o os
dad
os d
as e
mp
resa
s au
toriz
adas
.
32 33
3. Infraestrutura Básica
Esp
ecifi
caçã
oM
inas
Ger
ais
Bra
sil
MG
/BR
(%)
2009
2010
2011
2012
2013
2009
2010
2011
2012
2013
2013
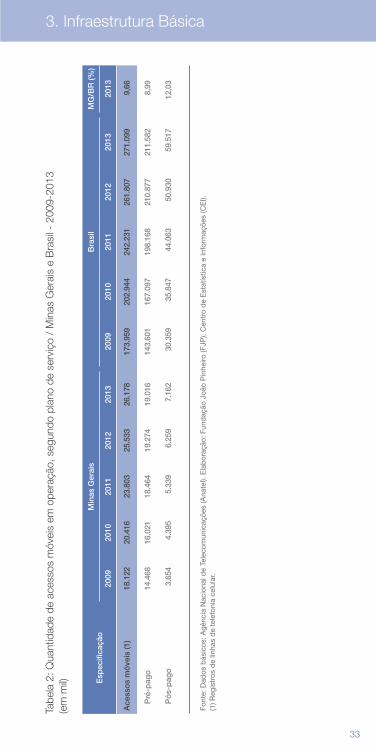
Ace
sso
s m
óve
is (1
)18
.122
20.4
1623
.803
25.5
3326
.178
173.
959
202.
944
242.
231
261.
807
271.
099
9,66
P
ré-p
ago
14.4
6816
.021
18.4
6419
.274
19.0
1614
3.60
116
7.09
719
8.16
821
0.87
721
1.58
28,
99
P
ós-
pag
o3.
654
4.39
55.
339
6.25
97.
162
30.3
5935
.847
44.0
6350
.930
59.5
1712
,03
Tabe
la 2
: Qua
ntid
ade
de a
cess
os m
óvei
s em
ope
raçã
o, s
egun
do p
lano
de
serv
iço
/ M
inas
Ger
ais
e B
rasi
l - 2
009-
2013
(e
m m
il)
Font
e: D
ados
bás
icos
: Agê
ncia
Nac
iona
l de
Tele
com
unic
açõe
s (A
nate
l). E
lab
oraç
ão: F
und
ação
Joã
o P
inhe
iro (F
JP),
Cen
tro
de
Est
atís
tica
e In
form
açõe
s (C
EI).
(1
) Reg
istr
os d
e lin
has
de
tele
foni
a ce
lula
r.
34 35
3. Infraestrutura Básica
Esp
ecifi
caçã
oN
úmer
o d
e as
sina
ntes
(mil)
Par
ticip
ação
no
Bra
sil (
% )
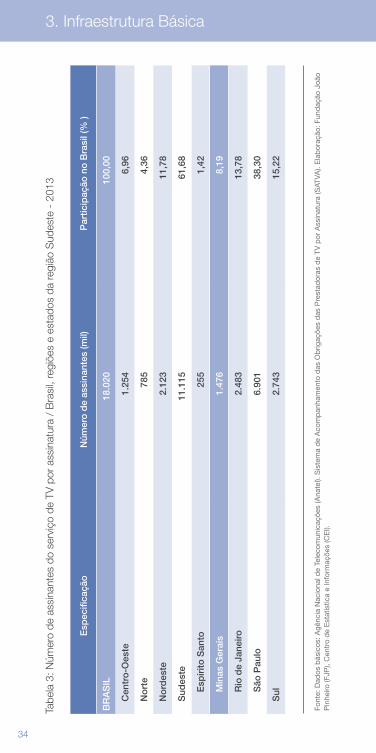
BR
AS
IL18
.020
100,
00
C
entr
o-O
este
1.25
46,
96
N
ort
e78
54,
36
N
ord
este
2.12
311
,78
S
udes
te11
.115
61,6
8
Esp
írito
San
to25
51,
42
Min
as G
erai
s1.
476
8,19
Rio
de
Jane
iro2.
483
13,7
8
São
Pau
lo6.
901
38,3
0
S
ul2.
743
15,2
2
Tabe
la 3
: Núm
ero
de a
ssin
ante
s do
ser
viço
de
TV p
or a
ssin
atur
a /
Bra
sil,
regi
ões
e es
tado
s da
regi
ão S
udes
te -
201
3
Font
e: D
ados
bás
icos
: Agê
ncia
Nac
iona
l de
Tele
com
unic
açõe
s (A
nate
l). S
iste
ma
de
Aco
mp
anha
men
to d
as O
brig
açõe
s d
as P
rest
ador
as d
e TV
por
Ass
inat
ura
(SAT
VA).
Ela
bor
ação
: Fun
daç
ão J
oão
Pin
heiro
(FJP
), C
entr
o d
e E
stat
ístic
a e
Info
rmaç
ões
(CE
I).
34 35
3. Infraestrutura Básica
Esp
ecifi
caçã
oC
oo
per
ativ
asA
sso
ciad
os
Em
pre
gad
os
BR
AS
IL6.
560
10.3
02.4
0530
1.66
5
N
ort
e78
916
5.15
67.
724
N
ord
este
1.73
855
0.13
820
.557
S
udes
te2.
324
4.99
5.40
999
.722
Esp
írito
San
to15
019
6.21
46.
591
Min
as G
erai
s76
01.
232.
931
36.7
43
Rio
de
Jane
iro48
223
0.30
77.
883
São
Pau
lo93
23.
335.
957
48.5
05
S
ul1.
050
3.94
7.60
015
2.21
6
C
entr
o-O
este
659
644.
102
21.4
46
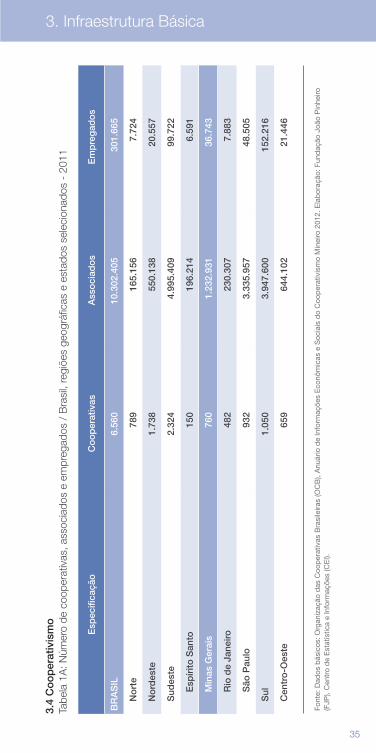
3.4
Co
op
erat
ivis
mo
Tabe
la 1
A: N
úmer
o de
coo
pera
tivas
, ass
ocia
dos
e em
preg
ados
/ B
rasi
l, re
giõe
s ge
ográ
ficas
e e
stad
os s
elec
iona
dos
- 20
11
Font
e: D
ados
bás
icos
: Org
aniz
ação
das
Coo
per
ativ
as B
rasi
leira
s (O
CB
), A
nuár
io d
e In
form
açõe
s E
conô
mic
as e
Soc
iais
do
Coo
per
ativ
ism
o M
inei
ro 2
012.
Ela
bor
ação
: Fun
daç
ão J
oão
Pin
heiro
(F
JP),
Cen
tro
de
Est
atís
tica
e In
form
açõe
s (C
EI).
36 37
3. Infraestrutura Básica
Esp
ecifi
caçã
oC
oo
per
ativ
asA
sso
ciad
os
Em
pre
gad
os
BR
AS
IL6.
575
10.9
58.7
3931
9.36
0
N
ort
e81
419
9.80
111
.602
N
ord
este
1.69
853
8.79
622
.687
S
udes
te2.
386
4.99
0.20
198
.507
Esp
írito
San
to14
722
8.89
76.
843
Min
as G
erai
s73
21.
109.
693
34.6
36
Rio
de
Jane
iro50
123
2.10
67.
973
São
Pau
lo94
93.
407.
247
48.4
26
S
ul1.
011
4.48
3.78
016
1.69
2
C
entr
o-O
este
666
746.
161
24.8
72
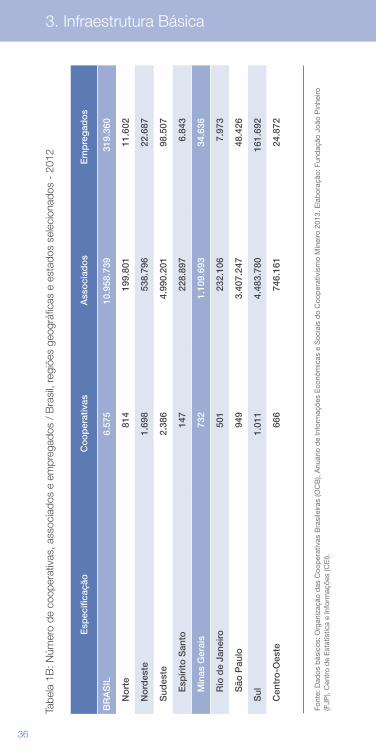
Tabe
la 1
B: N
úmer
o de
coo
pera
tivas
, ass
ocia
dos
e em
preg
ados
/ B
rasi
l, re
giõe
s ge
ográ
ficas
e e
stad
os s
elec
iona
dos
- 20
12
Font
e: D
ados
bás
icos
: Org
aniz
ação
das
Coo
per
ativ
as B
rasi
leira
s (O
CB
), A
nuár
io d
e In
form
açõe
s E
conô
mic
as e
Soc
iais
do
Coo
per
ativ
ism
o M
inei
ro 2
013.
Ela
bor
ação
: Fun
daç
ão J
oão
Pin
heiro
(F
JP),
Cen
tro
de
Est
atís
tica
e In
form
açõe
s (C
EI).
36 37
3. Infraestrutura Básica
Esp
ecifi
caçã
oC
oo
per
ativ
asA
sso
ciad
os
Em
pre
gad
os
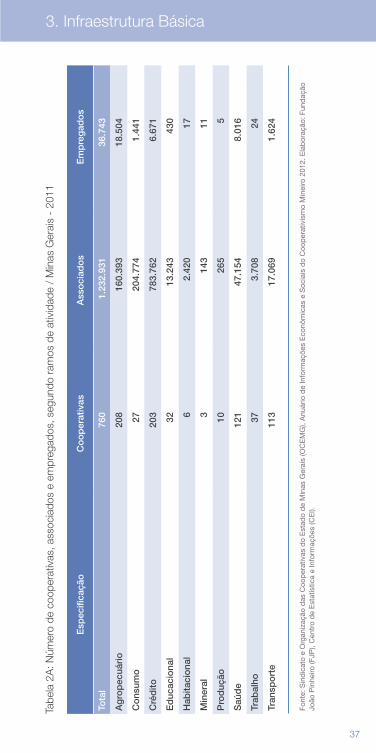
Tota
l76
01.
232.
931
36.7
43
Ag
rop
ecuá
rio
208
160.
393
18.5
04
Co
nsum
o27
204.
774
1.44
1
Cré
dito
203
783.
762
6.67
1
Ed
ucac
iona
l32
13.2
4343
0
Hab
itaci
ona
l6
2.42
017
Min
eral
314
311
Pro
duç
ão10
265
5
Saú
de
121
47.1
548.
016
Trab
alho
373.
708
24
Tran
spo
rte
113
17.0
691.
624
Tabe
la 2
A: N
úmer
o de
coo
pera
tivas
, ass
ocia
dos
e em
preg
ados
, seg
undo
ram
os d
e at
ivid
ade
/ M
inas
Ger
ais
- 20
11
Font
e: S
ind
icat
o e
Org
aniz
ação
das
Coo
per
ativ
as d
o E
stad
o d
e M
inas
Ger
ais
(OC
EM
G),
Anu
ário
de
Info
rmaç
ões
Eco
nôm
icas
e S
ocia
is d
o C
oop
erat
ivis
mo
Min
eiro
201
2. E
lab
oraç
ão: F
und
ação
Jo
ão P
inhe
iro (F
JP),
Cen
tro
de
Est
atís
tica
e In
form
açõe
s (C
EI).
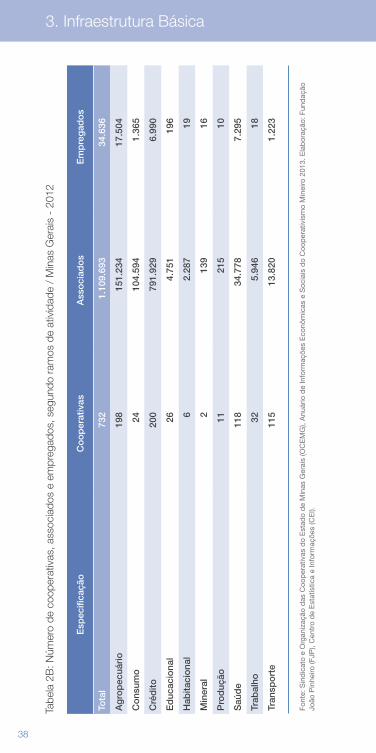
38 39
Esp
ecifi
caçã
oC
oo
per
ativ
asA
sso
ciad
os
Em
pre
gad
os
Tota
l73
21.
109.
693
34.6
36
Ag
rop
ecuá
rio
198
151.
234
17.5
04
Co
nsum
o24
104.
594
1.36
5
Cré
dito
200
791.
929
6.99
0
Ed
ucac
iona
l26
4.75
119
6
Hab
itaci
ona
l6
2.28
719
Min
eral
213
916
Pro
duç
ão11
215
10
Saú
de
118
34.7
787.
295
Trab
alho
325.
946
18
Tran
spo
rte
115
13.8
201.
223
Tabe
la 2
B: N
úmer
o de
coo
pera
tivas
, ass
ocia
dos
e em
preg
ados
, seg
undo
ram
os d
e at
ivid
ade
/ M
inas
Ger
ais
- 20
12
Font
e: S
ind
icat
o e
Org
aniz
ação
das
Coo
per
ativ
as d
o E
stad
o d
e M
inas
Ger
ais
(OC
EM
G),
Anu
ário
de
Info
rmaç
ões
Eco
nôm
icas
e S
ocia
is d
o C
oop
erat
ivis
mo
Min
eiro
201
3. E
lab
oraç
ão: F
und
ação
Jo
ão P
inhe
iro (F
JP),
Cen
tro
de
Est
atís
tica
e In
form
açõe
s (C
EI).
3. Infraestrutura Básica
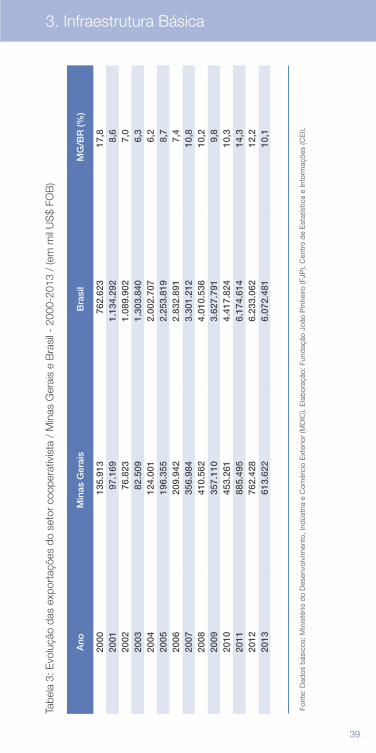
38 39
Ano
Min
as G
erai
sB
rasi
lM
G/B
R (%
)
2000
135.
913
762.
623
17,8
2001
97.1
691.
134.
292
8,6
2002
76.8
231.
089.
902
7,0
2003
82.5
091.
303.
840
6,3
2004
124.
001
2.00
2.70
76,
220
0519
6.35
52.
253.
819
8,7
2006
209.
942
2.83
2.89
17,
420
0735
6.98
43.
301.
212
10,8
2008
410.
562
4.01
0.53
610
,220
0935
7.11
03.
627.
791
9,8
2010
453.
261
4.41
7.82
410
,320
1188
5.49
56.
174.
614
14,3
2012
762.
428
6.23
3.06
212
,220
1361
3.62
26.
072.
481
10,1
Tabe
la 3
: Evo
luçã
o da
s ex
port
açõe
s do
set
or c
oope
rativ
ista
/ M
inas
Ger
ais
e B
rasi
l - 2
000-
2013
/ (e
m m
il U
S$
FOB
)
Font
e: D
ados
bás
icos
: Min
isté
rio d
o D
esen
volv
imen
to, I
ndús
tria
e C
omér
cio
Ext
erio
r (M
DIC
). E
lab
oraç
ão: F
und
ação
Joã
o P
inhe
iro (F
JP),
Cen
tro
de
Est
atís
tica
e In
form
açõe
s (C
EI).
3. Infraestrutura Básica

40

41
Emprego, Desemprego e Rendimentos
4
42 43
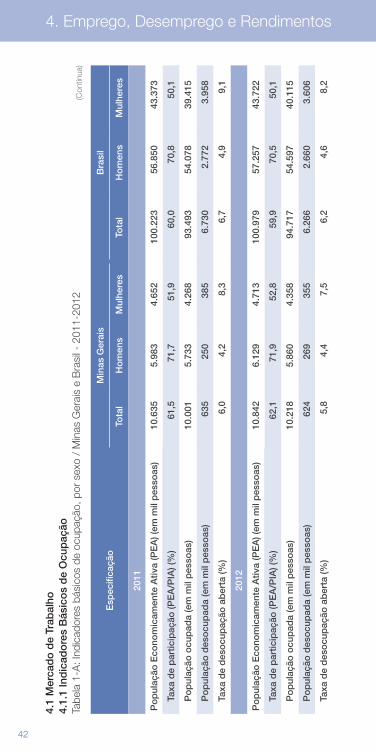
4. Emprego, Desemprego e Rendimentos
Esp
ecifi
caçã
oM
inas
Ger
ais
Bra
sil
Tota
lH
om
ens
Mul
here
sTo
tal
Ho
men
sM
ulhe
res
2011
Po
pul
ação
Eco
nom
icam
ente
Ativ
a (P
EA
) (em
mil
pes
soas
)10
.635
5.98
34.
652
100.
223
56.8
5043
.373
Ta
xa d
e p
artic
ipaç
ão (P
EA
/PIA
) (%
)61
,571
,751
,960
,070
,850
,1
P
op
ulaç
ão o
cup
ada
(em
mil
pes
soas
)10
.001
5.73
34.
268
93.4
9354
.078
39.4
15
P
op
ulaç
ão d
eso
cup
ada
(em
mil
pes
soas
)63
525
038
56.
730
2.77
23.
958
Ta
xa d
e d
eso
cup
ação
ab
erta
(%)
6,0
4,2
8,3
6,7
4,9
9,1
2012
Po
pul
ação
Eco
nom
icam
ente
Ativ
a (P
EA
) (em
mil
pes
soas
)10
.842
6.12
94.
713
100.
979
57.2
5743
.722
Ta
xa d
e p
artic
ipaç
ão (P
EA
/PIA
) (%
)62
,171
,952
,859
,970
,550
,1
P
op
ulaç
ão o
cup
ada
(em
mil
pes
soas
)10
.218
5.86
04.
358
94.7
1754
.597
40.1
15
P
op
ulaç
ão d
eso
cup
ada
(em
mil
pes
soas
)62
426
935
56.
266
2.66
03.
606
Ta
xa d
e d
eso
cup
ação
ab
erta
(%)
5,8
4,4
7,5
6,2
4,6
8,2
4.1
Mer
cad
o d
e Tr
abal
ho
4.1.
1 In
dic
ado
res
Bás
ico
s d
e O
cup
ação
Tabe
la 1
-A: I
ndic
ador
es b
ásic
os d
e oc
upaç
ão, p
or s
exo
/ M
inas
Ger
ais
e B
rasi
l - 2
011-
2012
(Con
tinua
)
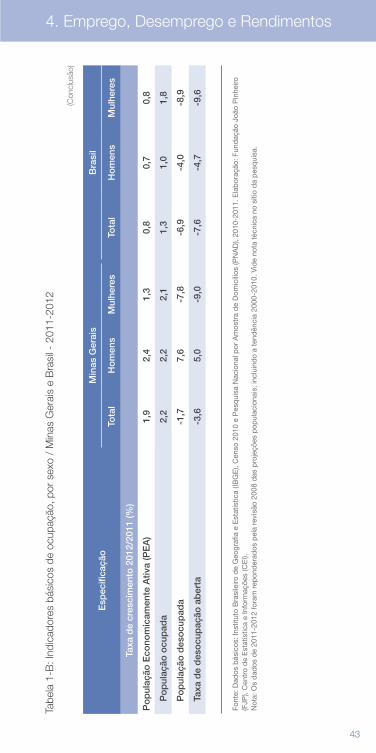
42 43
4. Emprego, Desemprego e Rendimentos
Esp
ecifi
caçã
oM
inas
Ger
ais
Bra
sil
Tota
lH
om
ens
Mul
here
sTo
tal
Ho
men
sM
ulhe
res
2011
Po
pul
ação
Eco
nom
icam
ente
Ativ
a (P
EA
) (em
mil
pes
soas
)10
.635
5.98
34.
652
100.
223
56.8
5043
.373
Ta
xa d
e p
artic
ipaç
ão (P
EA
/PIA
) (%
)61
,571
,751
,960
,070
,850
,1
P
op
ulaç
ão o
cup
ada
(em
mil
pes
soas
)10
.001
5.73
34.
268
93.4
9354
.078
39.4
15
P
op
ulaç
ão d
eso
cup
ada
(em
mil
pes
soas
)63
525
038
56.
730
2.77
23.
958
Ta
xa d
e d
eso
cup
ação
ab
erta
(%)
6,0
4,2
8,3
6,7
4,9
9,1
2012
Po
pul
ação
Eco
nom
icam
ente
Ativ
a (P
EA
) (em
mil
pes
soas
)10
.842
6.12
94.
713
100.
979
57.2
5743
.722
Ta
xa d
e p
artic
ipaç
ão (P
EA
/PIA
) (%
)62
,171
,952
,859
,970
,550
,1
P
op
ulaç
ão o
cup
ada
(em
mil
pes
soas
)10
.218
5.86
04.
358
94.7
1754
.597
40.1
15
P
op
ulaç
ão d
eso
cup
ada
(em
mil
pes
soas
)62
426
935
56.
266
2.66
03.
606
Ta
xa d
e d
eso
cup
ação
ab
erta
(%)
5,8
4,4
7,5
6,2
4,6
8,2
Esp
ecifi
caçã
oM
inas
Ger
ais
Bra
sil
Tota
lH
om
ens
Mul
here
sTo
tal
Ho
men
sM
ulhe
res
Taxa
de
cres
cim
ento
201
2/20
11 (%
)
Po
pul
ação
Eco
nom
icam
ente
Ativ
a (P
EA
) 1,
92,
41,
30,
80,
70,
8
P
op
ulaç
ão o
cup
ada
2,2
2,2
2,1
1,3
1,0
1,8
P
op
ulaç
ão d
eso
cup
ada
-1,7
7,6
-7,8
-6,9
-4,0
-8,9
Ta
xa d
e d
eso
cup
ação
ab
erta
-3,6
5,0
-9,0
-7,6
-4,7
-9,6
Tabe
la 1
-B: I
ndic
ador
es b
ásic
os d
e oc
upaç
ão, p
or s
exo
/ M
inas
Ger
ais
e B
rasi
l - 2
011-
2012
Font
e: D
ados
bás
icos
: Ins
titut
o B
rasi
leiro
de
Geo
graf
ia e
Est
atís
tica
(IBG
E),
Cen
so 2
010
e P
esq
uisa
Nac
iona
l por
Am
ostr
a d
e D
omic
ílios
(PN
AD
), 20
10-2
011.
Ela
bor
ação
: Fun
daç
ão J
oão
Pin
heiro
(F
JP),
Cen
tro
de
Est
atís
tica
e In
form
açõe
s (C
EI).
N
ota:
Os
dad
os d
e 20
11-2
012
fora
m r
epon
der
ados
pel
a re
visã
o 20
08 d
as p
roje
ções
pop
ulac
iona
is, i
nclu
ind
o a
tend
ênci
a 20
00-2
010.
Vid
e no
ta t
écni
ca n
o sí
tio d
a p
esq
uisa
.
(Con
clus
ão)
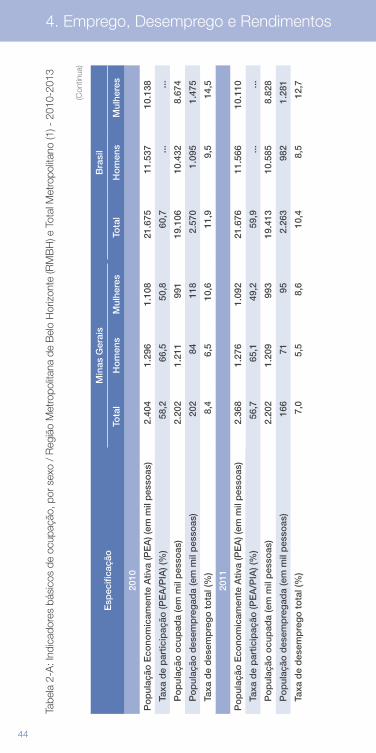
44 45
4. Emprego, Desemprego e Rendimentos
Esp
ecifi
caçã
oM
inas
Ger
ais
Bra
sil
Tota
lH
om
ens
Mul
here
sTo
tal
Ho
men
sM
ulhe
res
2010
Po
pul
ação
Eco
nom
icam
ente
Ativ
a (P
EA
) (em
mil
pes
soas
)2.
404
1.29
61.
108
21.6
7511
.537
10.1
38
Ta
xa d
e p
artic
ipaç
ão (P
EA
/PIA
) (%
)58
,266
,550
,860
,7...
...
P
op
ulaç
ão o
cup
ada
(em
mil
pes
soas
)2.
202
1.21
199
119
.106
10.4
328.
674
P
op
ulaç
ão d
esem
pre
gad
a (e
m m
il p
esso
as)
202
8411
82.
570
1.09
51.
475
Ta
xa d
e d
esem
pre
go
to
tal (
%)
8,4
6,5
10,6
11,9
9,5
14,5
2011
Po
pul
ação
Eco
nom
icam
ente
Ativ
a (P
EA
) (em
mil
pes
soas
)2.
368
1.27
61.
092
21.6
7611
.566
10.1
10
Ta
xa d
e p
artic
ipaç
ão (P
EA
/PIA
) (%
)56
,765
,149
,259
,9...
...
P
op
ulaç
ão o
cup
ada
(em
mil
pes
soas
)2.
202
1.20
999
319
.413
10.5
858.
828
P
op
ulaç
ão d
esem
pre
gad
a (e
m m
il p
esso
as)
166
7195
2.26
398
21.
281
Ta
xa d
e d
esem
pre
go
to
tal (
%)
7,0
5,5
8,6
10,4
8,5
12,7
Tabe
la 2
-A: I
ndic
ador
es b
ásic
os d
e oc
upaç
ão, p
or s
exo
/ R
egiã
o M
etro
polit
ana
de B
elo
Hor
izon
te (R
MB
H) e
Tot
al M
etro
polit
ano
(1) -
201
0-20
13
(Con
tinua
)
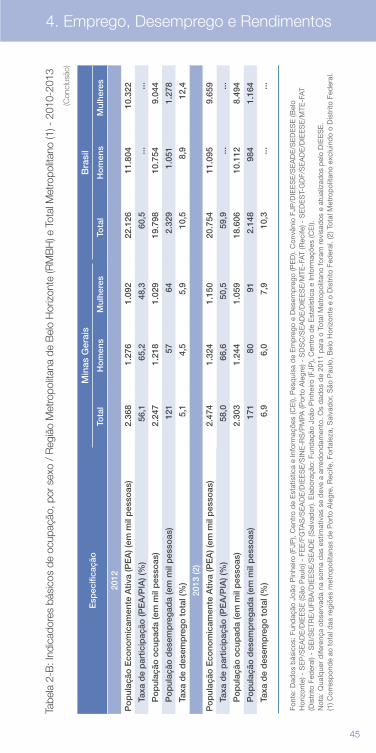
44 45
4. Emprego, Desemprego e Rendimentos
Esp
ecifi
caçã
oM
inas
Ger
ais
Bra
sil
Tota
lH
om
ens
Mul
here
sTo
tal
Ho
men
sM
ulhe
res
2012
Po
pul
ação
Eco
nom
icam
ente
Ativ
a (P
EA
) (em
mil
pes
soas
)2.
368
1.27
61.
092
22.1
2611
.804
10.3
22
Ta
xa d
e p
artic
ipaç
ão (P
EA
/PIA
) (%
)56
,165
,248
,360
,5...
...
P
op
ulaç
ão o
cup
ada
(em
mil
pes
soas
)2.
247
1.21
81.
029
19.7
9810
.754
9.04
4
P
op
ulaç
ão d
esem
pre
gad
a (e
m m
il p
esso
as)
121
5764
2.32
91.
051
1.27
8
Ta
xa d
e d
esem
pre
go
to
tal (
%)
5,1
4,5
5,9
10,5
8,9
12,4
2013
(2)
Po
pul
ação
Eco
nom
icam
ente
Ativ
a (P
EA
) (em
mil
pes
soas
)2.
474
1.32
41.
150
20.7
5411
.095
9.65
9
Ta
xa d
e p
artic
ipaç
ão (P
EA
/PIA
) (%
)58
,066
,650
,559
,9...
...
P
op
ulaç
ão o
cup
ada
(em
mil
pes
soas
)2.
303
1.24
41.
059
18.6
0610
.112
8.49
4
P
op
ulaç
ão d
esem
pre
gad
a (e
m m
il p
esso
as)
171
8091
2.14
898
41.
164
Ta
xa d
e d
esem
pre
go
to
tal (
%)
6,9
6,0
7,9
10,3
......
Tabe
la 2
-B: I
ndic
ador
es b
ásic
os d
e oc
upaç
ão, p
or s
exo
/ R
egiã
o M
etro
polit
ana
de B
elo
Hor
izon
te (R
MB
H) e
Tot
al M
etro
polit
ano
(1) -
201
0-20
13
Font
e: D
ados
bás
icos
: Fun
daç
ão J
oão
Pin
heiro
(FJP
), C
entr
o d
e E
stat
ístic
a e
Info
rmaç
ões
(CE
I), P
esq
uisa
de
Em
pre
go e
Des
emp
rego
(PE
D).
Con
vêni
o FJ
P/D
IEE
SE
/SE
AD
E/S
ED
ES
E (B
elo
Hor
izon
te) -
SE
P/S
EA
DE
/DIE
ES
E (S
ão P
aulo
) - F
EE
/FG
TAS
/SE
AD
E/D
IEE
SE
/SIN
E-R
S/P
MPA
(Por
to A
legr
e) -
SD
SC
/SE
AD
E/D
IEE
SE
/MTE
-FAT
(Rec
ife) -
SE
DE
ST-
GD
F/S
EA
DE
/DIE
ES
E/M
TE-F
AT
(Dis
trito
Fed
eral
) - S
EI/
SE
TRE
/UFB
A/D
IEE
SE
/SE
AD
E (S
alva
dor
). E
lab
oraç
ão: F
und
ação
Joã
o P
inhe
iro (F
JP),
Cen
tro
de
Est
atís
tica
e In
form
açõe
s (C
EI).
N
ota:
Qua
lque
r d
ifere
nça
obse
rvad
a na
som
a d
as e
stim
ativ
as s
e d
eve
a ar
red
ond
amen
to. O
s d
ados
de
2011
par
a o
Tota
l Met
rop
olita
no fo
ram
rev
isad
os e
atu
aliz
ados
pel
o D
IEE
SE
. (1
) Cor
resp
ond
e ao
tot
al d
as r
egiõ
es m
etro
pol
itana
s d
e P
orto
Ale
gre,
Rec
ife, F
orta
leza
, Sal
vad
or, S
ão P
aulo
, Bel
o H
oriz
onte
e o
Dis
trito
Fed
eral
. (2)
Tot
al M
etro
pol
itano
exc
luin
do
o D
istr
ito F
eder
al.
(Con
clus
ão)
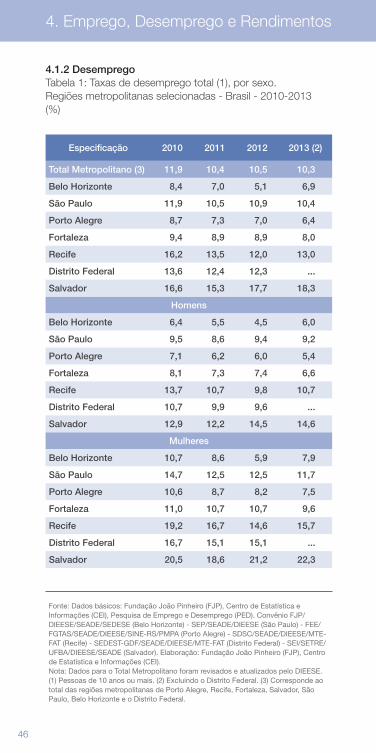
46 47
4. Emprego, Desemprego e Rendimentos
4.1.2 DesempregoTabela 1: Taxas de desemprego total (1), por sexo.Regiões metropolitanas selecionadas - Brasil - 2010-2013 (%)
Especificação 2010 2011 2012 2013 (2)
Total Metropolitano (3) 11,9 10,4 10,5 10,3
Belo Horizonte 8,4 7,0 5,1 6,9
São Paulo 11,9 10,5 10,9 10,4
Porto Alegre 8,7 7,3 7,0 6,4
Fortaleza 9,4 8,9 8,9 8,0
Recife 16,2 13,5 12,0 13,0
Distrito Federal 13,6 12,4 12,3 ...
Salvador 16,6 15,3 17,7 18,3
Homens
Belo Horizonte 6,4 5,5 4,5 6,0
São Paulo 9,5 8,6 9,4 9,2
Porto Alegre 7,1 6,2 6,0 5,4
Fortaleza 8,1 7,3 7,4 6,6
Recife 13,7 10,7 9,8 10,7
Distrito Federal 10,7 9,9 9,6 ...
Salvador 12,9 12,2 14,5 14,6
Mulheres
Belo Horizonte 10,7 8,6 5,9 7,9
São Paulo 14,7 12,5 12,5 11,7
Porto Alegre 10,6 8,7 8,2 7,5
Fortaleza 11,0 10,7 10,7 9,6
Recife 19,2 16,7 14,6 15,7
Distrito Federal 16,7 15,1 15,1 ...
Salvador 20,5 18,6 21,2 22,3
Fonte: Dados básicos: Fundação João Pinheiro (FJP), Centro de Estatística e Informações (CEI), Pesquisa de Emprego e Desemprego (PED). Convênio FJP/DIEESE/SEADE/SEDESE (Belo Horizonte) - SEP/SEADE/DIEESE (São Paulo) - FEE/FGTAS/SEADE/DIEESE/SINE-RS/PMPA (Porto Alegre) - SDSC/SEADE/DIEESE/MTE-FAT (Recife) - SEDEST-GDF/SEADE/DIEESE/MTE-FAT (Distrito Federal) - SEI/SETRE/UFBA/DIEESE/SEADE (Salvador). Elaboração: Fundação João Pinheiro (FJP), Centro de Estatística e Informações (CEI). Nota: Dados para o Total Metropolitano foram revisados e atualizados pelo DIEESE. (1) Pessoas de 10 anos ou mais. (2) Excluindo o Distrito Federal. (3) Corresponde ao total das regiões metropolitanas de Porto Alegre, Recife, Fortaleza, Salvador, São Paulo, Belo Horizonte e o Distrito Federal.
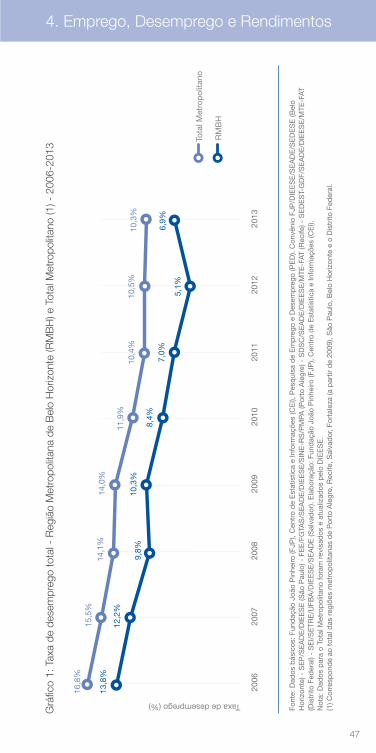
46 47
4. Emprego, Desemprego e Rendimentos
2006
2007
2008
2009
2010
2011
2012
2013
15,5
%16
,8%
14,1
%14
,0%
11,9
%10
,4%
10,5
%10
,3%
12,2
%
13,8
%
9,8%
10,3
%
8,4%
7,0%
5,1%
6,9%
Taxa de desemprego (%)
Tota
l Met
rop
olita
no
RM
BH
Grá
fico
1: T
axa
de d
esem
preg
o to
tal -
Reg
ião
Met
ropo
litan
a de
Bel
o H
oriz
onte
(RM
BH
) e T
otal
Met
ropo
litan
o (1
) - 2
006-
2013
Font
e: D
ados
bás
icos
: Fun
daç
ão J
oão
Pin
heiro
(FJP
), C
entr
o d
e E
stat
ístic
a e
Info
rmaç
ões
(CE
I), P
esq
uisa
de
Em
pre
go e
Des
emp
rego
(PE
D).
Con
vêni
o FJ
P/D
IEE
SE
/SE
AD
E/S
ED
ES
E (B
elo
Hor
izon
te) -
SE
P/S
EA
DE
/DIE
ES
E (S
ão P
aulo
) - F
EE
/FG
TAS
/SE
AD
E/D
IEE
SE
/SIN
E-R
S/P
MPA
(Por
to A
legr
e) -
SD
SC
/SE
AD
E/D
IEE
SE
/MTE
-FAT
(Rec
ife) -
SE
DE
ST-
GD
F/S
EA
DE
/DIE
ES
E/M
TE-F
AT
(Dis
trito
Fed
eral
) - S
EI/
SE
TRE
/UFB
A/D
IEE
SE
/SE
AD
E (S
alva
dor
). E
lab
oraç
ão: F
und
ação
Joã
o P
inhe
iro (F
JP),
Cen
tro
de
Est
atís
tica
e In
form
açõe
s (C
EI).
N
ota:
Dad
os p
ara
o To
tal M
etro
pol
itano
fora
m r
evis
ados
e a
tual
izad
os p
elo
DIE
ES
E.
(1) C
orre
spon
de
ao t
otal
das
reg
iões
met
rop
olita
nas
de
Por
to A
legr
e, R
ecife
, Sal
vad
or, F
orta
leza
(a p
artir
de
2009
), S
ão P
aulo
, Bel
o H
oriz
onte
e o
Dis
trito
Fed
eral
.
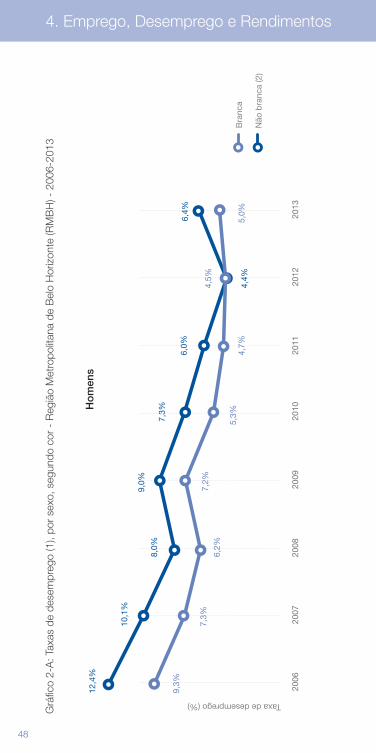
48 49
4. Emprego, Desemprego e Rendimentos
2006
2007
2008
2009
2010
2011
2012
2013
7,3%
9,3%
6,2%
7,2%
5,3%
4,7%
4,5%
5,0%
10,1
%
12,4
%
8,0%
9,0%
7,3%
6,0%
4,4%
6,4%
Taxa de desemprego (%)
Bra
nca
Não
bra
nca
(2)
Grá
fico
2-A
: Tax
as d
e de
sem
preg
o (1
), po
r se
xo, s
egun
do c
or -
Reg
ião
Met
ropo
litan
a de
Bel
o H
oriz
onte
(RM
BH
) - 2
006-
2013
Ho
men
s
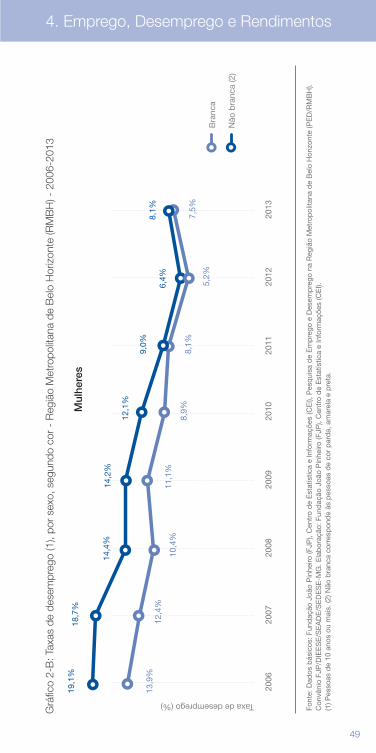
48 49
4. Emprego, Desemprego e Rendimentos
2006
2007
2008
2009
2010
2011
2012
2013
12,4
%13
,9%
10,4
%11
,1%
8,9%
8,1%
5,2%
7,5%
18,7
%19
,1%
14,4
%14
,2%
12,1
%
9,0%
6,4%
8,1%
Taxa de desemprego (%)
Bra
nca
Não
bra
nca
(2)
Grá
fico
2-B
: Tax
as d
e de
sem
preg
o (1
), po
r se
xo, s
egun
do c
or -
Reg
ião
Met
ropo
litan
a de
Bel
o H
oriz
onte
(RM
BH
) - 2
006-
2013
Font
e: D
ados
bás
icos
: Fun
daç
ão J
oão
Pin
heiro
(FJP
), C
entr
o d
e E
stat
ístic
a e
Info
rmaç
ões
(CE
I), P
esq
uisa
de
Em
pre
go e
Des
emp
rego
na
Reg
ião
Met
rop
olita
na d
e B
elo
Hor
izon
te (P
ED
/RM
BH
). C
onvê
nio
FJP
/DIE
ES
E/S
EA
DE
/SE
DE
SE
-MG
. Ela
bor
ação
: Fun
daç
ão J
oão
Pin
heiro
(FJP
), C
entr
o d
e E
stat
ístic
a e
Info
rmaç
ões
(CE
I).
(1) P
esso
as d
e 10
ano
s ou
mai
s. (2
) Não
bra
nca
corr
esp
ond
e às
pes
soas
de
cor
par
da,
am
arel
a e
pre
ta.
Mul
here
s
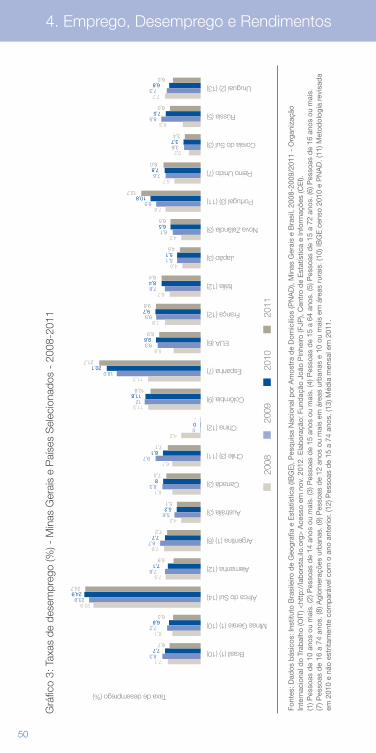
50 51
4. Emprego, Desemprego e Rendimentos
Grá
fico
3: T
axas
de
dese
mpr
ego
(%) -
Min
as G
erai
s e
Paí
ses
Sel
ecio
nado
s -
2008
-201
1
Font
es: D
ados
bás
icos
: Ins
titut
o B
rasi
leiro
de
Geo
graf
ia e
Est
atís
tica
(IBG
E),
Pes
qui
sa N
acio
nal p
or A
mos
tra
de
Dom
icíli
os (P
NA
D),
Min
as G
erai
s e
Bra
sil,
2008
-200
9/20
11 -
Org
aniz
ação
In
tern
acio
nal d
o Tr
abal
ho (O
IT) <
http
://la
bor
sta.
ilo.o
rg>
Ace
sso
em n
ov. 2
012.
Ela
bor
ação
: Fun
daç
ão J
oão
Pin
heiro
(FJP
), C
entr
o d
e E
stat
ístic
a e
Info
rmaç
ões
(CE
I).
(1) P
esso
as d
e 10
ano
s ou
mai
s. (2
) Pes
soas
de
14 a
nos
ou m
ais.
(3) P
esso
as d
e 15
ano
s ou
mai
s. (4
) Pes
soas
de
15 a
64
anos
. (5)
Pes
soas
de
15 a
72
anos
. (6)
Pes
soas
de
16 a
nos
ou m
ais.
(7
) Pes
soas
de
16 a
74
anos
. (8)
Agl
omer
açõe
s ur
ban
as. (
9) P
esso
as d
e 12
ano
s ou
mai
s em
áre
as u
rban
as e
10
ou m
ais
em á
reas
rur
ais.
(10)
IBG
E c
enso
201
0 e
PN
AD
. (11
) Met
odol
ogia
rev
isad
a em
201
0 e
não
estr
itam
ente
com
par
ável
com
o a
no a
nter
ior.
(12)
Pes
soas
de
15 a
74
anos
. (13
) Méd
ia m
ensa
l em
201
1.
Brasil (1) (10)7,76,7
8,37,1
Minas Gerais (1) (10)6,86,0
7,26,1
África do Sul (14)24,924,7
23,922,9
Alemanha (12)7,15,9
7,87,5
Argentina (1) (8)7,77,2
8,77,9
Austrália (3)5,25,1
5,64,2
Canadá (3)87,4
8,36,1
Chile (3) (11)8,17,1
9,76,1
China (12)0-
04,2
Colômbia (9)11,810,8
1211,3
Espanha (7)20,121,7
18,011,3
EUA (6)9,68,9
9,35,8
França (12)9,79,6
9,57,8
Itália (12)8,48,4
7,86,7
Japão (3)5,14,5
5,14,0
Nova Zelândia (3)6,56,5
6,14,2
Portugal (3) (11)10,812,7
9,57,6
Reino Unido (7)7,88,0
7,65,7
Coreia do Sul (3)3,73,4
3,63,2
Rússia (5)7,56,0
8,56,3
Uruguai (2) (13)6,86,0
7,37,7
Taxa de desemprego (%)
11,3
11,810,8
2008
2009
2010
2011
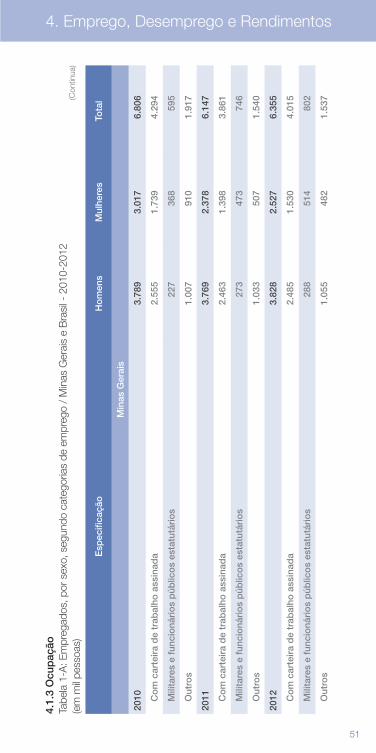
50 51
4. Emprego, Desemprego e Rendimentos
Esp
ecifi
caçã
oH
om
ens
Mul
here
sTo
tal
Min
as G
erai
s
2010
3.78
93.
017
6.80
6
C
om
car
teir
a d
e tr
abal
ho a
ssin
ada
2.55
51.
739
4.29
4
M
ilita
res
e fu
ncio
nári
os
púb
lico
s es
tatu
tári
os
227
368
595
O
utro
s1.
007
910
1.91
7
2011
3.76
92.
378
6.14
7
C
om
car
teir
a d
e tr
abal
ho a
ssin
ada
2.46
31.
398
3.86
1
M
ilita
res
e fu
ncio
nári
os
púb
lico
s es
tatu
tári
os
273
473
746
O
utro
s1.
033
507
1.54
0
2012
3.82
82.
527
6.35
5
C
om
car
teir
a d
e tr
abal
ho a
ssin
ada
2.48
51.
530
4.01
5
M
ilita
res
e fu
ncio
nári
os
púb
lico
s es
tatu
tári
os
288
514
802
O
utro
s1.
055
482
1.53
7
4.1.
3 O
cup
ação
Tabe
la 1
-A: E
mpr
egad
os, p
or s
exo,
seg
undo
cat
egor
ias
de e
mpr
ego
/ M
inas
Ger
ais
e B
rasi
l - 2
010-
2012
(e
m m
il pe
ssoa
s)(C
ontin
ua)
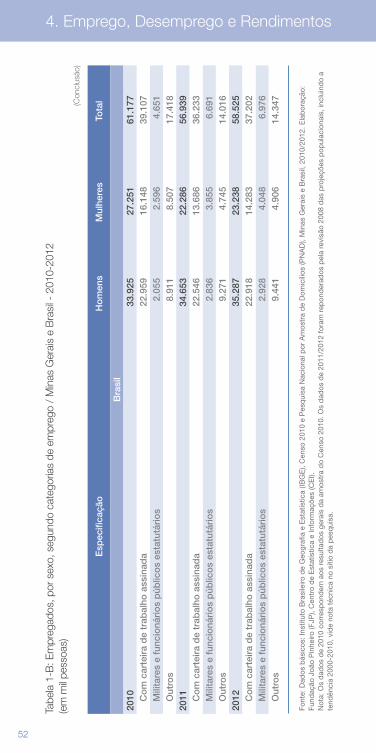
52 53
4. Emprego, Desemprego e Rendimentos
Esp
ecifi
caçã
oH
om
ens
Mul
here
sTo
tal
Bra
sil
2010
33.9
2527
.251
61.1
77
Co
m c
arte
ira
de
trab
alho
ass
inad
a 22
.959
16.1
4839
.107
M
ilita
res
e fu
ncio
nári
os
púb
lico
s es
tatu
tári
os
2.05
52.
596
4.65
1
Out
ros
8.91
18.
507
17.4
1820
1134
.653
22.2
8656
.939
C
om
car
teir
a d
e tr
abal
ho a
ssin
ada
22.5
4613
.686
36.2
33
Mili
tare
s e
func
ioná
rio
s p
úblic
os
esta
tutá
rio
s2.
836
3.85
56.
691
O
utro
s9.
271
4.74
514
.016
2012
35.2
8723
.238
58.5
25
Co
m c
arte
ira
de
trab
alho
ass
inad
a 22
.918
14.2
8337
.202
M
ilita
res
e fu
ncio
nári
os
púb
lico
s es
tatu
tári
os
2.92
84.
048
6.97
6
Out
ros
9.44
14.
906
14.3
47
Tabe
la 1
-B: E
mpr
egad
os, p
or s
exo,
seg
undo
cat
egor
ias
de e
mpr
ego
/ M
inas
Ger
ais
e B
rasi
l - 2
010-
2012
(e
m m
il pe
ssoa
s)(C
oncl
usão
)
Font
e: D
ados
bás
icos
: Ins
titut
o B
rasi
leiro
de
Geo
graf
ia e
Est
atís
tica
(IBG
E),
Cen
so 2
010
e P
esq
uisa
Nac
iona
l por
Am
ostr
a d
e D
omic
ílios
(PN
AD
), M
inas
Ger
ais
e B
rasi
l, 20
10/2
012.
Ela
bor
ação
: Fu
ndaç
ão J
oão
Pin
heiro
(FJP
), C
entr
o d
e E
stat
ístic
a e
Info
rmaç
ões
(CE
I).
Not
a: O
s d
ados
de
2010
cor
resp
ond
em a
os r
esul
tad
os g
erai
s d
a am
ostr
a d
o C
enso
201
0. O
s d
ados
de
2011
/201
2 fo
ram
rep
ond
erad
os p
ela
revi
são
2008
das
pro
jeçõ
es p
opul
acio
nais
, inc
luin
do
a te
ndên
cia
2000
-201
0, v
ide
nota
téc
nica
no
sítio
da
pes
qui
sa.
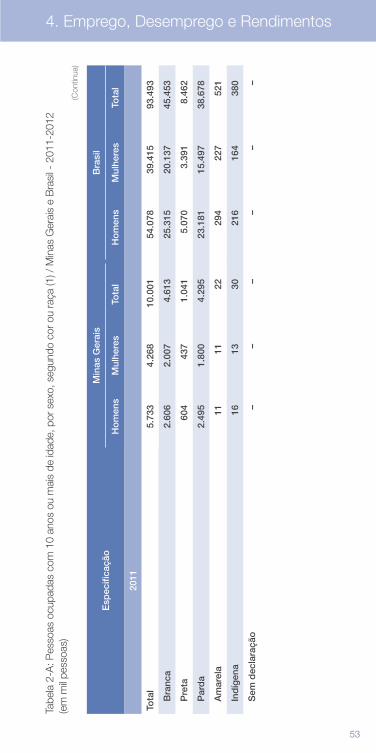
52 53
4. Emprego, Desemprego e Rendimentos
Font
e: D
ados
bás
icos
: Ins
titut
o B
rasi
leiro
de
Geo
graf
ia e
Est
atís
tica
(IBG
E),
Cen
so 2
010
e P
esq
uisa
Nac
iona
l por
Am
ostr
a d
e D
omic
ílios
(PN
AD
), M
inas
Ger
ais
e B
rasi
l, 20
10/2
012.
Ela
bor
ação
: Fu
ndaç
ão J
oão
Pin
heiro
(FJP
), C
entr
o d
e E
stat
ístic
a e
Info
rmaç
ões
(CE
I).
Not
a: O
s d
ados
de
2010
cor
resp
ond
em a
os r
esul
tad
os g
erai
s d
a am
ostr
a d
o C
enso
201
0. O
s d
ados
de
2011
/201
2 fo
ram
rep
ond
erad
os p
ela
revi
são
2008
das
pro
jeçõ
es p
opul
acio
nais
, inc
luin
do
a te
ndên
cia
2000
-201
0, v
ide
nota
téc
nica
no
sítio
da
pes
qui
sa.
Tabe
la 2
-A: P
esso
as o
cupa
das
com
10
anos
ou
mai
s de
idad
e, p
or s
exo,
seg
undo
cor
ou
raça
(1) /
Min
as G
erai
s e
Bra
sil -
201
1-20
12
(em
mil
pess
oas)
(Con
tinua
)
Esp
ecifi
caçã
oM
inas
Ger
ais
Bra
sil
Ho
men
sM
ulhe
res
Tota
lH
om
ens
Mul
here
sTo
tal
2011
Tota
l5.
733
4.26
810
.001
54.0
7839
.415
93.4
93
B
ranc
a2.
606
2.00
74.
613
25.3
1520
.137
45.4
53
P
reta
604
437
1.04
15.
070
3.39
18.
462
P
ard
a2.
495
1.80
04.
295
23.1
8115
.497
38.6
78
A
mar
ela
1111
2229
422
752
1
In
díg
ena
1613
3021
616
438
0
S
em d
ecla
raçã
o–
––
––
–
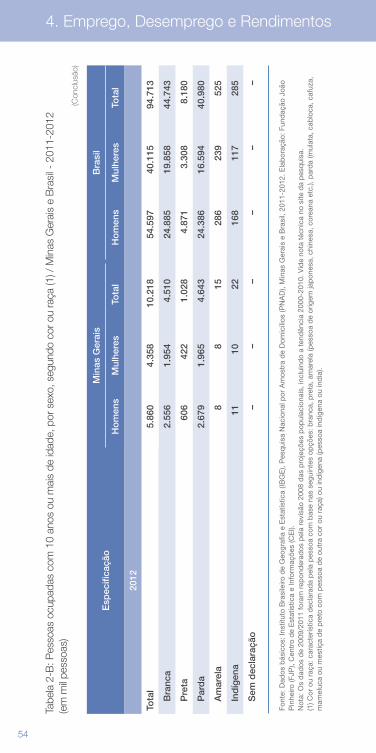
54 55
4. Emprego, Desemprego e Rendimentos
Tabe
la 2
-B: P
esso
as o
cupa
das
com
10
anos
ou
mai
s de
idad
e, p
or s
exo,
seg
undo
cor
ou
raça
(1) /
Min
as G
erai
s e
Bra
sil -
201
1-20
12
(em
mil
pess
oas)
(Con
clus
ão)
Esp
ecifi
caçã
oM
inas
Ger
ais
Bra
sil
Ho
men
sM
ulhe
res
Tota
lH
om
ens
Mul
here
sTo
tal
2012
Tota
l5.
860
4.35
810
.218
54.5
9740
.115
94.7
13
B
ranc
a2.
556
1.95
44.
510
24.8
8519
.858
44.7
43
P
reta
606
422
1.02
84.
871
3.30
88.
180
P
ard
a2.
679
1.96
54.
643
24.3
8616
.594
40.9
80
A
mar
ela
88
1528
623
952
5
In
díg
ena
1110
2216
811
728
5
S
em d
ecla
raçã
o–
––
––
–
Font
e: D
ados
bás
icos
: Ins
titut
o B
rasi
leiro
de
Geo
graf
ia e
Est
atís
tica
(IBG
E),
Pes
qui
sa N
acio
nal p
or A
mos
tra
de
Dom
icíli
os (P
NA
D),
Min
as G
erai
s e
Bra
sil,
2011
-201
2. E
lab
oraç
ão: F
und
ação
Joã
o P
inhe
iro (F
JP),
Cen
tro
de
Est
atís
tica
e In
form
açõe
s (C
EI).
N
ota:
Os
dad
os d
e 20
09/2
011
fora
m r
epon
der
ados
pel
a re
visã
o 20
08 d
as p
roje
ções
pop
ulac
iona
is, i
nclu
ind
o a
tend
ênci
a 20
00-2
010.
Vid
e no
ta t
écni
ca n
o si
te d
a p
esq
uisa
. (1
) Cor
ou
raça
: car
acte
rístic
a d
ecla
rad
a p
ela
pes
soa
com
bas
e na
s se
guin
tes
opçõ
es: b
ranc
a, p
reta
, am
arel
a (p
esso
a d
e or
igem
jap
ones
a, c
hine
sa, c
orea
na e
tc.),
par
da
(mul
ata,
cab
loca
, caf
uza,
m
amel
uca
ou m
estiç
a d
e p
reto
com
pes
soa
de
outr
a co
r ou
raç
a) o
u in
díg
ena
(pes
soa
ind
ígen
a ou
índ
ia).
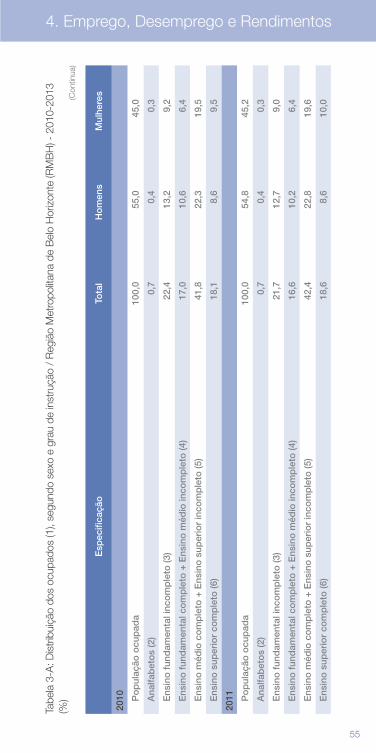
54 55
4. Emprego, Desemprego e Rendimentos
Esp
ecifi
caçã
oTo
tal
Ho
men
sM
ulhe
res
2010
P
op
ulaç
ão o
cup
ada
100,
055
,045
,0
A
nalfa
bet
os
(2)
0,7
0,4
0,3
E
nsin
o f
und
amen
tal i
nco
mp
leto
(3)
22,4
13,2
9,2
E
nsin
o f
und
amen
tal c
om
ple
to +
Ens
ino
méd
io in
com
ple
to (4
)17
,010
,66,
4
E
nsin
o m
édio
co
mp
leto
+ E
nsin
o s
uper
ior
inco
mp
leto
(5)
41,8
22,3
19,5
E
nsin
o s
uper
ior
com
ple
to (6
)18
,18,
69,
5
2011
P
op
ulaç
ão o
cup
ada
100,
054
,845
,2
A
nalfa
bet
os
(2)
0,7
0,4
0,3
E
nsin
o f
und
amen
tal i
nco
mp
leto
(3)
21,7
12,7
9,0
E
nsin
o f
und
amen
tal c
om
ple
to +
Ens
ino
méd
io in
com
ple
to (4
)16
,610
,26,
4
E
nsin
o m
édio
co
mp
leto
+ E
nsin
o s
uper
ior
inco
mp
leto
(5)
42,4
22,8
19,6
E
nsin
o s
uper
ior
com
ple
to (6
)18
,68,
610
,0
Tabe
la 3
-A: D
istr
ibui
ção
dos
ocup
ados
(1),
segu
ndo
sexo
e g
rau
de in
stru
ção
/ R
egiã
o M
etro
polit
ana
de B
elo
Hor
izon
te (R
MB
H) -
201
0-20
13
(%)
(Con
tinua
)
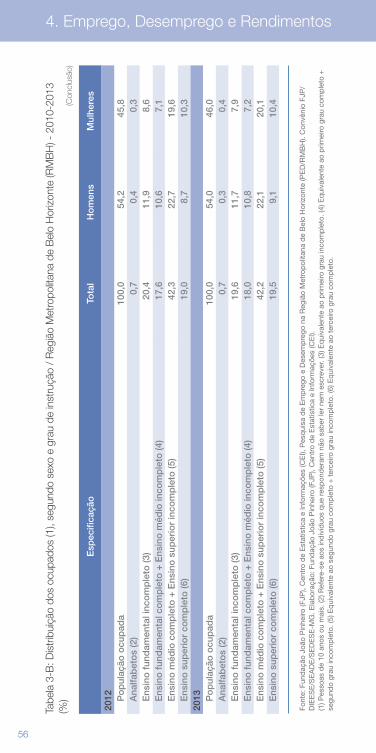
56 57
4. Emprego, Desemprego e Rendimentos
Tabe
la 3
-B: D
istr
ibui
ção
dos
ocup
ados
(1),
segu
ndo
sexo
e g
rau
de in
stru
ção
/ R
egiã
o M
etro
polit
ana
de B
elo
Hor
izon
te (R
MB
H) -
201
0-20
13
(%)
(Con
clus
ão)
Esp
ecifi
caçã
oTo
tal
Ho
men
sM
ulhe
res
2012
Po
pul
ação
ocu
pad
a10
0,0
54,2
45,8
A
nalfa
bet
os
(2)
0,7
0,4
0,3
E
nsin
o f
und
amen
tal i
nco
mp
leto
(3)
20,4
11,9
8,6
E
nsin
o f
und
amen
tal c
om
ple
to +
Ens
ino
méd
io in
com
ple
to (4
)17
,610
,67,
1
Ens
ino
méd
io c
om
ple
to +
Ens
ino
sup
erio
r in
com
ple
to (5
)42
,322
,719
,6
Ens
ino
sup
erio
r co
mp
leto
(6)
19,0
8,7
10,3
2013
Po
pul
ação
ocu
pad
a10
0,0
54,0
46,0
A
nalfa
bet
os
(2)
0,7
0,3
0,4
E
nsin
o f
und
amen
tal i
nco
mp
leto
(3)
19,6
11,7
7,9
E
nsin
o f
und
amen
tal c
om
ple
to +
Ens
ino
méd
io in
com
ple
to (4
)18
,010
,87,
2
Ens
ino
méd
io c
om
ple
to +
Ens
ino
sup
erio
r in
com
ple
to (5
)42
,222
,120
,1
Ens
ino
sup
erio
r co
mp
leto
(6)
19,5
9,1
10,4
Font
e: F
und
ação
Joã
o P
inhe
iro (F
JP),
Cen
tro
de
Est
atís
tica
e In
form
açõe
s (C
EI),
Pes
qui
sa d
e E
mp
rego
e D
esem
pre
go n
a R
egiã
o M
etro
pol
itana
de
Bel
o H
oriz
onte
(PE
D/R
MB
H).
Con
vêni
o FJ
P/
DIE
ES
E/S
EA
DE
/SE
DE
SE
-MG
. Ela
bor
ação
: Fun
daç
ão J
oão
Pin
heiro
(FJP
), C
entr
o d
e E
stat
ístic
a e
Info
rmaç
ões
(CE
I).
(1) P
esso
as d
e 10
ano
s ou
mai
s. (2
) Ref
ere-
se a
os in
div
íduo
s q
ue r
esp
ond
eram
não
sab
er le
r ne
m e
scre
ver.
(3) E
qui
vale
nte
ao p
rimei
ro g
rau
inco
mp
leto
. (4)
Eq
uiva
lent
e ao
prim
eiro
gra
u co
mp
leto
+
segu
ndo
grau
inco
mp
leto
. (5)
Eq
uiva
lent
e ao
seg
und
o gr
au c
omp
leto
+ t
erce
iro g
rau
inco
mp
leto
. (6)
Eq
uiva
lent
e ao
ter
ceiro
gra
u co
mp
leto
.
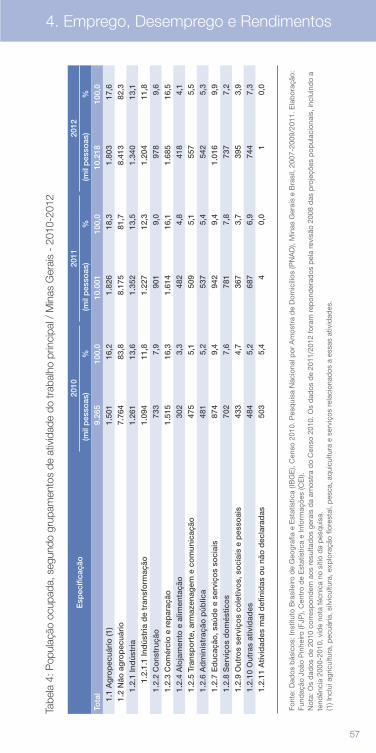
56 57
4. Emprego, Desemprego e Rendimentos
Font
e: F
und
ação
Joã
o P
inhe
iro (F
JP),
Cen
tro
de
Est
atís
tica
e In
form
açõe
s (C
EI),
Pes
qui
sa d
e E
mp
rego
e D
esem
pre
go n
a R
egiã
o M
etro
pol
itana
de
Bel
o H
oriz
onte
(PE
D/R
MB
H).
Con
vêni
o FJ
P/
DIE
ES
E/S
EA
DE
/SE
DE
SE
-MG
. Ela
bor
ação
: Fun
daç
ão J
oão
Pin
heiro
(FJP
), C
entr
o d
e E
stat
ístic
a e
Info
rmaç
ões
(CE
I).
(1) P
esso
as d
e 10
ano
s ou
mai
s. (2
) Ref
ere-
se a
os in
div
íduo
s q
ue r
esp
ond
eram
não
sab
er le
r ne
m e
scre
ver.
(3) E
qui
vale
nte
ao p
rimei
ro g
rau
inco
mp
leto
. (4)
Eq
uiva
lent
e ao
prim
eiro
gra
u co
mp
leto
+
segu
ndo
grau
inco
mp
leto
. (5)
Eq
uiva
lent
e ao
seg
und
o gr
au c
omp
leto
+ t
erce
iro g
rau
inco
mp
leto
. (6)
Eq
uiva
lent
e ao
ter
ceiro
gra
u co
mp
leto
.
Tabe
la 4
: Pop
ulaç
ão o
cupa
da, s
egun
do g
rupa
men
tos
de a
tivid
ade
do tr
abal
ho p
rinci
pal /
Min
as G
erai
s -
2010
-201
2
Esp
ecifi
caçã
o20
1020
1120
12
(mil
pes
soas
)%
(mil
pes
soas
)%
(mil
pes
soas
)%
Tota
l9.
265
100,
010
.001
100,
010
.218
100
,0
1.
1 A
gro
pec
uári
o (1
)1.
501
16,2
1.82
618
,31.
803
17,6
1.
2 N
ão a
gro
pec
uári
o7.
764
83,8
8.17
581
,78.
413
82,3
1.2.
1 In
dús
tria
1.
261
13,6
1.35
213
,51.
340
13,1
1.
2.1.
1 In
dús
tria
de
tran
sfo
rmaç
ão1.
094
11,8
1.22
712
,31.
204
11,8
1.2.
2 C
ons
truç
ão73
37,
990
19,
097
89,
6
1.2.
3 C
om
érci
o e
rep
araç
ão1.
515
16,3
1.61
416
,11.
685
16,5
1.2.
4 A
loja
men
to e
alim
enta
ção
302
3,3
482
4,8
418
4,1
1.2.
5 Tr
ansp
ort
e, a
rmaz
enag
em e
co
mun
icaç
ão47
55,
150
95,
155
75,
5
1.2.
6 A
dm
inis
traç
ão p
úblic
a48
15,
253
75,
454
25,
3
1.2.
7 E
duc
ação
, saú
de
e se
rviç
os
soci
ais
874
9,4
942
9,4
1.01
69,
9
1.2.
8 S
ervi
ços
do
més
tico
s70
27,
678
17,
873
77,
2
1.2.
9 O
utro
s se
rviç
os
cole
tivo
s, s
oci
ais
e p
esso
ais
433
4,7
367
3,7
395
3,9
1.2.
10 O
utra
s at
ivid
ades
484
5,2
687
6,9
744
7,3
1.2.
11 A
tivid
ades
mal
def
inid
as o
u nã
o d
ecla
rad
as50
35,
44
0,0
10,
0
Font
e: D
ados
bás
icos
: Ins
titut
o B
rasi
leiro
de
Geo
graf
ia e
Est
atís
tica
(IBG
E),
Cen
so 2
010.
Pes
qui
sa N
acio
nal p
or A
mos
tra
de
Dom
icíli
os (P
NA
D),
Min
as G
erai
s e
Bra
sil,
2007
-200
9/20
11. E
lab
oraç
ão:
Fund
ação
Joã
o P
inhe
iro (F
JP),
Cen
tro
de
Est
atís
tica
e In
form
açõe
s (C
EI).
N
ota:
Os
dad
os d
e 20
10 c
orre
spon
dem
aos
res
ulta
dos
ger
ais
da
amos
tra
do
Cen
so 2
010.
Os
dad
os d
e 20
11/2
012
fora
m r
epon
der
ados
pel
a re
visã
o 20
08 d
as p
roje
ções
pop
ulac
iona
is, i
nclu
ind
o a
tend
ênci
a 20
00-2
010,
vid
e no
ta t
écni
ca n
o sí
tio d
a p
esq
uisa
. (1
) Inc
lui a
gric
ultu
ra, p
ecuá
ria, s
ilvic
ultu
ra, e
xplo
raçã
o flo
rest
al, p
esca
, aq
uicu
ltura
e s
ervi
ços
rela
cion
ados
a e
ssas
ativ
idad
es.
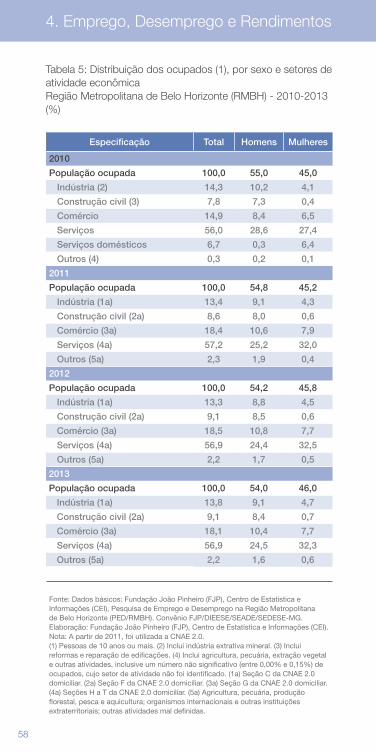
58 59
4. Emprego, Desemprego e Rendimentos
Especificação Total Homens Mulheres
2010
População ocupada 100,0 55,0 45,0
Indústria (2) 14,3 10,2 4,1
Construção civil (3) 7,8 7,3 0,4
Comércio 14,9 8,4 6,5
Serviços 56,0 28,6 27,4
Serviços domésticos 6,7 0,3 6,4
Outros (4) 0,3 0,2 0,1
2011
População ocupada 100,0 54,8 45,2
Indústria (1a) 13,4 9,1 4,3
Construção civil (2a) 8,6 8,0 0,6
Comércio (3a) 18,4 10,6 7,9
Serviços (4a) 57,2 25,2 32,0
Outros (5a) 2,3 1,9 0,4
2012
População ocupada 100,0 54,2 45,8
Indústria (1a) 13,3 8,8 4,5
Construção civil (2a) 9,1 8,5 0,6
Comércio (3a) 18,5 10,8 7,7
Serviços (4a) 56,9 24,4 32,5
Outros (5a) 2,2 1,7 0,5
2013
População ocupada 100,0 54,0 46,0
Indústria (1a) 13,8 9,1 4,7
Construção civil (2a) 9,1 8,4 0,7
Comércio (3a) 18,1 10,4 7,7
Serviços (4a) 56,9 24,5 32,3
Outros (5a) 2,2 1,6 0,6
Fonte: Dados básicos: Fundação João Pinheiro (FJP), Centro de Estatística e Informações (CEI), Pesquisa de Emprego e Desemprego na Região Metropolitana de Belo Horizonte (PED/RMBH). Convênio FJP/DIEESE/SEADE/SEDESE-MG. Elaboração: Fundação João Pinheiro (FJP), Centro de Estatística e Informações (CEI). Nota: A partir de 2011, foi utilizada a CNAE 2.0. (1) Pessoas de 10 anos ou mais. (2) Inclui indústria extrativa mineral. (3) Inclui reformas e reparação de edificações. (4) Inclui agricultura, pecuária, extração vegetal e outras atividades, inclusive um número não significativo (entre 0,00% e 0,15%) de ocupados, cujo setor de atividade não foi identificado. (1a) Seção C da CNAE 2.0 domiciliar. (2a) Seção F da CNAE 2.0 domiciliar. (3a) Seção G da CNAE 2.0 domiciliar. (4a) Seções H a T da CNAE 2.0 domiciliar. (5a) Agricultura, pecuária, produção florestal, pesca e aquicultura; organismos internacionais e outras instituições extraterritoriais; outras atividades mal definidas.
Tabela 5: Distribuição dos ocupados (1), por sexo e setores de atividade econômica Região Metropolitana de Belo Horizonte (RMBH) - 2010-2013 (%)
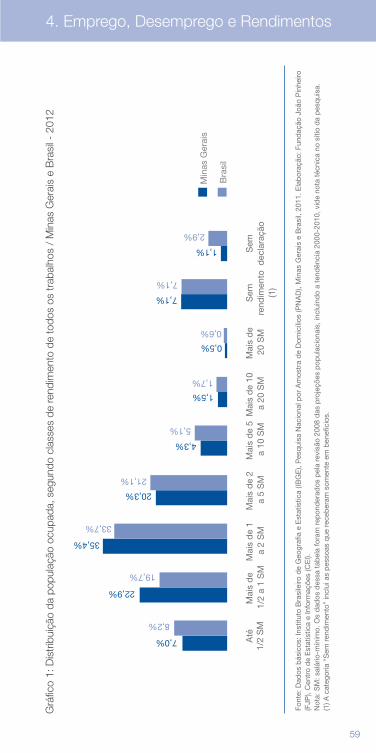
58 59
4. Emprego, Desemprego e Rendimentos
Mai
s d
e 1/
2 a
1 S
MM
ais
de
1 a
2 S
MM
ais
de
2 a
5 S
MM
ais
de
5 a
10
SM
Mai
s d
e 10
a 2
0 S
MM
ais
de
20
SM
Sem
rend
imen
to(1
)
Sem
dec
lara
ção
Até
1/2
SM
Min
as G
erai
s
Bra
sil
7,0%
22,9%
35,4%
20,3%
4,3%
1,5%
0,5%
7,1%
1,1%
8,2%
19,7%
33,7%
21,1%
5,1%
1,7%
7,1%
2,9%
0,6%
Grá
fico
1: D
istr
ibui
ção
da p
opul
ação
ocu
pada
, seg
undo
cla
sses
de
rend
imen
to d
e to
dos
os tr
abal
hos
/ M
inas
Ger
ais
e B
rasi
l - 2
012
Font
e: D
ados
bás
icos
: Ins
titut
o B
rasi
leiro
de
Geo
graf
ia e
Est
atís
tica
(IBG
E),
Pes
qui
sa N
acio
nal p
or A
mos
tra
de
Dom
icíli
os (P
NA
D),
Min
as G
erai
s e
Bra
sil,
2011
. Ela
bor
ação
: Fun
daç
ão J
oão
Pin
heiro
(F
JP),
Cen
tro
de
Est
atís
tica
e In
form
açõe
s (C
EI).
N
ota:
SM
: sal
ário
-mín
imo.
Os
dad
os d
essa
tab
ela
fora
m r
epon
der
ados
pel
a re
visã
o 20
08 d
as p
roje
ções
pop
ulac
iona
is, i
nclu
ind
o a
tend
ênci
a 20
00-2
010,
vid
e no
ta t
écni
ca n
o sí
tio d
a p
esq
uisa
. (1
) A c
ateg
oria
“S
em r
end
imen
to”
incl
ui a
s p
esso
as q
ue r
eceb
eram
som
ente
em
ben
efíc
ios.
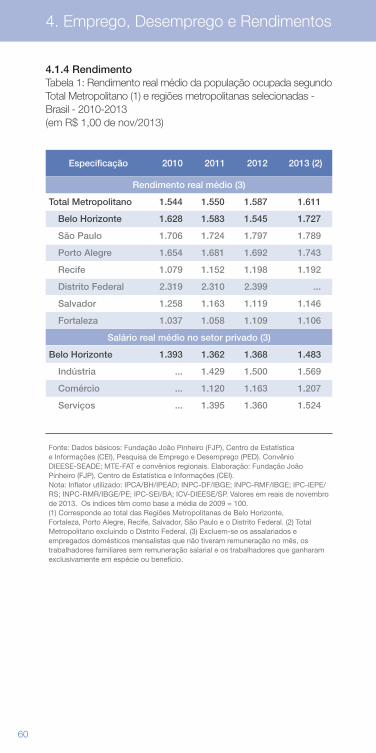
60 61
4. Emprego, Desemprego e Rendimentos
4.1.4 RendimentoTabela 1: Rendimento real médio da população ocupada segundo Total Metropolitano (1) e regiões metropolitanas selecionadas - Brasil - 2010-2013 (em R$ 1,00 de nov/2013)
Especificação 2010 2011 2012 2013 (2)
Rendimento real médio (3)
Total Metropolitano 1.544 1.550 1.587 1.611
Belo Horizonte 1.628 1.583 1.545 1.727
São Paulo 1.706 1.724 1.797 1.789
Porto Alegre 1.654 1.681 1.692 1.743
Recife 1.079 1.152 1.198 1.192
Distrito Federal 2.319 2.310 2.399 ...
Salvador 1.258 1.163 1.119 1.146
Fortaleza 1.037 1.058 1.109 1.106
Salário real médio no setor privado (3)
Belo Horizonte 1.393 1.362 1.368 1.483
Indústria ... 1.429 1.500 1.569
Comércio ... 1.120 1.163 1.207
Serviços ... 1.395 1.360 1.524
Fonte: Dados básicos: Fundação João Pinheiro (FJP), Centro de Estatística e Informações (CEI), Pesquisa de Emprego e Desemprego (PED). Convênio DIEESE-SEADE; MTE-FAT e convênios regionais. Elaboração: Fundação João Pinheiro (FJP), Centro de Estatística e Informações (CEI). Nota: Inflator utilizado: IPCA/BH/IPEAD; INPC-DF/IBGE; INPC-RMF/IBGE; IPC-IEPE/RS; INPC-RMR/IBGE/PE; IPC-SEI/BA; ICV-DIEESE/SP. Valores em reais de novembro de 2013. Os índices têm como base a média de 2009 = 100. (1) Corresponde ao total das Regiões Metropolitanas de Belo Horizonte, Fortaleza, Porto Alegre, Recife, Salvador, São Paulo e o Distrito Federal. (2) Total Metropolitano excluindo o Distrito Federal. (3) Excluem-se os assalariados e empregados domésticos mensalistas que não tiveram remuneração no mês, os trabalhadores familiares sem remuneração salarial e os trabalhadores que ganharam exclusivamente em espécie ou benefício.
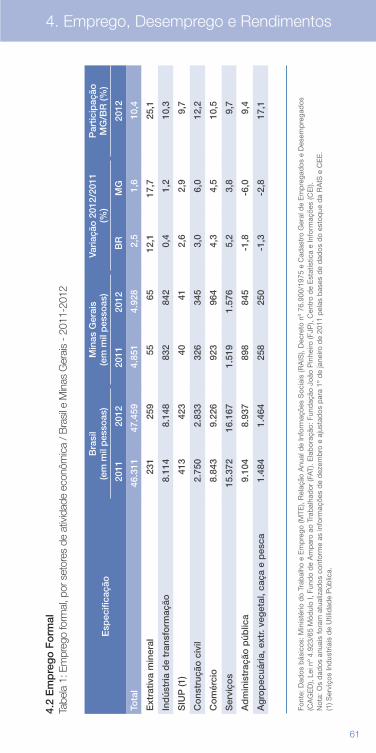
60 61
4. Emprego, Desemprego e Rendimentos
4.2
Em
pre
go
Fo
rmal
Tabe
la 1
: Em
preg
o fo
rmal
, por
set
ores
de
ativ
idad
e ec
onôm
ica
/ Bra
sil e
Min
as G
erai
s -
2011
-201
2
Esp
ecifi
caçã
oB
rasi
l (e
m m
il p
esso
as)
Min
as G
erai
s (e
m m
il p
esso
as)
Vari
ação
201
2/20
11
(%)
Par
ticip
ação
M
G/B
R (%
)
2011
2012
2011
2012
BR
MG
2012
Tota
l46
.311
47.4
594.
851
4.92
82,
51,
610
,4
Ext
rativ
a m
iner
al23
125
955
6512
,117
,725
,1
Ind
ústr
ia d
e tr
ansf
orm
ação
8.11
48.
148
832
842
0,4
1,2
10,3
SIU
P (1
)41
342
340
412,
62,
99,
7
Co
nstr
ução
civ
il2.
750
2.83
332
634
53,
06,
012
,2
Co
mér
cio
8.84
39.
226
923
964
4,3
4,5
10,5
Ser
viço
s15
.372
16.1
671.
519
1.57
65,
23,
89,
7
Ad
min
istr
ação
púb
lica
9.10
48.
937
898
845
-1,8
-6,0
9,4
Ag
rop
ecuá
ria,
ext
r. ve
get
al, c
aça
e p
esca
1.48
41.
464
258
250
-1,3
-2,8
17,1
Font
e: D
ados
bás
icos
: Min
isté
rio d
o Tr
abal
ho e
Em
pre
go (M
TE),
Rel
ação
Anu
al d
e In
form
açõe
s S
ocia
is (R
AIS
), D
ecre
to n
º 76
.900
/197
5 e
Cad
astr
o G
eral
de
Em
pre
gad
os e
Des
emp
rega
dos
(C
AG
ED
), Le
i nº
4.92
3/65
Mód
ulo
I, Fu
ndo
de
Am
par
o ao
Tra
bal
had
or (F
AT).
Ela
bor
ação
: Fun
daç
ão J
oão
Pin
heiro
(FJP
), C
entr
o d
e E
stat
ístic
a e
Info
rmaç
ões
(CE
I).
Not
a: O
s d
ados
anu
ais
fora
m a
tual
izad
os c
onfo
rme
as in
form
açõe
s d
e d
ezem
bro
e a
just
ados
par
a 1º
de
jane
iro d
e 20
11 p
elas
bas
es d
e d
ados
do
esto
que
da
RA
IS e
CE
E.
(1) S
ervi
ços
Ind
ustr
iais
de
Util
idad
e P
úblic
a.

62 63
4. Emprego, Desemprego e Rendimentos
Tabe
la 2
A: E
mpr
ego
form
al, p
or s
etor
es d
e at
ivid
ade
econ
ômic
a e
regi
ões
de p
lane
jam
ento
/ M
inas
Ger
ais
- 20
11
Esp
ecifi
caçã
oTo
tal (
1)E
xtra
tiva
Min
eral
Ind
ústr
ia d
e Tr
ansf
orm
ação
SIU
P (2
)C
ons
truç
ão
Civ
ilC
om
érci
oS
ervi
ços
Ad
min
istr
ação
P
úblic
a (3
)A
gro
pec
uári
a
Tota
l (em
pes
soas
)4.
068.
829
63.4
9883
5.03
616
.131
372.
285
899.
591
1.51
9.57
068
.998
293.
720
Dis
trib
uiçã
o p
or
reg
iões
de
pla
neja
men
to (%
)10
0,0
100,
010
0,0
100,
010
0,0
100,
010
0,0
100,
010
0,0
C
entr
al47
,769
,038
,949
,362
,342
,557
,745
,513
,7
M
ata
9,2
2,5
11,1
13,1
7,3
9,3
8,8
15,9
7,2
S
ul d
e M
inas
12,5
8,4
17,7
9,9
6,6
12,9
9,0
18,8
22,0
Tr
iâng
ulo
9,2
1,1
9,0
14,2
7,8
9,6
9,2
7,0
13,1
A
lto P
aran
aíb
a3,
32,
92,
62,
52,
13,
62,
23,
711
,2
C
entr
o-O
este
de
Min
as5,
75,
510
,02,
53,
15,
93,
72,
87,
6
N
oro
este
de
Min
as1,
54,
90,
80,
30,
91,
60,
90,
26,
6
N
ort
e d
e M
inas
3,8
1,0
3,1
1,2
2,6
5,1
2,7
3,1
9,8
Je
qui
tinho
nha/
Muc
uri
1,7
2,6
0,9
1,5
1,8
2,4
1,3
1,4
3,9
R
io D
oce
5,4
2,0
5,7
5,3
5,6
7,1
4,5
1,5
4,8
Font
e: M
TE/S
PP
E/D
ES
/CG
ET
- C
AG
ED
Lei
nº
4.92
3/65
. N
ota:
Os
dad
os a
nuai
s fo
ram
atu
aliz
ados
con
form
e as
info
rmaç
ões
de
dez
emb
ro e
aju
stad
os p
ara
1º d
e ja
neiro
de
2011
pel
as b
ases
de
dad
os d
o es
toq
ue d
a R
AIS
e C
EE
. (1
) Cor
resp
ond
e ao
som
atór
io d
as a
tivid
ades
exc
luin
do,
se
exis
tent
e, “
Out
ros
seto
res”
e “
Igno
rad
os”.
(2) S
ervi
ços
Ind
ustr
iais
de
Util
idad
e P
úblic
a. (3
) O e
stoq
ue n
a A
dm
inis
traç
ão P
úblic
a re
fere
-se
apen
as a
os v
íncu
los
trab
alhi
stas
reg
idos
pel
a C
onso
lidaç
ão d
as L
eis
Trab
alhi
stas
(CLT
), ví
ncul
o p
ouco
exp
ress
ivo
no s
etor
púb
lico.
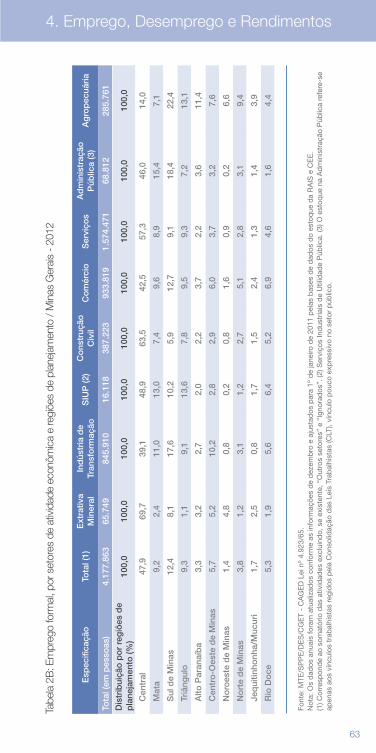
62 63
4. Emprego, Desemprego e Rendimentos
Tabe
la 2
B: E
mpr
ego
form
al, p
or s
etor
es d
e at
ivid
ade
econ
ômic
a e
regi
ões
de p
lane
jam
ento
/ M
inas
Ger
ais
- 20
12
Esp
ecifi
caçã
oTo
tal (
1)E
xtra
tiva
Min
eral
Ind
ústr
ia d
e Tr
ansf
orm
ação
SIU
P (2
)C
ons
truç
ão
Civ
ilC
om
érci
oS
ervi
ços
Ad
min
istr
ação
P
úblic
a (3
)A
gro
pec
uári
a
Tota
l (em
pes
soas
)4.
177.
863
65.7
4984
5.91
016
.118
387.
223
933.
819
1.57
4.47
168
.812
285.
761
Dis
trib
uiçã
o p
or
reg
iões
de
pla
neja
men
to (%
)10
0,0
100,
010
0,0
100,
010
0,0
100,
010
0,0
100,
010
0,0
C
entr
al47
,969
,739
,148
,963
,542
,557
,346
,014
,0
M
ata
9,2
2,4
11,0
13,0
7,4
9,6
8,9
15,4
7,1
S
ul d
e M
inas
12,4
8,1
17,6
10,2
5,9
12,7
9,1
18,4
22,4
Tr
iâng
ulo
9,3
1,1
9,1
13,6
7,8
9,5
9,3
7,2
13,1
A
lto P
aran
aíb
a3,
33,
22,
72,
02,
23,
72,
23,
611
,4
C
entr
o-O
este
de
Min
as5,
75,
210
,22,
82,
96,
03,
73,
27,
6
N
oro
este
de
Min
as1,
44,
80,
80,
20,
81,
60,
90,
26,
6
N
ort
e d
e M
inas
3,8
1,2
3,1
1,2
2,7
5,1
2,8
3,1
9,4
Je
qui
tinho
nha/
Muc
uri
1,7
2,5
0,8
1,7
1,5
2,4
1,3
1,4
3,9
R
io D
oce
5,3
1,9
5,6
6,4
5,2
6,9
4,6
1,6
4,4
Font
e: M
TE/S
PP
E/D
ES
/CG
ET
- C
AG
ED
Lei
nº
4.92
3/65
. N
ota:
Os
dad
os a
nuai
s fo
ram
atu
aliz
ados
con
form
e as
info
rmaç
ões
de
dez
emb
ro e
aju
stad
os p
ara
1º d
e ja
neiro
de
2011
pel
as b
ases
de
dad
os d
o es
toq
ue d
a R
AIS
e C
EE
. (1
) Cor
resp
ond
e ao
som
atór
io d
as a
tivid
ades
exc
luin
do,
se
exis
tent
e, “
Out
ros
seto
res”
e “
Igno
rad
os”.
(2) S
ervi
ços
Ind
ustr
iais
de
Util
idad
e P
úblic
a. (3
) O e
stoq
ue n
a A
dm
inis
traç
ão P
úblic
a re
fere
-se
apen
as a
os v
íncu
los
trab
alhi
stas
reg
idos
pel
a C
onso
lidaç
ão d
as L
eis
Trab
alhi
stas
(CLT
), ví
ncul
o p
ouco
exp
ress
ivo
no s
etor
púb
lico.
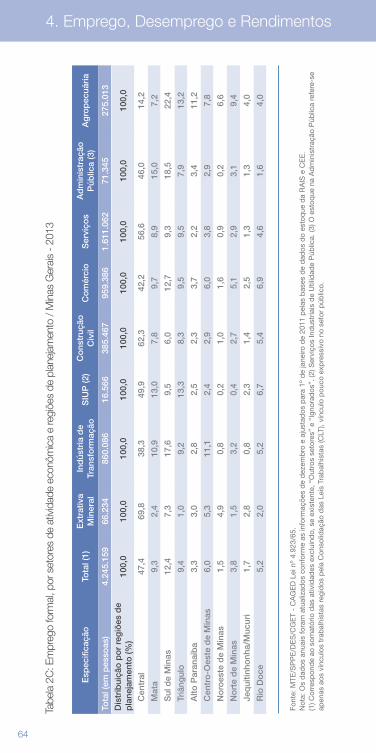
64
4. Emprego, Desemprego e Rendimentos
Tabe
la 2
C: E
mpr
ego
form
al, p
or s
etor
es d
e at
ivid
ade
econ
ômic
a e
regi
ões
de p
lane
jam
ento
/ M
inas
Ger
ais
- 20
13
Esp
ecifi
caçã
oTo
tal (
1)E
xtra
tiva
Min
eral
Ind
ústr
ia d
e Tr
ansf
orm
ação
SIU
P (2
)C
ons
truç
ão
Civ
ilC
om
érci
oS
ervi
ços
Ad
min
istr
ação
P
úblic
a (3
)A
gro
pec
uári
a
Tota
l (em
pes
soas
)4.
245.
159
66.2
3486
0.08
616
.566
385.
467
959.
386
1.61
1.06
271
.345
275.
013
Dis
trib
uiçã
o p
or
reg
iões
de
pla
neja
men
to (%
)10
0,0
100,
010
0,0
100,
010
0,0
100,
010
0,0
100,
010
0,0
C
entr
al47
,469
,838
,349
,962
,342
,256
,646
,014
,2
M
ata
9,3
2,4
10,9
13,0
7,8
9,7
8,9
15,0
7,2
S
ul d
e M
inas
12,4
7,3
17,6
9,5
6,0
12,7
9,3
18,5
22,4
Tr
iâng
ulo
9,4
1,0
9,2
13,3
8,3
9,5
9,5
7,9
13,2
A
lto P
aran
aíb
a3,
33,
02,
82,
52,
33,
72,
23,
411
,2
C
entr
o-O
este
de
Min
as6,
05,
311
,12,
42,
96,
03,
82,
97,
8
N
oro
este
de
Min
as1,
54,
90,
80,
21,
01,
60,
90,
26,
6
N
ort
e d
e M
inas
3,8
1,5
3,2
0,4
2,7
5,1
2,9
3,1
9,4
Je
qui
tinho
nha/
Muc
uri
1,7
2,8
0,8
2,3
1,4
2,5
1,3
1,3
4,0
R
io D
oce
5,2
2,0
5,2
6,7
5,4
6,9
4,6
1,6
4,0
Font
e: M
TE/S
PP
E/D
ES
/CG
ET
- C
AG
ED
Lei
nº
4.92
3/65
. N
ota:
Os
dad
os a
nuai
s fo
ram
atu
aliz
ados
con
form
e as
info
rmaç
ões
de
dez
emb
ro e
aju
stad
os p
ara
1º d
e ja
neiro
de
2011
pel
as b
ases
de
dad
os d
o es
toq
ue d
a R
AIS
e C
EE
. (1
) Cor
resp
ond
e ao
som
atór
io d
as a
tivid
ades
exc
luin
do,
se
exis
tent
e, “
Out
ros
seto
res”
e “
Igno
rad
os”.
(2) S
ervi
ços
Ind
ustr
iais
de
Util
idad
e P
úblic
a. (3
) O e
stoq
ue n
a A
dm
inis
traç
ão P
úblic
a re
fere
-se
apen
as a
os v
íncu
los
trab
alhi
stas
reg
idos
pel
a C
onso
lidaç
ão d
as L
eis
Trab
alhi
stas
(CLT
), ví
ncul
o p
ouco
exp
ress
ivo
no s
etor
púb
lico.

65
Comportamento dos Preços
5
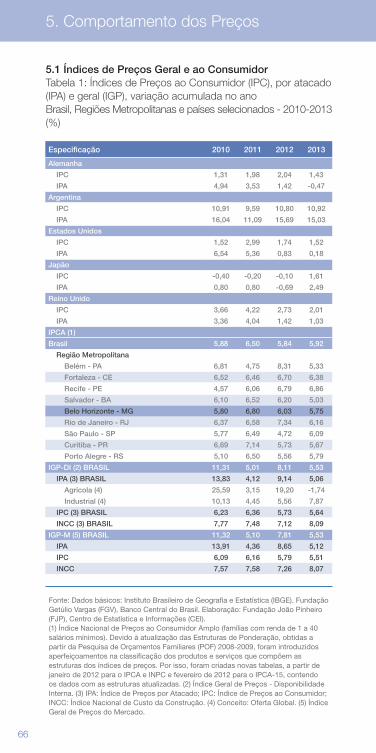
66 67
5.1 Índices de Preços Geral e ao ConsumidorTabela 1: Índices de Preços ao Consumidor (IPC), por atacado (IPA) e geral (IGP), variação acumulada no ano Brasil, Regiões Metropolitanas e países selecionados - 2010-2013 (%)
Especificação 2010 2011 2012 2013
Alemanha
IPC 1,31 1,98 2,04 1,43
IPA 4,94 3,53 1,42 -0,47
Argentina
IPC 10,91 9,59 10,80 10,92
IPA 16,04 11,09 15,69 15,03
Estados Unidos
IPC 1,52 2,99 1,74 1,52
IPA 6,54 5,36 0,83 0,18
Japão
IPC -0,40 -0,20 -0,10 1,61
IPA 0,80 0,80 -0,69 2,49
Reino Unido
IPC 3,66 4,22 2,73 2,01
IPA 3,36 4,04 1,42 1,03
IPCA (1)
Brasil 5,88 6,50 5,84 5,92
Região Metropolitana
Belém - PA 6,81 4,75 8,31 5,33
Fortaleza - CE 6,52 6,46 6,70 6,38
Recife - PE 4,57 6,06 6,79 6,86
Salvador - BA 6,10 6,52 6,20 5,03
Belo Horizonte - MG 5,80 6,80 6,03 5,75
Rio de Janeiro - RJ 6,37 6,58 7,34 6,16
São Paulo - SP 5,77 6,49 4,72 6,09
Curitiba - PR 6,69 7,14 5,73 5,67
Porto Alegre - RS 5,10 6,50 5,56 5,79
IGP-DI (2) BRASIL 11,31 5,01 8,11 5,53
IPA (3) BRASIL 13,83 4,12 9,14 5,06
Agrícola (4) 25,59 3,15 19,20 -1,74
Industrial (4) 10,13 4,45 5,56 7,87
IPC (3) BRASIL 6,23 6,36 5,73 5,64
INCC (3) BRASIL 7,77 7,48 7,12 8,09
IGP-M (5) BRASIL 11,32 5,10 7,81 5,53
IPA 13,91 4,36 8,65 5,12
IPC 6,09 6,16 5,79 5,51
INCC 7,57 7,58 7,26 8,07
Fonte: Dados básicos: Instituto Brasileiro de Geografia e Estatística (IBGE). Fundação Getúlio Vargas (FGV), Banco Central do Brasil. Elaboração: Fundação João Pinheiro (FJP), Centro de Estatística e Informações (CEI). (1) Índice Nacional de Preços ao Consumidor Amplo (famílias com renda de 1 a 40 salários mínimos). Devido à atualização das Estruturas de Ponderação, obtidas a partir da Pesquisa de Orçamentos Familiares (POF) 2008-2009, foram introduzidos aperfeiçoamentos na classificação dos produtos e serviços que compõem as estruturas dos índices de preços. Por isso, foram criadas novas tabelas, a partir de janeiro de 2012 para o IPCA e INPC e fevereiro de 2012 para o IPCA-15, contendo os dados com as estruturas atualizadas. (2) Índice Geral de Preços - Disponibilidade Interna. (3) IPA: Índice de Preços por Atacado; IPC: Índice de Preços ao Consumidor; INCC: Índice Nacional de Custo da Construção. (4) Conceito: Oferta Global. (5) Índice Geral de Preços do Mercado.
5. Comportamento dos Preços
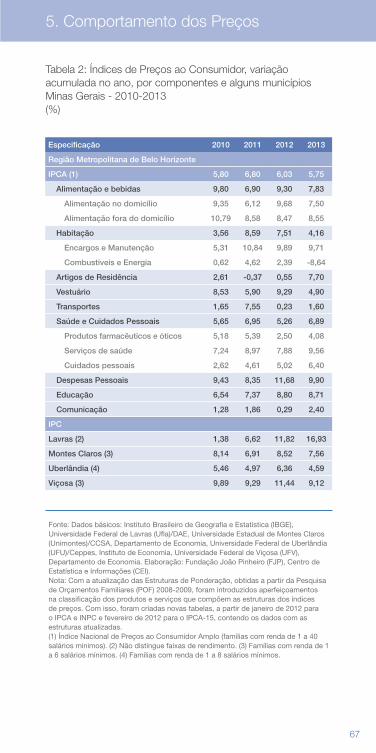
66 67
5. Comportamento dos Preços
Tabela 2: Índices de Preços ao Consumidor, variação acumulada no ano, por componentes e alguns municípios Minas Gerais - 2010-2013 (%)
Especificação 2010 2011 2012 2013
Região Metropolitana de Belo Horizonte
IPCA (1) 5,80 6,80 6,03 5,75
Alimentação e bebidas 9,80 6,90 9,30 7,83
Alimentação no domicílio 9,35 6,12 9,68 7,50
Alimentação fora do domicílio 10,79 8,58 8,47 8,55
Habitação 3,56 8,59 7,51 4,16
Encargos e Manutenção 5,31 10,84 9,89 9,71
Combustíveis e Energia 0,62 4,62 2,39 -8,64
Artigos de Residência 2,61 -0,37 0,55 7,70
Vestuário 8,53 5,90 9,29 4,90
Transportes 1,65 7,55 0,23 1,60
Saúde e Cuidados Pessoais 5,65 6,95 5,26 6,89
Produtos farmacêuticos e óticos 5,18 5,39 2,50 4,08
Serviços de saúde 7,24 8,97 7,88 9,56
Cuidados pessoais 2,62 4,61 5,02 6,40
Despesas Pessoais 9,43 8,35 11,68 9,90
Educação 6,54 7,37 8,80 8,71
Comunicação 1,28 1,86 0,29 2,40
IPC
Lavras (2) 1,38 6,62 11,82 16,93
Montes Claros (3) 8,14 6,91 8,52 7,56
Uberlândia (4) 5,46 4,97 6,36 4,59
Viçosa (3) 9,89 9,29 11,44 9,12
Fonte: Dados básicos: Instituto Brasileiro de Geografia e Estatística (IBGE), Universidade Federal de Lavras (Ufla)/DAE, Universidade Estadual de Montes Claros (Unimontes)/CCSA, Departamento de Economia, Universidade Federal de Uberlândia (UFU)/Ceppes, Instituto de Economia, Universidade Federal de Viçosa (UFV), Departamento de Economia. Elaboração: Fundação João Pinheiro (FJP), Centro de Estatística e Informações (CEI). Nota: Com a atualização das Estruturas de Ponderação, obtidas a partir da Pesquisa de Orçamentos Familiares (POF) 2008-2009, foram introduzidos aperfeiçoamentos na classificação dos produtos e serviços que compõem as estruturas dos índices de preços. Com isso, foram criadas novas tabelas, a partir de janeiro de 2012 para o IPCA e INPC e fevereiro de 2012 para o IPCA-15, contendo os dados com as estruturas atualizadas. (1) Índice Nacional de Preços ao Consumidor Amplo (famílias com renda de 1 a 40 salários mínimos). (2) Não distingue faixas de rendimento. (3) Famílias com renda de 1 a 6 salários mínimos. (4) Famílias com renda de 1 a 8 salários mínimos.

68
69
Agregados Macroeconômicos
6
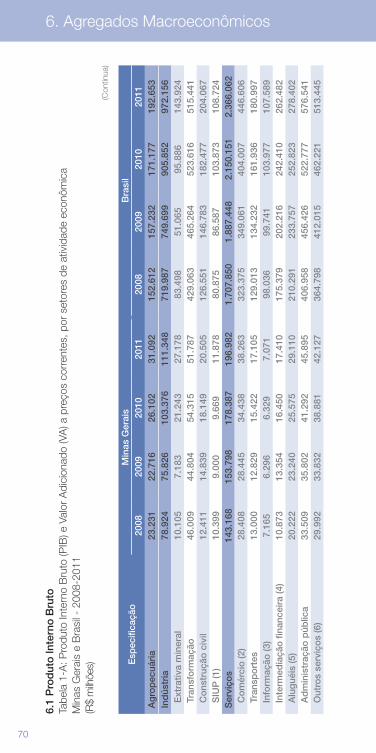
70 71
6. Agregados Macroeconômicos
6.1
Pro
dut
o In
tern
o B
ruto
Tabe
la 1
-A: P
rodu
to In
tern
o B
ruto
(PIB
) e V
alor
Adi
cion
ado
(VA
) a p
reço
s co
rren
tes,
por
set
ores
de
ativ
idad
e ec
onôm
ica
Min
as G
erai
s e
Bra
sil -
200
8-20
11
(R$
milh
ões) E
spec
ifica
ção
Min
as G
erai
sB
rasi
l20
0820
0920
1020
1120
0820
0920
1020
11 A
gro
pec
uári
a23
.231
22.7
1626
.102
31.0
9215
2.61
215
7.23
217
1.17
719
2.65
3 In
dús
tria
78.9
2475
.826
103.
376
111.
348
719.
987
749.
699
905.
852
972.
156
E
xtra
tiva
min
eral
10.1
057.
183
21.2
4327
.178
83.4
9851
.065
95.8
8614
3.92
4
Tran
sfo
rmaç
ão46
.009
44.8
0454
.315
51.7
8742
9.06
346
5.26
452
3.61
651
5.44
1
Co
nstr
ução
civ
il12
.411
14.8
3918
.149
20.5
0512
6.55
114
6.78
318
2.47
720
4.06
7
SIU
P (1
)10
.399
9.00
09.
669
11.8
7880
.875
86.5
8710
3.87
310
8.72
4 S
ervi
ços
143.
168
153.
798
178.
387
196.
982
1.70
7.85
01.
887.
448
2.15
0.15
12.
366.
062
C
om
érci
o (2
)28
.408
28.4
4534
.438
38.2
6332
3.37
534
9.06
140
4.00
744
6.60
6
Tran
spo
rtes
13.0
0012
.829
15.4
2217
.105
129.
013
134.
232
161.
936
180.
997
In
form
ação
(3)
7.16
56.
296
6.32
97.
071
98.0
3699
.741
103.
977
107.
589
In
term
edia
ção
fin
ance
ira
(4)
10.8
7313
.354
16.4
5017
.410
175.
379
202.
216
242.
410
262.
482
A
lug
uéis
(5)
20.2
2223
.240
25.5
7529
.110
210.
291
233.
757
252.
823
278.
402
A
dm
inis
traç
ão p
úblic
a33
.509
35.8
0241
.292
45.8
9540
6.95
845
6.42
652
2.77
757
6.54
1
Out
ros
serv
iço
s (6
)29
.992
33.8
3238
.881
42.1
2736
4.79
841
2.01
546
2.22
151
3.44
5
(Con
tinua
)
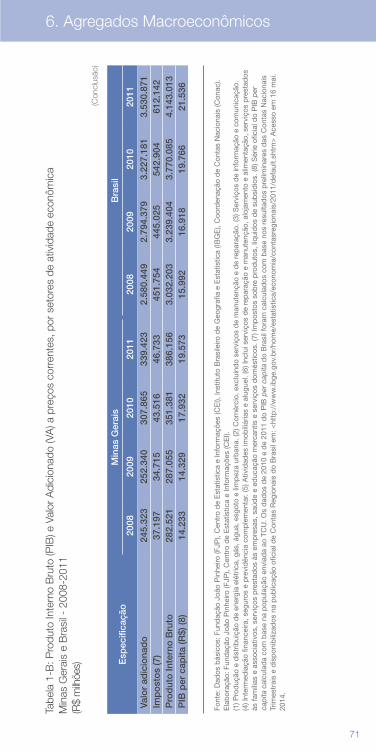
70 71
6. Agregados Macroeconômicos
Tabe
la 1
-B: P
rodu
to In
tern
o B
ruto
(PIB
) e V
alor
Adi
cion
ado
(VA
) a p
reço
s co
rren
tes,
por
set
ores
de
ativ
idad
e ec
onôm
ica
Min
as G
erai
s e
Bra
sil -
200
8-20
11
(R$
milh
ões) E
spec
ifica
ção
Min
as G
erai
sB
rasi
l
2008
2009
2010
2011
2008
2009
2010
2011
Val
or
adic
iona
do
245.
323
252.
340
307.
865
339.
423
2.58
0.44
92.
794.
379
3.22
7.18
13.
530.
871
Imp
ost
os
(7)
37.1
9734
.715
43.5
1646
.733
451.
754
445.
025
542.
904
612.
142
Pro
dut
o In
tern
o B
ruto
282.
521
287.
055
351.
381
386.
156
3.03
2.20
33.
239.
404
3.77
0.08
54.
143.
013
PIB
per
cap
ita (R
$) (8
)14
.233
14.3
2917
.932
19.5
7315
.992
16.9
1819
.766
21.5
36
Font
e: D
ados
bás
icos
: Fun
daç
ão J
oão
Pin
heiro
(FJP
), C
entr
o d
e E
stat
ístic
a e
Info
rmaç
ões
(CE
I), In
stitu
to B
rasi
leiro
de
Geo
graf
ia e
Est
atís
tica
(IBG
E),
Coo
rden
ação
de
Con
tas
Nac
iona
is (C
onac
). E
lab
oraç
ão: F
und
ação
Joã
o P
inhe
iro (F
JP),
Cen
tro
de
Est
atís
tica
e In
form
açõe
s (C
EI).
(1
) Pro
duç
ão e
dis
trib
uiçã
o d
e en
ergi
a el
étric
a, g
ás, á
gua,
esg
oto
e lim
pez
a ur
ban
a. (2
) Com
érci
o, e
xclu
ind
o se
rviç
os d
e m
anut
ençã
o e
de
rep
araç
ão. (
3) S
ervi
ços
de
info
rmaç
ão e
com
unic
ação
. (4
) Int
erm
edia
ção
finan
ceira
, seg
uros
e p
revi
dên
cia
com
ple
men
tar.
(5) A
tivid
ades
imob
iliár
ias
e al
ugue
l. (6
) Inc
lui s
ervi
ços
de
rep
araç
ão e
man
uten
ção,
alo
jam
ento
e a
limen
taçã
o, s
ervi
ços
pre
stad
os
às fa
míli
as e
ass
ocia
tivos
, ser
viço
s p
rest
ados
às
emp
resa
s, s
aúd
e e
educ
ação
mer
cant
is e
ser
viço
s d
omés
ticos
. (7)
Imp
osto
s so
bre
pro
dut
os, l
íqui
dos
de
sub
síd
ios.
(8) S
érie
ofic
ial d
o P
IB p
er
cap
ita c
alcu
lad
a co
m b
ase
na p
opul
ação
env
iad
a ao
TC
U. O
s d
ados
de
2010
e d
e 20
11 d
o P
IB p
er c
apita
do
Bra
sil f
oram
cal
cula
dos
com
bas
e no
s re
sulta
dos
pre
limin
ares
das
Con
tas
Nac
iona
is
Trim
estr
ais
e d
isp
onib
iliza
dos
na
pub
licaç
ão o
ficia
l de
Con
tas
Reg
iona
is d
o B
rasi
l em
: <ht
tp:/
/ww
w.ib
ge.g
ov.b
r/ho
me/
esta
tistic
a/ec
onom
ia/c
onta
sreg
iona
is/2
011/
def
ault.
shtm
> A
cess
o em
16
mai
. 20
14.
(Con
clus
ão)
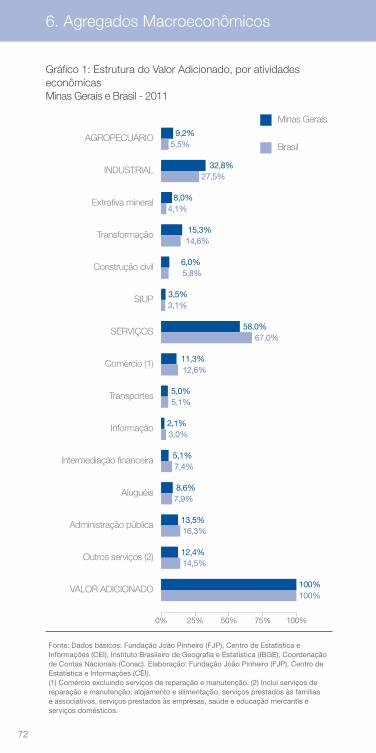
72 73
6. Agregados Macroeconômicos
Gráfico 1: Estrutura do Valor Adicionado, por atividades econômicas Minas Gerais e Brasil - 2011
Fonte: Dados básicos: Fundação João Pinheiro (FJP), Centro de Estatística e Informações (CEI), Instituto Brasileiro de Geografia e Estatística (IBGE), Coordenação de Contas Nacionais (Conac). Elaboração: Fundação João Pinheiro (FJP), Centro de Estatística e Informações (CEI). (1) Comércio excluindo serviços de reparação e manutenção. (2) Inclui serviços de reparação e manutenção, alojamento e alimentação, serviços prestados às famílias e associativos, serviços prestados às empresas, saúde e educação mercantis e serviços domésticos.
VALOR ADICIONADO
Outros serviços (2)
Administração pública
Aluguéis
Intermediação financeira
Informação
Transportes
Comércio (1)
SERVIÇOS
SIUP
Construção civil
Transformação
Extrativa mineral
INDUSTRIAL
AGROPECUÁRIO
Minas Gerais
Brasil
100%
12,4%
13,5%
8,6%
5,1%
2,1%
5,0%
11,3%
58,0%
3,5%
6,0%
15,3%
8,0%
32,8%
9,2%
100%
14,5%
16,3%
7,9%
7,4%
3,0%
5,1%
12,6%
67,0%
3,1%
5,8%
14,6%
4,1%
27,5%
5,5%
0% 25% 50% 75% 100%
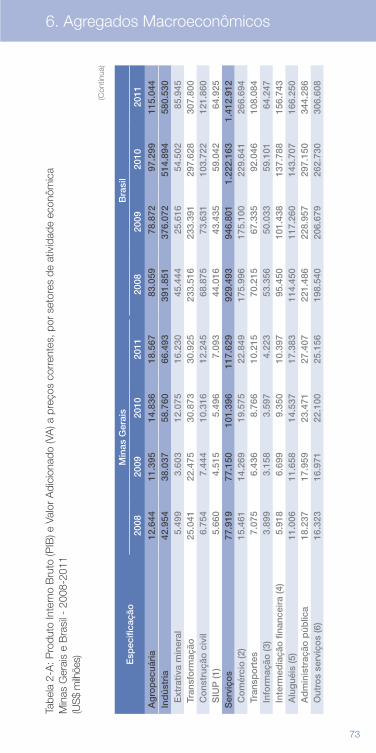
72 73
6. Agregados Macroeconômicos
Tabe
la 2
-A: P
rodu
to In
tern
o B
ruto
(PIB
) e V
alor
Adi
cion
ado
(VA
) a p
reço
s co
rren
tes,
por
set
ores
de
ativ
idad
e ec
onôm
ica
Min
as G
erai
s e
Bra
sil -
200
8-20
11
(US
$ m
ilhõe
s) Esp
ecifi
caçã
oM
inas
Ger
ais
Bra
sil
2008
2009
2010
2011
2008
2009
2010
2011
Ag
rop
ecuá
ria
12.6
4411
.395
14.8
3618
.567
83.0
5978
.872
97.2
9911
5.04
4 In
dús
tria
42.9
5438
.037
58.7
6066
.493
391.
851
376.
072
514.
894
580.
530
E
xtra
tiva
min
eral
5.49
93.
603
12.0
7516
.230
45.4
4425
.616
54.5
0285
.945
Tr
ansf
orm
ação
25.0
4122
.475
30.8
7330
.925
233.
516
233.
391
297.
628
307.
800
C
ons
truç
ão c
ivil
6.75
47.
444
10.3
1612
.245
68.8
7573
.631
103.
722
121.
860
S
IUP
(1)
5.66
04.
515
5.49
67.
093
44.0
1643
.435
59.0
4264
.925
Ser
viço
s77
.919
77.1
5010
1.39
611
7.62
992
9.49
394
6.80
11.
222.
163
1.41
2.91
2
Co
mér
cio
(2)
15.4
6114
.269
19.5
7522
.849
175.
996
175.
100
229.
641
266.
694
Tr
ansp
ort
es7.
075
6.43
68.
766
10.2
1570
.215
67.3
3592
.046
108.
084
In
form
ação
(3)
3.89
93.
158
3.59
74.
223
53.3
5650
.033
59.1
0164
.247
In
term
edia
ção
fin
ance
ira
(4)
5.91
86.
699
9.35
010
.397
95.4
5010
1.43
813
7.78
815
6.74
3
Alu
gué
is (5
)11
.006
11.6
5814
.537
17.3
8311
4.45
011
7.26
014
3.70
716
6.25
0
Ad
min
istr
ação
púb
lica
18.2
3717
.959
23.4
7127
.407
221.
486
228.
957
297.
150
344.
286
O
utro
s se
rviç
os
(6)
16.3
2316
.971
22.1
0025
.156
198.
540
206.
679
262.
730
306.
608
(Con
tinua
)
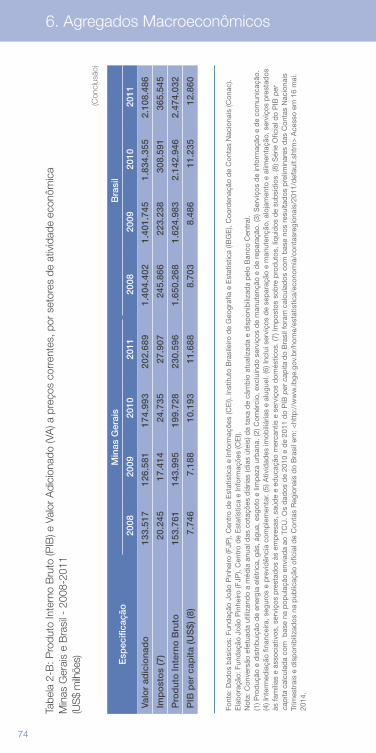
74 75
6. Agregados Macroeconômicos
Tabe
la 2
-B: P
rodu
to In
tern
o B
ruto
(PIB
) e V
alor
Adi
cion
ado
(VA
) a p
reço
s co
rren
tes,
por
set
ores
de
ativ
idad
e ec
onôm
ica
Min
as G
erai
s e
Bra
sil -
200
8-20
11
(US
$ m
ilhõe
s) Esp
ecifi
caçã
oM
inas
Ger
ais
Bra
sil
2008
2009
2010
2011
2008
2009
2010
2011
Val
or
adic
iona
do
133.
517
126.
581
174.
993
202.
689
1.40
4.40
21.
401.
745
1.83
4.35
52.
108.
486
Imp
ost
os
(7)
20.2
4517
.414
24.7
3527
.907
245.
866
223.
238
308.
591
365.
545
Pro
dut
o In
tern
o B
ruto
153.
761
143.
995
199.
728
230.
596
1.65
0.26
81.
624.
983
2.14
2.94
62.
474.
032
PIB
per
cap
ita (U
S$)
(8)
7.74
67.
188
10.1
9311
.688
8.70
38.
486
11.2
3512
.860
Font
e: D
ados
bás
icos
: Fun
daç
ão J
oão
Pin
heiro
(FJP
), C
entr
o d
e E
stat
ístic
a e
Info
rmaç
ões
(CE
I). In
stitu
to B
rasi
leiro
de
Geo
graf
ia e
Est
atís
tica
(IBG
E),
Coo
rden
ação
de
Con
tas
Nac
iona
is (C
onac
). E
lab
oraç
ão: F
und
ação
Joã
o P
inhe
iro (F
JP),
Cen
tro
de
Est
atís
tica
e In
form
açõe
s (C
EI).
N
ota:
Con
vers
ão e
fetu
ada
utili
zand
o a
méd
ia a
nual
das
cot
açõe
s d
iária
s (d
ias
útei
s) d
a ta
xa d
e câ
mb
io a
tual
izad
a e
dis
pon
ibili
zad
a p
elo
Ban
co C
entr
al.
(1) P
rod
ução
e d
istr
ibui
ção
de
ener
gia
elét
rica,
gás
, águ
a, e
sgot
o e
limp
eza
urb
ana.
(2) C
omér
cio,
exc
luin
do
serv
iços
de
man
uten
ção
e d
e re
par
ação
. (3)
Ser
viço
s d
e in
form
ação
e d
e co
mun
icaç
ão.
(4) I
nter
med
iaçã
o fin
ance
ira, s
egur
os e
pre
vid
ênci
a co
mp
lem
enta
r. (5
) Ativ
idad
es im
obili
ária
s e
alug
uel.
(6) I
nclu
i ser
viço
s d
e se
par
ação
e m
anut
ençã
o, a
loja
men
to e
alim
enta
ção,
ser
viço
s p
rest
ados
às
fam
ílias
e a
ssoc
iativ
os, s
ervi
ços
pre
stad
os à
s em
pre
sas,
saú
de
e ed
ucaç
ão m
erca
ntis
e s
ervi
ços
dom
éstic
os. (
7) Im
pos
tos
sob
re p
rod
utos
, líq
uid
os d
e su
bsí
dio
s. (8
) Sér
ie O
ficia
l do
PIB
per
ca
pita
cal
cula
da
com
bas
e na
pop
ulaç
ão e
nvia
da
ao T
CU
. Os
dad
os d
e 20
10 e
de
2011
do
PIB
per
cap
ita d
o B
rasi
l for
am c
alcu
lad
os c
om b
ase
nos
resu
ltad
os p
relim
inar
es d
as C
onta
s N
acio
nais
Tr
imes
trai
s e
dis
pon
ibili
zad
os n
a p
ublic
ação
ofic
ial d
e C
onta
s R
egio
nais
do
Bra
sil e
m: <
http
://w
ww
.ibge
.gov
.br/
hom
e/es
tatis
tica/
econ
omia
/con
tasr
egio
nais
/201
1/d
efau
lt.sh
tm>
Ace
sso
em 1
6 m
ai.
2014
.
(Con
clus
ão)
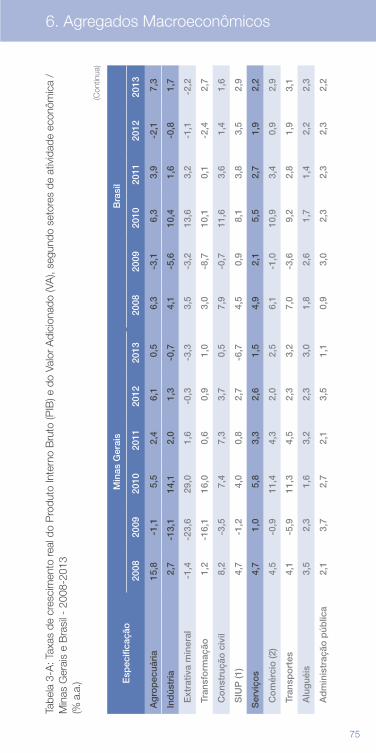
74 75
6. Agregados Macroeconômicos
Tabe
la 3
-A: T
axas
de
cres
cim
ento
real
do
Pro
duto
Inte
rno
Bru
to (P
IB) e
do
Valo
r A
dici
onad
o (V
A),
segu
ndo
seto
res
de a
tivid
ade
econ
ômic
a /
Min
as G
erai
s e
Bra
sil -
200
8-20
13
(% a
.a.) E
spec
ifica
ção
Min
as G
erai
sB
rasi
l
2008
2009
2010
2011
2012
2013
2008
2009
2010
2011
2012
2013
Ag
rop
ecuá
ria
15,8
-1,1
5,5
2,4
6,1
0,5
6,3
-3,1
6,3
3,9
-2,1
7,3
Ind
ústr
ia2,
7-1
3,1
14,1
2,0
1,3
-0,7
4,1
-5,6
10,4
1,6
-0,8
1,7
E
xtra
tiva
min
eral
-1,4
-23,
629
,01,
6-0
,3-3
,33,
5-3
,213
,63,
2-1
,1-2
,2
Tr
ansf
orm
ação
1,2
-16,
116
,00,
60,
91,
03,
0-8
,710
,10,
1-2
,42,
7
C
ons
truç
ão c
ivil
8,2
-3,5
7,4
7,3
3,7
0,5
7,9
-0,7
11,6
3,6
1,4
1,6
S
IUP
(1)
4,7
-1,2
4,0
0,8
2,7
-6,7
4,5
0,9
8,1
3,8
3,5
2,9
Ser
viço
s4,
71,
05,
83,
32,
61,
54,
92,
15,
52,
71,
92,
2
C
om
érci
o (2
)4,
5-0
,911
,44,
32,
02,
56,
1-1
,010
,93,
40,
92,
9
Tr
ansp
ort
es4,
1-5
,911
,34,
52,
33,
27,
0-3
,69,
22,
81,
93,
1
A
lug
uéis
3,5
2,3
1,6
3,2
2,3
3,0
1,8
2,6
1,7
1,4
2,2
2,3
A
dm
inis
traç
ão p
úblic
a2,
13,
72,
72,
13,
51,
10,
93,
02,
32,
32,
32,
2
(Con
tinua
)
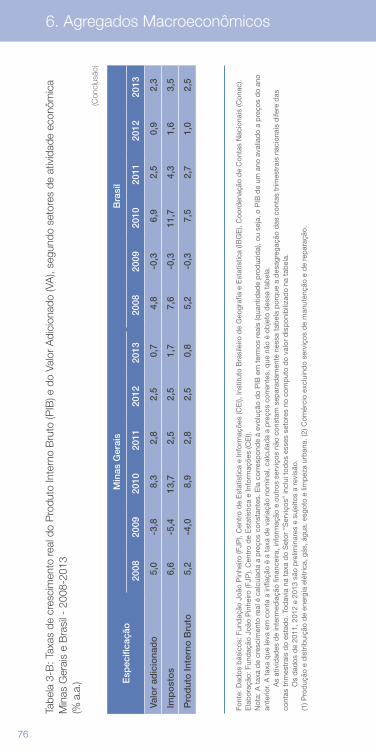
76 77
6. Agregados Macroeconômicos
Tabe
la 3
-B: T
axas
de
cres
cim
ento
real
do
Pro
duto
Inte
rno
Bru
to (P
IB) e
do
Valo
r A
dici
onad
o (V
A),
segu
ndo
seto
res
de a
tivid
ade
econ
ômic
aM
inas
Ger
ais
e B
rasi
l - 2
008-
2013
(%
a.a
.) Esp
ecifi
caçã
oM
inas
Ger
ais
Bra
sil
2008
2009
2010
2011
2012
2013
2008
2009
2010
2011
2012
2013
Val
or
adic
iona
do
5,0
-3,8
8,3
2,8
2,5
0,7
4,8
-0,3
6,9
2,5
0,9
2,3
Imp
ost
os
6,6
-5,4
13,7
2,5
2,5
1,7
7,6
-0,3
11,7
4,3
1,6
3,5
Pro
dut
o In
tern
o B
ruto
5,2
-4,0
8,9
2,8
2,5
0,8
5,2
-0,3
7,5
2,7
1,0
2,5
Font
e: D
ados
bás
icos
: Fun
daç
ão J
oão
Pin
heiro
(FJP
), C
entr
o d
e E
stat
ístic
a e
Info
rmaç
ões
(CE
I), In
stitu
to B
rasi
leiro
de
Geo
graf
ia e
Est
atís
tica
(IBG
E),
Coo
rden
ação
de
Con
tas
Nac
iona
is (C
onac
). E
lab
oraç
ão: F
und
ação
Joã
o P
inhe
iro (F
JP),
Cen
tro
de
Est
atís
tica
e In
form
açõe
s (C
EI).
N
ota:
A t
axa
de
cres
cim
ento
rea
l é c
alcu
lad
a a
pre
ços
cons
tant
es. E
la c
orre
spon
de
à ev
oluç
ão d
o P
IB e
m t
erm
os r
eais
(qua
ntid
ade
pro
duz
ida)
, ou
seja
, o P
IB d
e um
ano
ava
liad
o a
pre
ços
do
ano
ante
rior.
A t
axa
que
leva
em
con
ta a
infla
ção
é a
taxa
de
varia
ção
nom
inal
, cal
cula
da
a p
reço
s co
rren
tes,
que
não
é o
bje
to d
essa
tab
ela.
As
ativ
idad
es d
e in
term
edia
ção
finan
ceira
, inf
orm
ação
e o
utro
s se
rviç
os n
ão c
onst
am s
epar
adam
ente
nes
sa t
abel
a p
orq
ue a
des
agre
gaçã
o d
as c
onta
s tr
imes
trai
s na
cion
ais
dife
re d
as
cont
as t
rimes
trai
s d
o es
tad
o. T
odav
ia n
a ta
xa d
o S
etor
“S
ervi
ços”
incl
ui t
odos
ess
es s
etor
es n
o co
mp
uto
do
valo
r d
isp
onib
iliza
do
na t
abel
a.
O
s d
ados
de
2011
, 201
2 e
2013
são
pre
limin
ares
e s
ujei
tos
a re
visã
o.
(1) P
rod
ução
e d
istr
ibui
ção
de
ener
gia
elét
rica,
gás
, águ
a, e
sgot
o e
limp
eza
urb
ana.
(2) C
omér
cio
excl
uind
o se
rviç
os d
e m
anut
ençã
o e
de
rep
araç
ão.
(Con
clus
ão)
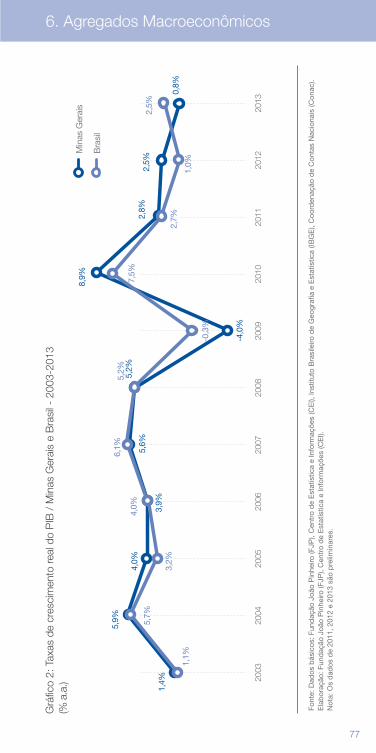
76 77
2003
2004
2005
2006
2007
2008
2009
2010
2011
2012
2013
6. Agregados Macroeconômicos
Font
e: D
ados
bás
icos
: Fun
daç
ão J
oão
Pin
heiro
(FJP
), C
entr
o d
e E
stat
ístic
a e
Info
rmaç
ões
(CE
I), In
stitu
to B
rasi
leiro
de
Geo
graf
ia e
Est
atís
tica
(IBG
E),
Coo
rden
ação
de
Con
tas
Nac
iona
is (C
onac
). E
lab
oraç
ão: F
und
ação
Joã
o P
inhe
iro (F
JP),
Cen
tro
de
Est
atís
tica
e In
form
açõe
s (C
EI).
N
ota:
A t
axa
de
cres
cim
ento
rea
l é c
alcu
lad
a a
pre
ços
cons
tant
es. E
la c
orre
spon
de
à ev
oluç
ão d
o P
IB e
m t
erm
os r
eais
(qua
ntid
ade
pro
duz
ida)
, ou
seja
, o P
IB d
e um
ano
ava
liad
o a
pre
ços
do
ano
ante
rior.
A t
axa
que
leva
em
con
ta a
infla
ção
é a
taxa
de
varia
ção
nom
inal
, cal
cula
da
a p
reço
s co
rren
tes,
que
não
é o
bje
to d
essa
tab
ela.
As
ativ
idad
es d
e in
term
edia
ção
finan
ceira
, inf
orm
ação
e o
utro
s se
rviç
os n
ão c
onst
am s
epar
adam
ente
nes
sa t
abel
a p
orq
ue a
des
agre
gaçã
o d
as c
onta
s tr
imes
trai
s na
cion
ais
dife
re d
as
cont
as t
rimes
trai
s d
o es
tad
o. T
odav
ia n
a ta
xa d
o S
etor
“S
ervi
ços”
incl
ui t
odos
ess
es s
etor
es n
o co
mp
uto
do
valo
r d
isp
onib
iliza
do
na t
abel
a.
O
s d
ados
de
2011
, 201
2 e
2013
são
pre
limin
ares
e s
ujei
tos
a re
visã
o.
(1) P
rod
ução
e d
istr
ibui
ção
de
ener
gia
elét
rica,
gás
, águ
a, e
sgot
o e
limp
eza
urb
ana.
(2) C
omér
cio
excl
uind
o se
rviç
os d
e m
anut
ençã
o e
de
rep
araç
ão.
Grá
fico
2: T
axas
de
cres
cim
ento
real
do
PIB
/ M
inas
Ger
ais
e B
rasi
l - 2
003-
2013
(%
a.a
.)
Font
e: D
ados
bás
icos
: Fun
daç
ão J
oão
Pin
heiro
(FJP
), C
entr
o d
e E
stat
ístic
a e
Info
rmaç
ões
(CE
I), In
stitu
to B
rasi
leiro
de
Geo
graf
ia e
Est
atís
tica
(IBG
E),
Coo
rden
ação
de
Con
tas
Nac
iona
is (C
onac
). E
lab
oraç
ão: F
und
ação
Joã
o P
inhe
iro (F
JP),
Cen
tro
de
Est
atís
tica
e In
form
açõe
s (C
EI).
N
ota:
Os
dad
os d
e 20
11, 2
012
e 20
13 s
ão p
relim
inar
es.
1,4%
5,9%
4,0%
3,9%
5,6%
-4,0
%
8,9%
2,8%
2,5%
0,8%
Min
as G
erai
s
Bra
sil
1,1%
5,7%
3,2%
4,0%
6,1%
5,2%
-0,3
%
7,5%
1,0%
2,5%
2,7%
5,2%
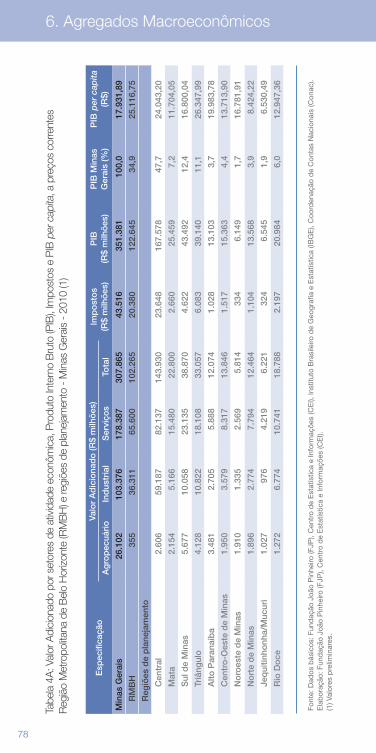
78 79
6. Agregados Macroeconômicos
Tabe
la 4
A: V
alor
Adi
cion
ado
por s
etor
es d
e at
ivid
ade
econ
ômic
a, P
rodu
to In
tern
o B
ruto
(PIB
), Im
post
os e
PIB
per
cap
ita, a
pre
ços
corre
ntes
Reg
ião
Met
ropo
litan
a de
Bel
o H
oriz
onte
(RM
BH
) e re
giõe
s de
pla
neja
men
to -
Min
as G
erai
s -
2010
(1)
Esp
ecifi
caçã
oVa
lor
Ad
icio
nad
o (R
$ m
ilhõ
es)
Imp
ost
os
(R$
milh
ões
)P
IB
(R$
milh
ões
)P
IB M
inas
G
erai
s (%
)P
IB p
er c
apita
(R
$)A
gro
pec
uári
oIn
dus
tria
lS
ervi
ços
Tota
l
Min
as G
erai
s26
.102
103.
376
178.
387
307.
865
43.5
1635
1.38
110
0,0
17.9
31,8
9
R
MB
H35
536
.311
65.6
0010
2.26
520
.380
122.
645
34,9
25.1
16,7
5
R
egiõ
es d
e p
lane
jam
ento
C
entr
al2.
606
59.1
8782
.137
143.
930
23.6
4816
7.57
847
,724
.043
,20
M
ata
2.15
45.
166
15.4
8022
.800
2.66
025
.459
7,2
11.7
04,0
5
S
ul d
e M
inas
5.67
710
.058
23.1
3538
.870
4.62
243
.492
12,4
16.8
00,0
4
Tr
iâng
ulo
4.12
810
.822
18.1
0833
.057
6.08
339
.140
11,1
26.3
47,9
9
A
lto P
aran
aíb
a3.
481
2.70
55.
888
12.0
741.
028
13.1
033,
719
.983
,78
C
entr
o-O
este
de
Min
as1.
950
3.57
98.
317
13.8
461.
517
15.3
634,
413
.713
,90
N
oro
este
de
Min
as1.
910
1.33
52.
569
5.81
433
46.
149
1,7
16.7
81,9
1
N
ort
e d
e M
inas
1.89
62.
774
7.79
412
.464
1.10
413
.568
3,9
8.42
4,22
Je
qui
tinho
nha/
Muc
uri
1.02
797
64.
219
6.22
132
46.
545
1,9
6.53
0,49
R
io D
oce
1.27
26.
774
10.7
4118
.788
2.19
720
.984
6,0
12.9
47,3
6
Font
e: D
ados
bás
icos
: Fun
daç
ão J
oão
Pin
heiro
(FJP
), C
entr
o d
e E
stat
ístic
a e
Info
rmaç
ões
(CE
I), In
stitu
to B
rasi
leiro
de
Geo
graf
ia e
Est
atís
tica
(IBG
E),
Coo
rden
ação
de
Con
tas
Nac
iona
is (C
onac
). E
lab
oraç
ão: F
und
ação
Joã
o P
inhe
iro (F
JP),
Cen
tro
de
Est
atís
tica
e In
form
açõe
s (C
EI).
(1
) Val
ores
pre
limin
ares
.

78 79
6. Agregados Macroeconômicos
Tabe
la 4
B: V
alor
Adi
cion
ado
por s
etor
es d
e at
ivid
ade
econ
ômic
a, P
rodu
to In
tern
o B
ruto
(PIB
), Im
post
os e
PIB
per
cap
ita, a
pre
ços
corre
ntes
Reg
ião
Met
ropo
litan
a de
Bel
o H
oriz
onte
(RM
BH
) e re
giõe
s de
pla
neja
men
to -
Min
as G
erai
s -
2011
(1)
Esp
ecifi
caçã
oVa
lor
Ad
icio
nad
o (R
$ m
ilhõ
es)
Imp
ost
os
(R$
milh
ões
)P
IB
(R$
milh
ões
)P
IB M
inas
G
erai
s (%
)P
IB p
er c
apita
(R
$)A
gro
pec
uári
oIn
dus
tria
lS
ervi
ços
Tota
l
Min
as G
erai
s31
.092
111.
348
196.
982
339.
423
46.7
3338
6.15
610
0,0
19.5
73,2
9
R
MB
H32
937
.691
70.3
9210
8.41
221
.525
129.
937
33,6
26.3
86,5
6
R
egiõ
es d
e p
lane
jam
ento
C
entr
al2.
624
64.7
1289
.066
156.
402
25.0
0718
1.40
847
,025
.825
,97
M
ata
2.89
65.
558
17.2
6125
.715
3.13
528
.851
7,5
13.2
07,5
6
S
ul d
e M
inas
6.65
011
.070
26.2
2343
.943
5.22
449
.167
12,7
18.8
81,4
8
Tr
iâng
ulo
5.40
410
.722
20.0
1236
.138
6.33
242
.470
11,0
28.2
15,4
2
A
lto P
aran
aíb
a4.
077
3.11
56.
705
13.8
971.
199
15.0
963,
922
.859
,46
C
entr
o-O
este
de
Min
as2.
270
4.07
89.
611
15.9
581.
785
17.7
444,
615
.697
,09
N
oro
este
de
Min
as2.
547
1.55
03.
012
7.10
938
17.
491
1,9
20.3
07,0
9
N
ort
e d
e M
inas
2.00
83.
080
8.73
613
.824
1.20
015
.024
3,9
9.27
6,98
Je
qui
tinho
nha/
Muc
uri
1.17
61.
075
4.69
26.
943
342
7.28
51,
97.
255,
52
R
io D
oce
1.43
96.
389
11.6
6519
.493
2.12
721
.620
5,6
13.2
82,8
6
Font
e: D
ados
bás
icos
: Fun
daç
ão J
oão
Pin
heiro
(FJP
), C
entr
o d
e E
stat
ístic
a e
Info
rmaç
ões
(CE
I), In
stitu
to B
rasi
leiro
de
Geo
graf
ia e
Est
atís
tica
(IBG
E),
Coo
rden
ação
de
Con
tas
Nac
iona
is (C
onac
). E
lab
oraç
ão: F
und
ação
Joã
o P
inhe
iro (F
JP),
Cen
tro
de
Est
atís
tica
e In
form
açõe
s (C
EI).
(1
) Val
ores
pre
limin
ares
.
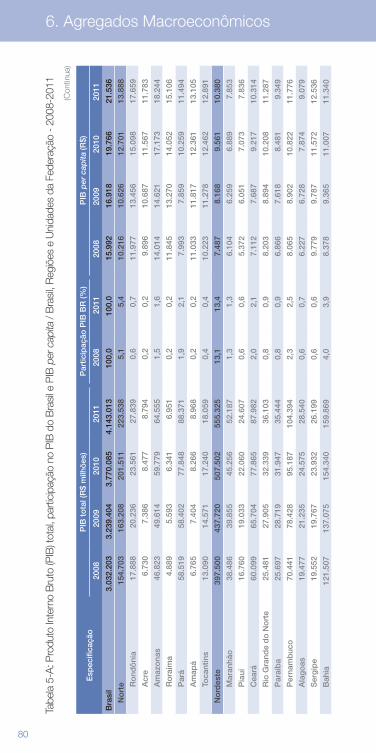
80 81
6. Agregados Macroeconômicos
Tabe
la 5
-A: P
rodu
to In
tern
o B
ruto
(PIB
) tot
al, p
artic
ipaç
ão n
o P
IB d
o B
rasi
l e P
IB p
er c
apita
/ B
rasi
l, R
egiõ
es e
Uni
dade
s da
Fed
eraç
ão -
200
8-20
11
Esp
ecifi
caçã
oP
IB t
ota
l (R
$ m
ilhõ
es)
Par
ticip
ação
PIB
BR
(%)
PIB
per
cap
ita (R
$)
2008
2009
2010
2011
2008
2011
2008
2009
2010
2011
Bra
sil
3.03
2.20
33.
239.
404
3.77
0.08
54.
143.
013
100,
010
0,0
15.9
9216
.918
19.7
6621
.536
N
ort
e15
4.70
316
3.20
820
1.51
122
3.53
85,
15,
410
.216
10.6
2612
.701
13.8
88
R
ond
ôni
a17
.888
20.2
3623
.561
27.8
390,
60,
711
.977
13.4
5615
.098
17.6
59
A
cre
6.73
07.
386
8.47
78.
794
0,2
0,2
9.89
610
.687
11.5
6711
.783
A
maz
ona
s46
.823
49.6
1459
.779
64.5
551,
51,
614
.014
14.6
2117
.173
18.2
44
R
ora
ima
4.88
95.
593
6.34
16.
951
0,2
0,2
11.8
4513
.270
14.0
5215
.106
P
ará
58.5
1958
.402
77.8
4888
.371
1,9
2,1
7.99
37.
859
10.2
5911
.494
A
map
á6.
765
7.40
48.
266
8.96
80,
20,
211
.033
11.8
1712
.361
13.1
05
To
cant
ins
13.0
9014
.571
17.2
4018
.059
0,4
0,4
10.2
2311
.278
12.4
6212
.891
N
ord
este
397.
500
437.
720
507.
502
555.
325
13,1
13,4
7.48
78.
168
9.56
110
.380
M
aran
hão
38.4
8639
.855
45.2
5652
.187
1,3
1,3
6.10
46.
259
6.88
97.
853
P
iauí
16.7
6019
.033
22.0
6024
.607
0,6
0,6
5.37
26.
051
7.07
37.
836
C
eará
60.0
9965
.704
77.8
6587
.982
2,0
2,1
7.11
27.
687
9.21
710
.314
R
io G
rand
e d
o N
ort
e25
.481
27.9
0532
.339
36.1
030,
80,
98.
203
8.89
410
.208
11.2
87
P
araí
ba
25.6
9728
.719
31.9
4735
.444
0,8
0,9
6.86
67.
618
8.48
19.
349
P
erna
mb
uco
70.4
4178
.428
95.1
8710
4.39
42,
32,
58.
065
8.90
210
.822
11.7
76
A
lag
oas
19.4
7721
.235
24.5
7528
.540
0,6
0,7
6.22
76.
728
7.87
49.
079
S
erg
ipe
19.5
5219
.767
23.9
3226
.199
0,6
0,6
9.77
99.
787
11.5
7212
.536
B
ahia
121.
507
137.
075
154.
340
159.
869
4,0
3,9
8.37
89.
365
11.0
0711
.340
(Con
tinua
)
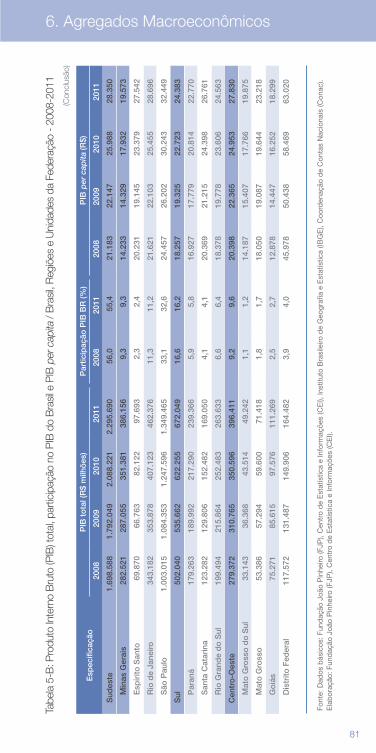
80 81
6. Agregados Macroeconômicos
Tabe
la 5
-B: P
rodu
to In
tern
o B
ruto
(PIB
) tot
al, p
artic
ipaç
ão n
o P
IB d
o B
rasi
l e P
IB p
er c
apita
/ B
rasi
l, R
egiõ
es e
Uni
dade
s da
Fed
eraç
ão -
200
8-20
11
Esp
ecifi
caçã
oP
IB t
ota
l (R
$ m
ilhõ
es)
Par
ticip
ação
PIB
BR
(%)
PIB
per
cap
ita (R
$)
2008
2009
2010
2011
2008
2011
2008
2009
2010
2011
S
udes
te1.
698.
588
1.79
2.04
92.
088.
221
2.29
5.69
056
,055
,421
.183
22.1
4725
.988
28.3
50
Min
as G
erai
s28
2.52
128
7.05
535
1.38
138
6.15
69,
39,
314
.233
14.3
2917
.932
19.5
73
Esp
írito
San
to69
.870
66.7
6382
.122
97.6
932,
32,
420
.231
19.1
4523
.379
27.5
42
Rio
de
Jane
iro34
3.18
235
3.87
840
7.12
346
2.37
611
,311
,221
.621
22.1
0325
.455
28.6
96
São
Pau
lo1.
003.
015
1.08
4.35
31.
247.
596
1.34
9.46
533
,132
,624
.457
26.2
0230
.243
32.4
49
S
ul50
2.04
053
5.66
262
2.25
567
2.04
916
,616
,218
.257
19.3
2522
.723
24.3
83
Par
aná
179.
263
189.
992
217.
290
239.
366
5,9
5,8
16.9
2717
.779
20.8
1422
.770
San
ta C
atar
ina
123.
282
129.
806
152.
482
169.
050
4,1
4,1
20.3
6921
.215
24.3
9826
.761
Rio
Gra
nde
do
Sul
199.
494
215.
864
252.
483
263.
633
6,6
6,4
18.3
7819
.778
23.6
0624
.563
C
entr
o-O
este
279.
372
310.
765
350.
596
396.
411
9,2
9,6
20.3
9822
.365
24.9
5327
.830
Mat
o G
ross
o d
o S
ul33
.143
36.3
6843
.514
49.2
421,
11,
214
.187
15.4
0717
.766
19.8
75
Mat
o G
ross
o53
.386
57.2
9459
.600
71.4
181,
81,
718
.050
19.0
8719
.644
23.2
18
Go
iás
75.2
7185
.615
97.5
7611
1.26
92,
52,
712
.878
14.4
4716
.252
18.2
99
Dis
trito
Fed
eral
117.
572
131.
487
149.
906
164.
482
3,9
4,0
45.9
7850
.438
58.4
8963
.020
Font
e: D
ados
bás
icos
: Fun
daç
ão J
oão
Pin
heiro
(FJP
), C
entr
o d
e E
stat
ístic
a e
Info
rmaç
ões
(CE
I), In
stitu
to B
rasi
leiro
de
Geo
graf
ia e
Est
atís
tica
(IBG
E),
Coo
rden
ação
de
Con
tas
Nac
iona
is (C
onac
). E
lab
oraç
ão: F
und
ação
Joã
o P
inhe
iro (F
JP),
Cen
tro
de
Est
atís
tica
e In
form
açõe
s (C
EI).
(Con
clus
ão)
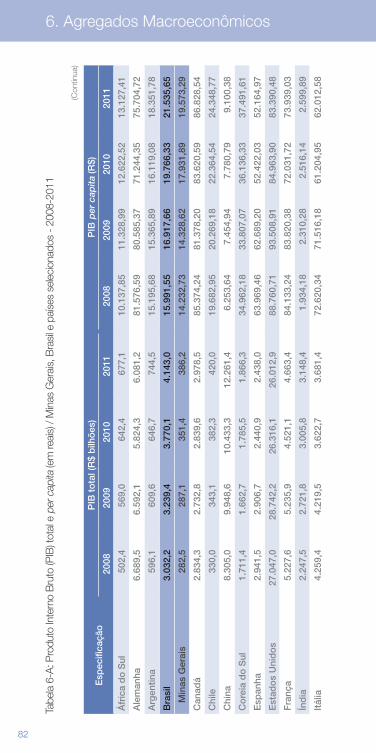
82 83
6. Agregados Macroeconômicos
Tabe
la 6
-A: P
rodu
to In
tern
o B
ruto
(PIB
) tot
al e
per
cap
ita (e
m re
ais)
/ M
inas
Ger
ais,
Bra
sil e
paí
ses
sele
cion
ados
- 2
008-
2011
Esp
ecifi
caçã
oP
IB t
ota
l (R
$ b
ilhõ
es)
PIB
per
cap
ita (R
$)
2008
2009
2010
2011
2008
2009
2010
2011
Áfr
ica
do
Sul
502,
456
9,0
642,
467
7,1
10.1
37,8
511
.328
,99
12.6
22,5
213
.127
,41
Ale
man
ha6.
689,
56.
592,
15.
824,
36.
081,
281
.576
,59
80.5
85,3
771
.244
,35
75.7
04,7
2
Arg
entin
a 59
6,1
609,
664
6,7
744,
515
.195
,68
15.3
65,8
916
.119
,08
18.3
51,7
8
Bra
sil
3.03
2,2
3.23
9,4
3.77
0,1
4.14
3,0
15.9
91,5
516
.917
,66
19.7
66,3
321
.535
,65
M
inas
Ger
ais
282,
528
7,1
351,
438
6,2
14.2
32,7
314
.328
,62
17.9
31,8
919
.573
,29
Can
adá
2.83
4,3
2.73
2,8
2.83
9,6
2.97
8,5
85.3
74,2
481
.378
,20
83.6
20,5
986
.828
,54
Chi
le
330,
034
3,1
382,
342
0,0
19.6
82,9
520
.269
,18
22.3
64,5
424
.348
,77
Chi
na8.
305,
09.
948,
610
.433
,312
.261
,46.
253,
647.
454,
947.
780,
799.
100,
38
Co
reia
do
Sul
1.71
1,4
1.66
2,7
1.78
5,5
1.86
6,3
34.9
62,1
833
.807
,07
36.1
36,3
337
.491
,61
Esp
anha
2.94
1,5
2.90
6,7
2.44
0,9
2.43
8,0
63.9
69,4
662
.689
,20
52.4
22,0
352
.164
,97
Est
ado
s U
nid
os
27.0
47,0
28.7
42,2
26.3
16,1
26.0
12,9
88.7
60,7
193
.508
,91
84.9
63,9
083
.390
,48
Fra
nça
5.22
7,6
5.23
5,9
4.52
1,1
4.66
3,4
84.1
33,2
483
.820
,38
72.0
31,7
273
.939
,03
Índ
ia2.
247,
52.
721,
83.
005,
83.
148,
41.
934,
182.
310,
282.
516,
142.
599,
89
Itál
ia4.
259,
44.
219,
53.
622,
73.
681,
472
.620
,34
71.5
16,1
861
.204
,95
62.0
12,5
8
(Con
tinua
)
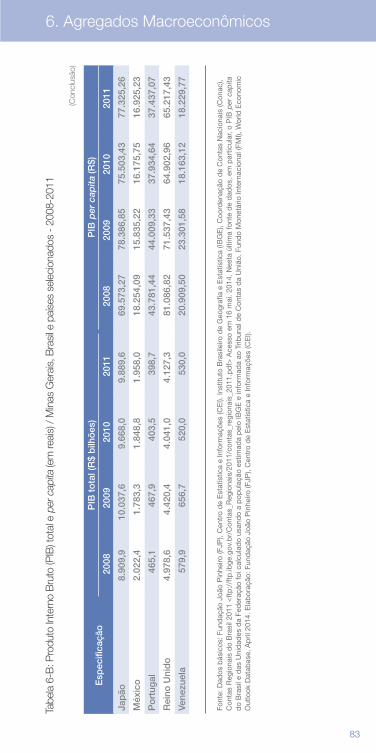
82 83
6. Agregados Macroeconômicos
Tabe
la 6
-B: P
rodu
to In
tern
o B
ruto
(PIB
) tot
al e
per
cap
ita (e
m re
ais)
/ M
inas
Ger
ais,
Bra
sil e
paí
ses
sele
cion
ados
- 2
008-
2011
Esp
ecifi
caçã
oP
IB t
ota
l (R
$ b
ilhõ
es)
PIB
per
cap
ita (R
$)
2008
2009
2010
2011
2008
2009
2010
2011
Jap
ão8.
909,
910
.037
,69.
668,
09.
889,
669
.573
,27
78.3
86,8
575
.503
,43
77.3
25,2
6
Méx
ico
2.02
2,4
1.78
3,3
1.84
8,8
1.95
8,0
18.2
54,0
915
.835
,22
16.1
75,7
516
.925
,23
Po
rtug
al46
5,1
467,
940
3,5
398,
743
.781
,44
44.0
09,3
337
.934
,64
37.4
37,0
7
Rei
no U
nid
o4.
978,
64.
420,
44.
041,
04.
127,
381
.086
,82
71.5
37,4
364
.902
,96
65.2
17,4
3
Vene
zuel
a57
9,9
656,
752
0,0
530,
020
.909
,50
23.3
01,5
818
.163
,12
18.2
29,7
7
Font
e: D
ados
bás
icos
: Fun
daç
ão J
oão
Pin
heiro
(FJP
), C
entr
o d
e E
stat
ístic
a e
Info
rmaç
ões
(CE
I). In
stitu
to B
rasi
leiro
de
Geo
graf
ia e
Est
atís
tica
(IBG
E),
Coo
rden
ação
de
Con
tas
Nac
iona
is (C
onac
), C
onta
s R
egio
nais
do
Bra
sil 2
011
<ft
p:/
/ftp
.ibge
.gov
.br/
Con
tas_
Reg
iona
is/2
011/
cont
as_r
egio
nais
_201
1.p
df>
Ace
sso
em 1
6 m
ai. 2
014.
Nes
ta ú
ltim
a fo
nte
de
dad
os, e
m p
artic
ular
, o P
IB p
er c
apita
d
o B
rasi
l e d
as U
nid
ades
da
Fed
eraç
ão fo
i cal
cula
do
usan
do
a p
opul
ação
est
imad
a p
elo
IBG
E e
info
rmad
a ao
Trib
unal
de
Con
tas
da
Uni
ão. F
und
o M
onet
ário
Inte
rnac
iona
l (FM
I), W
orld
Eco
nom
ic
Out
look
Dat
abas
e, A
pril
201
4. E
lab
oraç
ão: F
und
ação
Joã
o P
inhe
iro (F
JP),
Cen
tro
de
Est
atís
tica
e In
form
açõe
s (C
EI).
(Con
clus
ão)
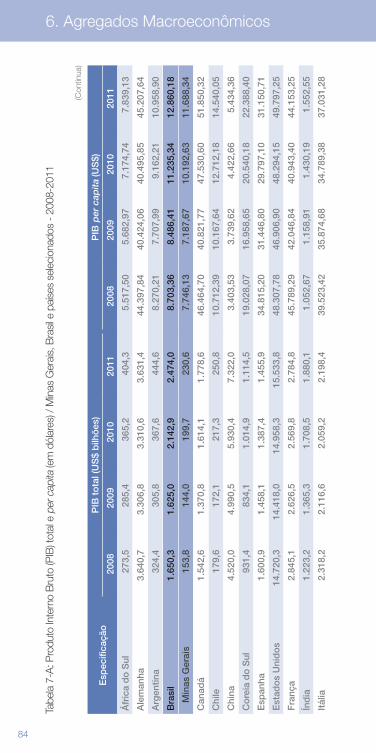
84 85
6. Agregados Macroeconômicos
Tabe
la 7
-A: P
rodu
to In
tern
o B
ruto
(PIB
) tot
al e
per
cap
ita (e
m d
ólar
es) /
Min
as G
erai
s, B
rasi
l e p
aíse
s se
leci
onad
os -
200
8-20
11
Esp
ecifi
caçã
oP
IB t
ota
l (U
S$
bilh
ões
)P
IB p
er c
apita
(US
$)
2008
2009
2010
2011
2008
2009
2010
2011
Áfr
ica
do
Sul
273,
528
5,4
365,
240
4,3
5.51
7,50
5.68
2,97
7.17
4,74
7.83
9,13
Ale
man
ha3.
640,
73.
306,
83.
310,
63.
631,
444
.397
,84
40.4
24,0
640
.495
,85
45.2
07,6
4
Arg
entin
a 32
4,4
305,
836
7,6
444,
68.
270,
217.
707,
999.
162,
2110
.958
,90
Bra
sil
1.65
0,3
1.62
5,0
2.14
2,9
2.47
4,0
8.70
3,36
8.48
6,41
11.2
35,3
412
.860
,18
M
inas
Ger
ais
153,
814
4,0
199,
723
0,6
7.74
6,13
7.18
7,67
10.1
92,6
311
.688
,34
Can
adá
1.54
2,6
1.37
0,8
1.61
4,1
1.77
8,6
46.4
64,7
040
.821
,77
47.5
30,6
051
.850
,32
Chi
le
179,
617
2,1
217,
325
0,8
10.7
12,3
910
.167
,64
12.7
12,1
814
.540
,05
Chi
na4.
520,
04.
990,
55.
930,
47.
322,
03.
403,
533.
739,
624.
422,
665.
434,
36
Co
reia
do
Sul
931,
483
4,1
1.01
4,9
1.11
4,5
19.0
28,0
716
.958
,65
20.5
40,1
822
.388
,40
Esp
anha
1.60
0,9
1.45
8,1
1.38
7,4
1.45
5,9
34.8
15,2
031
.446
,80
29.7
97,1
031
.150
,71
Est
ado
s U
nid
os
14.7
20,3
14.4
18,0
14.9
58,3
15.5
33,8
48.3
07,7
846
.906
,90
48.2
94,1
549
.797
,25
Fra
nça
2.84
5,1
2.62
6,5
2.56
9,8
2.78
4,8
45.7
89,2
942
.046
,84
40.9
43,4
044
.153
,25
Índ
ia1.
223,
21.
365,
31.
708,
51.
880,
11.
052,
671.
158,
911.
430,
191.
552,
55
Itál
ia2.
318,
22.
116,
62.
059,
22.
198,
439
.523
,42
35.8
74,6
834
.789
,38
37.0
31,2
8
(Con
tinua
)

84 85
6. Agregados Macroeconômicos
Tabe
la 7
-B: P
rodu
to In
tern
o B
ruto
(PIB
) tot
al e
per
cap
ita (e
m d
ólar
es) /
Min
as G
erai
s, B
rasi
l e p
aíse
s se
leci
onad
os -
200
8-20
11
Esp
ecifi
caçã
oP
IB t
ota
l (U
S$
bilh
ões
)P
IB p
er c
apita
(US
$)
2008
2009
2010
2011
2008
2009
2010
2011
Áfr
ica
do
Sul
273,
528
5,4
365,
240
4,3
5.51
7,50
5.68
2,97
7.17
4,74
7.83
9,13
Ale
man
ha3.
640,
73.
306,
83.
310,
63.
631,
444
.397
,84
40.4
24,0
640
.495
,85
45.2
07,6
4
Arg
entin
a 32
4,4
305,
836
7,6
444,
68.
270,
217.
707,
999.
162,
2110
.958
,90
Bra
sil
1.65
0,3
1.62
5,0
2.14
2,9
2.47
4,0
8.70
3,36
8.48
6,41
11.2
35,3
412
.860
,18
M
inas
Ger
ais
153,
814
4,0
199,
723
0,6
7.74
6,13
7.18
7,67
10.1
92,6
311
.688
,34
Can
adá
1.54
2,6
1.37
0,8
1.61
4,1
1.77
8,6
46.4
64,7
040
.821
,77
47.5
30,6
051
.850
,32
Chi
le
179,
617
2,1
217,
325
0,8
10.7
12,3
910
.167
,64
12.7
12,1
814
.540
,05
Chi
na4.
520,
04.
990,
55.
930,
47.
322,
03.
403,
533.
739,
624.
422,
665.
434,
36
Co
reia
do
Sul
931,
483
4,1
1.01
4,9
1.11
4,5
19.0
28,0
716
.958
,65
20.5
40,1
822
.388
,40
Esp
anha
1.60
0,9
1.45
8,1
1.38
7,4
1.45
5,9
34.8
15,2
031
.446
,80
29.7
97,1
031
.150
,71
Est
ado
s U
nid
os
14.7
20,3
14.4
18,0
14.9
58,3
15.5
33,8
48.3
07,7
846
.906
,90
48.2
94,1
549
.797
,25
Fra
nça
2.84
5,1
2.62
6,5
2.56
9,8
2.78
4,8
45.7
89,2
942
.046
,84
40.9
43,4
044
.153
,25
Índ
ia1.
223,
21.
365,
31.
708,
51.
880,
11.
052,
671.
158,
911.
430,
191.
552,
55
Itál
ia2.
318,
22.
116,
62.
059,
22.
198,
439
.523
,42
35.8
74,6
834
.789
,38
37.0
31,2
8
Esp
ecifi
caçã
oP
IB t
ota
l (U
S$
bilh
ões
)P
IB p
er c
apita
(US
$)
2008
2009
2010
2011
2008
2009
2010
2011
Jap
ão4.
849,
25.
035,
15.
495,
45.
905,
637
.865
,07
39.3
21,2
242
.916
,74
46.1
75,3
6
Méx
ico
1.10
0,7
894,
51.
050,
81.
169,
29.
934,
747.
943,
439.
194,
4310
.107
,03
Po
rtug
al25
3,1
234,
722
9,4
238,
123
.827
,93
22.0
76,4
121
.562
,35
22.3
55,8
3
Rei
no U
nid
o2.
709,
62.
217,
42.
296,
92.
464,
644
.131
,29
35.8
85,3
436
.891
,36
38.9
45,0
8
Vene
zuel
a31
5,6
329,
429
5,6
316,
511
.379
,94
11.6
88,7
810
.324
,06
10.8
86,0
5
Font
e: D
ados
bás
icos
: Fun
daç
ão J
oão
Pin
heiro
(FJP
), C
entr
o d
e E
stat
ístic
a e
Info
rmaç
ões
(CE
I), In
stitu
to B
rasi
leiro
de
Geo
graf
ia e
Est
atís
tica
(IBG
E),
Coo
rden
ação
de
Con
tas
Nac
iona
is (C
onac
), C
onta
s R
egio
nais
do
Bra
sil 2
011
<ft
p:/
/ftp
.ibge
.gov
.br/
Con
tas_
Reg
iona
is/2
011/
cont
as_r
egio
nais
_201
1.p
df>
Ace
sso
em 1
6 m
ai. 2
014.
Fun
do
Mon
etár
io In
tern
acio
nal (
FMI),
Wor
ld E
cono
mic
Out
look
D
atab
ase,
Ap
ril 2
014.
Ela
bor
ação
: Fun
daç
ão J
oão
Pin
heiro
(FJP
), C
entr
o d
e E
stat
ístic
a e
Info
rmaç
ões
(CE
I).
Not
a: V
alor
es e
m d
ólar
es c
orre
ntes
par
a to
dos
os
paí
ses
(exc
eto
Bra
sil)
obtid
os d
ireta
men
te d
o sí
tio d
o Fu
ndo
Mon
etár
io In
tern
acio
nal.
(<ht
tp:/
/ww
w.im
f.org
/ext
erna
l/pub
s/ft
/weo
/201
4/01
/w
eod
ata/
ind
ex.a
spx>
Ace
sso
em 1
6 m
ai. 2
014)
. Val
ores
em
dól
ares
cor
rent
es p
ara
o B
rasi
l e p
ara
o es
tad
o d
e M
inas
Ger
ais
calc
ulad
os a
par
tir d
os v
alor
es e
m m
oed
a na
cion
al, c
onve
rtid
os p
elas
m
édia
s an
uais
da
cota
ção
diá
ria (d
ias
útei
s) d
a ta
xa d
e câ
mb
io: R
$ 1,
8374
/US
$1 (2
008)
, R$
1,99
35/U
S$1
(200
9), R
$ 1,
7593
/US
$1 (2
010)
, e R
$ 1,
6746
/US
$1 (2
011)
.
(Con
clus
ão)
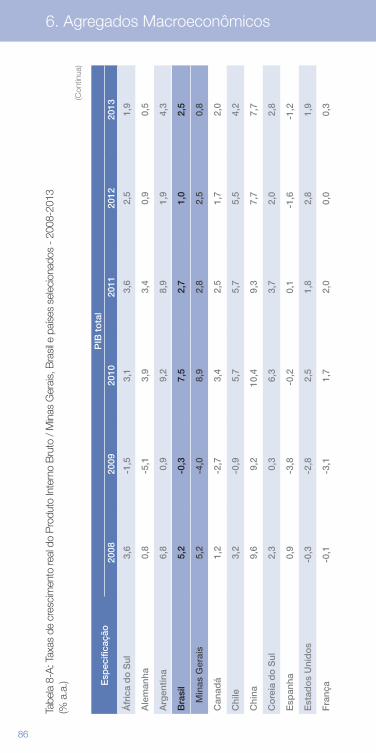
86 87
6. Agregados Macroeconômicos
Tabe
la 8
-A: T
axas
de
cres
cim
ento
real
do
Pro
duto
Inte
rno
Bru
to /
Min
as G
erai
s, B
rasi
l e p
aíse
s se
leci
onad
os -
200
8-20
13
(% a
.a.) E
spec
ifica
ção
PIB
to
tal
2008
2009
2010
2011
2012
2013
Áfr
ica
do
Sul
3,6
-1,5
3,1
3,6
2,5
1,9
Ale
man
ha0,
8-5
,13,
93,
40,
90,
5
Arg
entin
a 6,
80,
99,
28,
91,
94,
3
Bra
sil
5,2
-0,3
7,5
2,7
1,0
2,5
M
inas
Ger
ais
5,2
-4,0
8,9
2,8
2,5
0,8
Can
adá
1,2
-2,7
3,4
2,5
1,7
2,0
Chi
le
3,2
-0,9
5,7
5,7
5,5
4,2
Chi
na9,
69,
210
,49,
37,
77,
7
Co
reia
do
Sul
2,3
0,3
6,3
3,7
2,0
2,8
Esp
anha
0,9
-3,8
-0,2
0,1
-1,6
-1,2
Est
ado
s U
nid
os
-0,3
-2,8
2,5
1,8
2,8
1,9
Fra
nça
-0,1
-3,1
1,7
2,0
0,0
0,3
(Con
tinua
)
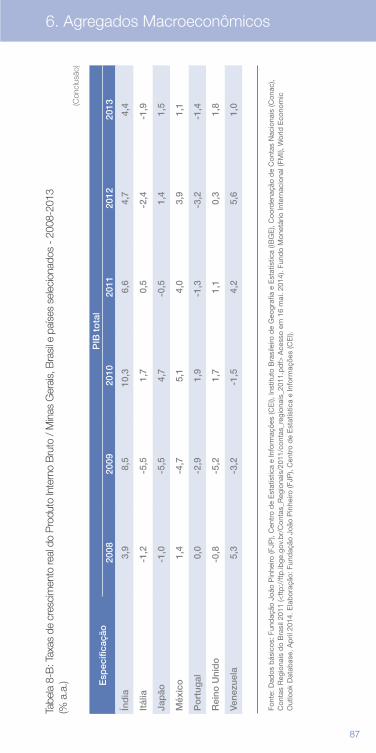
86 87
6. Agregados Macroeconômicos
Tabe
la 8
-B: T
axas
de
cres
cim
ento
real
do
Pro
duto
Inte
rno
Bru
to /
Min
as G
erai
s, B
rasi
l e p
aíse
s se
leci
onad
os -
200
8-20
13
(% a
.a.)E
spec
ifica
ção
PIB
to
tal
2008
2009
2010
2011
2012
2013
Áfr
ica
do
Sul
3,6
-1,5
3,1
3,6
2,5
1,9
Ale
man
ha0,
8-5
,13,
93,
40,
90,
5
Arg
entin
a 6,
80,
99,
28,
91,
94,
3
Bra
sil
5,2
-0,3
7,5
2,7
1,0
2,5
M
inas
Ger
ais
5,2
-4,0
8,9
2,8
2,5
0,8
Can
adá
1,2
-2,7
3,4
2,5
1,7
2,0
Chi
le
3,2
-0,9
5,7
5,7
5,5
4,2
Chi
na9,
69,
210
,49,
37,
77,
7
Co
reia
do
Sul
2,3
0,3
6,3
3,7
2,0
2,8
Esp
anha
0,9
-3,8
-0,2
0,1
-1,6
-1,2
Est
ado
s U
nid
os
-0,3
-2,8
2,5
1,8
2,8
1,9
Fra
nça
-0,1
-3,1
1,7
2,0
0,0
0,3
Esp
ecifi
caçã
oP
IB t
ota
l20
0820
0920
1020
1120
1220
13
Índ
ia3,
98,
510
,36,
64,
74,
4
Itál
ia-1
,2-5
,51,
70,
5-2
,4-1
,9
Jap
ão-1
,0-5
,54,
7-0
,51,
41,
5
Méx
ico
1,4
-4,7
5,1
4,0
3,9
1,1
Po
rtug
al0,
0-2
,91,
9-1
,3-3
,2-1
,4
Rei
no U
nid
o-0
,8-5
,21,
71,
10,
31,
8
Vene
zuel
a5,
3-3
,2-1
,54,
25,
61,
0(Con
clus
ão)
Font
e: D
ados
bás
icos
: Fun
daç
ão J
oão
Pin
heiro
(FJP
), C
entr
o d
e E
stat
ístic
a e
Info
rmaç
ões
(CE
I), In
stitu
to B
rasi
leiro
de
Geo
graf
ia e
Est
atís
tica
(IBG
E),
Coo
rden
ação
de
Con
tas
Nac
iona
is (C
onac
), C
onta
s R
egio
nais
do
Bra
sil 2
011
(<ft
p:/
/ftp
.ibge
.gov
.br/
Con
tas_
Reg
iona
is/2
011/
cont
as_r
egio
nais
_201
1.p
df>
Ace
sso
em 1
6 m
ai. 2
014)
. Fun
do
Mon
etár
io In
tern
acio
nal (
FMI),
Wor
ld E
cono
mic
O
utlo
ok D
atab
ase,
Ap
ril 2
014.
Ela
bor
ação
: Fun
daç
ão J
oão
Pin
heiro
(FJP
), C
entr
o d
e E
stat
ístic
a e
Info
rmaç
ões
(CE
I).
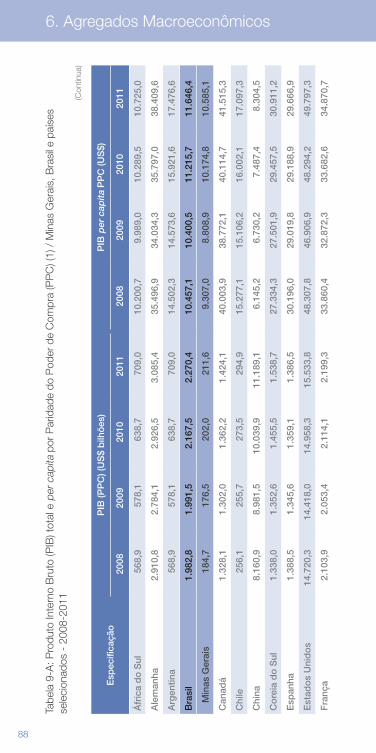
88 89
6. Agregados Macroeconômicos
Tabe
la 9
-A: P
rodu
to In
tern
o B
ruto
(PIB
) tot
al e
per
cap
ita p
or P
arid
ade
do P
oder
de
Com
pra
(PP
C) (
1) /
Min
as G
erai
s, B
rasi
l e p
aíse
s se
leci
onad
os -
200
8-20
11
Esp
ecifi
caçã
oP
IB (P
PC
) (U
S$
bilh
ões
)P
IB p
er c
apita
PP
C (U
S$)
2008
2009
2010
2011
2008
2009
2010
2011
Áfr
ica
do
Sul
568,
957
8,1
638,
770
9,0
10.2
00,7
9.98
9,0
10.2
89,5
10.7
25,0
Ale
man
ha2.
910,
82.
784,
12.
926,
53.
085,
435
.496
,934
.034
,335
.797
,038
.409
,6
Arg
entin
a 56
8,9
578,
163
8,7
709,
014
.502
,314
.573
,615
.921
,617
.476
,6
Bra
sil
1.98
2,8
1.99
1,5
2.16
7,5
2.27
0,4
10.4
57,1
10.4
00,5
11.2
15,7
11.6
46,4
M
inas
Ger
ais
184,
717
6,5
202,
021
1,6
9.30
7,0
8.80
8,9
10.1
74,8
10.5
85,1
Can
adá
1.32
8,1
1.30
2,0
1.36
2,2
1.42
4,1
40.0
03,9
38.7
72,1
40.1
14,7
41.5
15,3
Chi
le
256,
125
5,7
273,
529
4,9
15.2
77,1
15.1
06,2
16.0
02,1
17.0
97,3
Chi
na8.
160,
98.
981,
510
.039
,911
.189
,16.
145,
26.
730,
27.
487,
48.
304,
5
Co
reia
do
Sul
1.33
8,0
1.35
2,6
1.45
5,5
1.53
8,7
27.3
34,3
27.5
01,9
29.4
57,5
30.9
11,2
Esp
anha
1.38
8,5
1.34
5,6
1.35
9,1
1.38
6,5
30.1
96,0
29.0
19,8
29.1
88,9
29.6
66,9
Est
ado
s U
nid
os
14.7
20,3
14.4
18,0
14.9
58,3
15.5
33,8
48.3
07,8
46.9
06,9
48.2
94,2
49.7
97,3
Fra
nça
2.10
3,9
2.05
3,4
2.11
4,1
2.19
9,3
33.8
60,4
32.8
72,3
33.6
82,6
34.8
70,7
(Con
tinua
)
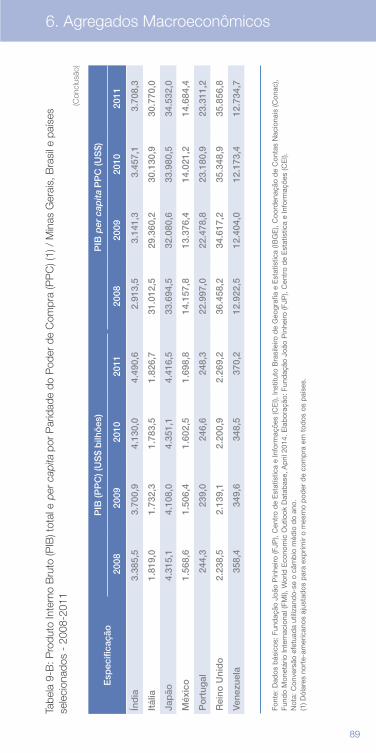
88 89
6. Agregados Macroeconômicos
Tabe
la 9
-B: P
rodu
to In
tern
o B
ruto
(PIB
) tot
al e
per
cap
ita p
or P
arid
ade
do P
oder
de
Com
pra
(PP
C) (
1) /
Min
as G
erai
s, B
rasi
l e p
aíse
s se
leci
onad
os -
200
8-20
11
Esp
ecifi
caçã
oP
IB (P
PC
) (U
S$
bilh
ões
)P
IB p
er c
apita
PP
C (U
S$)
2008
2009
2010
2011
2008
2009
2010
2011
Índ
ia3.
385,
53.
700,
94.
130,
04.
490,
62.
913,
53.
141,
33.
457,
13.
708,
3
Itál
ia1.
819,
01.
732,
31.
783,
51.
826,
731
.012
,529
.360
,230
.130
,930
.770
,0
Jap
ão4.
315,
14.
108,
04.
351,
14.
416,
533
.694
,532
.080
,633
.980
,534
.532
,0
Méx
ico
1.56
8,6
1.50
6,4
1.60
2,5
1.69
8,8
14.1
57,8
13.3
76,4
14.0
21,2
14.6
84,4
Po
rtug
al24
4,3
239,
024
6,6
248,
322
.997
,022
.478
,823
.180
,923
.311
,2
Rei
no U
nid
o2.
238,
52.
139,
12.
200,
92.
269,
236
.458
,234
.617
,235
.348
,935
.856
,8
Vene
zuel
a35
8,4
349,
634
8,5
370,
212
.922
,512
.404
,012
.173
,412
.734
,7
(Con
clus
ão)
Font
e: D
ados
bás
icos
: Fun
daç
ão J
oão
Pin
heiro
(FJP
), C
entr
o d
e E
stat
ístic
a e
Info
rmaç
ões
(CE
I), In
stitu
to B
rasi
leiro
de
Geo
graf
ia e
Est
atís
tica
(IBG
E),
Coo
rden
ação
de
Con
tas
Nac
iona
is (C
onac
), Fu
ndo
Mon
etár
io In
tern
acio
nal (
FMI),
Wor
ld E
cono
mic
Out
look
Dat
abas
e, A
pril
201
4. E
lab
oraç
ão: F
und
ação
Joã
o P
inhe
iro (F
JP),
Cen
tro
de
Est
atís
tica
e In
form
açõe
s (C
EI).
N
ota:
Con
vers
ão e
fetu
ada
utili
zand
o-se
o c
âmb
io m
édio
do
ano.
(1
) Dól
ares
nor
te-a
mer
ican
os a
just
ados
par
a ex
prim
ir o
mes
mo
pod
er d
e co
mp
ra e
m t
odos
os
paí
ses.
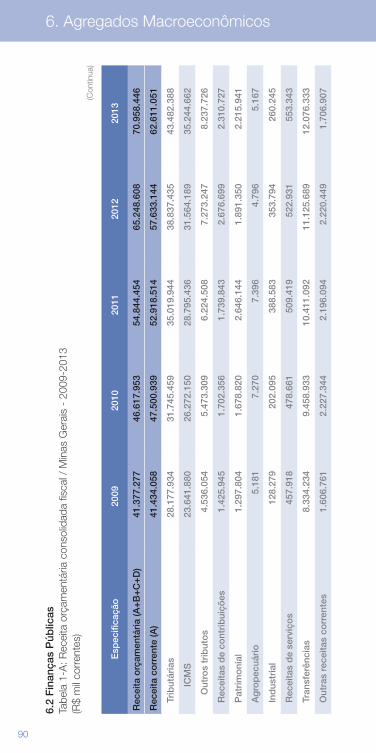
90 91
6. Agregados Macroeconômicos
6.2
Fin
ança
s P
úblic
asTa
bela
1-A
: Rec
eita
orç
amen
tária
con
solid
ada
fisca
l / M
inas
Ger
ais
- 20
09-2
013
(R$
mil
corr
ente
s)
Esp
ecifi
caçã
o20
0920
1020
1120
1220
13
Rec
eita
orç
amen
tári
a (A
+B
+C
+D
)41
.377
.277
46.6
17.9
5354
.844
.454
65.2
48.6
0870
.958
.446
Rec
eita
co
rren
te (A
)41
.434
.058
47.5
00.9
3952
.918
.514
57.6
33.1
4462
.611
.051
Tr
ibut
ária
s28
.177
.934
31.7
45.4
5935
.019
.944
38.8
37.4
3543
.482
.388
IC
MS
23.6
41.8
8026
.272
.150
28.7
95.4
3631
.564
.189
35.2
44.6
62
Out
ros
trib
uto
s4.
536.
054
5.47
3.30
96.
224.
508
7.27
3.24
78.
237.
726
R
ecei
tas
de
cont
rib
uiçõ
es
1.42
5.94
51.
702.
356
1.73
9.84
32.
676.
699
2.31
0.72
7
P
atri
mo
nial
1.29
7.80
41.
678.
820
2.64
6.14
41.
891.
350
2.21
5.94
1
A
gro
pec
uári
o5.
181
7.27
07.
396
4.79
65.
167
In
dus
tria
l12
8.27
920
2.09
538
8.58
335
3.79
426
0.24
5
R
ecei
tas
de
serv
iço
s45
7.91
847
8.66
150
9.41
952
2.93
155
3.34
3
Tr
ansf
erên
cias
8.33
4.23
49.
458.
933
10.4
11.0
9211
.125
.689
12.0
76.3
33
O
utra
s re
ceita
s co
rren
tes
1.60
6.76
12.
227.
344
2.19
6.09
42.
220.
449
1.70
6.90
7
(Con
tinua
)
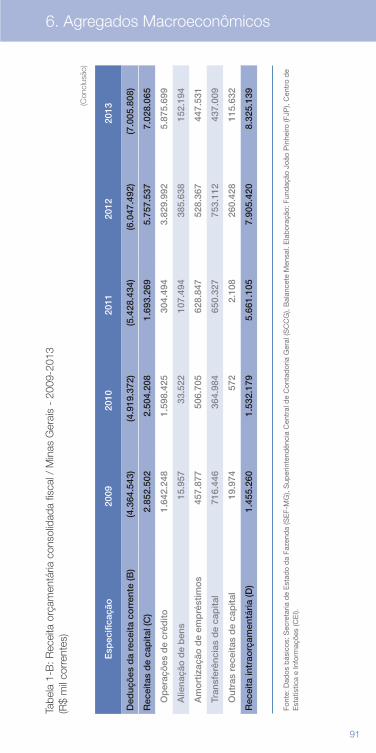
90 91
6. Agregados Macroeconômicos
Tabe
la 1
-B: R
ecei
ta o
rçam
entá
ria c
onso
lidad
a fis
cal /
Min
as G
erai
s -
2009
-201
3 (R
$ m
il co
rren
tes)
Esp
ecifi
caçã
o20
0920
1020
1120
1220
13
Ded
uçõ
es d
a re
ceita
co
rren
te (B
)(4
.364
.543
)(4
.919
.372
)(5
.428
.434
)(6
.047
.492
)(7
.005
.808
)
Rec
eita
s d
e ca
pita
l (C
)2.
852.
502
2.50
4.20
81.
693.
269
5.75
7.53
77.
028.
065
O
per
açõ
es d
e cr
édito
1.64
2.24
81.
598.
425
304.
494
3.82
9.99
25.
875.
699
A
liena
ção
de
ben
s15
.957
33.5
2210
7.49
438
5.63
815
2.19
4
A
mo
rtiz
ação
de
emp
rést
imo
s45
7.87
750
6.70
562
8.84
752
8.36
744
7.53
1
Tr
ansf
erên
cias
de
cap
ital
716.
446
364.
984
650.
327
753.
112
437.
009
O
utra
s re
ceita
s d
e ca
pita
l19
.974
572
2.10
826
0.42
811
5.63
2
Rec
eita
intr
aorç
amen
tári
a (D
)1.
455.
260
1.53
2.17
95.
661.
105
7.90
5.42
08.
325.
139
Font
e: D
ados
bás
icos
: Sec
reta
ria d
e E
stad
o d
a Fa
zend
a (S
EF-
MG
), S
uper
inte
ndên
cia
Cen
tral
de
Con
tad
oria
Ger
al (S
CC
G),
Bal
ance
te M
ensa
l. E
lab
oraç
ão: F
und
ação
Joã
o P
inhe
iro (F
JP),
Cen
tro
de
Est
atís
tica
e In
form
açõe
s (C
EI).
(Con
clus
ão)
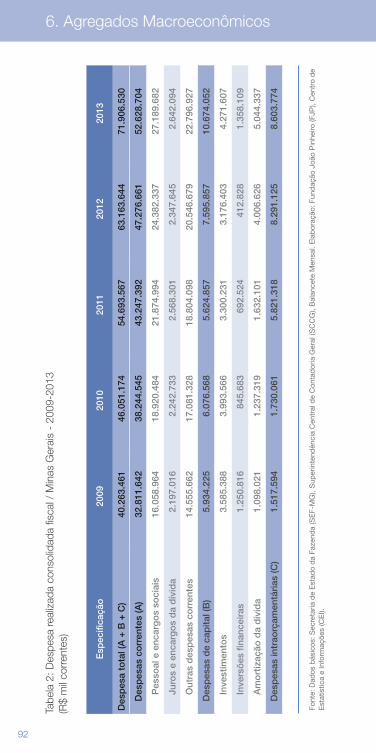
92 93
6. Agregados Macroeconômicos
Tabe
la 2
: Des
pesa
real
izad
a co
nsol
idad
a fis
cal /
Min
as G
erai
s -
2009
-201
3 (R
$ m
il co
rren
tes)
Esp
ecifi
caçã
o20
0920
1020
1120
1220
13
Des
pes
a to
tal (
A +
B +
C)
40.2
63.4
6146
.051
.174
54.6
93.5
6763
.163
.644
71.9
06.5
30
D
esp
esas
co
rren
tes
(A)
32.8
11.6
4238
.244
.545
43.2
47.3
9247
.276
.661
52.6
28.7
04
Pes
soal
e e
ncar
go
s so
ciai
s16
.058
.964
18.9
20.4
8421
.874
.994
24.3
82.3
3727
.189
.682
Juro
s e
enca
rgo
s d
a d
ívid
a2.
197.
016
2.24
2.73
32.
568.
301
2.34
7.64
52.
642.
094
Out
ras
des
pes
as c
orr
ente
s14
.555
.662
17.0
81.3
2818
.804
.098
20.5
46.6
7922
.796
.927
D
esp
esas
de
cap
ital (
B)
5.93
4.22
56.
076.
568
5.62
4.85
77.
595.
857
10.6
74.0
52
Inve
stim
ento
s3.
585.
388
3.99
3.56
63.
300.
231
3.17
6.40
34.
271.
607
Inve
rsõ
es f
inan
ceir
as1.
250.
816
845.
683
692.
524
412.
828
1.35
8.10
9
Am
ort
izaç
ão d
a d
ívid
a1.
098.
021
1.23
7.31
91.
632.
101
4.00
6.62
65.
044.
337
D
esp
esas
intr
aorç
amen
tári
as (C
)1.
517.
594
1.73
0.06
15.
821.
318
8.29
1.12
58.
603.
774
Font
e: D
ados
bás
icos
: Sec
reta
ria d
e E
stad
o d
a Fa
zend
a (S
EF-
MG
), S
uper
inte
ndên
cia
Cen
tral
de
Con
tad
oria
Ger
al (S
CC
G),
Bal
ance
te M
ensa
l. E
lab
oraç
ão: F
und
ação
Joã
o P
inhe
iro (F
JP),
Cen
tro
de
Est
atís
tica
e In
form
açõe
s (C
EI).
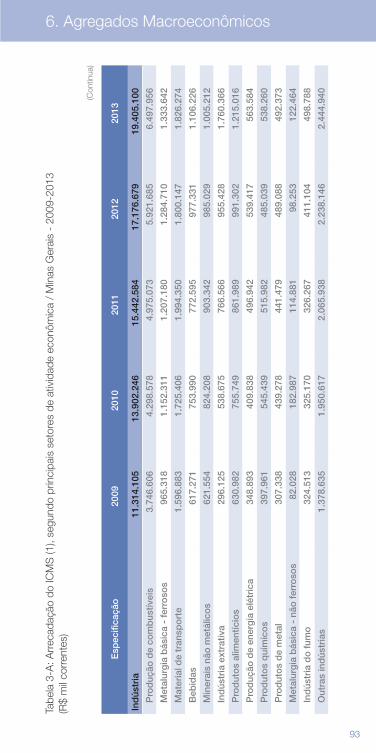
92 93
6. Agregados Macroeconômicos
Tabe
la 3
-A: A
rrec
adaç
ão d
o IC
MS
(1),
segu
ndo
prin
cipa
is s
etor
es d
e at
ivid
ade
econ
ômic
a /
Min
as G
erai
s -
2009
-201
3 (R
$ m
il co
rren
tes)
Esp
ecifi
caçã
o20
0920
1020
1120
1220
13
Ind
ústr
ia11
.314
.105
13.9
02.2
4615
.442
.584
17.1
76.6
7919
.405
.100
P
rod
ução
de
com
bus
tívei
s 3.
746.
606
4.29
8.57
84.
975.
073
5.92
1.68
56.
497.
956
M
etal
urg
ia b
ásic
a -
ferr
oso
s 96
5.31
81.
152.
311
1.20
7.18
01.
284.
710
1.33
3.64
2
M
ater
ial d
e tr
ansp
ort
e1.
596.
883
1.72
5.40
61.
994.
350
1.80
0.14
71.
826.
274
B
ebid
as61
7.27
175
3.99
077
2.59
597
7.33
11.
106.
226
M
iner
ais
não
met
álic
os
621.
554
824.
208
903.
342
985.
029
1.00
5.21
2
In
dús
tria
ext
rativ
a29
6.12
553
8.67
576
6.56
695
5.42
81.
760.
366
P
rod
uto
s al
imen
tício
s63
0.98
275
5.74
986
1.98
999
1.30
21.
215.
016
P
rod
ução
de
ener
gia
elé
tric
a34
8.89
340
9.83
849
6.94
253
9.41
756
3.58
4
P
rod
uto
s q
uím
ico
s39
7.96
154
5.43
951
5.98
248
5.03
953
8.26
0
P
rod
uto
s d
e m
etal
307.
338
439.
278
441.
479
489.
088
492.
373
M
etal
urg
ia b
ásic
a -
não
fer
roso
s82
.028
182.
987
114.
881
98.2
5312
2.46
4
In
dús
tria
do
fum
o32
4.51
332
5.17
032
6.26
741
1.10
449
8.78
8
O
utra
s in
dús
tria
s1.
378.
635
1.95
0.61
72.
065.
938
2.23
8.14
62.
444.
940
(Con
tinua
)
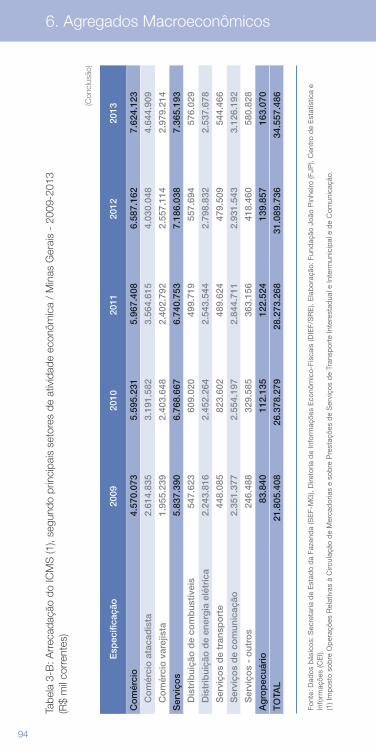
94 95
6. Agregados Macroeconômicos
Tabe
la 3
-B: A
rrec
adaç
ão d
o IC
MS
(1),
segu
ndo
prin
cipa
is s
etor
es d
e at
ivid
ade
econ
ômic
a /
Min
as G
erai
s -
2009
-201
3 (R
$ m
il co
rren
tes)
Esp
ecifi
caçã
o20
0920
1020
1120
1220
13
Co
mér
cio
4.57
0.07
35.
595.
231
5.96
7.40
86.
587.
162
7.62
4.12
3
C
om
érci
o a
taca
dis
ta
2.61
4.83
53.
191.
582
3.56
4.61
54.
030.
048
4.64
4.90
9
C
om
érci
o v
arej
ista
1.
955.
239
2.40
3.64
82.
402.
792
2.55
7.11
42.
979.
214
Ser
viço
s5.
837.
390
6.76
8.66
76.
740.
753
7.18
6.03
87.
365.
193
D
istr
ibui
ção
de
com
bus
tívei
s 54
7.62
360
9.02
049
9.71
955
7.69
457
6.02
9
D
istr
ibui
ção
de
ener
gia
elé
tric
a 2.
243.
816
2.45
2.26
42.
543.
544
2.79
8.83
22.
537.
678
S
ervi
ços
de
tran
spo
rte
448.
085
823.
602
489.
624
479.
509
544.
466
S
ervi
ços
de
com
unic
ação
2.
351.
377
2.55
4.19
72.
844.
711
2.93
1.54
33.
126.
192
S
ervi
ços
- o
utro
s24
6.48
832
9.58
536
3.15
641
8.46
058
0.82
8
Ag
rop
ecuá
rio
83.8
4011
2.13
512
2.52
413
9.85
716
3.07
0
TO
TAL
21.8
05.4
0826
.378
.279
28.2
73.2
6831
.089
.736
34.5
57.4
86(Con
clus
ão)
Font
e: D
ados
bás
icos
: Sec
reta
ria d
e E
stad
o d
a Fa
zend
a (S
EF-
MG
), D
ireto
ria d
e In
form
açõe
s E
conô
mic
o-Fi
scai
s (D
IEF/
SR
E).
Ela
bor
ação
: Fun
daç
ão J
oão
Pin
heiro
(FJP
), C
entr
o d
e E
stat
ístic
a e
Info
rmaç
ões
(CE
I).
(1) I
mp
osto
sob
re O
per
açõe
s R
elat
ivas
à C
ircul
ação
de
Mer
cad
oria
s e
sob
re P
rest
açõe
s d
e S
ervi
ços
de
Tran
spor
te In
tere
stad
ual e
Inte
rmun
icip
al e
de
Com
unic
ação
.
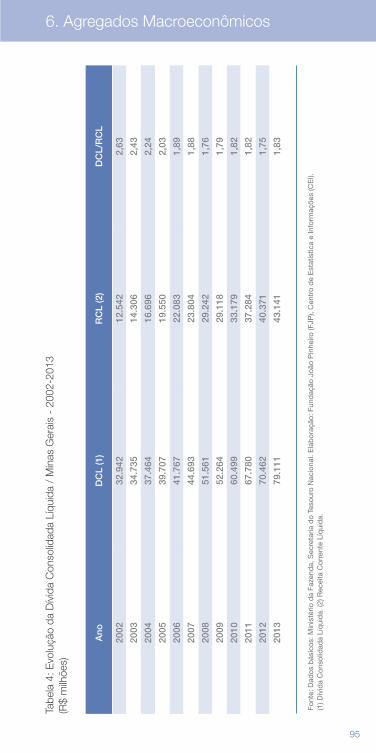
94 95
6. Agregados Macroeconômicos
Tabe
la 4
: Evo
luçã
o da
Dív
ida
Con
solid
ada
Líqu
ida
/ M
inas
Ger
ais
- 20
02-2
013
(R$
milh
ões)
Ano
DC
L (1
)R
CL
(2)
DC
L/R
CL
2002
32.9
4212
.542
2,63
2003
34.7
3514
.306
2,43
2004
37.4
6416
.696
2,24
2005
39.7
0719
.550
2,03
2006
41.7
6722
.083
1,89
2007
44.6
9323
.804
1,88
2008
51.5
6129
.242
1,76
2009
52.2
6429
.118
1,79
2010
60.4
9933
.179
1,82
2011
67.7
8037
.284
1,82
2012
70.4
6240
.371
1,75
2013
79.1
1143
.141
1,83
Font
e: D
ados
bás
icos
: Min
isté
rio d
a Fa
zend
a, S
ecre
taria
do
Teso
uro
Nac
iona
l. E
lab
oraç
ão: F
und
ação
Joã
o P
inhe
iro (F
JP),
Cen
tro
de
Est
atís
tica
e In
form
açõe
s (C
EI).
(1
) Dív
ida
Con
solid
ada
Líq
uid
a. (2
) Rec
eita
Cor
rent
e Lí
qui
da.
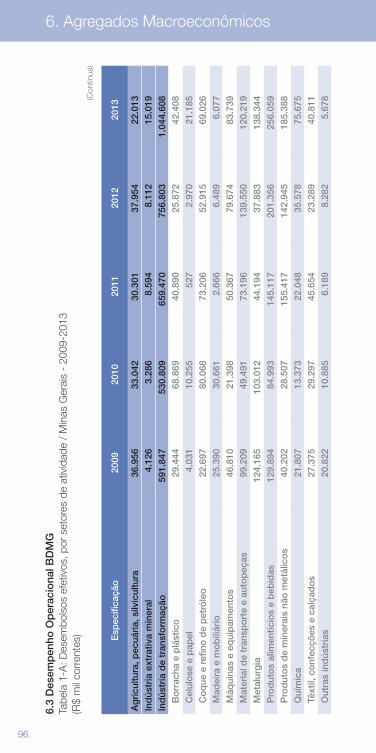
96 97
6. Agregados Macroeconômicos
6.3
Des
emp
enho
Op
erac
iona
l BD
MG
Tabe
la 1
-A: D
esem
bols
os e
fetiv
os, p
or s
etor
es d
e at
ivid
ade
/ M
inas
Ger
ais
- 20
09-2
013
(R$
mil
corr
ente
s) Esp
ecifi
caçã
o20
0920
1020
1120
1220
13
Ag
ricu
ltura
, pec
uári
a, s
ilvic
ultu
ra36
.956
33.0
4230
.301
37.9
5422
.013
Ind
ústr
ia e
xtra
tiva
min
eral
4.12
63.
286
8.59
48.
112
15.0
19In
dús
tria
de
tran
sfo
rmaç
ão59
1.84
753
0.80
965
9.47
075
6.80
31.
044.
608
B
orr
acha
e p
lást
ico
29.4
4468
.869
40.8
9025
.872
42.4
08
Cel
ulo
se e
pap
el4.
031
10.2
5552
72.
970
21.1
85
Co
que
e r
efin
o d
e p
etró
leo
22.6
9780
.068
73.2
0652
.915
69.0
26
Mad
eira
e m
ob
iliár
io25
.390
30.6
612.
666
6.48
96.
077
M
áqui
nas
e eq
uip
amen
tos
46.8
1021
.398
50.3
6779
.674
83.7
39
Mat
eria
l de
tran
spo
rte
e au
top
eças
99.2
0949
.491
73.1
9613
9.55
012
0.21
9
Met
alur
gia
124.
165
103.
012
44.1
9437
.883
138.
344
P
rod
uto
s al
imen
tício
s e
beb
idas
129.
894
84.9
9314
5.11
720
1.35
625
6.05
9
Pro
dut
os
de
min
erai
s nã
o m
etál
ico
s40
.202
28.5
0715
5.41
714
2.94
518
5.38
8
Quí
mic
a21
.807
13.3
7322
.048
35.5
7875
.675
Tê
xtil,
co
nfec
ções
e c
alça
do
s27
.375
29.2
9745
.654
23.2
8940
.811
O
utra
s in
dús
tria
s20
.822
10.8
856.
189
8.28
25.
678(C
ontin
ua)
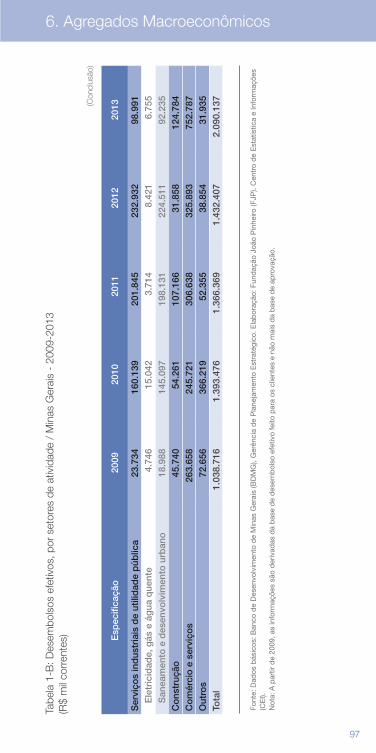
96 97
6. Agregados Macroeconômicos
Tabe
la 1
-B: D
esem
bols
os e
fetiv
os, p
or s
etor
es d
e at
ivid
ade
/ M
inas
Ger
ais
- 20
09-2
013
(R$
mil
corr
ente
s) Esp
ecifi
caçã
o20
0920
1020
1120
1220
13
Ser
viço
s in
dus
tria
is d
e ut
ilid
ade
púb
lica
23.7
3416
0.13
920
1.84
523
2.93
298
.991
E
letr
icid
ade,
gás
e á
gua
que
nte
4.74
615
.042
3.71
48.
421
6.75
5
San
eam
ento
e d
esen
volv
imen
to u
rban
o18
.988
145.
097
198.
131
224.
511
92.2
35C
ons
truç
ão45
.740
54.2
6110
7.16
631
.858
124.
784
Co
mér
cio
e s
ervi
ços
263.
658
245.
721
306.
638
325.
893
752.
787
Out
ros
72.6
5636
6.21
952
.355
38.8
5431
.935
Tota
l1.
038.
716
1.39
3.47
61.
366.
369
1.43
2.40
72.
090.
137
(Con
clus
ão)
Font
e: D
ados
bás
icos
: Ban
co d
e D
esen
volv
imen
to d
e M
inas
Ger
ais
(BD
MG
), G
erên
cia
de
Pla
neja
men
to E
stra
tégi
co. E
lab
oraç
ão: F
und
ação
Joã
o P
inhe
iro (F
JP).
Cen
tro
de
Est
atís
tica
e In
form
açõe
s (C
EI).
N
ota:
A p
artir
de
2009
, as
info
rmaç
ões
são
der
ivad
as d
a b
ase
de
des
emb
olso
efe
tivo
feito
par
a os
clie
ntes
e n
ão m
ais
da
bas
e d
e ap
rova
ção.
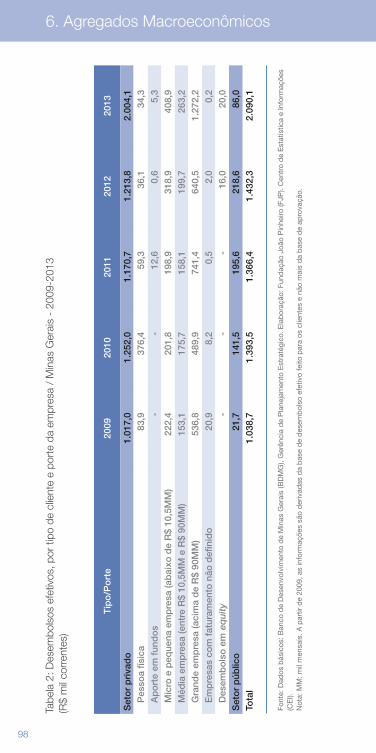
98 99
6. Agregados Macroeconômicos
Tabe
la 2
: Des
embo
lsos
efe
tivos
, por
tipo
de
clie
nte
e po
rte
da e
mpr
esa
/ M
inas
Ger
ais
- 20
09-2
013
(R$
mil
corr
ente
s)
Tip
o/P
ort
e20
0920
1020
1120
1220
13
Set
or
pri
vad
o1.
017,
01.
252,
01.
170,
71.
213,
82.
004,
1
Pes
soa
físic
a83
,937
6,4
59,3
36,1
34,3
A
po
rte
em f
und
os
--
12,6
0,6
5,3
M
icro
e p
eque
na e
mp
resa
(ab
aixo
de
R$
10,5
MM
)22
2,4
201,
819
8,9
318,
940
8,9
M
édia
em
pre
sa (e
ntre
R$
10,5
MM
e R
$ 90
MM
)15
3,1
175,
715
8,1
199,
726
3,2
G
rand
e em
pre
sa (a
cim
a d
e R
$ 90
MM
)53
6,8
489,
974
1,4
640,
51.
272,
2
Em
pre
sas
com
fat
uram
ento
não
def
inid
o20
,98,
20,
52,
00,
2
Des
emb
ols
o e
m e
qui
ty-
--
16,0
20,0
Set
or
púb
lico
21,7
141,
519
5,6
218,
686
,0To
tal
1.03
8,7
1.39
3,5
1.36
6,4
1.43
2,3
2.09
0,1
Font
e: D
ados
bás
icos
: Ban
co d
e D
esen
volv
imen
to d
e M
inas
Ger
ais
(BD
MG
), G
erên
cia
de
Pla
neja
men
to E
stra
tégi
co. E
lab
oraç
ão: F
und
ação
Joã
o P
inhe
iro (F
JP).
Cen
tro
de
Est
atís
tica
e In
form
açõe
s (C
EI).
N
ota:
MM
: mil
men
sais
. A p
artir
de
2009
, as
info
rmaç
ões
são
der
ivad
as d
a b
ase
de
des
emb
olso
efe
tivo
feito
par
a os
clie
ntes
e n
ão m
ais
da
bas
e d
e ap
rova
ção.
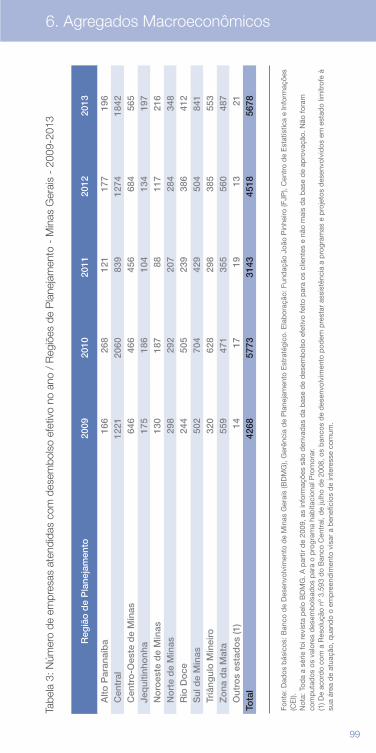
98 99
6. Agregados Macroeconômicos
Tabe
la 3
: Núm
ero
de e
mpr
esas
ate
ndid
as c
om d
esem
bols
o ef
etiv
o no
ano
/ R
egiõ
es d
e P
lane
jam
ento
- M
inas
Ger
ais
- 20
09-2
013
Reg
ião
de
Pla
neja
men
to20
0920
1020
1120
1220
13
A
lto P
aran
aíb
a16
626
812
117
719
6
Cen
tral
1221
2060
839
1274
1842
C
entr
o-O
este
de
Min
as64
646
645
668
456
5
Jeq
uitin
honh
a17
518
610
413
419
7
No
roes
te d
e M
inas
130
187
8811
721
6
No
rte
de
Min
as29
829
220
728
434
8
Rio
Do
ce24
450
523
938
641
2
Sul
de
Min
as50
270
442
950
484
1
Triâ
ngul
o M
inei
ro32
062
829
838
555
3
Zo
na d
a M
ata
559
471
355
560
487
O
utro
s es
tad
os
(1)
1417
1913
21To
tal
4268
5773
3143
4518
5678
Font
e: D
ados
bás
icos
: Ban
co d
e D
esen
volv
imen
to d
e M
inas
Ger
ais
(BD
MG
), G
erên
cia
de
Pla
neja
men
to E
stra
tégi
co. E
lab
oraç
ão: F
und
ação
Joã
o P
inhe
iro (F
JP),
Cen
tro
de
Est
atís
tica
e In
form
açõe
s (C
EI).
Not
a: T
oda
a sé
rie fo
i rev
ista
pel
o B
DM
G. A
par
tir d
e 20
09, a
s in
form
açõe
s sã
o d
eriv
adas
da
bas
e d
e d
esem
bol
so e
fetiv
o fe
ito p
ara
os c
lient
es e
não
mai
s d
a b
ase
de
apro
vaçã
o. N
ão fo
ram
co
mp
utad
os o
s va
lore
s d
esem
bol
sad
os p
ara
o p
rogr
ama
hab
itaci
onal
Pro
mor
ar.
(1) D
e ac
ord
o co
m a
Res
oluç
ão n
º 3.
593
do
Ban
co C
entr
al, d
e ju
lho
de
2008
, os
ban
cos
de
des
envo
lvim
ento
pod
em p
rest
ar a
ssis
tênc
ia a
pro
gram
as e
pro
jeto
s d
esen
volv
idos
em
est
ado
limítr
ofe
à su
a ár
ea d
e at
uaçã
o, q
uand
o o
emp
reen
dim
ento
vis
ar a
ben
efíc
ios
de
inte
ress
e co
mum
.
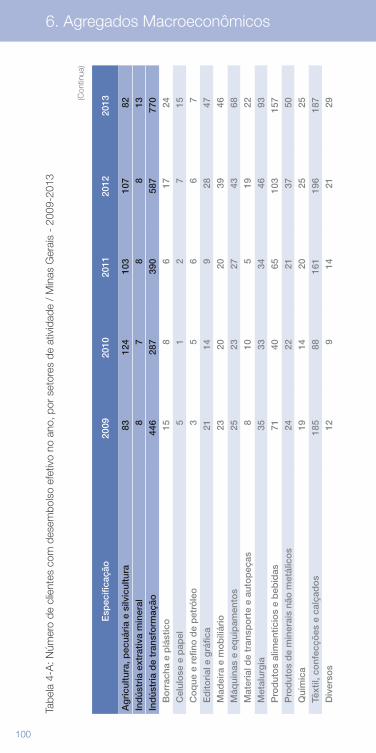
100 101
6. Agregados Macroeconômicos
Tabe
la 4
-A: N
úmer
o de
clie
ntes
com
des
embo
lso
efet
ivo
no a
no, p
or s
etor
es d
e at
ivid
ade
/ M
inas
Ger
ais
- 20
09-2
013
Esp
ecifi
caçã
o20
0920
1020
1120
1220
13
Ag
ricu
ltura
, pec
uári
a e
silv
icul
tura
8312
410
310
782
Ind
ústr
ia e
xtra
tiva
min
eral
87
88
13In
dús
tria
de
tran
sfo
rmaç
ão44
628
739
058
777
0
Bo
rrac
ha e
plá
stic
o15
86
1724
C
elul
ose
e p
apel
51
27
15
Co
que
e r
efin
o d
e p
etró
leo
35
66
7
Ed
itori
al e
grá
fica
2114
928
47
Mad
eira
e m
ob
iliár
io23
2020
3946
M
áqui
nas
e eq
uip
amen
tos
2523
2743
68
Mat
eria
l de
tran
spo
rte
e au
top
eças
810
519
22
Met
alur
gia
3533
3446
93
Pro
dut
os
alim
entíc
ios
e b
ebid
as71
4065
103
157
P
rod
uto
s d
e m
iner
ais
não
met
álic
os
2422
2137
50
Quí
mic
a19
1420
2525
Tê
xtil,
co
nfec
ções
e c
alça
do
s18
588
161
196
187
D
iver
sos
129
1421
29
(Con
tinua
)
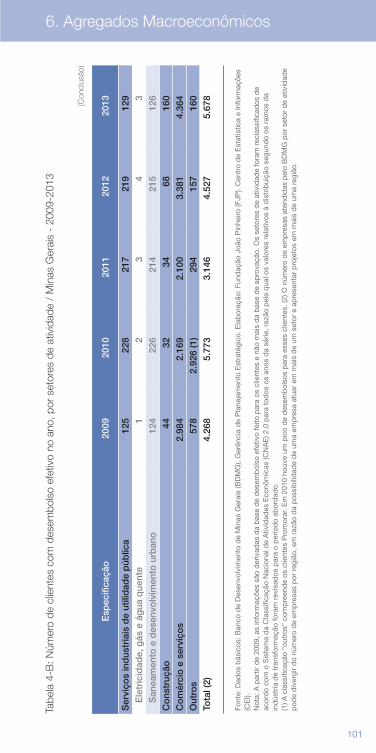
100 101
6. Agregados Macroeconômicos
Tabe
la 4
-B: N
úmer
o de
clie
ntes
com
des
embo
lso
efet
ivo
no a
no, p
or s
etor
es d
e at
ivid
ade
/ M
inas
Ger
ais
- 20
09-2
013
Esp
ecifi
caçã
o20
0920
1020
1120
1220
13
Ag
ricu
ltura
, pec
uári
a e
silv
icul
tura
8312
410
310
782
Ind
ústr
ia e
xtra
tiva
min
eral
87
88
13In
dús
tria
de
tran
sfo
rmaç
ão44
628
739
058
777
0
Bo
rrac
ha e
plá
stic
o15
86
1724
C
elul
ose
e p
apel
51
27
15
Co
que
e r
efin
o d
e p
etró
leo
35
66
7
Ed
itori
al e
grá
fica
2114
928
47
Mad
eira
e m
ob
iliár
io23
2020
3946
M
áqui
nas
e eq
uip
amen
tos
2523
2743
68
Mat
eria
l de
tran
spo
rte
e au
top
eças
810
519
22
Met
alur
gia
3533
3446
93
Pro
dut
os
alim
entíc
ios
e b
ebid
as71
4065
103
157
P
rod
uto
s d
e m
iner
ais
não
met
álic
os
2422
2137
50
Quí
mic
a19
1420
2525
Tê
xtil,
co
nfec
ções
e c
alça
do
s18
588
161
196
187
D
iver
sos
129
1421
29
Esp
ecifi
caçã
o20
0920
1020
1120
1220
13
Ser
viço
s in
dus
tria
is d
e ut
ilid
ade
púb
lica
125
228
217
219
129
E
letr
icid
ade,
gás
e á
gua
que
nte
12
34
3
San
eam
ento
e d
esen
volv
imen
to u
rban
o12
422
621
421
512
6C
ons
truç
ão44
3234
6816
0C
om
érci
o e
ser
viço
s2.
984
2.16
92.
100
3.38
14.
364
Out
ros
578
2.92
6 (1
)29
415
716
0To
tal (
2)4.
268
5.77
33.
146
4.52
75.
678
(Con
clus
ão)
Font
e: D
ados
bás
icos
: Ban
co d
e D
esen
volv
imen
to d
e M
inas
Ger
ais
(BD
MG
), G
erên
cia
de
Pla
neja
men
to E
stra
tégi
co. E
lab
oraç
ão: F
und
ação
Joã
o P
inhe
iro (F
JP).
Cen
tro
de
Est
atís
tica
e In
form
açõe
s (C
EI).
N
ota:
A p
artir
de
2009
, as
info
rmaç
ões
são
der
ivad
as d
a b
ase
de
des
emb
olso
efe
tivo
feito
par
a os
clie
ntes
e n
ão m
ais
da
bas
e d
e ap
rova
ção.
Os
seto
res
de
ativ
idad
e fo
ram
rec
lass
ifica
dos
de
acor
do
com
o S
iste
ma
da
Cla
ssifi
caçã
o N
acio
nal d
e A
tivid
ades
Eco
nôm
icas
(CN
AE
) 2.0
par
a to
dos
os
anos
da
série
, raz
ão p
ela
qua
l os
valo
res
rela
tivos
à d
istr
ibui
ção
segu
ndo
os r
amos
da
ind
ústr
ia d
e tr
ansf
orm
ação
fora
m r
evis
ados
par
a o
per
íod
o ab
ord
ado.
(1
) A c
lass
ifica
ção
“out
ros”
com
pre
end
e os
clie
ntes
Pro
mor
ar. E
m 2
010
houv
e um
pic
o d
e d
esem
bol
sos
par
a es
ses
clie
ntes
. (2)
O n
úmer
o d
e em
pre
sas
aten
did
as p
elo
BD
MG
por
set
or d
e at
ivid
ade
pod
e d
iver
gir
do
núm
ero
de
emp
resa
s p
or r
egiã
o, e
m r
azão
da
pos
sib
ilid
ade
de
uma
emp
resa
atu
ar e
m m
ais
de
um s
etor
e a
pre
sent
ar p
roje
tos
em m
ais
de
uma
regi
ão.
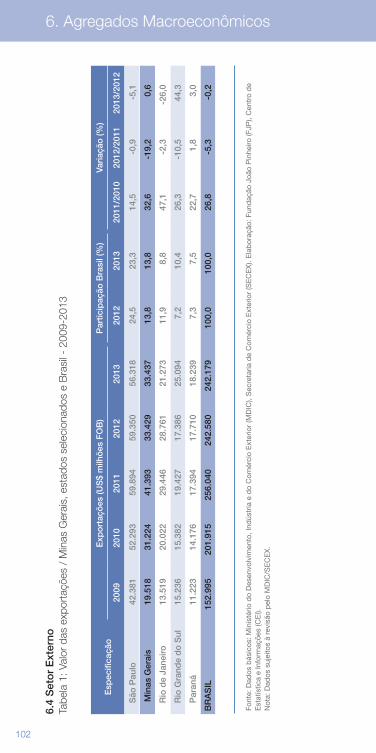
102 103
6. Agregados Macroeconômicos
6.4
Set
or
Ext
erno
Tabe
la 1
: Val
or d
as e
xpor
taçõ
es /
Min
as G
erai
s, e
stad
os s
elec
iona
dos
e B
rasi
l - 2
009-
2013
Esp
ecifi
caçã
oE
xpo
rtaç
ões
(US
$ m
ilhõ
es F
OB
)P
artic
ipaç
ão B
rasi
l (%
) Va
riaç
ão (%
)
2009
2010
2011
2012
2013
2012
2013
2011
/201
020
12/2
011
2013
/201
2
S
ão P
aulo
42.3
8152
.293
59.8
9459
.350
56.3
1824
,523
,314
,5-0
,9-5
,1
M
inas
Ger
ais
19.5
1831
.224
41.3
9333
.429
33.4
3713
,813
,832
,6-1
9,2
0,6
R
io d
e Ja
neiro
13.5
1920
.022
29.4
4628
.761
21.2
7311
,98,
847
,1-2
,3-2
6,0
R
io G
rand
e d
o S
ul15
.236
15.3
8219
.427
17.3
8625
.094
7,2
10,4
26,3
-10,
544
,3
P
aran
á11
.223
14.1
7617
.394
17.7
1018
.239
7,3
7,5
22,7
1,8
3,0
BR
AS
IL15
2.99
520
1.91
525
6.04
024
2.58
024
2.17
910
0,0
100,
026
,8-5
,3-0
,2
Font
e: D
ados
bás
icos
: Min
isté
rio d
o D
esen
volv
imen
to, I
ndús
tria
e d
o C
omér
cio
Ext
erio
r (M
DIC
), S
ecre
taria
de
Com
érci
o E
xter
ior
(SE
CE
X).
Ela
bor
ação
: Fun
daç
ão J
oão
Pin
heiro
(FJP
), C
entr
o d
e E
stat
ístic
a e
Info
rmaç
ões
(CE
I).
Not
a: D
ados
suj
eito
s à
revi
são
pel
o M
DIC
/SE
CE
X.
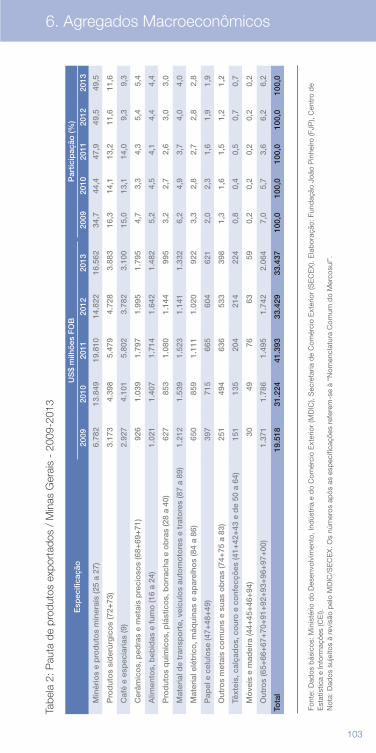
102 103
6. Agregados Macroeconômicos
Tabe
la 2
: Pau
ta d
e pr
odut
os e
xpor
tado
s /
Min
as G
erai
s -
2009
-201
3
Esp
ecifi
caçã
oU
S$
milh
ões
FO
BP
artic
ipaç
ão (%
)
2009
2010
2011
2012
2013
2009
2010
2011
2012
2013
M
inér
ios
e p
rod
uto
s m
iner
ais
(25
a 27
)6.
782
13.8
4919
.810
14.8
2216
.562
34,7
44,4
47,9
49,5
49,5
P
rod
uto
s si
der
úrg
ico
s (7
2+73
)3.
173
4.39
85.
479
4.72
83.
883
16,3
14,1
13,2
11,6
11,6
C
afé
e es
pec
iari
as (9
)2.
927
4.10
15.
802
3.78
23.
100
15,0
13,1
14,0
9,3
9,3
C
erâm
ico
s, p
edra
s e
met
ais
pre
cio
sos
(68+
69+
71)
926
1.03
91.
797
1.99
51.
795
4,7
3,3
4,3
5,4
5,4
A
limen
tos,
beb
idas
e f
umo
(16
a 24
)1.
021
1.40
71.
714
1.64
21.
482
5,2
4,5
4,1
4,4
4,4
P
rod
uto
s q
uím
ico
s, p
lást
ico
s, b
orr
acha
e o
bra
s (2
8 a
40)
627
853
1.08
01.
144
995
3,2
2,7
2,6
3,0
3,0
M
ater
ial d
e tr
ansp
ort
e, v
eícu
los
auto
mo
tore
s e
trat
ore
s (8
7 a
89)
1.21
21.
539
1.52
31.
141
1.33
26,
24,
93,
74,
04,
0
M
ater
ial e
létr
ico
, máq
uina
s e
apar
elho
s (8
4 a
86)
650
859
1.11
11.
020
922
3,3
2,8
2,7
2,8
2,8
P
apel
e c
elul
ose
(47+
48+
49)
397
715
665
604
621
2,0
2,3
1,6
1,9
1,9
O
utro
s m
etai
s co
mun
s e
suas
ob
ras
(74+
75 a
83)
251
494
636
533
398
1,3
1,6
1,5
1,2
1,2
Tê
xtei
s, c
alça
do
s, c
our
o e
co
nfec
ções
(41+
42+
43 e
de
50 a
64)
151
135
204
214
224
0,8
0,4
0,5
0,7
0,7
M
óve
is e
mad
eira
(44+
45+
46+
94)
3049
7663
590,
20,
20,
20,
20,
2
O
utro
s (6
5+66
+67
+70
+91
+92
+93
+96
+97
+00
)1.
371
1.78
61.
495
1.74
22.
064
7,0
5,7
3,6
6,2
6,2
Tota
l19
.518
31.2
2441
.393
33.4
2933
.437
100,
010
0,0
100,
010
0,0
100,
0
Font
e: D
ados
bás
icos
: Min
isté
rio d
o D
esen
volv
imen
to, I
ndús
tria
e d
o C
omér
cio
Ext
erio
r (M
DIC
), S
ecre
taria
de
Com
érci
o E
xter
ior
(SE
CE
X).
Ela
bor
ação
: Fun
daç
ão J
oão
Pin
heiro
(FJP
), C
entr
o d
e E
stat
ístic
a e
Info
rmaç
ões
(CE
I).
Not
a: D
ados
suj
eito
s à
revi
são
pel
o M
DIC
/SE
CE
X. O
s nú
mer
os a
pós
as
esp
ecifi
caçõ
es r
efer
em-s
e à
“Nom
encl
atur
a C
omum
do
Mer
cosu
l”.
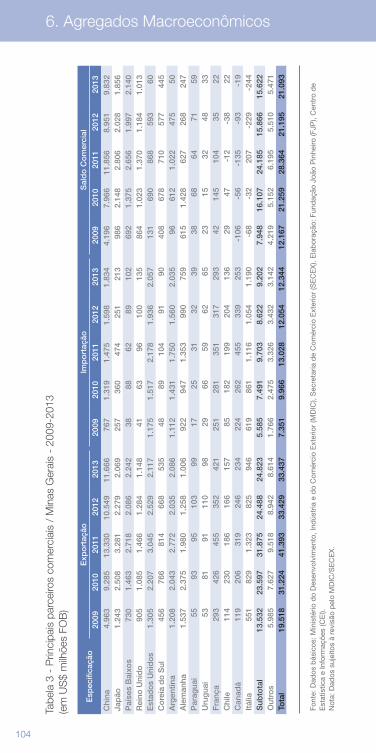
104
Tabe
la 3
- P
rinci
pais
par
ceiro
s co
mer
ciai
s /
Min
as G
erai
s -
2009
-201
3 (e
m U
S$
milh
ões
FOB
)
Esp
ecifi
caçã
oE
xpo
rtaç
ãoIm
po
rtaç
ãoS
ald
o C
om
erci
al
2009
2010
2011
2012
2013
2009
2010
2011
2012
2013
2009
2010
2011
2012
2013
Chi
na4.
963
9.28
513
.330
10.5
4911
.666
767
1.31
91.
475
1.59
81.
834
4.19
67.
966
11.8
568.
951
9.83
2Ja
pão
1.24
32.
508
3.28
12.
279
2.06
925
736
047
425
121
398
62.
148
2.80
62.
028
1.85
6P
aíse
s B
aixo
s73
01.
463
2.71
82.
086
2.24
238
8862
8910
269
21.
375
2.65
61.
997
2.14
0R
eino
Uni
do
905
1.08
51.
466
1.28
41.
148
4163
9610
013
586
41.
023
1.37
01.
184
1.01
3E
stad
os
Uni
do
s1.
305
2.20
73.
045
2.52
92.
117
1.17
51.
517
2.17
81.
936
2.05
713
169
086
859
360
Co
reia
do
Sul
456
766
814
668
535
4889
104
9190
408
678
710
577
445
Arg
entin
a1.
208
2.04
32.
772
2.03
52.
086
1.11
21.
431
1.75
01.
560
2.03
596
612
1.02
247
550
Ale
man
ha1.
537
2.37
51.
980
1.25
81.
006
922
947
1.35
399
075
961
51.
428
627
268
247
Par
agua
i55
9395
103
9917
2531
3239
3868
6471
59U
rug
uai
5381
9111
098
2966
5962
6523
1532
4833
Fra
nça
293
426
455
352
421
251
281
351
317
293
4214
510
435
22C
hile
114
230
186
166
157
8518
219
920
413
629
47-1
2-3
822
Can
adá
119
206
319
246
234
224
262
455
339
253
-106
-56
-135
-93
-19
Itál
ia55
182
91.
323
825
946
619
861
1.11
61.
054
1.19
0-6
8-3
220
7-2
29-2
44S
ubto
tal
13.5
3223
.597
31.8
7524
.488
24.8
235.
585
7.49
19.
703
8.62
29.
202
7.94
816
.107
24.1
8515
.866
15.6
22O
utro
s5.
985
7.62
79.
518
8.94
28.
614
1.76
62.
475
3.32
63.
432
3.14
24.
219
5.15
26.
195
5.51
05.
471
Tota
l19
.518
31.2
2441
.393
33.4
2933
.437
7.35
19.
966
13.0
2812
.054
12.3
4412
.167
21.2
5928
.364
21.1
9521
.093
Font
e: D
ados
bás
icos
: Min
isté
rio d
o D
esen
volv
imen
to, I
ndús
tria
e d
o C
omér
cio
Ext
erio
r (M
DIC
), S
ecre
taria
de
Com
érci
o E
xter
ior
(SE
CE
X).
Ela
bor
ação
: Fun
daç
ão J
oão
Pin
heiro
(FJP
), C
entr
o d
e E
stat
ístic
a e
Info
rmaç
ões
(CE
I).
Not
a: D
ados
suj
eito
s à
revi
são
pel
o M
DIC
/SE
CE
X.
6. Agregados Macroeconômicos
105
Font
e: D
ados
bás
icos
: Min
isté
rio d
o D
esen
volv
imen
to, I
ndús
tria
e d
o C
omér
cio
Ext
erio
r (M
DIC
), S
ecre
taria
de
Com
érci
o E
xter
ior
(SE
CE
X).
Ela
bor
ação
: Fun
daç
ão J
oão
Pin
heiro
(FJP
), C
entr
o d
e E
stat
ístic
a e
Info
rmaç
ões
(CE
I).
Not
a: D
ados
suj
eito
s à
revi
são
pel
o M
DIC
/SE
CE
X.
Aspectos Demográficos e
Socioeconômicos da População
7
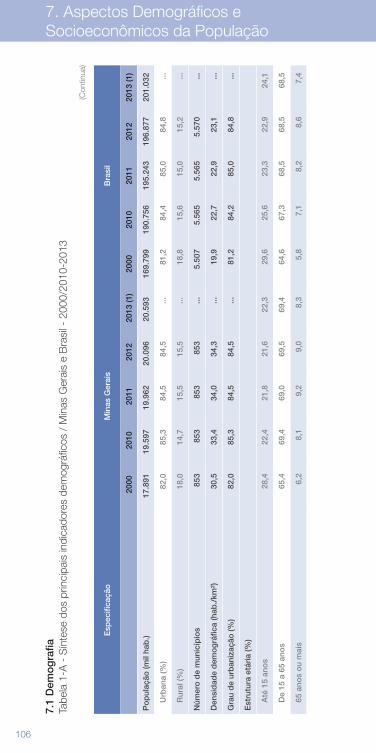
106 107
7. Aspectos Demográficos e Socioeconômicos da População
7.1
Dem
og
rafia
Tabe
la 1
-A -
Sín
tese
dos
prin
cipa
is in
dica
dore
s de
mog
ráfic
os /
Min
as G
erai
s e
Bra
sil -
200
0/20
10-2
013
Esp
ecifi
caçã
oM
inas
Ger
ais
Bra
sil
20
0020
1020
1120
1220
13 (1
)20
0020
1020
1120
1220
13 (1
)
Po
pul
ação
(mil
hab
.)17
.891
19.5
9719
.962
20.0
9620
.593
169.
799
190.
756
195.
243
196.
877
201.
032
U
rban
a (%
)82
,085
,384
,584
,5...
81,2
84,4
85,0
84,8
...
R
ural
(%)
18,0
14,7
15,5
15,5
...18
,815
,615
,015
,2...
Núm
ero
de
mun
icíp
ios
853
853
853
853
...5.
507
5.56
55.
565
5.57
0...
Den
sid
ade
dem
og
ráfic
a (h
ab./
km²)
30,5
33,4
34,0
34,3
...19
,922
,722
,923
,1...
Gra
u d
e ur
ban
izaç
ão (%
) 82
,085
,384
,584
,5...
81,2
84,2
85,0
84,8
...
Est
rutu
ra e
tári
a (%
)
A
té 1
5 an
os
28,4
22,4
21,8
21,6
22,3
29,6
25,6
23,3
22,9
24,1
D
e 15
a 6
5 an
os
65,4
69,4
69,0
69,5
69,4
64,6
67,3
68,5
68,5
68,5
65
ano
s o
u m
ais
6,2
8,1
9,2
9,0
8,3
5,8
7,1
8,2
8,6
7,4
(Con
tinua
)
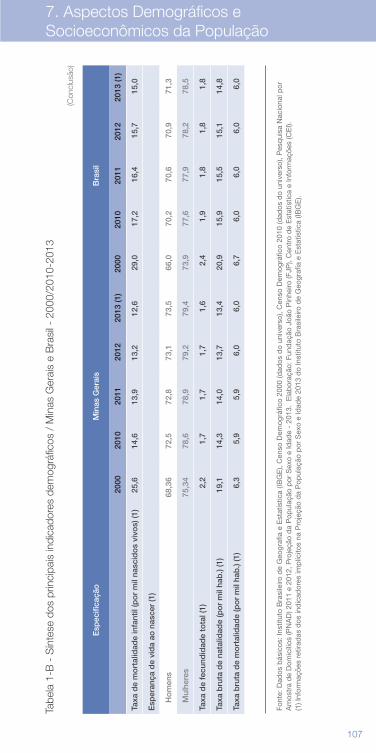
106 107
7. Aspectos Demográficos e Socioeconômicos da População
Tabe
la 1
-B -
Sín
tese
dos
prin
cipa
is in
dica
dore
s de
mog
ráfic
os /
Min
as G
erai
s e
Bra
sil -
200
0/20
10-2
013
Esp
ecifi
caçã
oM
inas
Ger
ais
Bra
sil
20
0020
1020
1120
1220
13 (1
)20
0020
1020
1120
1220
13 (1
)
Taxa
de
mo
rtal
idad
e in
fant
il (p
or
mil
nasc
ido
s vi
vos)
(1)
25,6
14,6
13,9
13,2
12,6
29,0
17,2
16,4
15,7
15,0
Esp
eran
ça d
e vi
da
ao n
asce
r (1
)
H
om
ens
68,3
672
,572
,873
,173
,566
,070
,270
,670
,971
,3
M
ulhe
res
75,3
478
,678
,979
,279
,473
,977
,677
,978
,278
,5
Taxa
de
fecu
ndid
ade
tota
l (1)
2,2
1,7
1,7
1,7
1,6
2,4
1,9
1,8
1,8
1,8
Taxa
bru
ta d
e na
talid
ade
(po
r m
il ha
b.)
(1)
19,1
14,3
14,0
13,7
13,4
20,9
15,9
15,5
15,1
14,8
Taxa
bru
ta d
e m
ort
alid
ade
(po
r m
il ha
b.)
(1)
6,3
5,9
5,9
6,0
6,0
6,7
6,0
6,0
6,0
6,0
Font
e: D
ados
bás
icos
: Ins
titut
o B
rasi
leiro
de
Geo
graf
ia e
Est
atís
tica
(IBG
E),
Cen
so D
emog
ráfic
o 20
00 (d
ados
do
univ
erso
), C
enso
Dem
ográ
fico
2010
(dad
os d
o un
iver
so),
Pes
qui
sa N
acio
nal p
or
Am
ostr
a d
e D
omic
ílios
(PN
AD
) 201
1 e
2012
, Pro
jeçã
o d
a P
opul
ação
por
Sex
o e
Idad
e -
2013
. E
lab
oraç
ão: F
und
ação
Joã
o P
inhe
iro (F
JP),
Cen
tro
de
Est
atís
tica
e In
form
açõe
s (C
EI).
(1
) Inf
orm
açõe
s re
tirad
as d
os in
dic
ador
es im
plíc
itos
na P
roje
ção
da
Pop
ulaç
ão p
or S
exo
e Id
ade
2013
do
Inst
ituto
Bra
sile
iro d
e G
eogr
afia
e E
stat
ístic
a (IB
GE
).
(Con
clus
ão)
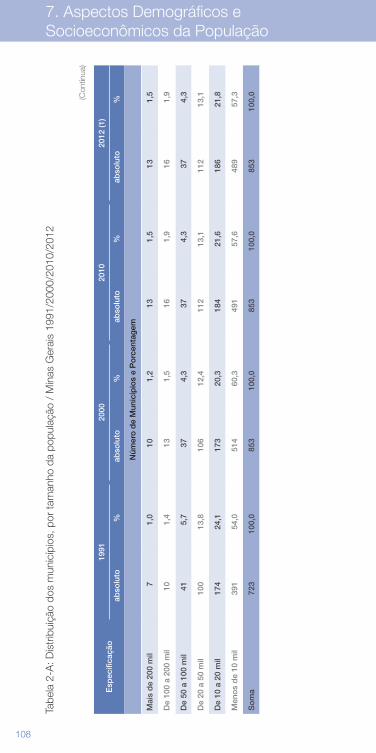
108 109
7. Aspectos Demográficos e Socioeconômicos da População
Tabe
la 2
-A: D
istr
ibui
ção
dos
mun
icíp
ios,
por
tam
anho
da
popu
laçã
o /
Min
as G
erai
s 19
91/2
000/
2010
/201
2
Esp
ecifi
caçã
o19
9120
0020
1020
12 (1
)
abso
luto
%ab
solu
to%
abso
luto
%ab
solu
to%
Núm
ero
de
Mun
icíp
ios
e P
orc
enta
gem
Mai
s d
e 20
0 m
il 7
1,0
101,
213
1,5
131,
5
De
100
a 20
0 m
il10
1,4
131,
516
1,9
161,
9
De
50 a
100
mil
415,
737
4,3
374,
337
4,3
De
20 a
50
mil
100
13,8
106
12,4
112
13,1
112
13,1
De
10 a
20
mil
174
24,1
173
20,3
184
21,6
186
21,8
Men
os
de
10 m
il39
154
,051
460
,349
157
,648
957
,3
So
ma
723
100,
085
310
0,0
853
100,
085
310
0,0(Con
tinua
)
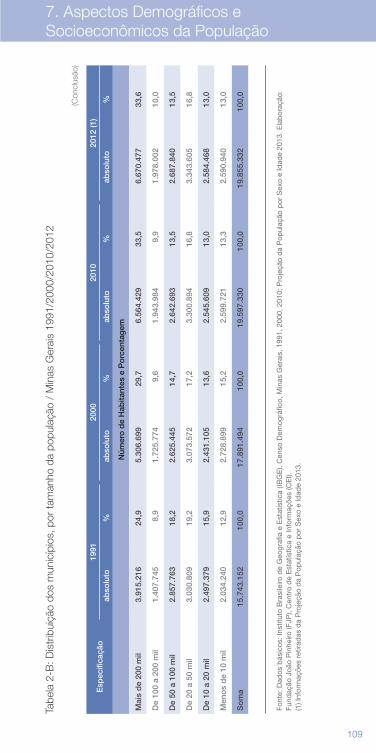
108 109
7. Aspectos Demográficos e Socioeconômicos da População
Tabe
la 2
-B: D
istr
ibui
ção
dos
mun
icíp
ios,
por
tam
anho
da
popu
laçã
o /
Min
as G
erai
s 19
91/2
000/
2010
/201
2
Esp
ecifi
caçã
o19
9120
0020
1020
12 (1
)
abso
luto
%ab
solu
to%
abso
luto
%ab
solu
to%
Núm
ero
de
Hab
itant
es e
Po
rcen
tag
em
Mai
s d
e 20
0 m
il 3.
915.
216
24,9
5.30
6.69
929
,76.
564.
429
33,5
6.67
0.47
733
,6
De
100
a 20
0 m
il1.
407.
745
8,9
1.72
5.77
49,
61.
943.
984
9,9
1.97
8.00
210
,0
De
50 a
100
mil
2.85
7.76
318
,22.
625.
445
14,7
2.64
2.69
313
,52.
687.
840
13,5
De
20 a
50
mil
3.03
0.80
919
,23.
073.
572
17,2
3.30
0.89
416
,83.
343.
605
16,8
De
10 a
20
mil
2.49
7.37
915
,92.
431.
105
13,6
2.54
5.60
913
,02.
584.
468
13,0
Men
os
de
10 m
il2.
034.
240
12,9
2.72
8.89
915
,22.
599.
721
13,3
2.59
0.94
013
,0
So
ma
15.7
43.1
5210
0,0
17.8
91.4
9410
0,0
19.5
97.3
3010
0,0
19.8
55.3
3210
0,0
(Con
clus
ão)
Font
e: D
ados
bás
icos
: Ins
titut
o B
rasi
leiro
de
Geo
graf
ia e
Est
atís
tica
(IBG
E),
Cen
so D
emog
ráfic
o, M
inas
Ger
ais,
199
1, 2
000,
201
0; P
roje
ção
da
Pop
ulaç
ão p
or S
exo
e Id
ade
2013
. Ela
bor
ação
: Fu
ndaç
ão J
oão
Pin
heiro
(FJP
), C
entr
o d
e E
stat
ístic
a e
Info
rmaç
ões
(CE
I).
(1) I
nfor
maç
ões
retir
adas
da
Pro
jeçã
o d
a P
opul
ação
por
Sex
o e
Idad
e 20
13.
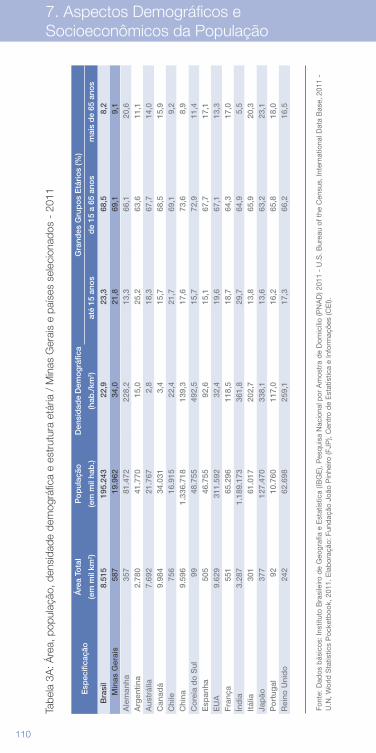
110 111
7. Aspectos Demográficos e Socioeconômicos da População
Tabe
la 3
A: Á
rea,
pop
ulaç
ão, d
ensi
dade
dem
ográ
fica
e es
trut
ura
etár
ia /
Min
as G
erai
s e
país
es s
elec
iona
dos
- 20
11
Esp
ecifi
caçã
oÁ
rea
Tota
lP
op
ulaç
ãoD
ensi
dad
e D
emo
grá
fica
Gra
ndes
Gru
po
s E
tári
os
(%)
(em
mil
km2 )
(em
mil
hab
.)(h
ab./
km2 )
até
15 a
nos
de
15 a
65
ano
sm
ais
de
65 a
nos
B
rasi
l8.
515
195.
243
22,9
23,3
68,5
8,2
Min
as G
erai
s58
719
.962
34,0
21,8
69,1
9,1
Ale
man
ha
357
81.4
7222
8,2
13,3
66,1
20,6
Arg
entin
a2.
780
41.7
7015
,025
,263
,611
,1A
ustr
ália
7.69
221
.767
2,8
18,3
67,7
14,0
Can
adá
9.98
434
.031
3,4
15,7
68,5
15,9
Chi
le75
616
.915
22,4
21,7
69,1
9,2
Chi
na9.
596
1.33
6.71
813
9,3
17,6
73,6
8,9
Co
reia
do
Sul
9948
.755
492,
515
,772
,911
,4E
span
ha50
546
.755
92,6
15,1
67,7
17,1
EU
A9.
629
311.
592
32,4
19,6
67,1
13,3
Fra
nça
551
65.2
9611
8,5
18,7
64,3
17,0
Índ
ia3.
287
1.18
9.17
336
1,8
29,7
64,9
5,5
Itál
ia30
161
.017
202,
713
,865
,920
,3Ja
pão
377
127.
470
338,
113
,663
,223
,1P
ort
ugal
9210
.760
117,
016
,265
,818
,0R
eino
Uni
do
242
62.6
9825
9,1
17,3
66,2
16,5
Font
e: D
ados
bás
icos
: Ins
titut
o B
rasi
leiro
de
Geo
graf
ia e
Est
atís
tica
(IBG
E),
Pes
qui
sa N
acio
nal p
or A
mos
tra
de
Dom
icíli
o (P
NA
D) 2
011
- U
.S. B
urea
u of
the
Cen
sus,
Inte
rnat
iona
l Dat
a B
ase,
201
1 -
U.N
, Wor
ld S
tatis
tics
Poc
ketb
ook,
201
1. E
lab
oraç
ão: F
und
ação
Joã
o P
inhe
iro (F
JP),
Cen
tro
de
Est
atís
tica
e In
form
açõe
s (C
EI).
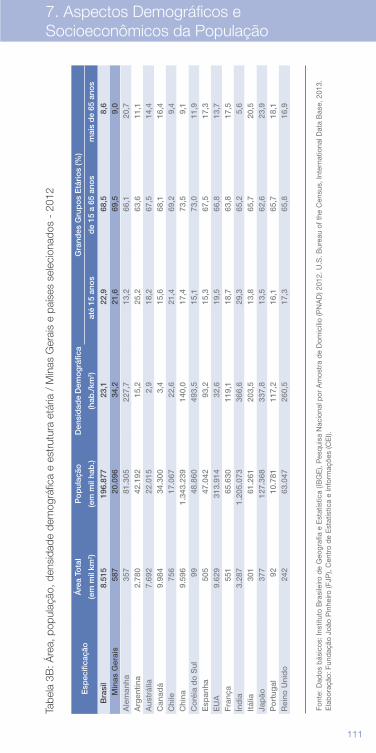
110 111
7. Aspectos Demográficos e Socioeconômicos da População
Tabe
la 3
B: Á
rea,
pop
ulaç
ão, d
ensi
dade
dem
ográ
fica
e es
trut
ura
etár
ia /
Min
as G
erai
s e
país
es s
elec
iona
dos
- 20
12
Esp
ecifi
caçã
oÁ
rea
Tota
lP
op
ulaç
ãoD
ensi
dad
e D
emo
grá
fica
Gra
ndes
Gru
po
s E
tári
os
(%)
(em
mil
km2 )
(em
mil
hab
.)(h
ab./
km2 )
até
15 a
nos
de
15 a
65
ano
sm
ais
de
65 a
nos
B
rasi
l8.
515
196.
877
23,1
22,9
68,5
8,6
Min
as G
erai
s58
720
.096
34,2
21,6
69,5
9,0
Ale
man
ha
357
81.3
0522
7,7
13,2
66,1
20,7
Arg
entin
a2.
780
42.1
9215
,225
,263
,611
,1A
ustr
ália
7.69
222
.015
2,9
18,2
67,5
14,4
Can
adá
9.98
434
.300
3,4
15,6
68,1
16,4
Chi
le75
617
.067
22,6
21,4
69,2
9,4
Chi
na9.
596
1.34
3.23
914
0,0
17,4
73,5
9,1
Co
réia
do
Sul
9948
.860
493,
515
,173
,011
,9E
span
ha50
547
.042
93,2
15,3
67,5
17,3
EU
A9.
629
313.
914
32,6
19,5
66,8
13,7
Fra
nça
551
65.6
3011
9,1
18,7
63,8
17,5
Índ
ia3.
287
1.20
5.07
336
6,6
29,3
65,2
5,6
Itál
ia30
161
.261
203,
513
,865
,720
,5Ja
pão
377
127.
368
337,
813
,562
,623
,9P
ort
ugal
9210
.781
117,
216
,165
,718
,1R
eino
Uni
do
242
63.0
4726
0,5
17,3
65,8
16,9
Font
e: D
ados
bás
icos
: Ins
titut
o B
rasi
leiro
de
Geo
graf
ia e
Est
atís
tica
(IBG
E),
Pes
qui
sa N
acio
nal p
or A
mos
tra
de
Dom
icíli
o (P
NA
D) 2
012.
U.S
. Bur
eau
of t
he C
ensu
s, In
tern
atio
nal D
ata
Bas
e, 2
013.
E
lab
oraç
ão: F
und
ação
Joã
o P
inhe
iro (F
JP),
Cen
tro
de
Est
atís
tica
e In
form
açõe
s (C
EI).
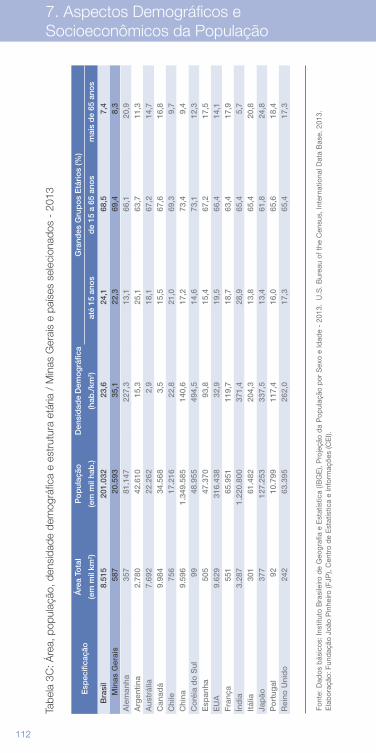
112 113
7. Aspectos Demográficos e Socioeconômicos da População
Tabe
la 3
C: Á
rea,
pop
ulaç
ão, d
ensi
dade
dem
ográ
fica
e es
trut
ura
etár
ia /
Min
as G
erai
s e
país
es s
elec
iona
dos
- 20
13
Esp
ecifi
caçã
oÁ
rea
Tota
lP
op
ulaç
ãoD
ensi
dad
e D
emo
grá
fica
Gra
ndes
Gru
po
s E
tári
os
(%)
(em
mil
km2 )
(em
mil
hab
.)(h
ab./
km2 )
até
15 a
nos
de
15 a
65
ano
sm
ais
de
65 a
nos
B
rasi
l8.
515
201.
032
23,6
24,1
68,5
7,4
Min
as G
erai
s58
720
.593
35,1
22,3
69,4
8,3
Ale
man
ha
357
81.1
4722
7,3
13,1
66,1
20,9
Arg
entin
a2.
780
42.6
1015
,325
,163
,711
,3A
ustr
ália
7.69
222
.262
2,9
18,1
67,2
14,7
Can
adá
9.98
434
.568
3,5
15,5
67,6
16,8
Chi
le75
617
.216
22,8
21,0
69,3
9,7
Chi
na9.
596
1.34
9.58
514
0,6
17,2
73,4
9,4
Co
réia
do
Sul
9948
.955
494,
514
,673
,112
,3E
span
ha50
547
.370
93,8
15,4
67,2
17,5
EU
A9.
629
316.
438
32,9
19,5
66,4
14,1
Fra
nça
551
65.9
5111
9,7
18,7
63,4
17,9
Índ
ia3.
287
1.22
0.80
037
1,4
28,9
65,4
5,7
Itál
ia30
161
.482
204,
313
,865
,420
,8Ja
pão
377
127.
253
337,
513
,461
,824
,8P
ort
ugal
9210
.799
117,
416
,065
,618
,4R
eino
Uni
do
242
63.3
9526
2,0
17,3
65,4
17,3
Font
e: D
ados
bás
icos
: Ins
titut
o B
rasi
leiro
de
Geo
graf
ia e
Est
atís
tica
(IBG
E),
Pro
jeçã
o d
a P
opul
ação
por
Sex
o e
Idad
e -
2013
. U
.S. B
urea
u of
the
Cen
sus,
Inte
rnat
iona
l Dat
a B
ase,
201
3.
Ela
bor
ação
: Fun
daç
ão J
oão
Pin
heiro
(FJP
), C
entr
o d
e E
stat
ístic
a e
Info
rmaç
ões
(CE
I).
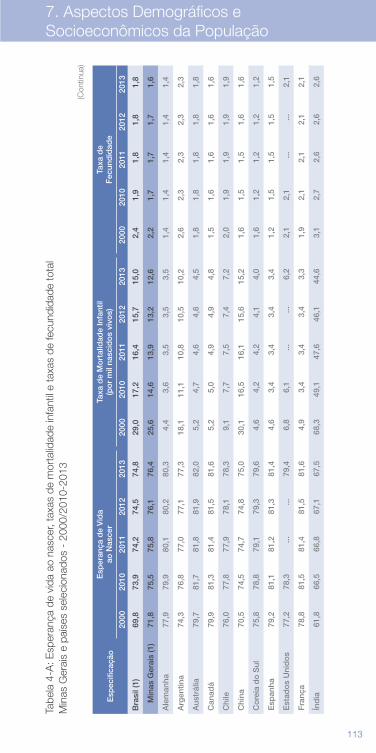
112 113
7. Aspectos Demográficos e Socioeconômicos da População
Tabe
la 4
-A: E
sper
ança
de
vida
ao
nasc
er, t
axas
de
mor
talid
ade
infa
ntil
e ta
xas
de fe
cund
idad
e to
tal
Min
as G
erai
s e
país
es s
elec
iona
dos
- 20
00/2
010-
2013
Esp
ecifi
caçã
oE
sper
ança
de
Vid
a ao
Nas
cer
Ta
xa d
e M
ort
alid
ade
Infa
ntil
(po
r m
il na
scid
os
vivo
s)
Taxa
de
Fec
und
idad
e
2000
2010
2011
2012
2013
20
0020
1020
1120
1220
13
2000
2010
2011
2012
2013
Bra
sil (
1)69
,873
,974
,274
,574
,829
,017
,216
,415
,715
,02,
41,
91,
81,
81,
8
M
inas
Ger
ais
(1)
71,8
75,5
75,8
76,1
76,4
25,6
14,6
13,9
13,2
12,6
2,2
1,7
1,7
1,7
1,6
Ale
man
ha77
,979
,980
,180
,280
,34,
43,
63,
53,
53,
51,
41,
41,
41,
41,
4
Arg
entin
a 74
,376
,877
,077
,177
,318
,111
,110
,810
,510
,22,
62,
32,
32,
32,
3
Aus
trál
ia79
,781
,781
,881
,982
,05,
24,
74,
64,
64,
51,
81,
81,
81,
81,
8
Can
adá
79,9
81,3
81,4
81,5
81,6
5,2
5,0
4,9
4,9
4,8
1,5
1,6
1,6
1,6
1,6
Chi
le76
,077
,877
,978
,178
,39,
17,
77,
57,
47,
22,
01,
91,
91,
91,
9
Chi
na70
,574
,574
,774
,875
,030
,116
,516
,115
,615
,21,
61,
51,
51,
61,
6
Co
reia
do
Sul
75,8
78,8
79,1
79,3
79,6
4,6
4,2
4,2
4,1
4,0
1,6
1,2
1,2
1,2
1,2
Esp
anha
79,2
81,1
81,2
81,3
81,4
4,6
3,4
3,4
3,4
3,4
1,2
1,5
1,5
1,5
1,5
Est
ado
s U
nid
os
77,2
78,3
......
79,4
6,8
6,1
......
6,2
2,1
2,1
......
2,1
Fra
nça
78,8
81,5
81,4
81,5
81,6
4,9
3,4
3,4
3,4
3,3
1,9
2,1
2,1
2,1
2,1
Índ
ia61
,866
,566
,867
,167
,568
,349
,147
,646
,144
,63,
12,
72,
62,
62,
6
(Con
tinua
)
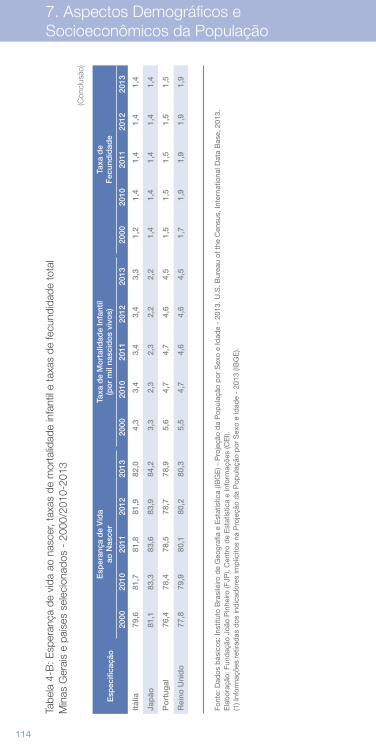
114 115
7. Aspectos Demográficos e Socioeconômicos da População
Font
e: D
ados
bás
icos
: Ins
titut
o B
rasi
leiro
de
Geo
graf
ia e
Est
atís
tica
(IBG
E) -
Pro
jeçã
o d
a P
opul
ação
por
Sex
o e
Idad
e -
2013
. U.S
. Bur
eau
of t
he C
ensu
s, In
tern
atio
nal D
ata
Bas
e, 2
013.
E
lab
oraç
ão: F
und
ação
Joã
o P
inhe
iro (F
JP),
Cen
tro
de
Est
atís
tica
e In
form
açõe
s (C
EI).
(1
) Inf
orm
açõe
s re
tirad
as d
os in
dic
ador
es im
plíc
itos
na P
roje
ção
da
Pop
ulaç
ão p
or S
exo
e Id
ade
- 20
13 (I
BG
E).
Tabe
la 4
-B: E
sper
ança
de
vida
ao
nasc
er, t
axas
de
mor
talid
ade
infa
ntil
e ta
xas
de fe
cund
idad
e to
tal
Min
as G
erai
s e
país
es s
elec
iona
dos
- 20
00/2
010-
2013
Esp
ecifi
caçã
oE
sper
ança
de
Vid
a ao
Nas
cer
Ta
xa d
e M
ort
alid
ade
Infa
ntil
(po
r m
il na
scid
os
vivo
s)
Taxa
de
Fec
und
idad
e
2000
2010
2011
2012
2013
20
0020
1020
1120
1220
13
2000
2010
2011
2012
2013
Itál
ia79
,681
,781
,881
,982
,04,
33,
43,
43,
43,
31,
21,
41,
41,
41,
4
Jap
ão81
,183
,383
,683
,984
,23,
32,
32,
32,
22,
21,
41,
41,
41,
41,
4
Po
rtug
al76
,478
,478
,578
,778
,95,
64,
74,
74,
64,
51,
51,
51,
51,
51,
5
Rei
no U
nid
o77
,879
,980
,180
,280
,35,
54,
74,
64,
64,
51,
71,
91,
91,
91,
9
(Con
clus
ão)
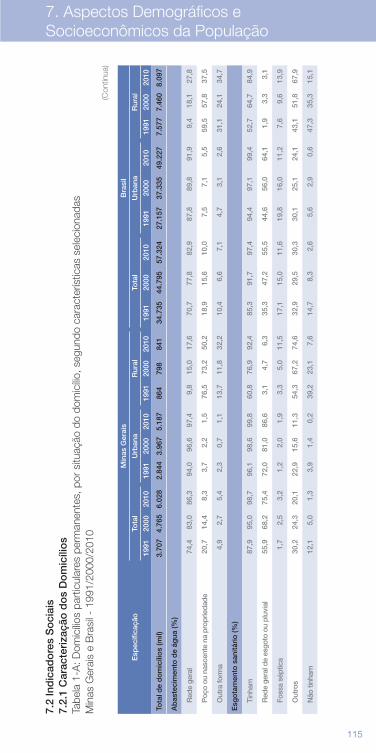
114 115
7. Aspectos Demográficos e Socioeconômicos da População
7.2
Ind
icad
ore
s S
oci
ais
7.2.
1 C
arac
teri
zaçã
o d
os
Do
mic
ílio
sTa
bela
1-A
: Dom
icílio
s pa
rtic
ular
es p
erm
anen
tes,
por
situ
ação
do
dom
icílio
, seg
undo
car
acte
rístic
as s
elec
iona
das
Min
as G
erai
s e
Bra
sil -
199
1/20
00/2
010
Esp
ecifi
caçã
o
M
inas
Ger
ais
Bra
sil
Tota
lU
rban
aR
ural
Tota
lU
rban
aR
ural
1991
2000
2010
1991
2000
2010
1991
2000
2010
1991
2000
2010
1991
2000
2010
1991
2000
2010
Tota
l de
do
mic
ílio
s (m
il)3.
707
4.76
56.
028
2.84
43.
967
5.18
786
479
884
134
.735
44.7
9557
.324
27.1
5737
.335
49.2
277.
577
7.46
08.
097
Ab
aste
cim
ento
de
água
(%)
R
ede
gera
l74
,483
,086
,394
,096
,697
,49,
815
,017
,670
,777
,882
,987
,889
,891
,99,
418
,127
,8
P
oço
ou n
asce
nte
na p
ropr
ieda
de20
,714
,48,
33,
72,
21,
576
,573
,250
,218
,915
,610
,07,
57,
15,
559
,557
,837
,5
O
utra
form
a4,
92,
75,
42,
30,
71,
113
,711
,832
,210
,46,
67,
14,
73,
12,
631
,124
,134
,7
Esg
ota
men
to s
anitá
rio
(%)
Ti
nham
87,9
95,0
98,7
96,1
98,6
99,8
60,8
76,9
92,4
85,3
91,7
97,4
94,4
97,1
99,4
52,7
64,7
84,9
R
ede
gera
l de
esgo
to o
u pl
uvia
l55
,968
,275
,472
,081
,086
,63,
14,
76,
335
,347
,255
,544
,656
,064
,11,
93,
33,
1
Fo
ssa
sépt
ica
1,7
2,5
3,2
1,2
2,0
1,9
3,3
5,0
11,5
17,1
15,0
11,6
19,8
16,0
11,2
7,6
9,6
13,9
O
utro
s30
,224
,320
,122
,915
,611
,354
,367
,274
,632
,929
,530
,330
,125
,124
,143
,151
,867
,9
N
ão ti
nham
12,1
5,0
1,3
3,9
1,4
0,2
39,2
23,1
7,6
14,7
8,3
2,6
5,6
2,9
0,6
47,3
35,3
15,1
(Con
tinua
)
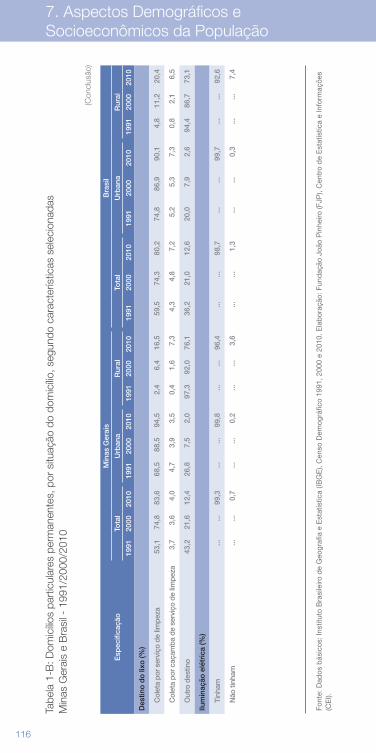
116 117
7. Aspectos Demográficos e Socioeconômicos da População
Esp
ecifi
caçã
o
M
inas
Ger
ais
Bra
sil
Tota
lU
rban
aR
ural
Tota
lU
rban
aR
ural
1991
2000
2010
1991
2000
2010
1991
2000
2010
1991
2000
2010
1991
2000
2010
1991
2000
2010
Des
tino
do
lixo
(%)
C
olet
a po
r ser
viço
de
limpe
za53
,174
,883
,668
,588
,594
,52,
46,
416
,559
,574
,380
,274
,886
,990
,14,
811
,220
,4
C
olet
a po
r caç
amba
de
serv
iço
de li
mpe
za3,
73,
64,
04,
73,
93,
50,
41,
67,
34,
34,
87,
25,
25,
37,
30,
82,
16,
5
O
utro
des
tino
43,2
21,6
12,4
26,8
7,5
2,0
97,3
92,0
76,1
36,2
21,0
12,6
20,0
7,9
2,6
94,4
86,7
73,1
Ilum
inaç
ão e
létr
ica
(%)
Ti
nham
......
99,3
......
99,8
......
96,4
......
98,7
......
99,7
......
92,6
N
ão ti
nham
......
0,7
......
0,2
......
3,6
......
1,3
......
0,3
......
7,4
(Con
clus
ão)
Tabe
la 1
-B: D
omic
ílios
part
icul
ares
per
man
ente
s, p
or s
ituaç
ão d
o do
mic
ílio, s
egun
do c
arac
terís
ticas
sel
ecio
nada
sM
inas
Ger
ais
e B
rasi
l - 1
991/
2000
/201
0
Font
e: D
ados
bás
icos
: Ins
titut
o B
rasi
leiro
de
Geo
graf
ia e
Est
atís
tica
(IBG
E),
Cen
so D
emog
ráfic
o 19
91, 2
000
e 20
10. E
lab
oraç
ão: F
und
ação
Joã
o P
inhe
iro (F
JP),
Cen
tro
de
Est
atís
tica
e In
form
açõe
s (C
EI).
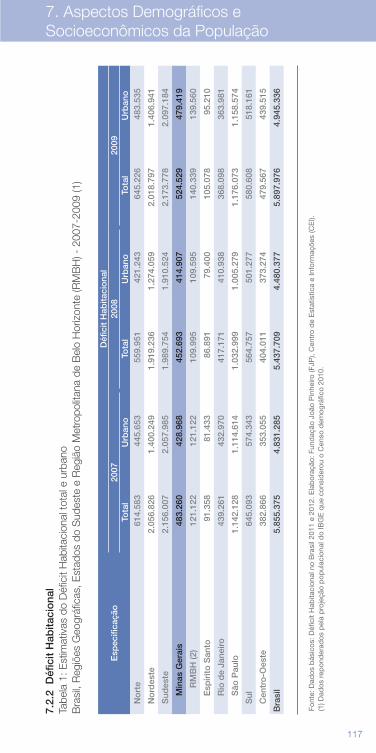
116 117
7. Aspectos Demográficos e Socioeconômicos da População
Esp
ecifi
caçã
o
Déf
icit
Hab
itaci
ona
l
2007
2008
2009
Tota
lU
rban
oTo
tal
Urb
ano
Tota
lU
rban
o
No
rte
614.
583
445.
653
559.
951
421.
243
645.
226
483.
535
N
ord
este
2.05
6.82
61.
400.
249
1.91
9.23
61.
274.
059
2.01
8.79
71.
406.
941
S
udes
te2.
156.
007
2.05
7.98
51.
989.
754
1.91
0.52
42.
173.
778
2.09
7.18
4
Min
as G
erai
s48
3.26
042
8.96
8
452.
693
414.
907
52
4.52
947
9.41
9
R
MB
H (2
)12
1.12
212
1.12
210
9.99
510
9.59
514
0.33
913
9.56
0
Esp
írito
San
to91
.358
81.4
3386
.891
79.4
0010
5.07
895
.210
Rio
de
Jane
iro43
9.26
143
2.97
041
7.17
141
0.93
836
8.09
836
3.98
1
São
Pau
lo1.
142.
128
1.11
4.61
41.
032.
999
1.00
5.27
91.
176.
073
1.15
8.57
4
S
ul64
5.09
357
4.34
356
4.75
750
1.27
758
0.60
851
8.16
1
C
entr
o-O
este
382.
866
353.
055
404.
011
373.
274
479.
567
439.
515
Bra
sil
5.85
5.37
54.
831.
285
5.43
7.70
94.
480.
377
5.89
7.97
64.
945.
336
Font
e: D
ados
bás
icos
: Déf
icit
Hab
itaci
onal
no
Bra
sil 2
011
e 20
12. E
lab
oraç
ão: F
und
ação
Joã
o P
inhe
iro (F
JP),
Cen
tro
de
Est
atís
tica
e In
form
açõe
s (C
EI).
(1
) Dad
os r
epon
der
ados
pel
a p
roje
ção
pop
ulac
iona
l do
IBG
E q
ue c
onsi
der
ou o
Cen
so d
emog
ráfic
o 20
10.
7.2.
2 D
éfic
it H
abita
cio
nal
Tabe
la 1
: Est
imat
ivas
do
Déf
icit
Hab
itaci
onal
tota
l e u
rban
oB
rasi
l, R
egiõ
es G
eogr
áfic
as, E
stad
os d
o S
udes
te e
Reg
ião
Met
ropo
litan
a de
Bel
o H
oriz
onte
(RM
BH
) - 2
007-
2009
(1)
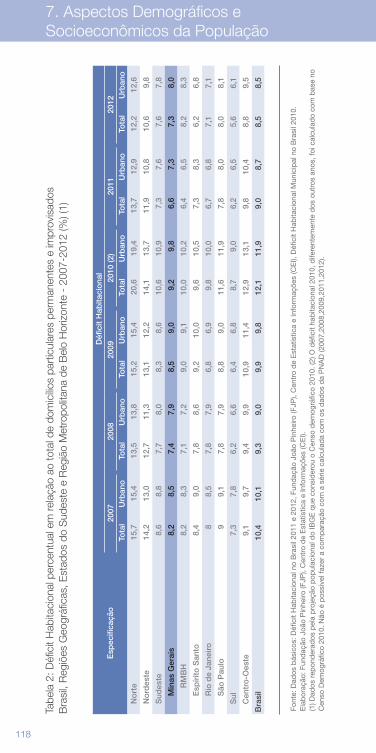
118 119
7. Aspectos Demográficos e Socioeconômicos da População
Esp
ecifi
caçã
oD
éfic
it H
abita
cio
nal
2007
2008
2009
2010
(2)
2011
2012
Tota
lU
rban
oTo
tal
Urb
ano
Tota
lU
rban
oTo
tal
Urb
ano
Tota
lU
rban
oTo
tal
Urb
ano
N
ort
e15
,715
,413
,513
,815
,215
,420
,619
,413
,712
,912
,212
,6
N
ord
este
14,2
13,0
12,7
11,3
13,1
12,2
14,1
13,7
11,9
10,8
10,6
9,8
S
udes
te8,
68,
87,
78,
08,
38,
610
,610
,97,
37,
67,
67,
8
Min
as G
erai
s8,
28,
5
7,4
7,9
8,
59,
0
9,2
9,8
6,
67,
3
7,3
8,0
R
MB
H8,
28,
37,
17,
29,
09,
110
,010
,26,
46,
58,
28,
3
Esp
írito
San
to8,
49,
07,
88,
69,
210
,09,
610
,57,
38,
36,
26,
8
Rio
de
Jane
iro8
8,5
7,8
7,9
6,8
6,9
9,8
10,0
6,7
6,8
7,1
7,1
São
Pau
lo9
9,1
7,8
7,9
8,8
9,0
11,6
11,9
7,8
8,0
8,0
8,1
S
ul7,
37,
86,
26,
66,
46,
88,
79,
06,
26,
55,
66,
1
C
entr
o-O
este
9,1
9,7
9,4
9,9
10,9
11,4
12,9
13,1
9,8
10,4
8,8
9,5
Bra
sil
10,4
10,1
9,3
9,0
9,9
9,8
12,1
11,9
9,0
8,7
8,5
8,5
Font
e: D
ados
bás
icos
: Déf
icit
Hab
itaci
onal
no
Bra
sil 2
011
e 20
12, F
und
ação
Joã
o P
inhe
iro (F
JP),
Cen
tro
de
Est
atís
tica
e In
form
açõe
s (C
EI),
Déf
icit
Hab
itaci
onal
Mun
icip
al n
o B
rasi
l 201
0.
Ela
bor
ação
: Fun
daç
ão J
oão
Pin
heiro
(FJP
), C
entr
o d
e E
stat
ístic
a e
Info
rmaç
ões
(CE
I).
(1) D
ados
rep
ond
erad
os p
ela
pro
jeçã
o p
opul
acio
nal d
o IB
GE
que
con
sid
erou
o C
enso
dem
ográ
fico
2010
. (2)
O d
éfic
it ha
bita
cion
al 2
010,
dife
rent
emen
te d
os o
utro
s an
os, f
oi c
alcu
lad
o co
m b
ase
no
Cen
so D
emog
ráfic
o 20
10. N
ão é
pos
síve
l faz
er a
com
par
ação
com
a s
érie
cal
cula
da
com
os
dad
os d
a P
NA
D (2
007,
2008
,200
9,20
11,2
012)
.
Tabe
la 2
: Déf
icit
Hab
itaci
onal
per
cent
ual e
m re
laçã
o ao
tota
l de
dom
icílio
s pa
rtic
ular
es p
erm
anen
tes
e im
prov
isad
osB
rasi
l, R
egiõ
es G
eogr
áfic
as, E
stad
os d
o S
udes
te e
Reg
ião
Met
ropo
litan
a de
Bel
o H
oriz
onte
- 2
007-
2012
(%) (
1)
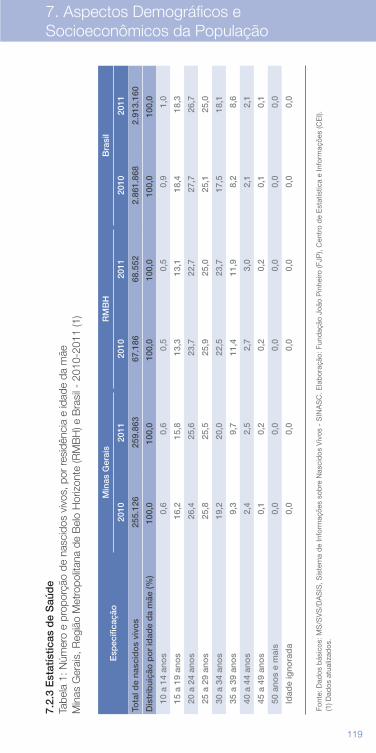
118 119
7. Aspectos Demográficos e Socioeconômicos da População
Font
e: D
ados
bás
icos
: Déf
icit
Hab
itaci
onal
no
Bra
sil 2
011
e 20
12, F
und
ação
Joã
o P
inhe
iro (F
JP),
Cen
tro
de
Est
atís
tica
e In
form
açõe
s (C
EI),
Déf
icit
Hab
itaci
onal
Mun
icip
al n
o B
rasi
l 201
0.
Ela
bor
ação
: Fun
daç
ão J
oão
Pin
heiro
(FJP
), C
entr
o d
e E
stat
ístic
a e
Info
rmaç
ões
(CE
I).
(1) D
ados
rep
ond
erad
os p
ela
pro
jeçã
o p
opul
acio
nal d
o IB
GE
que
con
sid
erou
o C
enso
dem
ográ
fico
2010
. (2)
O d
éfic
it ha
bita
cion
al 2
010,
dife
rent
emen
te d
os o
utro
s an
os, f
oi c
alcu
lad
o co
m b
ase
no
Cen
so D
emog
ráfic
o 20
10. N
ão é
pos
síve
l faz
er a
com
par
ação
com
a s
érie
cal
cula
da
com
os
dad
os d
a P
NA
D (2
007,
2008
,200
9,20
11,2
012)
.
Esp
ecifi
caçã
oM
inas
Ger
ais
RM
BH
Bra
sil
2010
2011
2010
2011
2010
2011
Tota
l de
nasc
ido
s vi
vos
255.
126
259.
863
67
.186
68.5
52
2.86
1.86
82.
913.
160
Dis
trib
uiçã
o p
or
idad
e d
a m
ãe (%
)10
0,0
100,
0
100,
010
0,0
10
0,0
100,
0
10
a 1
4 an
os
0,6
0,6
0,5
0,5
0,9
1,0
15
a 1
9 an
os
16,2
15,8
13,3
13,1
18,4
18,3
20
a 2
4 an
os
26,4
25,6
23,7
22,7
27,7
26,7
25
a 2
9 an
os
25,8
25,5
25,9
25,0
25,1
25,0
30
a 3
4 an
os
19,2
20,0
22,5
23,7
17,5
18,1
35
a 3
9 an
os
9,3
9,7
11,4
11,9
8,2
8,6
40
a 4
4 an
os
2,4
2,5
2,7
3,0
2,1
2,1
45
a 4
9 an
os
0,1
0,2
0,2
0,2
0,1
0,1
50
ano
s e
mai
s 0,
00,
00,
00,
00,
00,
0
Id
ade
igno
rad
a 0,
00,
00,
00,
00,
00,
0
Font
e: D
ados
bás
icos
: MS
/SV
S/D
AS
IS, S
iste
ma
de
Info
rmaç
ões
sob
re N
asci
dos
Viv
os -
SIN
AS
C. E
lab
oraç
ão: F
und
ação
Joã
o P
inhe
iro (F
JP),
Cen
tro
de
Est
atís
tica
e In
form
açõe
s (C
EI).
(1
) Dad
os a
tual
izad
os.
7.2.
3 E
stat
ístic
as d
e S
aúd
eTa
bela
1: N
úmer
o e
prop
orçã
o de
nas
cido
s vi
vos,
por
resi
dênc
ia e
idad
e da
mãe
Min
as G
erai
s, R
egiã
o M
etro
polit
ana
de B
elo
Hor
izon
te (R
MB
H) e
Bra
sil -
201
0-20
11 (1
)
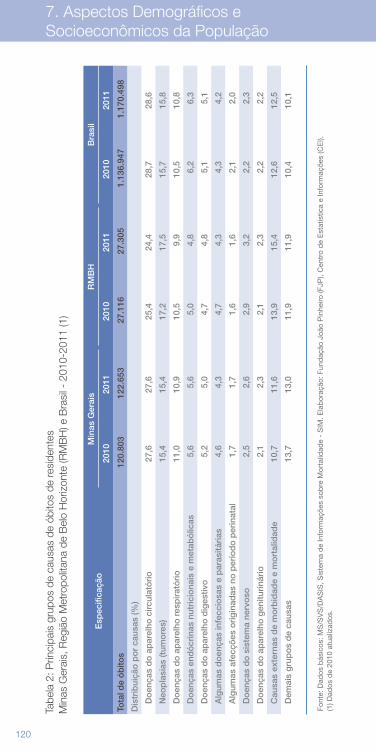
120 121
7. Aspectos Demográficos e Socioeconômicos da População
Esp
ecifi
caçã
oM
inas
Ger
ais
RM
BH
Bra
sil
2010
2011
2010
2011
2010
2011
Tota
l de
ób
itos
120
.803
1
22.6
53
2
7.11
6 2
7.30
5
1.1
36.9
47
1.1
70.4
98
Dis
trib
uiçã
o p
or
caus
as (%
)
D
oen
ças
do
ap
arel
ho c
ircul
ató
rio
27,6
27,6
25,4
24,4
28,7
28,6
N
eop
lasi
as (t
umo
res)
15,4
15,4
17,2
17,5
15,7
15,8
D
oen
ças
do
ap
arel
ho r
esp
irat
óri
o11
,010
,910
,59,
910
,510
,8
D
oen
ças
end
ócr
inas
nut
rici
ona
is e
met
abó
licas
5,6
5,6
5,0
4,8
6,2
6,3
D
oen
ças
do
ap
arel
ho d
iges
tivo
5,2
5,0
4,7
4,8
5,1
5,1
A
lgum
as d
oen
ças
infe
ccio
sas
e p
aras
itári
as4,
64,
34,
74,
34,
34,
2
A
lgum
as a
fecç
ões
ori
gin
adas
no
per
íod
o p
erin
atal
1,7
1,7
1,6
1,6
2,1
2,0
D
oen
ças
do
sis
tem
a ne
rvo
so2,
52,
62,
93,
22,
22,
3
D
oen
ças
do
ap
arel
ho g
enitu
riná
rio
2,1
2,3
2,1
2,3
2,2
2,2
C
ausa
s ex
tern
as d
e m
orb
idad
e e
mo
rtal
idad
e10
,711
,613
,915
,412
,612
,5
D
emai
s g
rup
os
de
caus
as13
,713
,011
,911
,910
,410
,1
Font
e: D
ados
bás
icos
: MS
/SV
S/D
AS
IS, S
iste
ma
de
Info
rmaç
ões
sob
re M
orta
lidad
e -
SIM
. Ela
bor
ação
: Fun
daç
ão J
oão
Pin
heiro
(FJP
), C
entr
o d
e E
stat
ístic
a e
Info
rmaç
ões
(CE
I).
(1) D
ados
de
2010
atu
aliz
ados
.
Tabe
la 2
: Prin
cipa
is g
rupo
s de
cau
sas
de ó
bito
s de
resi
dent
esM
inas
Ger
ais,
Reg
ião
Met
ropo
litan
a de
Bel
o H
oriz
onte
(RM
BH
) e B
rasi
l - 2
010-
2011
(1)
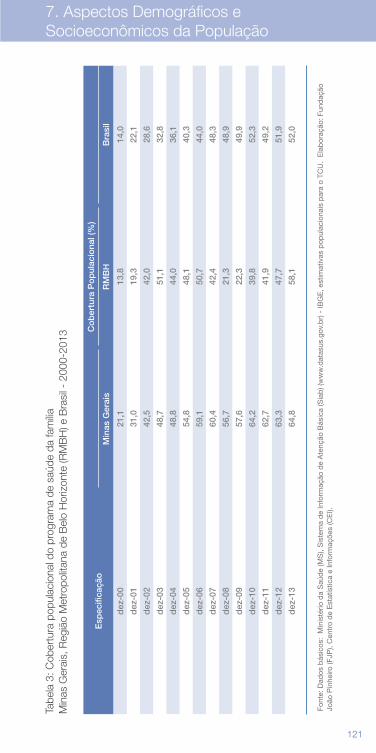
120 121
7. Aspectos Demográficos e Socioeconômicos da População
Font
e: D
ados
bás
icos
: MS
/SV
S/D
AS
IS, S
iste
ma
de
Info
rmaç
ões
sob
re M
orta
lidad
e -
SIM
. Ela
bor
ação
: Fun
daç
ão J
oão
Pin
heiro
(FJP
), C
entr
o d
e E
stat
ístic
a e
Info
rmaç
ões
(CE
I).
(1) D
ados
de
2010
atu
aliz
ados
.
Esp
ecifi
caçã
o
Co
ber
tura
Po
pul
acio
nal (
%)
Min
as G
erai
sR
MB
HB
rasi
l
dez
-00
21,1
13,8
14,0
dez
-01
31,0
19,3
22,1
dez
-02
42,5
42,0
28,6
dez
-03
48,7
51,1
32,8
dez
-04
48,8
44,0
36,1
dez
-05
54,8
48,1
40,3
dez
-06
59,1
50,7
44,0
dez
-07
60,4
42,4
48,3
dez
-08
56,7
21,3
48,9
dez
-09
57,6
22,3
49,9
dez
-10
64,2
39,8
52,3
dez
-11
62,7
41,9
49,2
dez
-12
63,3
47,7
51,9
dez
-13
64,8
58,1
52,0
Font
e: D
ados
bás
icos
: M
inis
tério
da
Saú
de
(MS
), S
iste
ma
de
Info
rmaç
ão d
e A
tenç
ão B
ásic
a (S
iab
) (w
ww
.dat
asus
.gov
.br)
- IB
GE
, est
imat
ivas
pop
ulac
iona
is p
ara
o TC
U.
Ela
bor
ação
: Fun
daç
ão
João
Pin
heiro
(FJP
), C
entr
o d
e E
stat
ístic
a e
Info
rmaç
ões
(CE
I).
Tabe
la 3
: Cob
ertu
ra p
opul
acio
nal d
o pr
ogra
ma
de s
aúde
da
fam
íliaM
inas
Ger
ais,
Reg
ião
Met
ropo
litan
a de
Bel
o H
oriz
onte
(RM
BH
) e B
rasi
l - 2
000-
2013
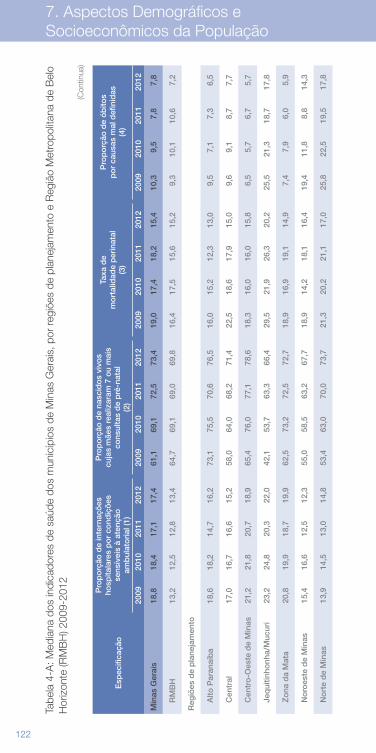
122 123
7. Aspectos Demográficos e Socioeconômicos da População
Tabe
la 4
-A: M
edia
na d
os in
dica
dore
s de
saú
de d
os m
unic
ípio
s de
Min
as G
erai
s, p
or re
giõe
s de
pla
neja
men
to e
Reg
ião
Met
ropo
litan
a de
Bel
o H
oriz
onte
(RM
BH
) 200
9-20
12
Esp
ecifi
caçã
o
Pro
po
rção
de
inte
rnaç
ões
ho
spita
lare
s p
or
cond
içõ
es
sens
ívei
s à
aten
ção
am
bul
ato
rial
(1)
P
rop
orç
ão d
e na
scid
os
vivo
s cu
jas
mãe
s re
aliz
aram
7 o
u m
ais
cons
ulta
s d
e p
ré-n
atal
(2
)
Ta
xa d
e m
ort
alid
ade
per
inat
al
(3)
P
rop
orç
ão d
e ó
bito
s p
or
caus
as m
al d
efin
idas
(4
)
2009
2010
2011
2012
20
0920
1020
1120
12
2009
2010
2011
2012
20
0920
1020
1120
12
Min
as G
erai
s18
,818
,417
,117
,461
,169
,172
,573
,419
,017
,418
,215
,410
,39,
57,
87,
8
R
MB
H13
,212
,512
,813
,464
,769
,169
,069
,816
,417
,515
,615
,29,
310
,110
,67,
2
Reg
iões
de
pla
neja
men
to
A
lto P
aran
aíb
a18
,618
,214
,716
,273
,175
,570
,676
,516
,015
,212
,313
,09,
57,
17,
36,
5
C
entr
al17
,016
,716
,615
,258
,064
,068
,271
,422
,518
,617
,915
,09,
69,
18,
77,
7
C
entr
o-O
este
de
Min
as21
,221
,820
,718
,965
,476
,077
,178
,618
,316
,016
,015
,86,
55,
76,
75,
7
Je
qui
tinho
nha/
Muc
uri
23,2
24,8
20,3
22,0
42,1
53,7
63,3
66,4
29,5
21,9
26,3
20,2
25,5
21,3
18,7
17,8
Z
ona
da
Mat
a20
,819
,918
,719
,962
,573
,272
,572
,718
,916
,919
,114
,97,
47,
96,
05,
9
N
oro
este
de
Min
as15
,416
,612
,512
,355
,058
,563
,267
,718
,914
,218
,116
,419
,411
,88,
814
,3
N
ort
e d
e M
inas
13,9
14,5
13,0
14,8
53,4
63,0
70,0
73,7
21,3
20,2
21,1
17,0
25,8
22,5
19,5
17,8
(Con
tinua
)
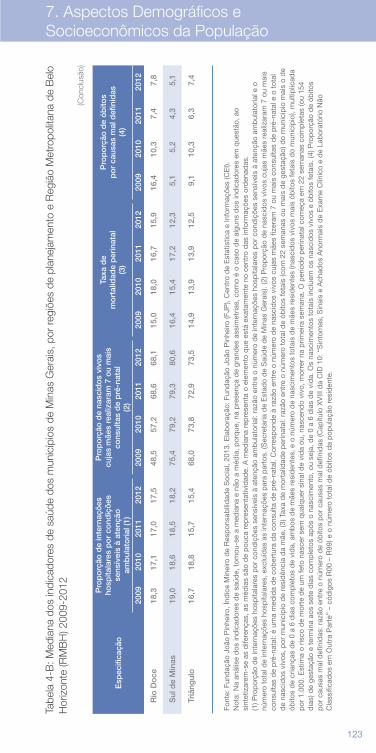
122 123
7. Aspectos Demográficos e Socioeconômicos da População
Tabe
la 4
-B: M
edia
na d
os in
dica
dore
s de
saú
de d
os m
unic
ípio
s de
Min
as G
erai
s, p
or re
giõe
s de
pla
neja
men
to e
Reg
ião
Met
ropo
litan
a de
Bel
o H
oriz
onte
(RM
BH
) 200
9-20
12
Esp
ecifi
caçã
o
Pro
po
rção
de
inte
rnaç
ões
ho
spita
lare
s p
or
cond
içõ
es
sens
ívei
s à
aten
ção
am
bul
ato
rial
(1)
P
rop
orç
ão d
e na
scid
os
vivo
s cu
jas
mãe
s re
aliz
aram
7 o
u m
ais
cons
ulta
s d
e p
ré-n
atal
(2
)
Ta
xa d
e m
ort
alid
ade
per
inat
al
(3)
P
rop
orç
ão d
e ó
bito
s p
or
caus
as m
al d
efin
idas
(4
)
2009
2010
2011
2012
20
0920
1020
1120
12
2009
2010
2011
2012
20
0920
1020
1120
12
R
io D
oce
18,3
17,1
17,0
17,5
48,5
57,2
68,6
68,1
15,0
18,0
16,7
15,9
16,4
10,3
7,4
7,8
S
ul d
e M
inas
19,0
18,6
18,5
18,2
75,4
79,2
79,3
80,6
16,4
15,4
17,2
12,3
5,1
5,2
4,3
5,1
Tr
iâng
ulo
16,7
18,8
15,7
15,4
68,0
73,8
72,9
73,5
14,9
13,9
13,9
12,5
9,1
10,3
6,3
7,4
(Con
clus
ão)
Font
e: F
und
ação
Joã
o P
inhe
iro, Í
ndic
e M
inei
ro d
e R
esp
onsa
bili
dad
e S
ocia
l, 20
13. E
lab
oraç
ão: F
und
ação
Joã
o P
inhe
iro (F
JP),
Cen
tro
de
Est
atís
tica
e In
form
açõe
s (C
EI).
N
ota:
Na
anál
ise
dos
ind
icad
ores
de
saúd
e, t
omou
-se
a m
edia
na e
não
a m
édia
, por
que
, na
pre
senç
a d
e gr
and
es a
ssim
etria
s, c
omo
é o
caso
de
algu
ns d
os in
dic
ador
es e
m q
uest
ão, a
o si
ntet
izar
em-s
e as
dife
renç
as, a
s m
édia
s sã
o d
e p
ouca
rep
rese
ntat
ivid
ade.
A m
edia
na r
epre
sent
a o
elem
ento
que
est
á ex
atam
ente
no
cent
ro d
as in
form
açõe
s or
den
adas
. (1
) Pro
por
ção
de
inte
rnaç
ões
hosp
itala
res
por
con
diç
ões
sens
ívei
s à
aten
ção
amb
ulat
oria
l: ra
zão
entr
e o
núm
ero
de
inte
rnaç
ões
hosp
itala
res
por
con
diç
ões
sens
ívei
s à
aten
ção
amb
ulat
oria
l e o
nú
mer
o to
tal d
e in
tern
açõe
s ho
spita
lare
s, e
xclu
ídas
as
inte
rnaç
ões
par
a p
arto
s. (S
ecre
taria
de
Est
ado
de
Saú
de
de
Min
as G
erai
s). (
2) P
rop
orçã
o d
e na
scid
os v
ivos
cuj
as m
ães
real
izar
am 7
ou
mai
s co
nsul
tas
de
pré
-nat
al: é
um
a m
edid
a d
e co
ber
tura
da
cons
ulta
de
pré
-nat
al. C
orre
spon
de
à ra
zão
entr
e o
núm
ero
de
nasc
idos
viv
os c
ujas
mãe
s fiz
eram
7 o
u m
ais
cons
ulta
s d
e p
ré-n
atal
e o
tot
al
de
nasc
idos
viv
os, p
or m
unic
ípio
de
resi
dên
cia
da
mãe
. (3)
Tax
a d
e m
orta
lidad
e p
erin
atal
: raz
ão e
ntre
o n
úmer
o to
tal d
e ób
itos
feta
is (c
om 2
2 se
man
as o
u m
ais
de
gest
ação
) do
mun
icíp
io m
ais
o d
e ób
itos
de
cria
nças
de
0 a
6 d
ias
com
ple
tos
de
vid
a, a
mb
os d
e m
ães
resi
den
tes,
e o
núm
ero
de
nasc
imen
tos
tota
is d
e m
ães
resi
den
tes
(nas
cid
os v
ivos
mai
s ób
itos
feta
is d
o m
unic
ípio
), m
ultip
licad
a p
or 1
.000
. Est
ima
o ris
co d
e m
orte
de
um fe
to n
asce
r se
m q
ualq
uer
sina
l de
vid
a ou
, nas
cend
o vi
vo, m
orre
r na
prim
eira
sem
ana.
O p
erío
do
per
inat
al c
omeç
a em
22
sem
anas
com
ple
tas
(ou
154
dia
s) d
e ge
staç
ão e
ter
min
a ao
s se
te d
ias
com
ple
tos
após
o n
asci
men
to, o
u se
ja, d
e 0
a 6
dia
s d
e vi
da.
Os
nasc
imen
tos
tota
is in
clue
m o
s na
scid
os v
ivos
e ó
bito
s fe
tais
. (4)
Pro
por
ção
de
óbito
s p
or c
ausa
s m
al d
efin
idas
: raz
ão e
ntre
o n
úmer
o d
e ób
itos
por
cau
sas
mal
def
inid
as (C
apítu
lo X
VIII
da
CID
10:
“S
into
mas
, Sin
ais
e A
chad
os A
norm
ais
de
Exa
me
Clín
ico
e d
e La
bor
atór
io N
ão
Cla
ssifi
cad
os e
m O
utra
Par
te”
– có
dig
os R
00 –
R99
) e o
núm
ero
tota
l de
óbito
s d
a p
opul
ação
res
iden
te.
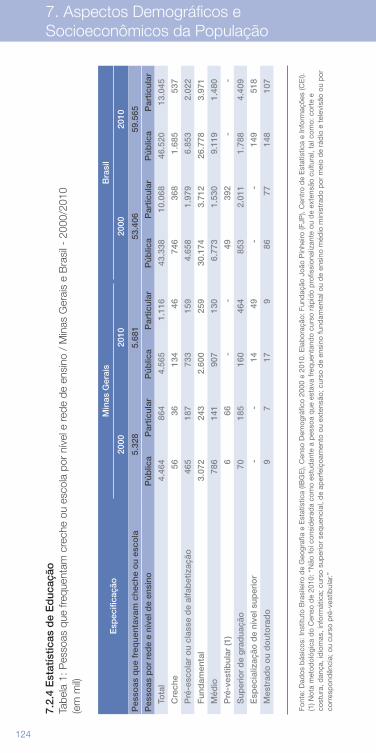
124 125
7. Aspectos Demográficos e Socioeconômicos da População
Esp
ecifi
caçã
oM
inas
Ger
ais
Bra
sil
2000
2010
2000
2010
Pes
soas
que
fre
que
ntav
am c
hech
e o
u es
cola
5.32
85.
681
53
.406
59.5
65
Pes
soas
po
r re
de
e ní
vel d
e en
sino
Púb
lica
Par
ticul
arP
úblic
aP
artic
ular
P
úblic
aP
artic
ular
Púb
lica
Par
ticul
ar
To
tal
4.46
486
44.
565
1.11
643
.338
10.0
6846
.520
13.0
45
C
rech
e56
3613
446
746
368
1.68
553
7
P
ré-e
sco
lar
ou
clas
se d
e al
fab
etiz
ação
465
187
733
159
4.65
81.
979
6.85
32.
022
F
und
amen
tal
3.07
224
32.
600
259
30.1
743.
712
26.7
783.
971
M
édio
786
141
907
130
6.77
31.
530
9.11
91.
480
P
ré-v
estib
ular
(1)
666
--
4939
2-
-
S
uper
ior
de
gra
dua
ção
7018
516
046
485
32.
011
1.78
84.
409
E
spec
ializ
ação
de
níve
l sup
erio
r-
-14
49-
-14
951
8
M
estr
ado
ou
do
uto
rad
o9
717
986
7714
810
7
Font
e: D
ados
bás
icos
: Ins
titut
o B
rasi
leiro
de
Geo
graf
ia e
Est
atís
tica
(IBG
E),
Cen
so D
emog
ráfic
o 20
00 e
201
0. E
lab
oraç
ão: F
und
ação
Joã
o P
inhe
iro (F
JP),
Cen
tro
de
Est
atís
tica
e In
form
açõe
s (C
EI).
(1
) Not
a m
etod
ológ
ica
do
Cen
so d
e 20
10: “
Não
foi c
onsi
der
ada
com
o es
tud
ante
a p
esso
a q
ue e
stav
a fr
eque
ntan
do
curs
o rá
pid
o p
rofis
sion
aliz
ante
ou
de
exte
nsão
cul
tura
l, ta
l com
o: c
orte
e
cost
ura,
dan
ça, i
dio
mas
, inf
orm
átic
a; c
urso
sup
erio
r se
que
ncia
l, d
e ap
erfe
içoa
men
to o
u ex
tens
ão; c
urso
de
ensi
no fu
ndam
enta
l ou
de
ensi
no m
édio
min
istr
ado
por
mei
o d
e rá
dio
e t
elev
isão
ou
por
co
rres
pon
dên
cia;
ou
curs
o p
ré-v
estib
ular
.”
7.2.
4 E
stat
ístic
as d
e E
duc
ação
Tabe
la 1
: Pes
soas
que
freq
uent
am c
rech
e ou
esc
ola
por
níve
l e re
de d
e en
sino
/ M
inas
Ger
ais
e B
rasi
l - 2
000/
2010
(e
m m
il)
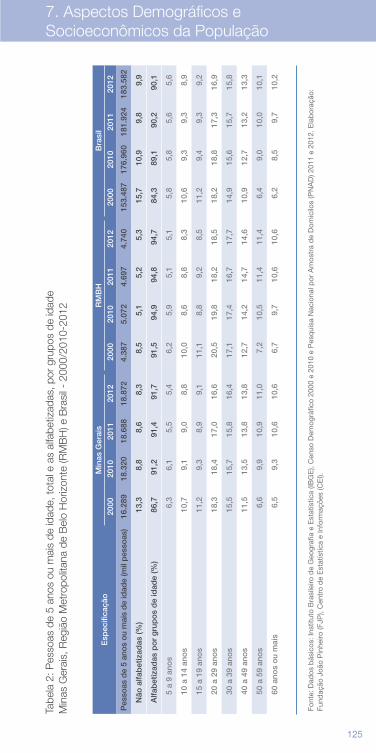
124 125
7. Aspectos Demográficos e Socioeconômicos da População
Font
e: D
ados
bás
icos
: Ins
titut
o B
rasi
leiro
de
Geo
graf
ia e
Est
atís
tica
(IBG
E),
Cen
so D
emog
ráfic
o 20
00 e
201
0. E
lab
oraç
ão: F
und
ação
Joã
o P
inhe
iro (F
JP),
Cen
tro
de
Est
atís
tica
e In
form
açõe
s (C
EI).
(1
) Not
a m
etod
ológ
ica
do
Cen
so d
e 20
10: “
Não
foi c
onsi
der
ada
com
o es
tud
ante
a p
esso
a q
ue e
stav
a fr
eque
ntan
do
curs
o rá
pid
o p
rofis
sion
aliz
ante
ou
de
exte
nsão
cul
tura
l, ta
l com
o: c
orte
e
cost
ura,
dan
ça, i
dio
mas
, inf
orm
átic
a; c
urso
sup
erio
r se
que
ncia
l, d
e ap
erfe
içoa
men
to o
u ex
tens
ão; c
urso
de
ensi
no fu
ndam
enta
l ou
de
ensi
no m
édio
min
istr
ado
por
mei
o d
e rá
dio
e t
elev
isão
ou
por
co
rres
pon
dên
cia;
ou
curs
o p
ré-v
estib
ular
.”
Font
e: D
ados
bás
icos
: Ins
titut
o B
rasi
leiro
de
Geo
graf
ia e
Est
atís
tica
(IBG
E),
Cen
so D
emog
ráfic
o 20
00 e
201
0 e
Pes
qui
sa N
acio
nal p
or A
mos
tra
de
Dom
icílo
s (P
NA
D) 2
011
e 20
12. E
lab
oraç
ão:
Fund
ação
Joã
o P
inhe
iro (F
JP),
Cen
tro
de
Est
atís
tica
e In
form
açõe
s (C
EI).
Tabe
la 2
: Pes
soas
de
5 an
os o
u m
ais
de id
ade,
tota
l e a
s al
fabe
tizad
as, p
or g
rupo
s de
idad
eM
inas
Ger
ais,
Reg
ião
Met
ropo
litan
a de
Bel
o H
oriz
onte
(RM
BH
) e B
rasi
l - 2
000/
2010
-201
2
Esp
ecifi
caçã
oM
inas
Ger
ais
R
MB
H
Bra
sil
2000
2010
2011
2012
20
0020
1020
1120
12
2000
2010
2011
2012
Pes
soas
de
5 an
os o
u m
ais
de
idad
e (m
il p
esso
as)
16.2
8918
.320
18.6
8818
.872
4.38
75.
072
4.69
74.
740
153.
487
176.
960
181.
924
183.
582
N
ão a
lfab
etiz
adas
(%)
13,3
8,8
8,6
8,3
8,5
5,1
5,2
5,3
15,7
10,9
9,8
9,9
A
lfab
etiz
adas
po
r g
rup
os
de
idad
e (%
)86
,791
,291
,491
,791
,594
,994
,894
,784
,389
,190
,290
,1
5 a
9 an
os
6,3
6,1
5,5
5,4
6,2
5,9
5,1
5,1
5,8
5,8
5,6
5,6
10 a
14
ano
s10
,79,
19,
08,
810
,08,
68,
88,
310
,69,
39,
38,
9
15 a
19
ano
s11
,29,
38,
99,
111
,18,
89,
28,
511
,29,
49,
39,
2
20 a
29
ano
s18
,318
,417
,016
,620
,519
,818
,218
,518
,218
,817
,316
,9
30 a
39
ano
s15
,515
,715
,816
,417
,117
,416
,717
,714
,915
,615
,715
,8
40 a
49
ano
s11
,513
,513
,813
,812
,714
,214
,714
,610
,912
,713
,213
,3
50 a
59
ano
s6,
69,
910
,911
,07,
210
,511
,411
,46,
49,
010
,010
,1
60 a
nos
ou
mai
s6,
59,
310
,610
,66,
79,
710
,610
,66,
28,
59,
710
,2
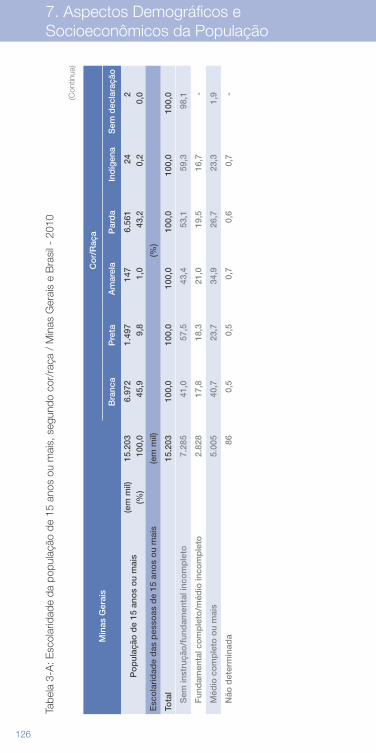
126 127
7. Aspectos Demográficos e Socioeconômicos da População
Min
as G
erai
s
C
or/
Raç
a
Bra
nca
Pre
taA
mar
ela
Par
da
Ind
ígen
aS
em d
ecla
raçã
o
Po
pul
ação
de
15 a
nos
ou
mai
s(e
m m
il)15
.203
6.97
21.
497
147
6.56
124
2(%
)10
0,0
45,9
9,8
1,0
43,2
0,2
0,0
Esc
ola
rid
ade
das
pes
soas
de
15 a
nos
ou
mai
s
(em
mil)
(%)
Tota
l
15.2
0310
0,0
100,
010
0,0
100,
010
0,0
100,
0
S
em in
stru
ção
/fun
dam
enta
l inc
om
ple
to
7.28
541
,057
,543
,453
,159
,398
,1
F
und
amen
tal c
om
ple
to/m
édio
inco
mp
leto
2.
828
17,8
18,3
21,0
19,5
16,7
-
M
édio
co
mp
leto
ou
mai
s
5.00
540
,723
,734
,926
,723
,31,
9
N
ão d
eter
min
ada
86
0,5
0,5
0,7
0,6
0,7
-
Tabe
la 3
-A: E
scol
arid
ade
da p
opul
ação
de
15 a
nos
ou m
ais,
seg
undo
cor
/raç
a /
Min
as G
erai
s e
Bra
sil -
201
0
(Con
tinua
)
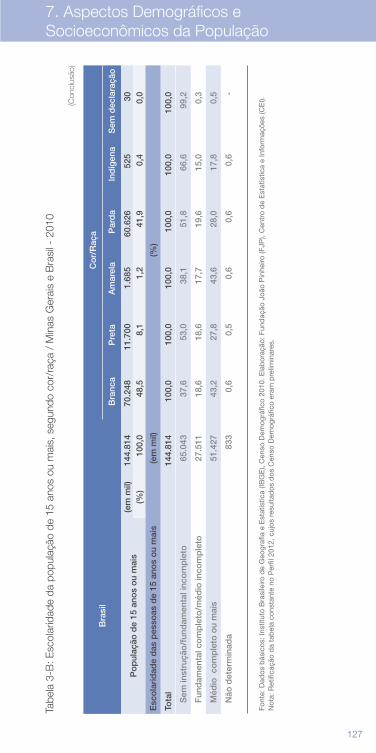
126 127
7. Aspectos Demográficos e Socioeconômicos da População
Bra
sil
Co
r/R
aça
Bra
nca
Pre
taA
mar
ela
Par
da
Ind
ígen
aS
em d
ecla
raçã
o
Po
pul
ação
de
15 a
nos
ou
mai
s(e
m m
il)14
4.81
470
.248
11.7
001.
685
60.6
2652
530
(%)
100,
048
,58,
11,
241
,90,
40,
0
Esc
ola
rid
ade
das
pes
soas
de
15 a
nos
ou
mai
s
(em
mil)
(%)
Tota
l
144.
814
100,
010
0,0
100,
010
0,0
100,
010
0,0
S
em in
stru
ção
/fun
dam
enta
l inc
om
ple
to
65.0
4337
,653
,038
,151
,866
,699
,2
F
und
amen
tal c
om
ple
to/m
édio
inco
mp
leto
27
.511
18,6
18,6
17,7
19,6
15,0
0,3
M
édio
co
mp
leto
ou
mai
s
51.4
2743
,227
,843
,628
,017
,80,
5
N
ão d
eter
min
ada
83
30,
60,
50,
60,
60,
6-
Font
e: D
ados
bás
icos
: Ins
titut
o B
rasi
leiro
de
Geo
graf
ia e
Est
atís
tica
(IBG
E),
Cen
so D
emog
ráfic
o 20
10. E
lab
oraç
ão: F
und
ação
Joã
o P
inhe
iro (F
JP),
Cen
tro
de
Est
atís
tica
e In
form
açõe
s (C
EI).
N
ota:
Ret
ifica
ção
da
tab
ela
cons
tant
e no
Per
fil 2
012,
cuj
os r
esul
tad
os d
os C
enso
Dem
ográ
fico
eram
pre
limin
ares
.
Tabe
la 3
-B: E
scol
arid
ade
da p
opul
ação
de
15 a
nos
ou m
ais,
seg
undo
cor
/raç
a /
Min
as G
erai
s e
Bra
sil -
201
0
(Con
clus
ão)
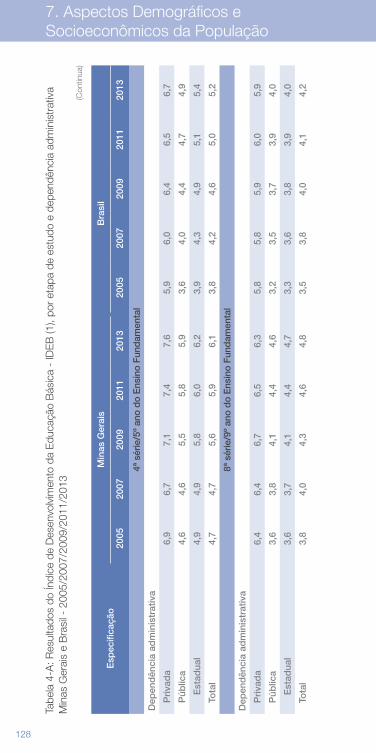
128 129
7. Aspectos Demográficos e Socioeconômicos da População
Tabe
la 4
-A: R
esul
tado
s do
Índi
ce d
e D
esen
volv
imen
to d
a E
duca
ção
Bás
ica
- ID
EB
(1),
por
etap
a de
est
udo
e de
pend
ênci
a ad
min
istr
ativ
a M
inas
Ger
ais
e B
rasi
l - 2
005/
2007
/200
9/20
11/2
013
(Con
tinua
)
Esp
ecifi
caçã
oM
inas
Ger
ais
B
rasi
l
2005
2007
2009
2011
2013
20
0520
0720
0920
1120
13
4ª s
érie
/5º
ano
do
Ens
ino
Fund
amen
tal
Dep
end
ênci
a ad
min
istr
ativ
a
P
riva
da
6,9
6,7
7,1
7,4
7,6
5,9
6,0
6,4
6,5
6,7
P
úblic
a4,
64,
65,
55,
85,
93,
64,
04,
44,
74,
9
Est
adua
l4,
94,
95,
86,
06,
23,
94,
34,
95,
15,
4
To
tal
4,7
4,7
5,6
5,9
6,1
3,8
4,2
4,6
5,0
5,2
8ª s
érie
/9º
ano
do
Ens
ino
Fund
amen
tal
Dep
end
ênci
a ad
min
istr
ativ
a
P
riva
da
6,4
6,4
6,7
6,5
6,3
5,8
5,8
5,9
6,0
5,9
P
úblic
a3,
63,
84,
14,
44,
63,
23,
53,
73,
94,
0
Est
adua
l3,
63,
74,
14,
44,
73,
33,
63,
83,
94,
0
To
tal
3,8
4,0
4,3
4,6
4,8
3,5
3,8
4,0
4,1
4,2
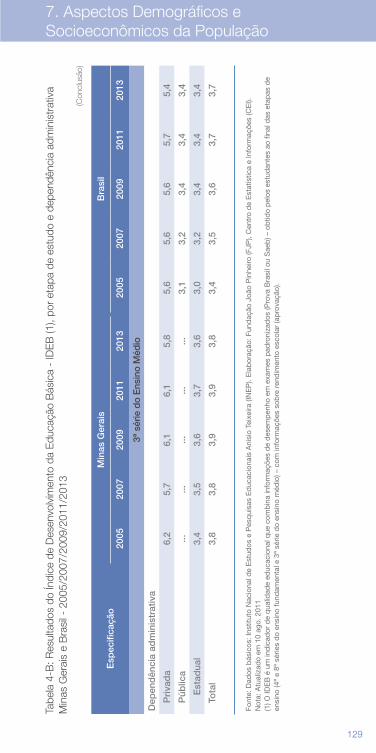
128 129
7. Aspectos Demográficos e Socioeconômicos da População
Esp
ecifi
caçã
oM
inas
Ger
ais
B
rasi
l
2005
2007
2009
2011
2013
20
0520
0720
0920
1120
13
4ª s
érie
/5º
ano
do
Ens
ino
Fund
amen
tal
Dep
end
ênci
a ad
min
istr
ativ
a
P
riva
da
6,9
6,7
7,1
7,4
7,6
5,9
6,0
6,4
6,5
6,7
P
úblic
a4,
64,
65,
55,
85,
93,
64,
04,
44,
74,
9
Est
adua
l4,
94,
95,
86,
06,
23,
94,
34,
95,
15,
4
To
tal
4,7
4,7
5,6
5,9
6,1
3,8
4,2
4,6
5,0
5,2
8ª s
érie
/9º
ano
do
Ens
ino
Fund
amen
tal
Dep
end
ênci
a ad
min
istr
ativ
a
P
riva
da
6,4
6,4
6,7
6,5
6,3
5,8
5,8
5,9
6,0
5,9
P
úblic
a3,
63,
84,
14,
44,
63,
23,
53,
73,
94,
0
Est
adua
l3,
63,
74,
14,
44,
73,
33,
63,
83,
94,
0
To
tal
3,8
4,0
4,3
4,6
4,8
3,5
3,8
4,0
4,1
4,2
Tabe
la 4
-B: R
esul
tado
s do
Índi
ce d
e D
esen
volv
imen
to d
a E
duca
ção
Bás
ica
- ID
EB
(1),
por
etap
a de
est
udo
e de
pend
ênci
a ad
min
istr
ativ
a M
inas
Ger
ais
e B
rasi
l - 2
005/
2007
/200
9/20
11/2
013
(Con
clus
ão)
Esp
ecifi
caçã
oM
inas
Ger
ais
B
rasi
l
2005
2007
2009
2011
2013
20
0520
0720
0920
1120
13
3ª s
érie
do
Ens
ino
Méd
io
Dep
end
ênci
a ad
min
istr
ativ
a
P
riva
da
6,2
5,7
6,1
6,1
5,8
5,6
5,6
5,6
5,7
5,4
P
úblic
a...
......
......
3,1
3,2
3,4
3,4
3,4
Est
adua
l3,
43,
53,
63,
73,
63,
03,
23,
43,
43,
4
To
tal
3,8
3,8
3,9
3,9
3,8
3,4
3,5
3,6
3,7
3,7
Font
e: D
ados
bás
icos
: Ins
titut
o N
acio
nal d
e E
stud
os e
Pes
qui
sas
Ed
ucac
iona
is A
nísi
o Te
ixei
ra (I
NE
P).
Ela
bor
ação
: Fun
daç
ão J
oão
Pin
heiro
(FJP
), C
entr
o d
e E
stat
ístic
a e
Info
rmaç
ões
(CE
I).
Not
a: A
tual
izad
o em
10
ago.
201
1 (1
) O ID
EB
é u
m in
dic
ador
de
qua
lidad
e ed
ucac
iona
l que
com
bin
a in
form
açõe
s d
e d
esem
pen
ho e
m e
xam
es p
adro
niza
dos
(Pro
va B
rasi
l ou
Sae
b) –
ob
tido
pel
os e
stud
ante
s ao
fina
l das
eta
pas
de
ensi
no (4
ª e
8ª s
érie
s d
o en
sino
fund
amen
tal e
3ª
série
do
ensi
no m
édio
) – c
om in
form
açõe
s so
bre
ren
dim
ento
esc
olar
(ap
rova
ção)
.
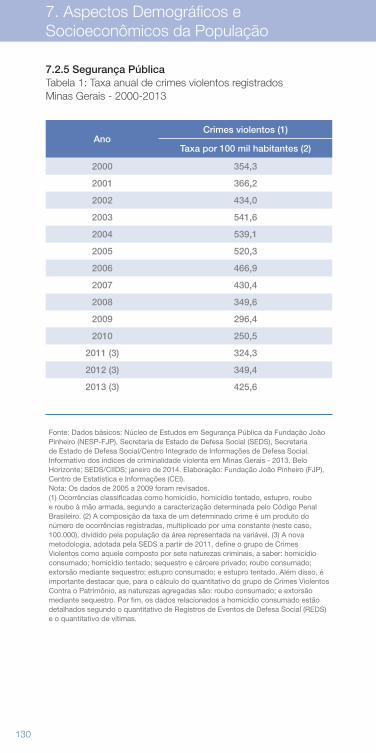
130 131
7. Aspectos Demográficos e Socioeconômicos da População
AnoCrimes violentos (1)
Taxa por 100 mil habitantes (2)
2000 354,3
2001 366,2
2002 434,0
2003 541,6
2004 539,1
2005 520,3
2006 466,9
2007 430,4
2008 349,6
2009 296,4
2010 250,5
2011 (3) 324,3
2012 (3) 349,4
2013 (3) 425,6
7.2.5 Segurança PúblicaTabela 1: Taxa anual de crimes violentos registradosMinas Gerais - 2000-2013
Fonte: Dados básicos: Núcleo de Estudos em Segurança Pública da Fundação João Pinheiro (NESP-FJP), Secretaria de Estado de Defesa Social (SEDS), Secretaria de Estado de Defesa Social/Centro Integrado de Informações de Defesa Social. Informativo dos índices de criminalidade violenta em Minas Gerais - 2013. Belo Horizonte; SEDS/CIIDS; janeiro de 2014. Elaboração: Fundação João Pinheiro (FJP), Centro de Estatística e Informações (CEI). Nota: Os dados de 2005 a 2009 foram revisados. (1) Ocorrências classificadas como homicídio, homicídio tentado, estupro, roubo e roubo à mão armada, segundo a caracterização determinada pelo Código Penal Brasileiro. (2) A composição da taxa de um determinado crime é um produto do número de ocorrências registradas, multiplicado por uma constante (neste caso, 100.000), dividido pela população da área representada na variável. (3) A nova metodologia, adotada pela SEDS a partir de 2011, define o grupo de Crimes Violentos como aquele composto por sete naturezas criminais, a saber: homicídio consumado; homicídio tentado; sequestro e cárcere privado; roubo consumado; extorsão mediante sequestro; estupro consumado; e estupro tentado. Além disso, é importante destacar que, para o cálculo do quantitativo do grupo de Crimes Violentos Contra o Patrimônio, as naturezas agregadas são: roubo consumado; e extorsão mediante sequestro. Por fim, os dados relacionados a homicídio consumado estão detalhados segundo o quantitativo de Registros de Eventos de Defesa Social (REDS) e o quantitativo de vítimas.
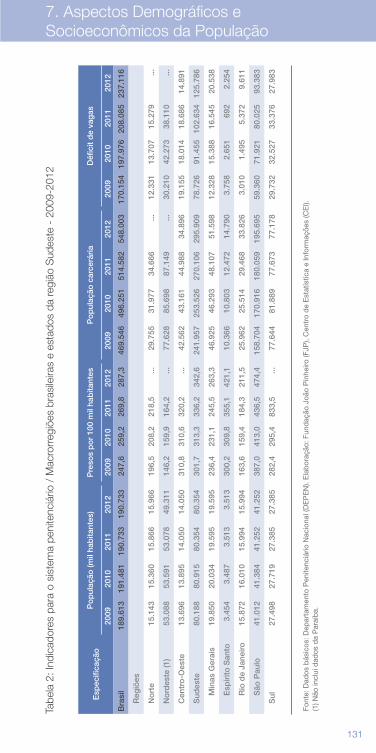
130 131
7. Aspectos Demográficos e Socioeconômicos da População
Tabe
la 2
: Ind
icad
ores
par
a o
sist
ema
peni
tenc
iário
/ M
acro
rreg
iões
bra
sile
iras
e es
tado
s da
regi
ão S
udes
te -
200
9-20
12
Esp
ecifi
caçã
oP
op
ulaç
ão (m
il ha
bita
ntes
)
Pre
sos
po
r 10
0 m
il ha
bita
ntes
P
op
ulaç
ão c
arce
rári
a
Déf
icit
de
vag
as
2009
2010
2011
2012
20
0920
1020
1120
12
2009
2010
2011
2012
20
0920
1020
1120
12
Bra
sil
189.
613
191.
481
190.
733
190.
733
247,
625
9,2
269,
828
7,3
469.
546
496.
251
514.
582
548.
003
170.
154
197.
976
208.
085
237.
116
R
egiõ
es
N
ort
e15
.143
15.3
6015
.866
15.9
6619
6,5
208,
221
8,5
...29
.755
31.9
7734
.666
...12
.331
13.7
0715
.279
...
N
ord
este
(1)
53.0
8853
.591
53.0
7849
.311
146,
215
9,9
164,
2...
77.6
2885
.698
87.1
49...
30.2
1042
.273
38.1
10...
C
entr
o-O
este
13.6
9613
.895
14.0
5014
.050
310,
831
0,6
320,
2...
42.5
6243
.161
44.9
8834
.896
19.1
5518
.014
18.6
8614
.891
S
udes
te80
.188
80.9
1580
.354
80.3
5430
1,7
313,
333
6,2
342,
624
1.95
725
3.52
627
0.10
629
5.90
978
.726
91.4
5510
2.63
412
5.78
6
Min
as G
erai
s19
.850
20.0
3419
.595
19.5
9523
6,4
231,
124
5,5
263,
346
.925
46.2
9348
.107
51.5
9812
.328
15.3
8816
.545
20.5
38
Esp
írito
San
to3.
454
3.48
73.
513
3.51
330
0,2
309,
835
5,1
421,
110
.366
10.8
0312
.472
14.7
903.
758
2.65
169
22.
254
Rio
de
Jane
iro15
.872
16.0
1015
.994
15.9
9416
3,6
159,
418
4,3
211,
525
.962
25.5
1429
.468
33.8
263.
010
1.49
55.
372
9.61
1
São
Pau
lo41
.012
41.3
8441
.252
41.2
5238
7,0
413,
043
6,5
474,
415
8.70
417
0.91
618
0.05
919
5.69
559
.360
71.9
2180
.025
93.3
83
S
ul27
.498
27.7
1927
.385
27.3
8528
2,4
295,
483
3,5
...77
.644
81.8
8977
.673
77.1
7829
.732
32.5
2733
.376
27.9
83
Font
e: D
ados
bás
icos
: Dep
arta
men
to P
enite
nciá
rio N
acio
nal (
DE
PE
N).
Ela
bor
ação
: Fun
daç
ão J
oão
Pin
heiro
(FJP
), C
entr
o d
e E
stat
ístic
a e
Info
rmaç
ões
(CE
I).
(1) N
ão in
clui
dad
os d
a P
araí
ba.
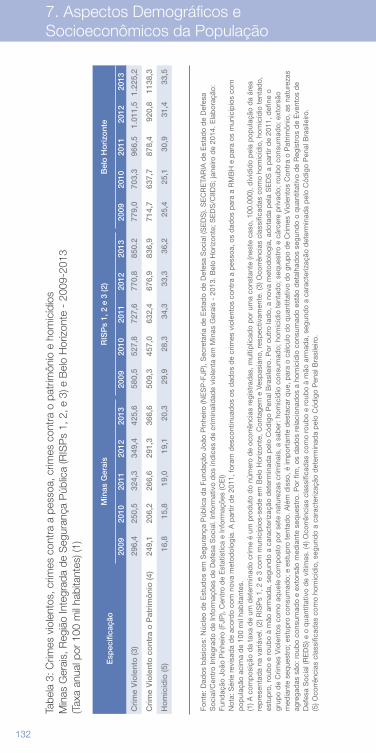
132 133
7. Aspectos Demográficos e Socioeconômicos da População
Tabe
la 3
: Crim
es v
iole
ntos
, crim
es c
ontr
a a
pess
oa, c
rimes
con
tra
o pa
trim
ônio
e h
omic
ídio
sM
inas
Ger
ais,
Reg
ião
Inte
grad
a de
Seg
uran
ça P
úblic
a (R
ISP
s 1,
2, e
3) e
Bel
o H
oriz
onte
- 2
009-
2013
(T
axa
anua
l por
100
mil
habi
tant
es) (
1)
Esp
ecifi
caçã
oM
inas
Ger
ais
R
ISP
s 1,
2 e
3 (2
)
Bel
o H
ori
zont
e
20
0920
1020
1120
1220
13
2009
2010
2011
2012
2013
20
0920
1020
1120
1220
13
Cri
me
Vio
lent
o (3
)29
6,4
250,
532
4,3
349,
442
5,6
580,
552
7,8
727,
677
0,8
850.
277
9,0
703,
396
6,5
1.01
1,5
1.22
5,2
Cri
me
Vio
lent
o c
ont
ra o
Pat
rim
ôni
o (4
)24
9,1
206,
226
6,6
291,
336
6,6
509,
345
7,0
632,
467
6,9
836,
971
4,7
637,
787
8,4
920,
811
38,3
Ho
mic
ídio
(5)
16,8
15,8
19,0
19,1
20,3
29,9
28,3
34,3
33,3
36,2
25,4
25,1
30,9
31,4
33,5
Font
e: D
ados
bás
icos
: Núc
leo
de
Est
udos
em
Seg
uran
ça P
úblic
a d
a Fu
ndaç
ão J
oão
Pin
heiro
(NE
SP
-FJP
), S
ecre
taria
de
Est
ado
de
Def
esa
Soc
ial (
SE
DS
). S
EC
RE
TAR
IA d
e E
stad
o d
e D
efes
a S
ocia
l/Cen
tro
Inte
grad
o d
e In
form
açõe
s d
e D
efes
a S
ocia
l. In
form
ativ
o d
os ín
dic
es d
e cr
imin
alid
ade
viol
enta
em
Min
as G
erai
s -
2013
. Bel
o H
oriz
onte
; SE
DS
/CIID
S; j
anei
ro d
e 20
14. E
lab
oraç
ão:
Fund
ação
Joã
o P
inhe
iro (F
JP),
Cen
tro
de
Est
atís
tica
e In
form
açõe
s (C
EI)
Not
a: S
érie
rev
isad
a d
e ac
ord
o co
m n
ova
met
odol
ogia
. A p
artir
de
2011
, for
am d
esco
ntin
uad
os o
s d
ados
de
crim
es v
iole
ntos
con
tra
a p
esso
a, o
s d
ados
par
a a
RM
BH
e p
ara
os m
unic
ípio
s co
m
pop
ulaç
ão a
cim
a d
e 10
0 m
il ha
bita
ntes
. (1
) A c
omp
osiç
ão d
a ta
xa d
e um
det
erm
inad
o cr
ime
é um
pro
dut
o d
o nú
mer
o d
e oc
orrê
ncia
s re
gist
rad
as, m
ultip
licad
o p
or u
ma
cons
tant
e (n
este
cas
o, 1
00.0
00),
div
idid
o p
ela
pop
ulaç
ão d
a ár
ea
rep
rese
ntad
a na
var
iáve
l. (2
) RIS
Ps
1, 2
e 3
com
mun
icíp
ios-
sed
e em
Bel
o H
oriz
onte
, Con
tage
m e
Ves
pas
iano
, res
pec
tivam
ente
. (3)
Oco
rrên
cias
cla
ssifi
cad
as c
omo
hom
icíd
io, h
omic
ídio
ten
tad
o,
estu
pro
, rou
bo
e ro
ubo
à m
ão a
rmad
a, s
egun
do
a ca
ract
eriz
ação
det
erm
inad
a p
elo
Cód
igo
Pen
al B
rasi
leiro
. Por
out
ro la
do,
a n
ova
met
odol
ogia
, ad
otad
a p
ela
SE
DS
a p
artir
de
2011
, def
ine
o gr
upo
de
Crim
es V
iole
ntos
com
o aq
uele
com
pos
to p
or s
ete
natu
reza
s cr
imin
ais,
a s
aber
: hom
icíd
io c
onsu
mad
o; h
omic
ídio
ten
tad
o; s
eque
stro
e c
árce
re p
rivad
o; r
oub
o co
nsum
ado;
ext
orsã
o m
edia
nte
seq
uest
ro; e
stup
ro c
onsu
mad
o; e
est
upro
ten
tad
o. A
lém
dis
so, é
imp
orta
nte
des
taca
r q
ue, p
ara
o cá
lcul
o d
o q
uant
itativ
o d
o gr
upo
de
Crim
es V
iole
ntos
Con
tra
o P
atrim
ônio
, as
natu
reza
s ag
rega
das
são
: rou
bo
cons
umad
o e
exto
rsão
med
iant
e se
que
stro
. Por
fim
, os
dad
os r
elac
iona
dos
a h
omic
ídio
con
sum
ado
estã
o d
etal
had
os s
egun
do
o q
uant
itativ
o d
e R
egis
tros
de
Eve
ntos
de
Def
esa
Soc
ial (
RE
DS
) e o
qua
ntita
tivo
de
vítim
as. (
4) O
corr
ênci
as c
lass
ifica
das
com
o ro
ubo
e ro
ubo
à m
ão a
rmad
a, s
egun
do
a ca
ract
eriz
ação
det
erm
inad
a p
elo
Cód
igo
Pen
al B
rasi
leiro
. (5
) Oco
rrên
cias
cla
ssifi
cad
as c
omo
hom
icíd
io, s
egun
do
a ca
ract
eriz
ação
det
erm
inad
a p
elo
Cód
igo
Pen
al B
rasi
leiro
.
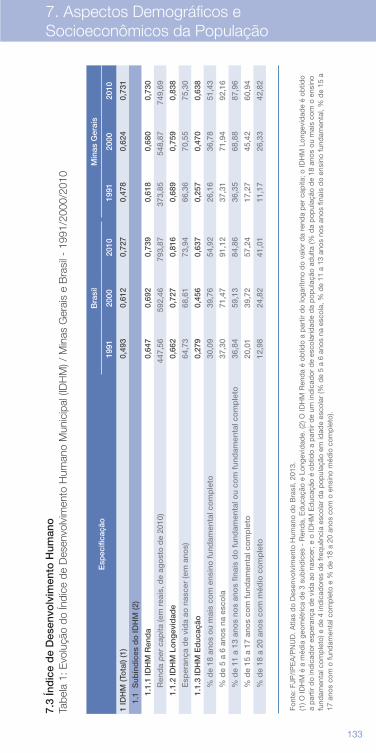
132 133
7. Aspectos Demográficos e Socioeconômicos da População
Esp
ecifi
caçã
oB
rasi
lM
inas
Ger
ais
1991
2000
2010
1991
2000
2010
1 ID
HM
(To
tal)
(1)
0,49
30,
612
0,72
7
0,47
80,
624
0,73
1
1.
1 S
ubín
dic
es d
o ID
HM
(2)
1.1.
1 ID
HM
Ren
da
0,64
70,
692
0,73
90,
618
0,68
00,
730
R
end
a p
er c
apita
(em
rea
is, d
e ag
ost
o d
e 20
10)
447,
5659
2,46
793,
8737
3,85
548,
8774
9,69
1.1.
2 ID
HM
Lo
ngev
idad
e0,
662
0,72
70,
816
0,68
90,
759
0,83
8
E
sper
ança
de
vid
a ao
nas
cer
(em
ano
s)64
,73
68,6
173
,94
66,3
670
,55
75,3
0
1.1.
3 ID
HM
Ed
ucaç
ão0,
279
0,45
60,
637
0,25
70,
470
0,63
8
%
de
18 a
nos
ou
mai
s co
m e
nsin
o f
und
amen
tal c
om
ple
to30
,09
39,7
654
,92
26,1
636
,78
51,4
3
%
de
5 a
6 an
os
na e
sco
la37
,30
71,4
791
,12
37,3
171
,94
92,1
6
%
de
11 a
13
ano
s no
s an
os
finai
s d
o f
und
amen
tal o
u co
m f
und
amen
tal c
om
ple
to36
,84
59,1
384
,86
36,3
568
,88
87,9
6
%
de
15 a
17
ano
s co
m f
und
amen
tal c
om
ple
to20
,01
39,7
257
,24
17,2
745
,42
60,9
4
%
de
18 a
20
ano
s co
m m
édio
co
mp
leto
12,9
824
,82
41,0
111
,17
26,3
342
,82
Font
e: F
JP/I
PE
A/P
NU
D. A
tlas
do
Des
envo
lvim
ento
Hum
ano
do
Bra
sil,
2013
. (1
) O ID
HM
é a
méd
ia g
eom
étric
a d
e 3
sub
índ
ices
- R
end
a, E
duc
ação
e L
onge
vid
ade.
(2) O
IDH
M R
end
a é
obtid
o a
par
tir d
o lo
garít
mo
do
valo
r d
a re
nda
per
cap
ita; o
IDH
M L
onge
vid
ade
é ob
tido
a p
artir
do
ind
icad
or e
sper
ança
de
vid
a ao
nas
cer;
e o
IDH
M E
duc
ação
é o
btid
o a
par
tir d
e um
ind
icad
or d
e es
cola
ridad
e d
a p
opul
ação
ad
ulta
(% d
a p
opul
ação
de
18 a
nos
ou m
ais
com
o e
nsin
o fu
ndam
enta
l com
ple
to) e
de
4 in
dic
ador
es d
e fr
equê
ncia
esc
olar
da
pop
ulaç
ão e
m id
ade
esco
lar
(% d
e 5
a 6
anos
na
esco
la, %
de
11 a
13
anos
nos
ano
s fin
ais
do
ensi
no fu
ndam
enta
l, %
de
15 a
17
ano
s co
m o
fund
amen
tal c
omp
leto
e %
de
18 a
20
anos
com
o e
nsin
o m
édio
com
ple
to).
7.3
Índ
ice
de
Des
envo
lvim
ento
Hum
ano
Tabe
la 1
: Evo
luçã
o do
Índi
ce d
e D
esen
volv
imen
to H
uman
o M
unic
ipal
(ID
HM
) / M
inas
Ger
ais
e B
rasi
l - 1
991/
2000
/201
0
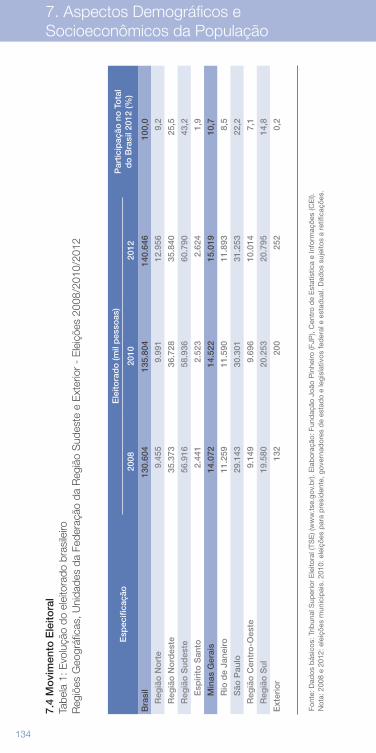
134 135
7. Aspectos Demográficos e Socioeconômicos da População
Esp
ecifi
caçã
oE
leito
rad
o (m
il p
esso
as)
Par
ticip
ação
no
To
tal
do
Bra
sil 2
012
(%)
2008
2010
2012
Bra
sil
130.
604
135.
804
140.
646
100,
0
R
egiã
o N
ort
e9.
455
9.99
112
.956
9,2
R
egiã
o N
ord
este
35.3
7336
.728
35.8
4025
,5
R
egiã
o S
udes
te56
.916
58.9
3660
.790
43,2
Esp
írito
San
to2.
441
2.52
32.
624
1,9
Min
as G
erai
s14
.072
14.5
2215
.019
10,7
Rio
de
Jane
iro11
.259
11.5
9011
.893
8,5
São
Pau
lo29
.143
30.3
0131
.253
22,2
R
egiã
o C
entr
o-O
este
9.14
99.
696
10.0
147,
1
R
egiã
o S
ul19
.580
20.2
5320
.795
14,8
Ext
erio
r13
220
025
20,
2
Font
e: D
ados
bás
icos
: Trib
unal
Sup
erio
r E
leito
ral (
TSE
) (w
ww
.tse
.gov
.br)
. Ela
bor
ação
: Fun
daç
ão J
oão
Pin
heiro
(FJP
), C
entr
o d
e E
stat
ístic
a e
Info
rmaç
ões
(CE
I).
Not
a: 2
008
e 20
12: e
leiç
ões
mun
icip
ais.
201
0: e
leiç
ões
par
a p
resi
den
te, g
over
nad
ores
de
esta
do
e le
gisl
ativ
os fe
der
al e
est
adua
l. D
ados
suj
eito
s a
retif
icaç
ões.
7.4
Mo
vim
ento
Ele
itora
lTa
bela
1: E
volu
ção
do e
leito
rado
bra
sile
iroR
egiõ
es G
eogr
áfic
as, U
nida
des
da F
eder
ação
da
Reg
ião
Sud
este
e E
xter
ior
- E
leiç
ões
2008
/201
0/20
12
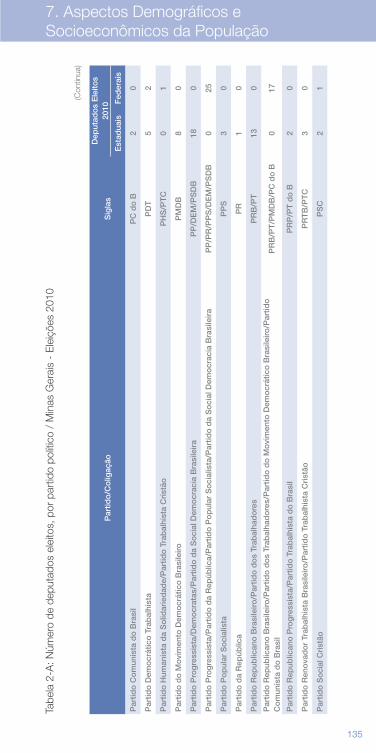
134 135
7. Aspectos Demográficos e Socioeconômicos da População
Par
tido
/Co
ligaç
ãoS
igla
s
Dep
utad
os
Ele
itos
2010
Est
adua
isF
eder
ais
Par
tido
Co
mun
ista
do
Bra
sil
PC
do
B2
0
Par
tido
Dem
ocr
átic
o T
rab
alhi
sta
PD
T5
2
Par
tido
Hum
anis
ta d
a S
olid
arie
dad
e/P
artid
o T
rab
alhi
sta
Cri
stão
PH
S/P
TC
01
Par
tido
do
Mo
vim
ento
Dem
ocr
átic
o B
rasi
leiro
PM
DB
80
Par
tido
Pro
gre
ssis
ta/D
emo
crat
as/P
artid
o d
a S
oci
al D
emo
crac
ia B
rasi
leir
aP
P/D
EM
/PS
DB
180
Par
tido
Pro
gre
ssis
ta/P
artid
o d
a R
epúb
lica/
Par
tido
Po
pul
ar S
oci
alis
ta/P
artid
o d
a S
oci
al D
emo
crac
ia B
rasi
leir
aP
P/P
R/P
PS
/DE
M/P
SD
B0
25
Par
tido
Po
pul
ar S
oci
alis
taP
PS
30
Par
tido
da
Rep
úblic
aP
R1
0
Par
tido
Rep
ublic
ano
Bra
sile
iro/P
artid
o d
os
Trab
alha
do
res
PR
B/P
T13
0
Par
tido
Rep
ublic
ano
Bra
sile
iro/P
artid
o d
os
Trab
alha
do
res/
Par
tido
do
Mo
vim
ento
Dem
ocr
átic
o B
rasi
leiro
/Par
tido
C
om
unis
ta d
o B
rasi
lP
RB
/PT
/PM
DB
/PC
do
B0
17
Par
tido
Rep
ublic
ano
Pro
gre
ssis
ta/P
artid
o T
rab
alhi
sta
do
Bra
sil
PR
P/P
T d
o B
20
Par
tido
Ren
ova
do
r Tr
abal
hist
a B
rasi
leiro
/Par
tido
Tra
bal
hist
a C
rist
ãoP
RT
B/P
TC
30
Par
tido
So
cial
Cri
stão
PS
C2
1
Tabe
la 2
-A: N
úmer
o de
dep
utad
os e
leito
s, p
or p
artid
o po
lític
o /
Min
as G
erai
s -
Ele
içõe
s 20
10
(Con
tinua
)
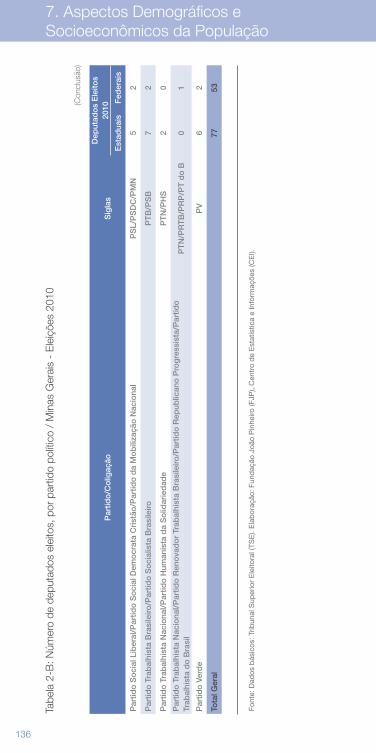
136 137
7. Aspectos Demográficos e Socioeconômicos da População
Par
tido
/Co
ligaç
ãoS
igla
s
Dep
utad
os
Ele
itos
2010
Est
adua
isF
eder
ais
Par
tido
So
cial
Lib
eral
/Par
tido
So
cial
Dem
ocr
ata
Cri
stão
/Par
tido
da
Mo
bili
zaçã
o N
acio
nal
PS
L/P
SD
C/P
MN
52
Par
tido
Tra
bal
hist
a B
rasi
leiro
/Par
tido
So
cial
ista
Bra
sile
iroP
TB
/PS
B7
2
Par
tido
Tra
bal
hist
a N
acio
nal/
Par
tido
Hum
anis
ta d
a S
olid
arie
dad
eP
TN
/PH
S2
0
Par
tido
Tra
bal
hist
a N
acio
nal/
Par
tido
Ren
ova
do
r Tr
abal
hist
a B
rasi
leiro
/Par
tido
Rep
ublic
ano
Pro
gre
ssis
ta/P
artid
o
Trab
alhi
sta
do
Bra
sil
PT
N/P
RT
B/P
RP
/PT
do
B0
1
Par
tido
Ver
de
PV
62
Tota
l Ger
al77
53
Tabe
la 2
-B: N
úmer
o de
dep
utad
os e
leito
s, p
or p
artid
o po
lític
o /
Min
as G
erai
s -
Ele
içõe
s 20
10
(Con
clus
ão)
Font
e: D
ados
bás
icos
: Trib
unal
Sup
erio
r E
leito
ral (
TSE
). E
lab
oraç
ão: F
und
ação
Joã
o P
inhe
iro (F
JP),
Cen
tro
de
Est
atís
tica
e In
form
açõe
s (C
EI).
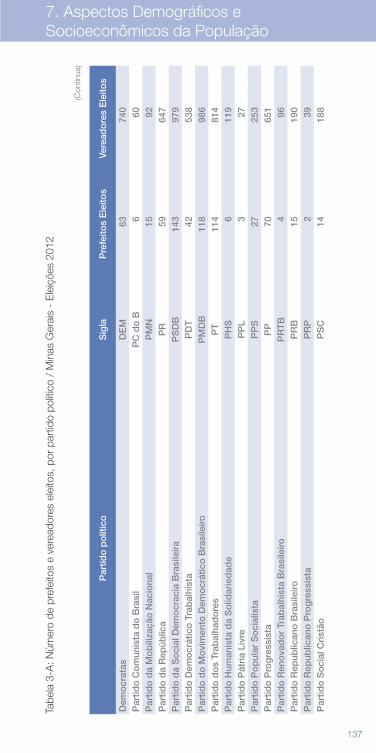
136 137
7. Aspectos Demográficos e Socioeconômicos da População
Par
tido
po
lític
oS
igla
Pre
feito
s E
leito
sVe
read
ore
s E
leito
s
Dem
ocr
atas
DE
M63
740
Par
tido
Co
mun
ista
do
Bra
sil
PC
do
B6
60P
artid
o d
a M
ob
iliza
ção
Nac
iona
lP
MN
1592
Par
tido
da
Rep
úblic
aP
R59
647
Par
tido
da
So
cial
Dem
ocr
acia
Bra
sile
ira
PS
DB
143
979
Par
tido
Dem
ocr
átic
o T
rab
alhi
sta
PD
T42
538
Par
tido
do
Mo
vim
ento
Dem
ocr
átic
o B
rasi
leiro
PM
DB
118
986
Par
tido
do
s Tr
abal
had
ore
sP
T11
481
4P
artid
o H
uman
ista
da
So
lidar
ied
ade
PH
S6
119
Par
tido
Pát
ria
Livr
eP
PL
327
Par
tido
Po
pul
ar S
oci
alis
taP
PS
2725
3P
artid
o P
rog
ress
ista
PP
7065
1P
artid
o R
eno
vad
or
Trab
alhi
sta
Bra
sile
iroP
RT
B4
96P
artid
o R
epub
lican
o B
rasi
leiro
PR
B15
190
Par
tido
Rep
ublic
ano
Pro
gre
ssis
taP
RP
239
Par
tido
So
cial
Cri
stão
PS
C14
188
Tabe
la 3
-A: N
úmer
o de
pre
feito
s e
vere
ador
es e
leito
s, p
or p
artid
o po
lític
o /
Min
as G
erai
s -
Ele
içõe
s 20
12
(Con
tinua
)
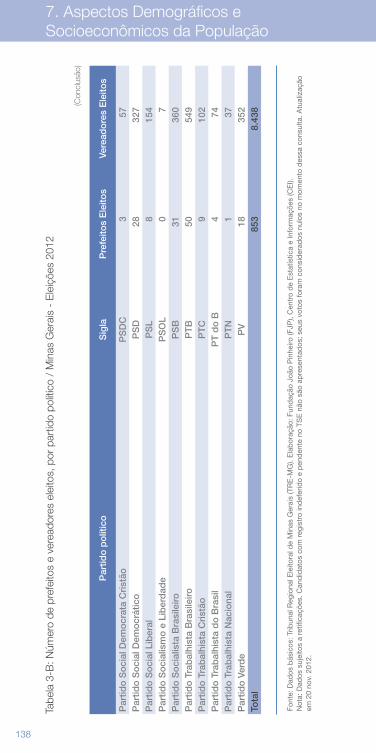
138
7. Aspectos Demográficos e Socioeconômicos da População
Par
tido
po
lític
oS
igla
Pre
feito
s E
leito
sVe
read
ore
s E
leito
s
Par
tido
So
cial
Dem
ocr
ata
Cri
stão
PS
DC
357
Par
tido
So
cial
Dem
ocr
átic
oP
SD
2832
7P
artid
o S
oci
al L
iber
alP
SL
815
4P
artid
o S
oci
alis
mo
e L
iber
dad
eP
SO
L0
7P
artid
o S
oci
alis
ta B
rasi
leiro
PS
B31
360
Par
tido
Tra
bal
hist
a B
rasi
leiro
PT
B50
549
Par
tido
Tra
bal
hist
a C
rist
ãoP
TC
910
2P
artid
o T
rab
alhi
sta
do
Bra
sil
PT
do
B4
74P
artid
o T
rab
alhi
sta
Nac
iona
lP
TN
137
Par
tido
Ver
de
PV
1835
2To
tal
85
38.
438
Tabe
la 3
-B: N
úmer
o de
pre
feito
s e
vere
ador
es e
leito
s, p
or p
artid
o po
lític
o /
Min
as G
erai
s -
Ele
içõe
s 20
12
(Con
clus
ão)
Font
e: D
ados
bás
icos
: Trib
unal
Reg
iona
l Ele
itora
l de
Min
as G
erai
s (T
RE
-MG
). E
lab
oraç
ão: F
und
ação
Joã
o P
inhe
iro (F
JP),
Cen
tro
de
Est
atís
tica
e In
form
açõe
s (C
EI).
N
ota:
Dad
os s
ujei
tos
a re
tific
açõe
s. C
and
idat
os c
om r
egis
tro
ind
efer
ido
e p
end
ente
no
TSE
não
são
ap
rese
ntad
os; s
eus
voto
s fo
ram
con
sid
erad
os n
ulos
no
mom
ento
des
sa c
onsu
lta. A
tual
izaç
ão
em 2
0 no
v. 2
012.

139
Glossário
G
140 141
AABASTECIMENTO DE ÁGUARede Geral – O domicílio é servido por água proveniente de uma rede geral de distribuição, canalizada para o domicílio ou, pelo menos, para o terreno ou propriedade onde se situa.Poço ou nascente na propriedade - O domicílio é servido por água proveniente de poço ou nascente localizada no terreno ou na proprie-dade onde o domicílio se situa.Outra forma – O domicílio é servido por água proveniente de poço ou nascente fora da propriedade; por carro-pipa ou água de chuva; rio, açude, lago ou igarapé; poço ou nascente na aldeia; poço ou nascente fora da aldeia; ou outra procedência que não se enquadra nas anteriormente descritas.
ÁREA DE PROTEÇÃO AMBIENTAL (APA) (IEF) – Unidade de con-servação de uso sustentável que tem como objetivos básicos pro-teger a diversidade biológica, disciplinar o processo de ocupação e assegurar a sustentabilidade do uso dos recursos naturais. Possui, em geral, área extensa, com certo grau de ocupação humana, dotada de atributos abióticos, bióticos, estéticos ou culturais especialmente importantes para a qualidade de vida e o bem-estar das populações humanas.
ÁREA DE PROTEÇÃO ESPECIAL ESTADUAL (APEE) (IEF) – São áreas definidas e demarcadas pelo governo do estado de Minas Ge-rais para proteção e conservação de mananciais.
DDÉFICIT HABITACIONAL – Noção mais imediata e intuitiva da necessidade de construção de novas moradias para a solução de problemas sociais e específicos de habitação detectados em certo momento.
DESEMPREGADOS (Pesquisa de emprego e desemprego) – São os indivíduos que se encontram numa das seguintes situações:Desemprego aberto – Pessoas que procuraram trabalho de modo efetivo nos 30 dias anteriores ao da entrevista e não exerceram ne-nhum trabalho nos últimos sete dias.Desemprego oculto pelo trabalho precário – Pessoas que realizam de forma irregular algum trabalho remunerado (ou pessoas que re-alizam trabalho não remunerado em ajuda a negócios de parentes) e que procuraram mudar de trabalho nos 30 dias anteriores ao da
Glossário
140 141
entrevista, ou que, não tendo procurado neste período, o fizeram até 12 meses atrás.Desemprego oculto pelo desalento – Pessoas que não possuem trabalho e nem procuraram nos últimos 30 dias, por desestímulos do mercado de trabalho ou por circunstâncias fortuitas, mas procuraram efetivamente trabalho nos últimos 12 meses.
DESPESA REALIZADA – Constitui-se por gastos públicos progra-mados pelo governo e representa as saídas do tesouro estadual. Classifica-se em despesas correntes (despesas operacionais reali-zadas a fim de promover a execução, a manutenção e o financia-mento das atividades de governo, não contribuindo diretamente para a formação ou aquisição de um bem de capital), e em despesas de capital (despesas que contribuem para formar um bem de capital ou adicionar um valor a um bem já existente, assim como transferir, por compra ou outro meio de aquisição, a propriedade de algo).
DESTINO DO LIXO – O lixo proveniente dos domicílios particulares permanentes foi classificado de acordo com os seguintes destinos:Coletado por serviço de limpeza - O lixo domiciliar é coletado dire-tamente por serviço ou empresa de limpeza, pública ou privada, que atenda ao logradouro onde se situa o domicílio.Coletado por caçamba de serviço de limpeza – O lixo é depositado em caçamba, tanque ou depósito de serviço ou empresa de limpeza, pública ou privada, que posteriormente o recolhe.Outro destino – Inclui o lixo queimado na propriedade em que se localiza o domicílio; o lixo domiciliar enterrado na propriedade; o lixo jogado em terreno baldio, logradouro, rio, lago ou mar, ou o lixo que tem outro destino que não se enquadre nos anteriormente descritos.
DÍVIDA PÚBLICA – Formada por títulos e contratos que criam para o Estado a obrigação e o dever de ressarcir um credor por recursos financeiros emprestados. Pode ser de natureza interna (cujo credor localiza-se em território nacional), externa (cujo credor não se loca-liza em território nacional) e flutuante (contraída pelo Estado a prazo curto e certo, por dificuldades financeiras transitórias e que é repre-sentada por títulos negociáveis).
DOMICÍLIO PARTICULAR PERMANENTE – Considerou-se a mora-dia estruturalmente independente, constituída por um ou mais cômo-dos, com entrada privativa, que serve de moradia a uma, duas, ou no máximo cinco famílias, construída para fim residencial.
EELEITORADO – Parcela da população apta a votar e inscrita junto à Justiça Eleitoral. Legalmente, no Brasil, o voto é obrigatório para os
Glossário
142 143
habitantes com 18 anos completos até os 70 anos; e facultativo, dos 16 aos 18, e para os maiores de 70 anos.
EMPREGO FORMAL – Refere-se aos registros administrativos do Cadastro Geral de Empregados e Desempregados (CAGED) do Mi-nistério do Trabalho e Emprego, e que dizem respeito ao número de empregos com vínculos empregatícios legais, sempre que ocorre trabalho remunerado, ou seja, as relações de trabalho regidas pela Consolidação das Leis Trabalhistas (CLT).
ESGOTAMENTO SANITÁRIO – O escoadouro do banheiro ou sanitá-rio usado pelos moradores dos domicílios particulares permanentes foi classificado, quanto ao tipo, em:Rede geral de esgoto ou pluvial – A canalização das águas servidas e dos dejetos provenientes do banheiro ou sanitário está ligada a um sistema de coleta que os conduz a um desaguadouro geral da área, região ou município, mesmo que o sistema não disponha de estação de tratamento da matéria esgotada.Fossa séptica – A canalização do banheiro ou sanitário está ligada a uma fossa séptica, ou seja, a matéria é esgotada para uma fossa próxima, onde passa por um processo de tratamento ou decantação, sendo, ou não, a parte líquida conduzida em seguida para um desa-guadouro geral da área, região ou município.Outros – As águas servidas e os dejetos são esgotados diretamente para uma vala, rio, lago ou mar, ou quando o escoadouro não se en-quadra em quaisquer dos tipos descritos anteriormente.
ESPERANÇA DE VIDA AO NASCER – Número médio de anos que se espera que um indivíduo viva, a partir do nascimento.
ESTAÇÃO ECOLÓGICA – Unidade de conservação de proteção inte-gral de posse e domínio públicos. Tem como objetivo a preservação da natureza e a realização de pesquisas científicas.
FFLORESTA ESTADUAL (FLOE) (IEF) – Unidade de conservação de uso sustentável de posse e domínio públicos. É uma área com co-bertura florestal de espécies predominantemente nativas e tem como objetivo básico o uso múltiplo sustentável dos recursos florestais e a pesquisa científica, com ênfase em métodos para exploração susten-tável de florestas nativas.
FUNDO ESTADUAL – Entidade contábil, sem personalidade jurídica, criada por lei e constituída pelo produto de receitas específicas e
Glossário
142 143
Glossário
elementos patrimoniais que se vinculam à realização de determina-dos objetivos ou serviços, conforme Artigo 2º, da Lei Complementar Estadual 27, de 18 de janeiro de 1993.
IÍNDICE DE DESENVOLVIMENTO HUMANO (IDH-M) – Criado no iní-cio da década de 90 para o Programa das Nações Unidas para o Desenvolvimento (PNUD) pelo conselheiro especial Mahbub ul Haq, o IDH, combina três componentes básicos do desenvolvimento hu-mano: 1) a longevidade, que também reflete, entre outras questões, as condições de saúde da população, medida pela esperança de vida ao nascer; 2) a educação, medida por uma combinação da taxa de alfabetização de adultos e a taxa combinada de matrícula nos níveis de ensino: fundamental, médio e superior; e 3) a renda, medida pelo poder de compra da população, o qual é baseado no PIB per capita e ajustado ao custo de vida local para ser comparável entre países e regiões, por meio da metodologia conhecida como Paridade do Poder de Compra (PPC).
ÍNDICE GERAL DE PREÇOS-DISPONIBILIDADE INTERNA (IGP-DI) – É a média ponderada do Índice de Preços por Atacado (IPA), Índice de Preços ao Consumidor (IPC) e Índice Nacional de Custo da Cons-trução (INCC), levantada pela Fundação Getúlio Vargas desde 1944.
ÍNDICE GERAL DE PREÇOS DO MERCADO (IGP-M) – Semelhante ao IGP-DI, salvo quanto ao período de coleta dos preços (21 do mês anterior a 20 do mês de referência) e à série histórica, já que surgiu em 1989, por demanda da classe empresarial.
MMESORREGIÃO GEOGRÁFICA – Unidade territorial homogênea, em nível maior que a microrregião, porém menor que o estado ou territó-rio, e resultante do grupamento de microrregiões.
MONUMENTOS NATURAIS – Unidades de conservação que têm como objetivo básico preservar sítios naturais raros, singulares ou de grande beleza cênica.
144 145
NNASCIDOS VIVOS – Expulsão ou extração completa do corpo da mãe, independente da duração da gravidez, de um produto da con-cepção que, depois da separação, respire ou apresente qualquer outro sinal de vida, como batimentos do coração ou pulsações do cordão umbilical.
PPARQUE ESTADUAL (IEF) – Unidade de conservação e proteção integral de posse e domínio públicos, que tem como objetivo bási-co preservar ecossistemas naturais de grande relevância ecológica e beleza cênica, possibilitando pesquisas científicas, atividades de educação e interpretação ambiental, recreação em contato com a natureza e turismo ecológico.
PARIDADE DO PODER DE COMPRA (PPC) – Dólares norte-ameri-canos ajustados para exprimir o mesmo poder de compra em todos os países.
PESQUISA NACIONAL POR AMOSTRA DE DOMICÍLIOS (PNAD) – Realizada anualmente pelo IBGE, salvo os anos censitários, inves-tiga diversas características socioeconômicas, algumas de caráter permanente, como as características gerais da população, e outras com periodicidade variável. A desagregação máxima permitida é a por região metropolitana.
PESSOAS DESOCUPADAS (IBGE) – Foram classificadas como de-socupadas as pessoas sem trabalho que, na semana de referência, tomaram alguma providência efetiva na procura de trabalho no perío-do de referência de 30 dias.
PESSOAS OCUPADAS (IBGE) – A população ocupada compreende as pessoas que têm trabalho, ou seja, indivíduos que têm um patrão; que exploram seu próprio negócio; ou que trabalham sem remune-ração em ajuda a membros da família. Não classifica como ocupado o indivíduo que se encontra em longos períodos de afastamento do exercício do seu trabalho remunerado.Empregados – Pessoas que desenvolvem um trabalho para um ou mais empregadores, com jornada de trabalho e remuneração em di-nheiro, espécie ou mercadoria.Autônomos e Conta-Própria – Pessoas que exploram uma atividade econômica, ou exercem uma profissão ou ofício, sem empregados.Empregadores – Pessoas que exploram uma atividade econômica
Glossário
144 145
ou que exercem uma profissão com o auxílio de um ou mais empre-gados.
POPULAÇÃO ECONOMICAMENTE ATIVA (PEA) (IBGE; Pesquisa de Emprego e Desemprego) – Parcela da PIA ocupada ou desem-pregada.
POPULAÇÃO EM IDADE ATIVA (PIA) (IBGE; Pesquisa de Emprego e Desemprego) – Corresponde à população de 10 anos ou mais de idade.
POPULAÇÃO POR SITUAÇÃO DO DOMICÍLIO:Situação urbana – Consideram-se as pessoas e os domicílios nas áreas urbanizadas ou não, correspondentes às cidades (sedes muni-cipais), às vilas (sedes distritais) ou áreas urbanas isoladas.Situação rural – Consideram-se as pessoas e os domicílios em toda a área situada fora dos limites urbanos, inclusive os aglomerados de extensão urbana, os povoados e os núcleos.
POPULAÇÃO RESIDENTE – É constituída pelos moradores habitu-ais no domicílio, ou seja, as pessoas que têm o domicílio como local de residência habitual, quer estejam presentes ou ausentes na data de referência do Censo.
PRODUTO INTERNO BRUTO (PIB) – Total dos bens e serviços pro-duzidos pelas unidades produtoras residentes, sendo, portanto, a soma dos valores acumulados pelos diversos setores, acrescida dos impostos líquidos de subsídios sobre produtos, não incluídos na va-loração da produção. Por outro lado, o produto interno bruto é igual à soma dos consumos finais de bens e serviços valorados a preço de mercado, sendo também igual à soma das rendas primárias. Pode, assim, ser expresso sob três óticas: da produção, da demanda e da renda.
RRECEITA ORÇAMENTÁRIA – Constitui o recurso necessário para as aplicações (despesas) programadas pelo governo, advindo de re-ceitas correntes (tributária, contribuições, patrimonial, agropecuária, industrial, serviços, transferências e outras) e de receitas de capital (operações de crédito, alienação de bens, amortização de emprés-timos, transferências e outras). Representa as entradas no tesouro estadual.
REFÚGIO DE VIDA SILVESTRE (IEF) – Unidade de conservação de proteção integral. Tem por objetivo proteger ambientes naturais onde se asseguram condições para a existência ou reprodução de espé-
Glossário
146 147
cies ou comunidades da flora local e da fauna residente ou migrató-ria. Pode ser constituído por áreas públicas ou particulares, desde que seja possível compatibilizar os objetivos da unidade com a uti-lização da terra e dos recursos naturais do local pelos proprietários.
RENDIMENTO DO TRABALHO (Pesquisa de Emprego e Desempre-go) – É captado o rendimento monetário bruto (sem descontos de imposto de renda e previdência), efetivamente recebido, referente ao trabalho realizado no mês imediatamente anterior ao da pesquisa. Para os assalariados, são considerados os descontos por falta ou acréscimos devidos a horas extras, gratificações etc. Não são com-putados o décimo-terceiro salário e os benefícios indiretos. Para os empregadores, autônomos e demais posições, é considerada a reti-rada mensal.
RENDIMENTO NOMINAL MENSAL (IBGE) – Pesquisou-se o rendi-mento nominal mensal do trabalho principal e dos demais trabalhos que a pessoa teve na semana de referência.
RESERVA DE DESENVOLVIMENTO SUSTENTÁVEL (IEF) – Área natural que abriga populações tradicionais, cuja existência baseia--se em sistemas sustentáveis de exploração dos recursos naturais, desenvolvidos ao longo de gerações e adaptados às condições eco-lógicas locais, que desempenham um papel fundamental na proteção da natureza e na manutenção da diversidade biológica.
RESERVA PARTICULAR DO PATRIMÔNIO NATURAL (RPPN) (IEF) – Área privada, gravada com perpetuidade, com o objetivo de con-servar a diversidade biológica.
REGIÕES INTEGRADAS DE SEGURANÇA PÚBLICA (RISPs) – Re-presentam o nível mais abrangente do Projeto Áreas Integradas. Nas RISPs há correspondência entre um Comando Regional da Polícia Militar e um Departamento de Polícia Civil. Todo o planejamento e ações policiais do estado de Minas Gerais são realizados por meio de dezoito RISPs, que se subdividem em Áreas de Coordenação In-tegrada de Segurança Pública (ACISPs) e em Áreas Integradas de Segurança Pública (AISPs).
TTAXA BRUTA DE NATALIDADE – Relação entre o número de crian-ças nascidas vivas durante um ano e a população total (por mil ha-bitantes).
TAXA BRUTA DE MORTALIDADE – Relação entre o total de óbitos e a população total em determinado ano (por mil habitantes).
Glossário
146 147
TAXA DE DESOCUPAÇÃO ABERTA (IBGE) – Relação entre deso-cupados e a População Economicamente Ativa (PEA) no período de referência.
TAXA DE DESEMPREGO TOTAL (Pesquisa de Emprego e Desem-prego) – Equivale à relação Desempregados/PEA e indica a propor-ção da PEA que se encontra na situação de desemprego aberto ou oculto (Ver Desempregados).
TAXA DE FECUNDIDADE TOTAL – Corresponde ao número médio de filhos nascidos vivos que uma mulher teria ao término do período reprodutivo (aos 49 anos).
TAXA DE MORTALIDADE INFANTIL (por mil nascidos vivos) – Coefi-ciente que relaciona o número de óbitos de menores de 1 ano (deno-minados frequentemente óbitos infantis) ocorridos em determinado período, e o número de nascidos vivos nesse mesmo período.
TRABALHO (IBGE):Ocupação econômica remunerada – Produção de bens ou serviços pelo qual se recebe pagamento em dinheiro, produto, espécie ou ou-tras formas monetárias.Ocupação econômica sem remuneração – Atividade exercida por pelo menos 1 hora durante a semana, nas seguintes situações: ajuda a membro da família em sua atividade econômica, em instituições religiosas, na agricultura, cooperativismo ou cargo de aprendiz ou estagiário.
UUNIDADES DE CONSERVAÇÃO DA NATUREZA (IEF) – Espaço ter-ritorial e seus recursos ambientais, incluindo as águas jurisdicionais, com características naturais relevantes, legalmente instituído pelo Poder Público, com objetivos de conservação e limites definidos, sob regime especial de administração, ao qual se aplicam garantias adequadas de proteção. São áreas controladas pelo órgão federal IBAMA, compondo o Sistema Nacional de Unidades de Conservação da Natureza (SNUC), instituído em 18 de julho de 2000, por meio da Lei n º 9.985.Unidades de proteção integral – Manutenção dos ecossistemas livres de alterações causadas por interferência humana, admitindo apenas o uso indireto dos seus atributos naturais, com exceção dos casos previstos em lei.Unidades de uso sustentável – Exploração do ambiente de maneira a garantir a perenidade dos recursos ambientais renováveis e dos processos ecológicos, mantendo a biodiversidade e os demais atribu-tos ecológicos de forma socialmente justa e economicamente viável.
Glossário

148
VVALOR ADICIONADO – Valor que a atividade acrescenta aos bens e serviços consumidos no seu processo produtivo. É a contribuição ao produto interno bruto pelas diversas atividades econômicas, obtida pela diferença entre o valor de produção e o consumo intermediário absorvido por essas atividades.
Glossário

149
Siglas
S
150 151
ANAC Agência Nacional da Aviação Civil
Anatel Agência Nacional de Telecomunicações
ANEEL Agência Nacional de Energia Elétrica
ANFAVEAAssociação Nacional dos Fabricantes de Veículos Automotores
BDMG Banco de Desenvolvimento de Minas Gerais
BEN Balanço Energético
CAGED Cadastro Geral de Empregados e Desempregados
CCSA Centro de Ciências Sociais Aplicadas (Montes Claros)
CEE Centro de Estudos Econômicos
Cemig Companhia Energética de Minas Gerais S.A.
CEPPESCentro de Estudos, Pesquisas e Projetos Econômicos e Sociais (Uberlândia)
CGET Coordenação Geral de Estatísticas do Trabalho (MTE)
CLT Consolidação das Leis Trabalhistas
CNAE Classificação Nacional de Atividades Econômicas
Conac Coordenação de Contas Nacionais
CPFL Companhia Paulista de Força e Luz
DAEDepartamento de Administração e Economia (Lavras)
DATASUSDepartamento de Informática do Sistema Único de Saúde
DCL Dívida Consolidada Líquida
DEPEN Departamento Penitenciário Nacional
DEPLADepartamento de Planejamento e Desenvolvimento do Comércio Exterior
DER-MG Departamento de Estradas de Rodagem do Estado de Minas Gerais
DES Departamento de Emprego e Salário (MTE)
DIEESEDepartamento Intersindical de Estatísticas e Estudos Socioeconômicos
DIEF/SREDiretoria de Informações Econômico-Fiscais da Superintendência da Receita Estadual
DMEDepartamento Municipal de Eletricidade de Poços de Caldas
DNITDepartamento Nacional de Infraestrutura de Transporte
DNPM Departamento Nacional de Produção Mineral
Siglas
150 151
Siglas
EEB Empresa Elétrica Bragantina
Energisa
FAT Fundo de Amparo ao Trabalhador
FEE Fundação de Economia e Estatística (Porto Alegre)
FGTAS Fundação Gaúcha do Trabalho e Ação Social
FPM Fundo de Participação dos Municípios
GDF Governo do Distrito Federal
GEMERC Gerência de Apoio ao Desenvolvimento em Mercados
IABr Instituto Aço Brasil
IBGE Instituto Brasileiro de Geografia e Estatística
ICMS
Imposto sobre Operações relativas à Circulação de Mercadorias e sobre Prestações de Serviços de Transporte Interestadual e Intermunicipal e de Comunicações
ICV Índice do Custo de Vida
IEPEInstituto de Estudos e Pesquisas Econômicas (Rio Grande do Sul)
IEF Instituto Estadual de Florestas
IGAM Instituto Mineiro de Gestão das Águas
IGP Índice Geral de Preços
IGP-DI Índice Geral de Preços – Disponibilidade Interna
IGP-M Índice Geral de Preços do Mercado
INEPInstituto Nacional de Estudos e Pesquisas Educacionais Anísio Teixeira
Infraero Empresa Brasileira de Infraestrutura Aeroportuária
INPC Índice Nacional de Preços ao Consumidor
IPA Índice de Preços por Atacado
IPC Índice de Preços ao Consumidor
IPCA Índice Nacional de Preços ao Consumidor Amplo
LSPA Levantamento Sistemático da Produção Agrícola
MDIC Ministério do Desenvolvimento, Indústria e Comércio Exterior
MME Ministério das Minas e Energia
152 153
Siglas
MTE Ministério do Trabalho e Emprego
OCB Organização das Cooperativas Brasileiras
OcemgSindicato e Organização das Cooperativas do Estado de Minas Gerais
OCEs Organização das Cooperativas Estaduais
OIT Organização Internacional do Trabalho
PAM Pesquisa Agrícola Municipal
PEA População Economicamente Ativa
PED Pesquisa de Emprego e Desemprego
PIA População em Idade Ativa
PMPA Prefeitura Municipal de Porto Alegre
PNAD Pesquisa Nacional por Amostragem de Domicílios
POF Pesquisa de Orçamentos Familiares
PPC Paridade do Poder de Compra
PPM Pesquisa Pecuária Municipal
RAIS Relação Anual de Informações Sociais
RCL Receita Corrente Líquida
REDS Sistema Integrado de Defesa Social
RMBH Região Metropolitana de Belo Horizonte
SATVASistema de Acompanhamento das Obrigações das Prestadoras de TV por Assinatura.
SDESecretaria de Desenvolvimento Econômico (Distrito Federal)
SDSCSecretaria de Desenvolvimento Social e Cidadania (Recife)
SEADE Fundação Sistema Estadual de Análise de Dados
SECEX Secretaria de Comércio Exterior
SEDESESecretaria de Estado de Desenvolvimento Social (Minas Gerais)
SEDEST Secretaria de Estado de Desenvolvimento Social e Transferência de Renda (Distrito Federal)
SEDS Secretaria de Estado de Defesa Social
SEF Secretaria de Estado da Fazenda
SEISuperintendência de Estudos Econômicos e Sociais (Bahia)
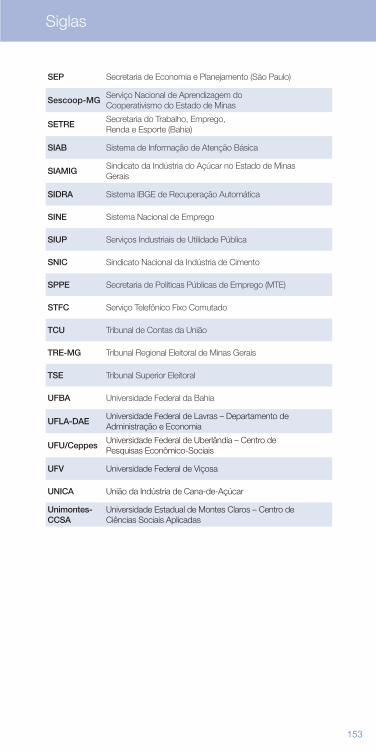
152 153
SEP Secretaria de Economia e Planejamento (São Paulo)
Sescoop-MGServiço Nacional de Aprendizagem do Cooperativismo do Estado de Minas
SETRESecretaria do Trabalho, Emprego, Renda e Esporte (Bahia)
SIAB Sistema de Informação de Atenção Básica
SIAMIGSindicato da Indústria do Açúcar no Estado de Minas Gerais
SIDRA Sistema IBGE de Recuperação Automática
SINE Sistema Nacional de Emprego
SIUP Serviços Industriais de Utilidade Pública
SNIC Sindicato Nacional da Indústria de Cimento
SPPE Secretaria de Políticas Públicas de Emprego (MTE)
STFC Serviço Telefônico Fixo Comutado
TCU Tribunal de Contas da União
TRE-MG Tribunal Regional Eleitoral de Minas Gerais
TSE Tribunal Superior Eleitoral
UFBA Universidade Federal da Bahia
UFLA-DAEUniversidade Federal de Lavras – Departamento de Administração e Economia
UFU/CeppesUniversidade Federal de Uberlândia – Centro de Pesquisas Econômico-Sociais
UFV Universidade Federal de Viçosa
UNICA União da Indústria de Cana-de-Açúcar
Unimontes-CCSA
Universidade Estadual de Montes Claros – Centro de Ciências Sociais Aplicadas
Siglas

154154

155
Established by Law nº 5399, of the 12th of December 1969, the objectives of the João Pinheiro Foundation are the following:
• To coordinate the State System of Statistics;
• To contribute to the creation, implementation and evaluationof public policy;
• To promote professional training in the skills necessary foradministrative modernization of the public sector, and forthe implementation of public policy;
• To provide technical advice to public bodies and institutionsat all three levels of government: municipal, state and federal.
Linked to the State Department of Planning and Management, the João Pinheiro Foundation consists of four technical departments – the Centre for Statistics and Information, the Centre for Public Policy Studies, the Centre for Applied Research and the School of Government – as well as an administrative body, the Department of Planning, Management and Finance.
The João Pinheiro Foundation provides services in these areas to Brazilian city, state and federal governments, municipal chambers, national and international institutions, private companies and other organizations.
MissionTo produce and share knowledge and statistics, to train managers on a constant basis, and promote public policies that contribute to the creation of a fairer society.
VisionTo be an example in the production, dissemination and application of information for organizations and individuals.
ValuesCommitment to excellence, social responsibility, a climate of innovation and the positive recognition of individuals.
Contact DetailsJoão Pinheiro FoundationCentre for Statistics and Information
Alameda das Acácias, 70 - Bairro São Luís/PampulhaCEP: 31275-150 - Belo Horizonte - Minas GeraisTelephone: (+55) 31-3448-9719 / (+55) 31-3448-9400www.fjp.mg.gov.br
João Pinheiro Foundation (FJP)

156156
157
The João Pinheiro Foundation (FJP), in partnership with
the Brazilian Company of Mining and Metallurgy (CBMM),
presents the 16th edition of the Profile of Minas Gerais
2013. Published annually in both English and Portuguese,
the Profile contains up-to-date synthetic indicators
regarding various features of the state of Minas Gerais.
In seven sections, the publication brings together the
main geographic, economic and social data for the state.
Wherever possible, it also includes data for Brazil as a
whole, permitting the information for Minas Gerais to be
seen within the wider national context.
The concision with which the Profile addresses such a
broad range of issues affecting Minas Gerais ensures
that it will become an invaluable tool for researchers and
planners, in both the public and private sectors. Moreover,
this English translation guarantees a more extensive
readership.
The Profile was created by the Centre for Statistics
and Information (CEI), with the collaboration of experts
from the Centre for Public Policy Studies (CEPP) and
the Centre for Applied Research (CPA), all of which are
departments at the João Pinheiro Foundation.
The Profile of Minas Gerais is also available in digital
format, on the site www.fjp.mg.gov.br, while a printed
version may be consulted at the library in the João
Pinheiro Foundation.
Marilena Chaves
President of the João Pinheiro Foundation
Introduction

158158158
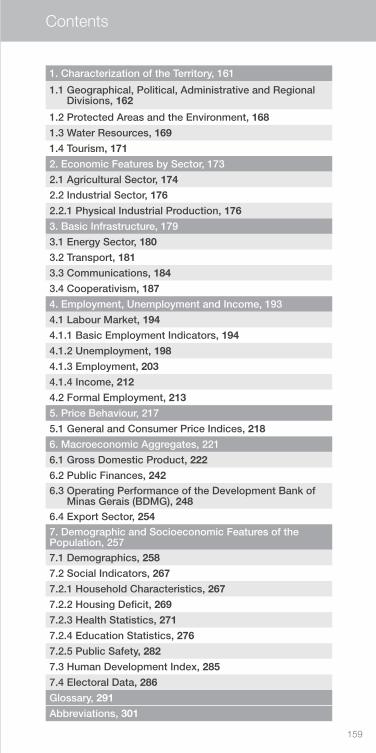
159
1. Characterization of the Territory, 161
1.1 Geographical, Political, Administrative and Regional Divisions, 162
1.2 Protected Areas and the Environment, 168
1.3 Water Resources, 169
1.4 Tourism, 171
2. Economic Features by Sector, 173
2.1 Agricultural Sector, 174
2.2 Industrial Sector, 176
2.2.1 Physical Industrial Production, 176
3. Basic Infrastructure, 179
3.1 Energy Sector, 180
3.2 Transport, 181
3.3 Communications, 184
3.4 Cooperativism, 187
4. Employment, Unemployment and Income, 193
4.1 Labour Market, 194
4.1.1 Basic Employment Indicators, 194
4.1.2 Unemployment, 198
4.1.3 Employment, 203
4.1.4 Income, 212
4.2 Formal Employment, 213
5. Price Behaviour, 217
5.1 General and Consumer Price Indices, 218
6. Macroeconomic Aggregates, 221
6.1 Gross Domestic Product, 222
6.2 Public Finances, 2426.3 Operating Performance of the Development Bank of
Minas Gerais (BDMG), 2486.4 Export Sector, 2547. Demographic and Socioeconomic Features of the Population, 257
7.1 Demographics, 258
7.2 Social Indicators, 267
7.2.1 Household Characteristics, 267
7.2.2 Housing Deficit, 269
7.2.3 Health Statistics, 271
7.2.4 Education Statistics, 276
7.2.5 Public Safety, 282
7.3 Human Development Index, 285
7.4 Electoral Data, 286
Glossary, 291
Abbreviations, 301
Contents

160160

161
Characterizationof the Territory
1
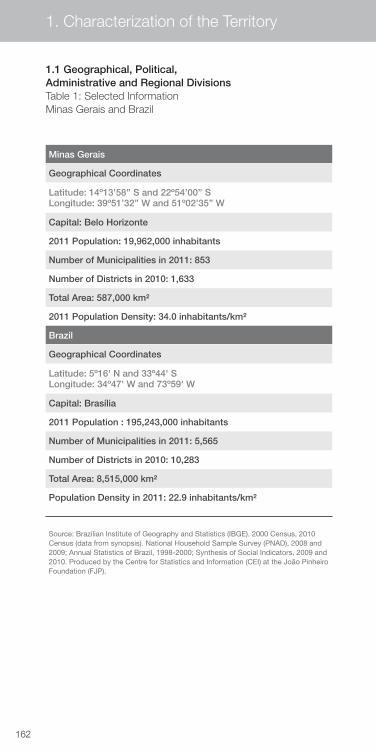
162 163162
Amazonas Pará
Mato Grosso
Mato Grossodo Sul
Bahia
SOUTHEAST
São Paulo
Paraná
Rio Grandedo Sul
Maranhão Ceará
RoraimaAmapá
Tocantins
Goiás
Acre
Rondônia
Rio Grande do Norte
Paraíba
Pernambuco
Alagoas
Sergipe
Espírito Santo
Rio de Janeiro
Santa Catarina
Minas Gerais
NORTH
SOUTH
Piauí
NORTHEAST
CENTRAL-WEST
0 200 400 600 km
Minas Gerais
Geographical Coordinates
Latitude: 14º13’58’’ S and 22º54’00’’ SLongitude: 39º51’32’’ W and 51º02’35’’ W
Capital: Belo Horizonte
2011 Population: 19,962,000 inhabitants
Number of Municipalities in 2011: 853
Number of Districts in 2010: 1,633
Total Area: 587,000 km²
2011 Population Density: 34.0 inhabitants/km²
Brazil
Geographical Coordinates
Latitude: 5º16' N and 33º44' S Longitude: 34º47' W and 73º59' W
Capital: Brasília
2011 Population : 195,243,000 inhabitants
Number of Municipalities in 2011: 5,565
Number of Districts in 2010: 10,283
Total Area: 8,515,000 km²
Population Density in 2011: 22.9 inhabitants/km²
Source: Brazilian Institute of Geography and Statistics (IBGE). 2000 Census, 2010 Census (data from synopsis). National Household Sample Survey (PNAD), 2008 and 2009; Annual Statistics of Brazil, 1998-2000; Synthesis of Social Indicators, 2009 and 2010. Produced by the Centre for Statistics and Information (CEI) at the João Pinheiro Foundation (FJP).
1.1 Geographical, Political, Administrative and Regional DivisionsTable 1: Selected InformationMinas Gerais and Brazil
1. Characterization of the Territory
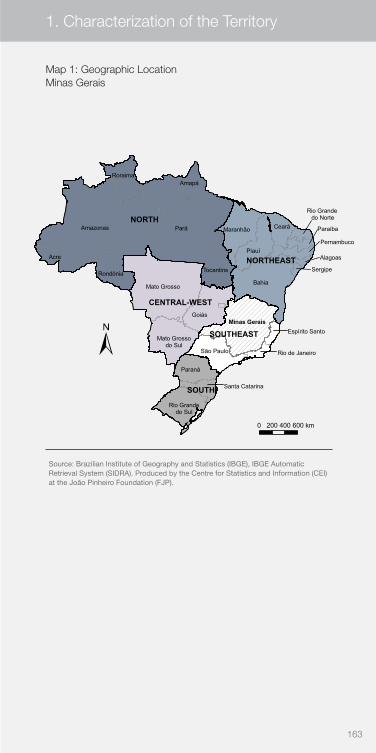
162 163
Map 1: Geographic LocationMinas Gerais
Amazonas Pará
Mato Grosso
Mato Grossodo Sul
Bahia
SOUTHEAST
São Paulo
Paraná
Rio Grandedo Sul
Maranhão Ceará
RoraimaAmapá
Tocantins
Goiás
Acre
Rondônia
Rio Grande do Norte
Paraíba
Pernambuco
Alagoas
Sergipe
Espírito Santo
Rio de Janeiro
Santa Catarina
Minas Gerais
NORTH
SOUTH
Piauí
NORTHEAST
CENTRAL-WEST
0 200 400 600 km
Source: Brazilian Institute of Geography and Statistics (IBGE), IBGE Automatic Retrieval System (SIDRA). Produced by the Centre for Statistics and Information (CEI) at the João Pinheiro Foundation (FJP).
1. Characterization of the Territory
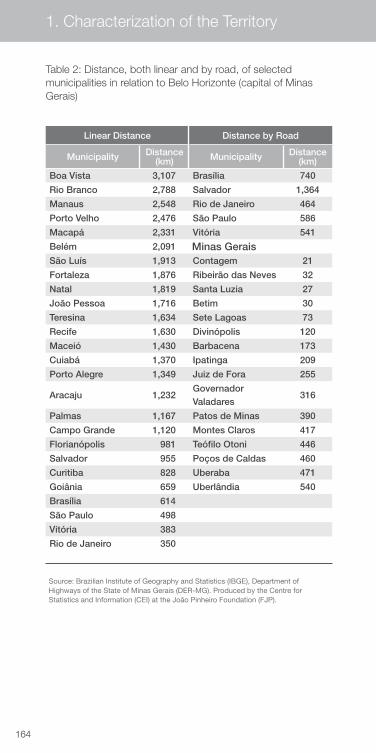
164 165164
1. Characterization of the Territory
Table 2: Distance, both linear and by road, of selected municipalities in relation to Belo Horizonte (capital of Minas Gerais)
Linear Distance Distance by Road
Municipality Distance (km) Municipality Distance
(km)
Boa Vista 3,107 Brasília 740
Rio Branco 2,788 Salvador 1,364
Manaus 2,548 Rio de Janeiro 464
Porto Velho 2,476 São Paulo 586
Macapá 2,331 Vitória 541
Belém 2,091 Minas GeraisSão Luís 1,913 Contagem 21
Fortaleza 1,876 Ribeirão das Neves 32
Natal 1,819 Santa Luzia 27
João Pessoa 1,716 Betim 30
Teresina 1,634 Sete Lagoas 73
Recife 1,630 Divinópolis 120
Maceió 1,430 Barbacena 173
Cuiabá 1,370 Ipatinga 209
Porto Alegre 1,349 Juiz de Fora 255
Aracaju 1,232Governador Valadares
316
Palmas 1,167 Patos de Minas 390
Campo Grande 1,120 Montes Claros 417
Florianópolis 981 Teófilo Otoni 446
Salvador 955 Poços de Caldas 460
Curitiba 828 Uberaba 471
Goiânia 659 Uberlândia 540
Brasília 614
São Paulo 498
Vitória 383
Rio de Janeiro 350
Source: Brazilian Institute of Geography and Statistics (IBGE), Department of Highways of the State of Minas Gerais (DER-MG). Produced by the Centre for Statistics and Information (CEI) at the João Pinheiro Foundation (FJP).
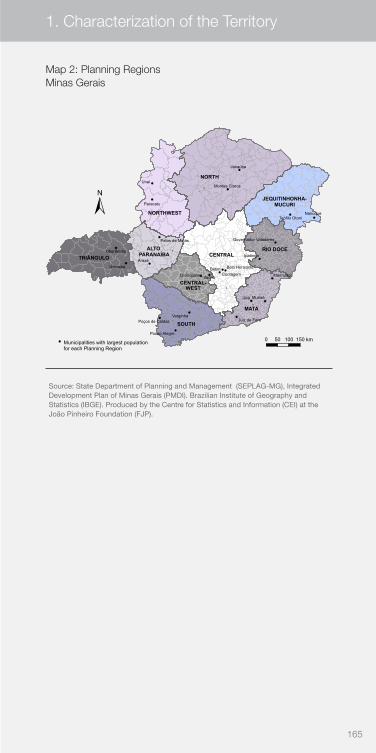
164 165
1. Characterization of the Territory
Source: State Department of Planning and Management (SEPLAG-MG), Integrated Development Plan of Minas Gerais (PMDI). Brazilian Institute of Geography and Statistics (IBGE). Produced by the Centre for Statistics and Information (CEI) at the João Pinheiro Foundation (FJP).
CENTRAL
Janaúba
NORTH
JEQUITINHONHA-MUCURI
TRIÂNGULO
NORTHWEST
ALTO PARANAÍBA
SOUTH
Divinópolis ItaúnaCENTRAL-WEST
MATA
RIO DOCE
Unaí
Paracatu
Uberaba
Uberlândia
Teófilo Otoni
Montes Claros
Patos de Minas
Araxá
Nanuque
Muriaé
Juiz de Fora
Ubá
Governador Valadares
BetimManhuaçu
Varginha
Pouso Alegre
Poços de Caldas
Belo Horizonte
Ipatinga
0 50 100 150 kmMunicipalities with largest population for each Planning Region
Contagem
Map 2: Planning RegionsMinas Gerais
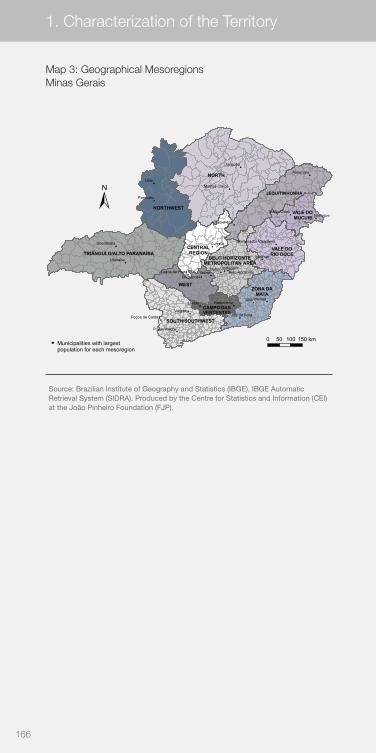
166 167166 167
1. Characterization of the Territory
TRIÂNGULO/ALTO PARANAÍBACENTRAL REGION
SOUTH/SOUTHWEST
NORTHWEST
METROPOLITAN AREA
VALE DORIO DOCE
JEQUITINHONHA
VALE DO MUCURI
Divinópolis
WESTZONA DA
MATA
BELO HORIZONTE
CAMPODASVERTENTES
Ubá
Unaí
Betim
Muriaé
Itaúna
Lavras
Nanuque
Janaúba
Curvelo
UberabaIpatinga
Almenara
Paracatu
Contagem
Varginha
Barbacena
Diamantina
Uberlândia
Juiz de Fora
Pouso Alegre
Teófilo Otoni
NORTH
Montes Claros
Belo HorizonteLagoa da Prata
Poços de Caldas
Governador Valadares
0 50 100 150 kmMunicipalities with largestpopulation for each mesoregion
Map 3: Geographical MesoregionsMinas Gerais
Source: Brazilian Institute of Geography and Statistics (IBGE), IBGE Automatic Retrieval System (SIDRA). Produced by the Centre for Statistics and Information (CEI) at the João Pinheiro Foundation (FJP).
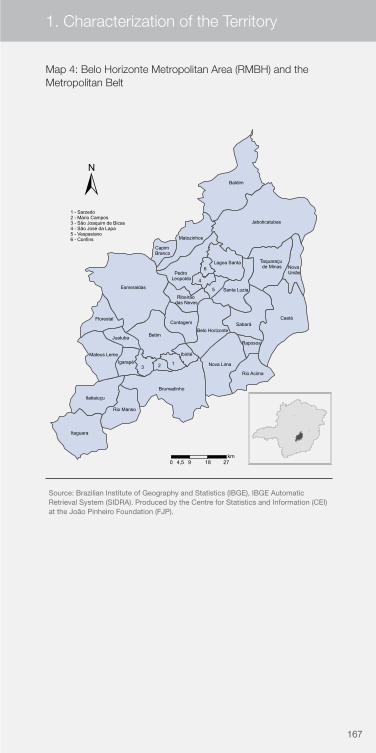
166 167166 167
1. Characterization of the Territory
Map 4: Belo Horizonte Metropolitan Area (RMBH) and the Metropolitan Belt
12
Taquaraçu de Minas
Pedro Leopoldo
Capim Branco
Ribeirão das Neves
3
Nova União
Raposos
4
5
6
Caeté
Baldim
Esmeraldas
Jaboticatubas
Betim
Brumadinho
Itaguara
Sabará
Nova Lima
Itatiaiuçu
Mateus Leme
Rio Manso
Rio Acima
Matozinhos
Belo Horizonte
Florestal
Santa Luzia
Contagem
Lagoa Santa
Igarapé
Juatuba
Ibirité
1 - Sarzedo2 - Mário Campos3 - São Joaquim de Bicas 4 - São José da Lapa5 - Vespasiano6 - Confins
0 9 18 274,5km
Source: Brazilian Institute of Geography and Statistics (IBGE), IBGE Automatic Retrieval System (SIDRA). Produced by the Centre for Statistics and Information (CEI) at the João Pinheiro Foundation (FJP).
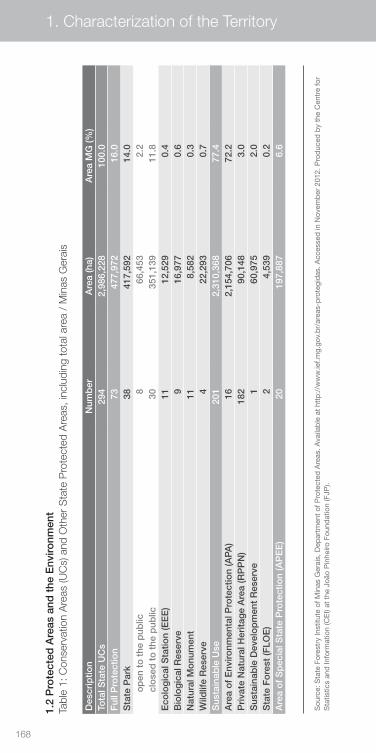
168
1. Characterization of the Territory
1.2
Pro
tect
ed A
reas
and
the
Env
ironm
ent
Tabl
e 1:
Con
serv
atio
n A
reas
(UC
s) a
nd O
ther
Sta
te P
rote
cted
Are
as, i
nclu
ding
tota
l are
a /
Min
as G
erai
s
Sou
rce:
Sta
te F
ores
try
Inst
itute
of M
inas
Ger
ais,
Dep
artm
ent
of P
rote
cted
Are
as. A
vaila
ble
at
http
://w
ww
.ief.m
g.go
v.b
r/ar
eas-
pro
tegi
das
. Acc
esse
d in
Nov
emb
er 2
012.
Pro
duc
ed b
y th
e C
entr
e fo
r S
tatis
tics
and
Info
rmat
ion
(CE
I) at
the
Joã
o P
inhe
iro F
ound
atio
n (F
JP).
Des
crip
tion
Num
ber
Are
a (h
a)A
rea
MG
(%)
Tota
l Sta
te U
Cs
294
2,98
6,22
810
0.0
Ful
l Pro
tect
ion
7347
7,97
216
.0S
tate
Par
k38
417,
592
14.0
o
pen
to
the
pub
lic8
66,4
532.
2
clo
sed
to
the
pub
lic30
351,
139
11.8
Eco
log
ical
Sta
tion
(EE
E)
1112
,529
0.4
Bio
log
ical
Res
erve
916
,977
0.6
Nat
ural
Mo
num
ent
118,
582
0.3
Wild
life
Res
erve
422
,293
0.7
Sus
tain
able
Use
201
2,31
0,36
877
.4A
rea
of
Env
ironm
enta
l Pro
tect
ion
(AP
A)
162,
154,
706
72.2
Pri
vate
Nat
ural
Her
itag
e A
rea
(RP
PN
)18
290
,148
3.0
Sus
tain
able
Dev
elo
pm
ent
Res
erve
160
,975
2.0
Sta
te F
ore
st (F
LOE
)2
4,53
90.
2A
rea
of
Sp
ecia
l Sta
te P
rote
ctio
n (A
PE
E)
2019
7,88
76.
6
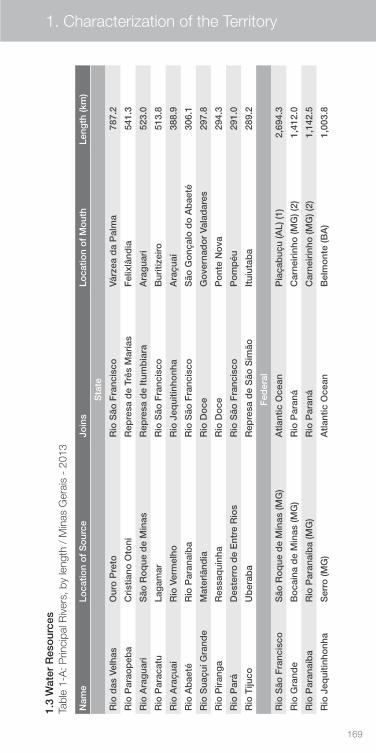
169
Nam
eLo
catio
n o
f S
our
ceJo
ins
Loca
tion
of
Mo
uth
Leng
th (k
m)
Sta
te
Rio
das
Vel
has
Our
o P
reto
Rio
São
Fra
ncis
coVá
rzea
da
Pal
ma
787.
2
Rio
Par
aop
eba
Cri
stia
no O
toni
Rep
resa
de
Três
Mar
ias
Fel
ixlâ
ndia
541.
3
Rio
Ara
gua
riS
ão R
oq
ue d
e M
inas
Rep
resa
de
Itum
bia
raA
rag
uari
523.
0
Rio
Par
acat
uLa
gam
arR
io S
ão F
ranc
isco
Bur
itize
iro51
3.8
Rio
Ara
çuaí
Rio
Ver
mel
hoR
io J
equi
tinho
nha
Ara
çuaí
388.
9
Rio
Ab
aeté
Rio
Par
anaí
ba
Rio
São
Fra
ncis
coS
ão G
onç
alo
do
Ab
aeté
306.
1
Rio
Sua
çuí G
rand
eM
ater
lând
iaR
io D
oce
Go
vern
ado
r Va
lad
ares
297.
8
Rio
Pir
ang
aR
essa
qui
nha
Rio
Do
ceP
ont
e N
ova
294.
3
Rio
Par
áD
este
rro
de
Ent
re R
ios
Rio
São
Fra
ncis
coP
om
péu
291.
0
Rio
Tiju
coU
ber
aba
Rep
resa
de
São
Sim
ãoIt
uiut
aba
289.
2
Fed
eral
Rio
São
Fra
ncis
coS
ão R
oq
ue d
e M
inas
(MG
)A
tlant
ic O
cean
Pia
çab
uçu
(AL)
(1)
2,69
4.3
Rio
Gra
nde
Bo
cain
a d
e M
inas
(MG
)R
io P
aran
áC
arne
irin
ho (M
G) (
2)1,
412.
0
Rio
Par
anaí
ba
Rio
Par
anaí
ba
(MG
)R
io P
aran
áC
arne
irin
ho (M
G) (
2)1,
142.
5
Rio
Jeq
uitin
honh
aS
erro
(MG
)A
tlant
ic O
cean
Bel
mo
nte
(BA
)1,
003.
8
1.3
Wat
er R
eso
urce
sTa
ble
1-A
: Prin
cipa
l Riv
ers,
by
leng
th /
Min
as G
erai
s -
2013
1. Characterization of the Territory
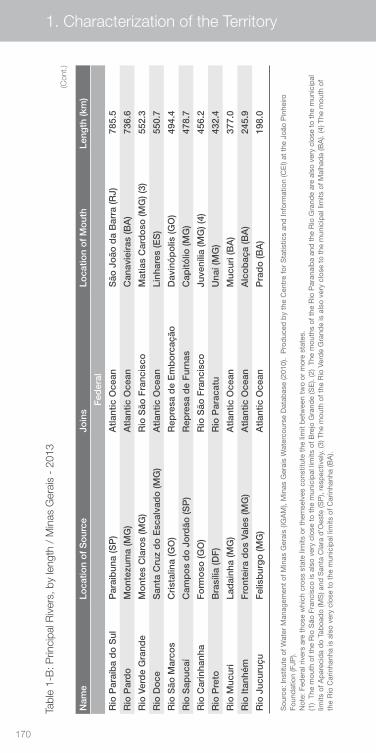
170
Nam
eLo
catio
n o
f S
our
ceJo
ins
Loca
tion
of
Mo
uth
Leng
th (k
m)
Fed
eral
Rio
Par
aíb
a d
o S
ulP
arai
bun
a (S
P)
Atla
ntic
Oce
anS
ão J
oão
da
Bar
ra (R
J)78
5.5
Rio
Par
do
Mo
ntez
uma
(MG
)A
tlant
ic O
cean
Can
avie
iras
(BA
)73
6.6
Rio
Ver
de
Gra
nde
Mo
ntes
Cla
ros
(MG
)R
io S
ão F
ranc
isco
Mat
ias
Car
do
so (M
G) (
3)55
2.3
Rio
Do
ceS
anta
Cru
z d
o E
scal
vad
o (M
G)
Atla
ntic
Oce
anLi
nhar
es (E
S)
550.
7
Rio
São
Mar
cos
Cri
stal
ina
(GO
)R
epre
sa d
e E
mb
orc
ação
D
avin
óp
olis
(GO
)49
4.4
Rio
Sap
ucaí
Cam
po
s d
o J
ord
ão (S
P)
Rep
resa
de
Fur
nas
Cap
itólio
(MG
)47
8.7
Rio
Car
inha
nha
Fo
rmo
so (G
O)
Rio
São
Fra
ncis
coJu
vení
lia (M
G) (
4)45
6.2
Rio
Pre
toB
rasí
lia (D
F)
Rio
Par
acat
uU
naí (
MG
)43
2.4
Rio
Muc
uri
Lad
ainh
a (M
G)
Atla
ntic
Oce
anM
ucur
i (B
A)
377.
0
Rio
Itan
hém
Fro
ntei
ra d
os
Vale
s (M
G)
Atla
ntic
Oce
anA
lco
baç
a (B
A)
245.
9
Rio
Juc
uruç
uF
elis
bur
go
(MG
)A
tlant
ic O
cean
Pra
do
(BA
)19
8.0
Tabl
e 1-
B: P
rinci
pal R
iver
s, b
y le
ngth
/ M
inas
Ger
ais
- 20
13(C
ont.)
Sou
rce:
Inst
itute
of W
ater
Man
agem
ent
of M
inas
Ger
ais
(IGA
M),
Min
as G
erai
s W
ater
cour
se D
atab
ase
(201
0).
Pro
duc
ed b
y th
e C
entr
e fo
r S
tatis
tics
and
Info
rmat
ion
(CE
I) at
the
Joã
o P
inhe
iro
Foun
dat
ion
(FJP
). N
ote:
Fed
eral
riv
ers
are
thos
e w
hich
cro
ss s
tate
lim
its o
r th
emse
lves
con
stitu
te t
he li
mit
bet
wee
n tw
o or
mor
e st
ates
. (1
) Th
e m
outh
of t
he R
io S
ão F
ranc
isco
is a
lso
very
clo
se t
o th
e m
unic
ipal
lim
its o
f Bre
jo G
rand
e (S
E).
(2)
The
mou
ths
of t
he R
io P
aran
aíb
a an
d t
he R
io G
rand
e ar
e al
so v
ery
clos
e to
the
mun
icip
al
limits
of A
par
ecid
a d
o Ta
boa
do
(MS
) and
San
ta C
lara
d’O
este
(SP
), re
spec
tivel
y. (3
) The
mou
th o
f the
Rio
Ver
de
Gra
nde
is a
lso
very
clo
se t
o th
e m
unic
ipal
lim
its o
f Mal
had
a (B
A).
(4) T
he m
outh
of
the
Rio
Car
inha
nha
is a
lso
very
clo
se t
o th
e m
unic
ipal
lim
its o
f Car
inha
nha
(BA
).
1. Characterization of the Territory
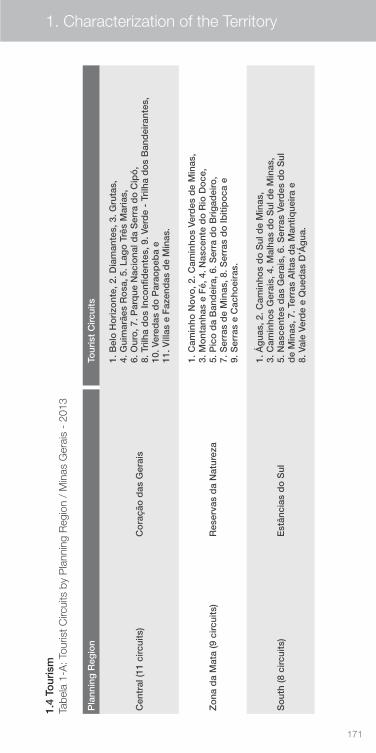
171
1.4
Tour
ism
Tabe
la 1
-A: T
ouris
t Circ
uits
by
Pla
nnin
g R
egio
n /
Min
as G
erai
s -
2013
Pla
nnin
g R
egio
nTo
uris
t C
ircui
ts
Cen
tral
(11
circ
uits
)C
ora
ção
das
Ger
ais
1. B
elo
Ho
rizo
nte,
2. D
iam
ante
s, 3
. Gru
tas,
4.
Gui
mar
ães
Ro
sa, 5
. Lag
o T
rês
Mar
ias,
6.
Our
o, 7
. Par
que
Nac
iona
l da
Ser
ra d
o C
ipó
, 8.
Tri
lha
do
s In
conf
iden
tes,
9. V
erd
e -
Trilh
a d
os
Ban
dei
rant
es,
10. V
ered
as d
o P
arao
peb
a e
11. V
illas
e F
azen
das
de
Min
as.
Zo
na d
a M
ata
(9 c
ircui
ts)
Res
erva
s d
a N
atur
eza
1. C
amin
ho N
ovo
, 2. C
amin
hos
Verd
es d
e M
inas
, 3.
Mo
ntan
has
e F
é, 4
. Nas
cent
e d
o R
io D
oce
, 5.
Pic
o d
a B
and
eira
, 6. S
erra
do
Bri
gad
eiro
, 7.
Ser
ras
de
Min
as, 8
. Ser
ras
do
Ibiti
po
ca e
9.
Ser
ras
e C
acho
eira
s.
So
uth
(8 c
ircui
ts)
Est
ânci
as d
o S
ul
1. Á
gua
s, 2
. Cam
inho
s d
o S
ul d
e M
inas
, 3.
Cam
inho
s G
erai
s, 4
. Mal
has
do
Sul
de
Min
as,
5. N
asce
ntes
das
Ger
ais,
6. S
erra
s Ve
rdes
do
Sul
d
e M
inas
, 7. T
erra
s A
ltas
da
Man
tique
ira
e 8.
Val
e Ve
rde
e Q
ued
as D
’Ág
ua.
Sou
rce:
Inst
itute
of W
ater
Man
agem
ent
of M
inas
Ger
ais
(IGA
M),
Min
as G
erai
s W
ater
cour
se D
atab
ase
(201
0).
Pro
duc
ed b
y th
e C
entr
e fo
r S
tatis
tics
and
Info
rmat
ion
(CE
I) at
the
Joã
o P
inhe
iro
Foun
dat
ion
(FJP
). N
ote:
Fed
eral
riv
ers
are
thos
e w
hich
cro
ss s
tate
lim
its o
r th
emse
lves
con
stitu
te t
he li
mit
bet
wee
n tw
o or
mor
e st
ates
. (1
) Th
e m
outh
of t
he R
io S
ão F
ranc
isco
is a
lso
very
clo
se t
o th
e m
unic
ipal
lim
its o
f Bre
jo G
rand
e (S
E).
(2)
The
mou
ths
of t
he R
io P
aran
aíb
a an
d t
he R
io G
rand
e ar
e al
so v
ery
clos
e to
the
mun
icip
al
limits
of A
par
ecid
a d
o Ta
boa
do
(MS
) and
San
ta C
lara
d’O
este
(SP
), re
spec
tivel
y. (3
) The
mou
th o
f the
Rio
Ver
de
Gra
nde
is a
lso
very
clo
se t
o th
e m
unic
ipal
lim
its o
f Mal
had
a (B
A).
(4) T
he m
outh
of
the
Rio
Car
inha
nha
is a
lso
very
clo
se t
o th
e m
unic
ipal
lim
its o
f Car
inha
nha
(BA
).
1. Characterization of the Territory
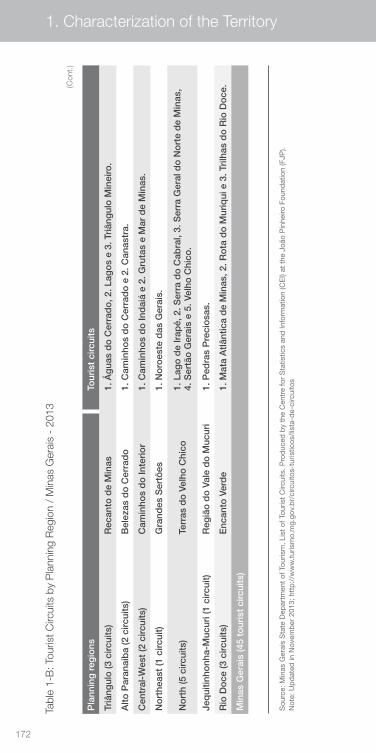
172
Tabl
e 1-
B: T
ouris
t Circ
uits
by
Pla
nnin
g R
egio
n /
Min
as G
erai
s -
2013
Pla
nnin
g r
egio
nsTo
uris
t ci
rcui
ts
Triâ
ngul
o (3
circ
uits
)R
ecan
to d
e M
inas
1. Á
gua
s d
o C
erra
do
, 2. L
ago
s e
3. T
riân
gul
o M
inei
ro.
Alto
Par
anaí
ba
(2 c
ircui
ts)
Bel
ezas
do
Cer
rad
o1.
Cam
inho
s d
o C
erra
do
e 2
. Can
astr
a.
Cen
tral
-Wes
t (2
circ
uits
)C
amin
hos
do
Inte
rio
r1.
Cam
inho
s d
o In
dai
á e
2. G
ruta
s e
Mar
de
Min
as.
No
rthe
ast
(1 c
ircui
t)G
rand
es S
ertõ
es1.
No
roes
te d
as G
erai
s.
No
rth
(5 c
ircui
ts)
Terr
as d
o V
elho
Chi
co1.
Lag
o d
e Ir
apé,
2. S
erra
do
Cab
ral,
3. S
erra
Ger
al d
o N
ort
e d
e M
inas
, 4.
Ser
tão
Ger
ais
e 5.
Vel
ho C
hico
.
Jeq
uitin
honh
a-M
ucur
i (1
circ
uit)
Reg
ião
do
Val
e d
o M
ucur
i1.
Ped
ras
Pre
cio
sas.
Rio
Do
ce (3
circ
uits
)E
ncan
to V
erd
e1.
Mat
a A
tlânt
ica
de
Min
as, 2
. Ro
ta d
o M
uriq
ui e
3. T
rilh
as d
o R
io D
oce
.
Min
as G
erai
s (4
5 to
uris
t ci
rcui
ts)
(Con
t.)
Sou
rce:
Min
as G
erai
s S
tate
Dep
artm
ent
of T
ouris
m, L
ist
of T
ouris
t C
ircui
ts. P
rod
uced
by
the
Cen
tre
for
Sta
tistic
s an
d In
form
atio
n (C
EI)
at t
he J
oão
Pin
heiro
Fou
ndat
ion
(FJP
). N
ote:
Up
dat
ed in
Nov
emb
er 2
013;
htt
p:/
/ww
w.t
uris
mo.
mg.
gov.
br/
circ
uito
s-tu
ristic
os/li
sta-
de-
circ
uito
s
1. Characterization of the Territory

173
Economic Features by Sector
2
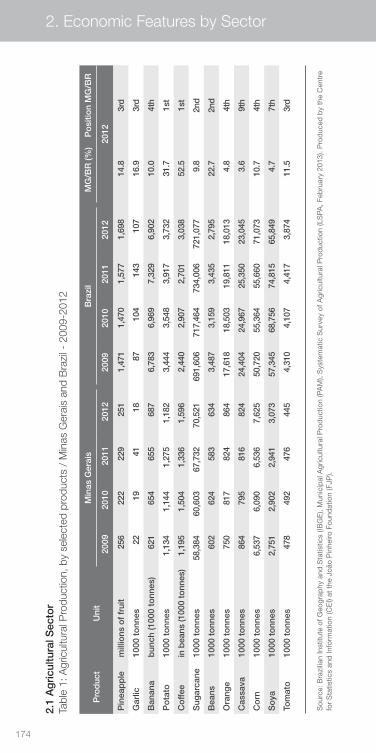
174
2. Economic Features by Sector
2.1
Ag
ricu
ltura
l Sec
tor
Tabl
e 1:
Agr
icul
tura
l Pro
duct
ion,
by
sele
cted
pro
duct
s /
Min
as G
erai
s an
d B
razi
l - 2
009-
2012
Sou
rce:
Bra
zilia
n In
stitu
te o
f Geo
grap
hy a
nd S
tatis
tics
(IBG
E),
Mun
icip
al A
gric
ultu
ral P
rod
uctio
n (P
AM
), S
yste
mat
ic S
urve
y of
Agr
icul
tura
l Pro
duc
tion
(LS
PA, F
ebru
ary
2013
). P
rod
uced
by
the
Cen
tre
for
Sta
tistic
s an
d In
form
atio
n (C
EI)
at t
he J
oão
Pin
heiro
Fou
ndat
ion
(FJP
).
Pro
duc
tU
nit
Min
as G
erai
sB
razi
lM
G/B
R (%
)P
osi
tion
MG
/BR
2009
2010
2011
2012
2009
2010
2011
2012
2012
Pin
eap
ple
mill
ions
of
frui
t25
622
222
925
11,
471
1,47
01,
577
1,69
8 14
.83r
d
Gar
lic10
00 t
onn
es22
1941
1887
104
143
107
16.9
3rd
Ban
ana
bun
ch (1
000
tonn
es)
621
654
655
687
6,78
36,
969
7,32
96,
902
10.0
4th
Po
tato
1000
to
nnes
1,13
41,
144
1,27
51,
182
3,44
43,
548
3,91
73,
732
31.7
1st
Co
ffee
in b
eans
(100
0 to
nnes
)1,
195
1,50
41,
336
1,59
62,
440
2,90
72,
701
3,03
8 52
.51s
t
Sug
arca
ne10
00 t
onn
es58
,384
60,6
0367
,732
70,5
2169
1,60
671
7,46
473
4,00
672
1,07
7 9.
82n
d
Bea
ns10
00 t
onn
es60
262
458
363
43,
487
3,15
93,
435
2,79
5 22
.72n
d
Ora
nge
1000
to
nnes
750
817
824
864
17,6
1818
,503
19,8
1118
,013
4.
84t
h
Cas
sava
1000
to
nnes
864
795
816
824
24,4
0424
,967
25,3
5023
,045
3.
69t
h
Co
rn10
00 t
onn
es6,
537
6,09
06,
536
7,62
550
,720
55,3
6455
,660
71,0
73
10.7
4th
So
ya10
00 t
onn
es2,
751
2,90
22,
941
3,07
357
,345
68,7
5674
,815
65,8
49
4.7
7th
Tom
ato
1000
to
nnes
478
492
476
445
4,31
04,
107
4,41
73,
874
11.5
3rd
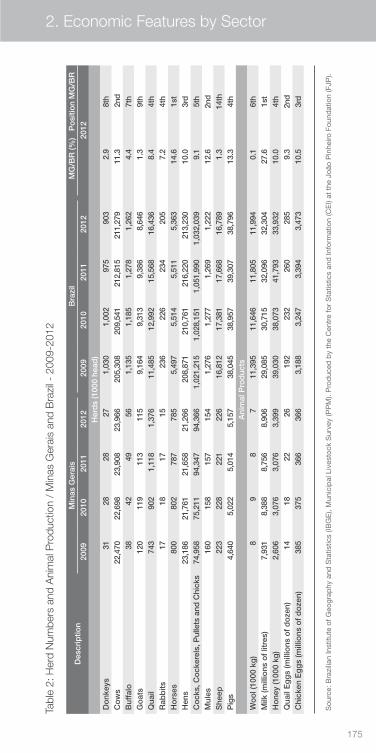
175
Tabl
e 2:
Her
d N
umbe
rs a
nd A
nim
al P
rodu
ctio
n /
Min
as G
erai
s an
d B
razi
l - 2
009-
2012
Sou
rce:
Bra
zilia
n In
stitu
te o
f Geo
grap
hy a
nd S
tatis
tics
(IBG
E),
Mun
icip
al L
ives
tock
Sur
vey
(PP
M).
Pro
duc
ed b
y th
e C
entr
e fo
r S
tatis
tics
and
Info
rmat
ion
(CE
I) at
the
Joã
o P
inhe
iro F
ound
atio
n (F
JP).
2. Economic Features by Sector
Des
crip
tion
Min
as G
erai
sB
razi
lM
G/B
R (%
)P
osi
tion
MG
/BR
2009
2010
2011
2012
2009
2010
2011
2012
2012
Her
ds
(100
0 he
ad)
Do
nkey
s31
2828
271,
030
1,00
297
590
32.
98t
hC
ow
s22
,470
22,6
9823
,908
23,9
6620
5,30
820
9,54
121
2,81
521
1,27
911
.3 2
nd
Buf
falo
3842
4956
1,13
51,
185
1,27
81,
262
4.4
7th
Go
ats
120
119
113
115
9,16
49,
313
9,38
68,
646
1.3
9th
Qua
il74
390
21,
118
1,37
611
,485
12,9
9215
,568
16,4
368.
44t
hR
abb
its17
1817
1523
622
623
420
57.
24t
hH
ors
es80
080
278
778
55,
497
5,51
45,
511
5,36
314
.61s
tH
ens
23,1
8621
,761
21,6
5821
,266
208,
871
210,
761
216,
220
213,
230
10.0
3rd
Coc
ks, C
ocke
rels
, Pul
lets
and
Chi
cks
74,9
5875
,211
94,3
4794
,366
1,02
1,21
51,
028,
151
1,05
1,99
01,
032,
039
9.1
5th
Mul
es16
015
815
715
41,
276
1,27
71,
269
1,22
212
.62n
dS
heep
223
228
221
226
16,8
1217
,381
17,6
6816
,789
1.3
14th
Pig
s4,
640
5,02
25,
014
5,15
738
,045
38,9
5739
,307
38,7
9613
.34t
hA
nim
al P
rod
ucts
Wo
ol (
1000
kg
)8
98
711
,395
11,6
4611
,805
11,9
940.
16t
hM
ilk (m
illio
ns o
f lit
res)
7,
931
8,38
88,
756
8,90
629
,085
30,7
1532
,096
32,3
0427
.61s
tH
one
y (1
000
kg)
2,60
63,
076
3,07
63,
399
39,0
3038
,073
41,7
9333
,932
10.0
4th
Qua
il E
gg
s (m
illio
ns o
f d
oze
n)14
1822
2619
223
226
028
59.
32n
dC
hick
en E
gg
s (m
illio
ns o
f d
oze
n)38
537
536
636
63,
188
3,24
73,
394
3,47
310
.53r
d
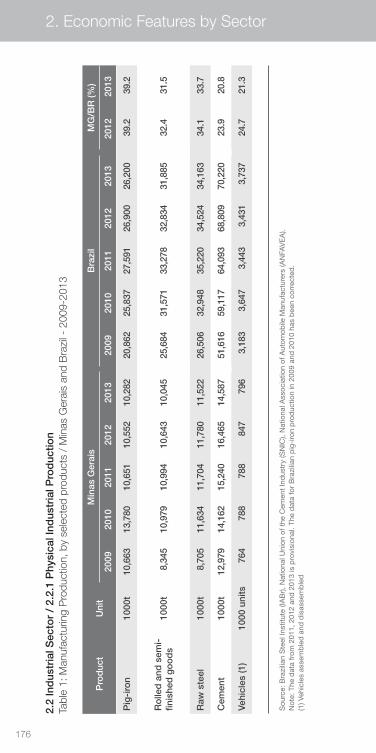
176
2. Economic Features by Sector
Pro
duc
tU
nit
Min
as G
erai
s B
razi
lM
G/B
R (%
)
2009
2010
2011
2012
2013
2009
2010
2011
2012
2013
2012
2013
Pig
-iro
n10
00t
10,6
63
13,7
80
10,6
51
10,5
52
10,2
82
20,8
62
25,8
37
27,5
91
26,9
00
26,2
00
39.2
39.2
Ro
lled
and
sem
i-fin
ishe
d g
oo
ds
1000
t8,
345
10,9
79
10,9
94
10,6
43
10,0
45
25,6
84
31,5
71
33,2
78
32,8
34
31,8
85
32.4
31.5
Raw
ste
el10
00t
8,70
5 11
,634
11
,704
11
,780
11
,522
26
,506
32
,948
35
,220
34
,524
34
,163
34
.133
.7
Cem
ent
1000
t12
,979
14
,162
15
,240
16
,465
14
,587
51
,616
59
,117
64
,093
68
,809
70
,220
23
.920
.8
Vehi
cles
(1)
1000
uni
ts76
4 78
8 78
8 84
7 79
6 3,
183
3,64
7 3,
443
3,43
1 3,
737
24.7
21.3
2.2
Ind
ustr
ial S
ecto
r /
2.2.
1 P
hysi
cal I
ndus
tria
l Pro
duc
tion
Tabl
e 1:
Man
ufac
turin
g P
rodu
ctio
n, b
y se
lect
ed p
rodu
cts
/ M
inas
Ger
ais
and
Bra
zil -
200
9-20
13
Sou
rce:
Bra
zilia
n S
teel
Inst
itute
(IA
Br)
, Nat
iona
l Uni
on o
f the
Cem
ent
Ind
ustr
y (S
NIC
), N
atio
nal A
ssoc
iatio
n of
Aut
omob
ile M
anuf
actu
rers
(AN
FAV
EA
). N
ote:
The
dat
a fr
om 2
011,
201
2 an
d 2
013
is p
rovi
sion
al. T
he d
ata
for
Bra
zilia
n p
ig-i
ron
pro
duc
tion
in 2
009
and
201
0 ha
s b
een
corr
ecte
d.
(1) V
ehic
les
asse
mb
led
and
dis
asse
mb
led
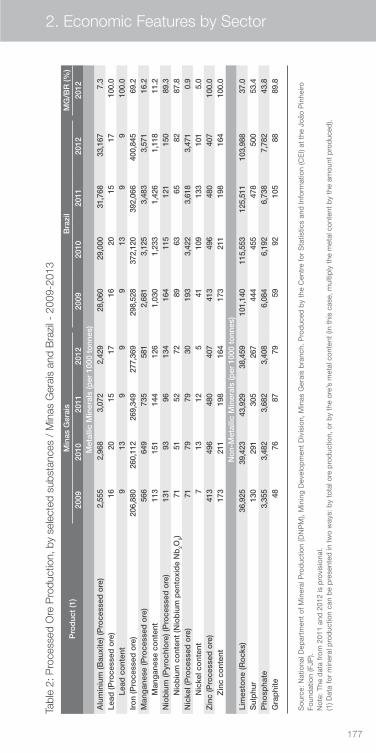
177
Tabl
e 2:
Pro
cess
ed O
re P
rodu
ctio
n, b
y se
lect
ed s
ubst
ance
s /
Min
as G
erai
s an
d B
razi
l - 2
009-
2013
Sou
rce:
Nat
iona
l Dep
artm
ent
of M
iner
al P
rod
uctio
n (D
NP
M),
Min
ing
Dev
elop
men
t D
ivis
ion,
Min
as G
erai
s b
ranc
h. P
rod
uced
by
the
Cen
tre
for
Sta
tistic
s an
d In
form
atio
n (C
EI)
at t
he J
oão
Pin
heiro
Fo
und
atio
n (F
JP).
Not
e: T
he d
ata
from
201
1 an
d 2
012
is p
rovi
sion
al.
(1) D
ata
for
min
eral
pro
duc
tion
can
be
pre
sent
ed in
tw
o w
ays:
by
tota
l ore
pro
duc
tion,
or
by
the
ore’
s m
etal
con
tent
(in
this
cas
e, m
ultip
ly t
he m
etal
con
tent
by
the
amou
nt p
rod
uced
).
2. Economic Features by Sector
Pro
duc
t (1
)M
inas
Ger
ais
Bra
zil
MG
/BR
(%)
2009
2010
2011
2012
2009
2010
2011
2012
2012
Met
allic
Min
eral
s (p
er 1
000
tonn
es)
Alu
min
ium
(Bau
xite
) (P
roce
ssed
ore
)2,
555
2,96
83,
072
2,42
928
,060
29,0
0031
,768
33,1
677.
3Le
ad (P
roce
ssed
ore
)16
2015
1716
2015
1710
0.0
Le
ad c
ont
ent
913
99
913
99
100.
0Ir
on
(Pro
cess
ed o
re)
206,
880
260,
112
269,
349
277,
369
298,
528
372,
120
392,
066
400,
845
69.2
Man
gan
ese
(Pro
cess
ed o
re)
566
649
735
581
2,68
13,
125
3,48
33,
571
16.2
M
ang
anes
e co
nten
t11
315
114
412
61,
030
1,23
31,
426
1,11
811
.2N
iob
ium
(Pyr
och
lore
) (P
roce
ssed
ore
)13
193
9613
416
411
512
115
089
.3
Nio
biu
m c
ont
ent
(Nio
biu
m p
ento
xid
e N
b2O
5)71
5152
7289
6365
8287
.8N
icke
l (P
roce
ssed
ore
)71
7979
3019
33,
422
3,61
83,
471
0.9
N
icke
l co
nten
t7
1312
541
109
133
101
5.0
Zin
c (P
roce
ssed
ore
)41
349
648
040
741
349
648
040
710
0.0
Z
inc
cont
ent
173
211
198
164
173
211
198
164
100.
0N
on-
Met
allic
Min
eral
s (p
er 1
000
tonn
es)
Lim
esto
ne (R
ock
s)36
,925
39,4
2343
,929
38,4
5910
1,14
011
5,55
312
5,51
110
3,98
837
.0S
ulp
hur
130
291
305
267
444
455
478
500
53.4
Pho
spha
te3,
355
3,48
23,
682
3,40
86,
084
6,19
26,
738
7,78
243
.8G
rap
hite
4876
8779
5992
105
8889
.8

178178

179
BasicInfrastructure
3
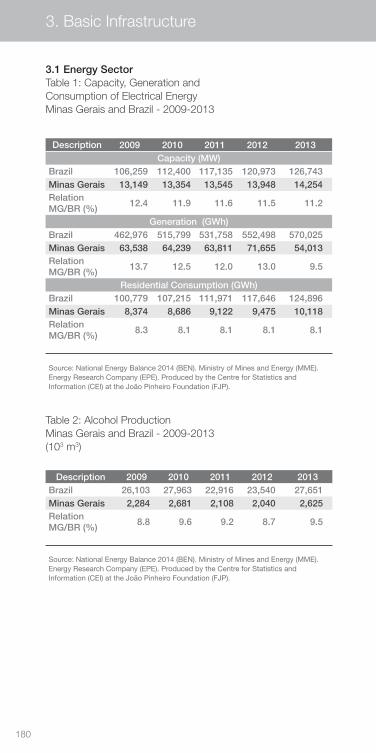
180
3. Basic Infrastructure
3.1 Energy SectorTable 1: Capacity, Generation and Consumption of Electrical EnergyMinas Gerais and Brazil - 2009-2013
Table 2: Alcohol ProductionMinas Gerais and Brazil - 2009-2013(103 m3)
Description 2009 2010 2011 2012 2013Capacity (MW)
Brazil 106,259 112,400 117,135 120,973 126,743Minas Gerais 13,149 13,354 13,545 13,948 14,254Relation MG/BR (%)
12.4 11.9 11.6 11.5 11.2
Generation (GWh)Brazil 462,976 515,799 531,758 552,498 570,025Minas Gerais 63,538 64,239 63,811 71,655 54,013Relation MG/BR (%)
13.7 12.5 12.0 13.0 9.5
Residential Consumption (GWh)Brazil 100,779 107,215 111,971 117,646 124,896Minas Gerais 8,374 8,686 9,122 9,475 10,118Relation MG/BR (%)
8.3 8.1 8.1 8.1 8.1
Description 2009 2010 2011 2012 2013Brazil 26,103 27,963 22,916 23,540 27,651Minas Gerais 2,284 2,681 2,108 2,040 2,625Relation MG/BR (%)
8.8 9.6 9.2 8.7 9.5
Source: National Energy Balance 2014 (BEN). Ministry of Mines and Energy (MME). Energy Research Company (EPE). Produced by the Centre for Statistics and Information (CEI) at the João Pinheiro Foundation (FJP).
Source: National Energy Balance 2014 (BEN). Ministry of Mines and Energy (MME). Energy Research Company (EPE). Produced by the Centre for Statistics and Information (CEI) at the João Pinheiro Foundation (FJP).
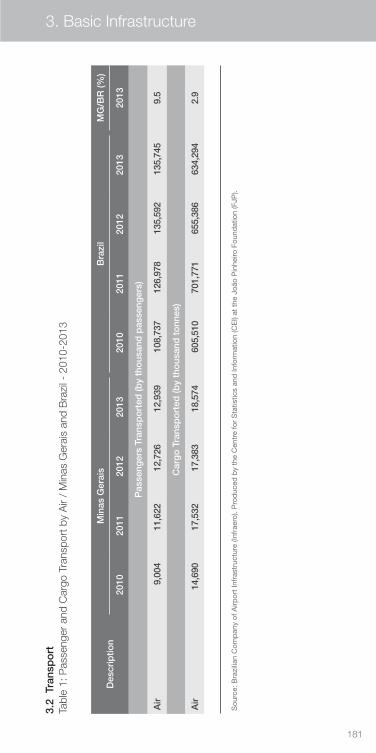
181
3. Basic Infrastructure
3.2
Tra
nsp
ort
Tabl
e 1:
Pas
seng
er a
nd C
argo
Tra
nspo
rt b
y A
ir /
Min
as G
erai
s an
d B
razi
l - 2
010-
2013
Sou
rce:
Bra
zilia
n C
omp
any
of A
irpor
t In
fras
truc
ture
(Inf
raer
o). P
rod
uced
by
the
Cen
tre
for
Sta
tistic
s an
d In
form
atio
n (C
EI)
at t
he J
oão
Pin
heiro
Fou
ndat
ion
(FJP
).
Des
crip
tion
Min
as G
erai
s B
razi
lM
G/B
R (%
)
2010
2011
2012
2013
2010
2011
2012
2013
2013
Pas
seng
ers
Tran
spo
rted
(by
tho
usan
d p
asse
nger
s)
Air
9,00
411
,622
12,7
2612
,939
108,
737
126,
978
135,
592
135,
745
9.5
Car
go
Tra
nsp
ort
ed (b
y th
ous
and
to
nnes
)
Air
14,6
9017
,532
17,3
8318
,574
605,
510
701,
771
655,
386
634,
294
2.9
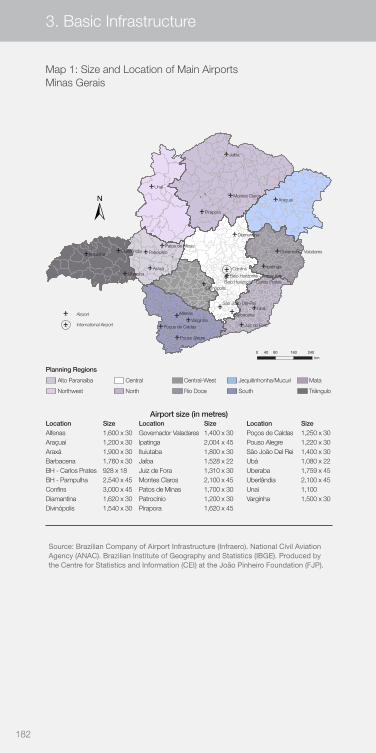
182 183
3. Basic Infrastructure
Map 1: Size and Location of Main Airports Minas Gerais
Source: Brazilian Company of Airport Infrastructure (Infraero). National Civil Aviation Agency (ANAC). Brazilian Institute of Geography and Statistics (IBGE). Produced by the Centre for Statistics and Information (CEI) at the João Pinheiro Foundation (FJP).
Ituiutaba Uberlândia
Araxá
UbáBarbacena
Uberaba
Patos de Minas
Pirapora
Unaí
Araçuaí
Jaíba
Diamantina
Montes Claros
Governador Valadares
Ipatinga
Belo Horizonte - PampulhaBelo Horizonte - Carlos Prates
São João Del-Rei
Juiz de ForaVarginha
Poços de Caldas
Pouso Alegre
Patrocínio
Divinópolis
AlfenasAirport
Airport size (in metres)Location Size Location Size Location SizeAlfenas 1,600 x 30 Governador Valadares 1,400 x 30 Poços de Caldas 1,250 x 30Araçuaí 1,200 x 30 Ipatinga 2,004 x 45 Pouso Alegre 1,220 x 30Araxá 1,900 x 30 Ituiutaba 1,800 x 30 São João Del Rei 1,400 x 30Barbacena 1,760 x 30 Jaíba 1,528 x 22 Ubá 1,080 x 22BH - Carlos Prates 928 x 18 Juiz de Fora 1,310 x 30 Uberaba 1,759 x 45BH - Pampulha 2,540 x 45 Montes Claros 2,100 x 45 Uberlândia 2,100 x 45Confins 3,000 x 45 Patos de Minas 1,700 x 30 Unaí 1,100Diamantina 1,620 x 30 Patrocínio 1,200 x 30 Varginha 1,500 x 30Divinópolis 1,540 x 30 Pirapora 1,620 x 45
International Airport
Confins
0 40 80 160 240km
Planning Regions
Alto Paranaíba Central Central-West Jequitinhonha/Mucuri Mata
Northwest North Rio Doce South Triângulo
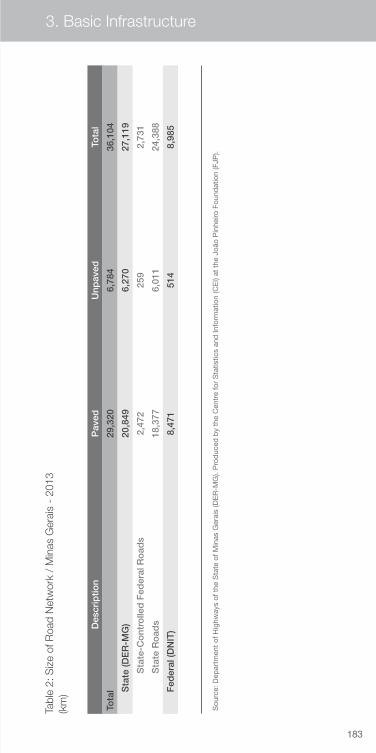
183182 183
3. Basic Infrastructure
Des
crip
tion
Pav
edU
npav
edTo
tal
Tota
l29
,320
6,78
436
,104
S
tate
(DE
R-M
G)
20,8
496,
270
27,1
19
Sta
te-C
ont
rolle
d F
eder
al R
oad
s2,
472
259
2,73
1
Sta
te R
oad
s18
,377
6,01
124
,388
F
eder
al (D
NIT
)8,
471
514
8,98
5
Tabl
e 2:
Siz
e of
Roa
d N
etw
ork
/ M
inas
Ger
ais
- 20
13
(km
)
Sou
rce:
Dep
artm
ent
of H
ighw
ays
of t
he S
tate
of M
inas
Ger
ais
(DE
R-M
G).
Pro
duc
ed b
y th
e C
entr
e fo
r S
tatis
tics
and
Info
rmat
ion
(CE
I) at
the
Joã
o P
inhe
iro F
ound
atio
n (F
JP).
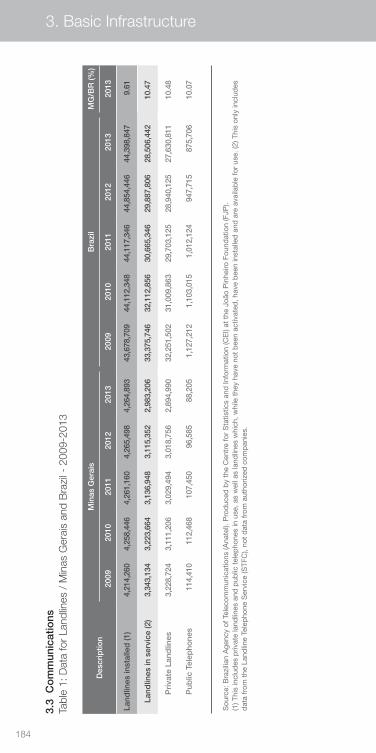
184
3. Basic Infrastructure
Des
crip
tion
Min
as G
erai
s B
razi
lM
G/B
R (%
)
2009
2010
2011
2012
2013
2009
2010
2011
2012
2013
2013
Land
lines
inst
alle
d (1
)4,
214,
260
4,25
8,44
64,
261,
160
4,26
5,49
84,
264,
893
43,6
78,7
09
44,1
12,3
48
44,1
17,3
46
44,8
54,4
46
44,3
98,8
47
9.61
La
ndlin
es in
ser
vice
(2)
3,34
3,13
43,
223,
664
3,13
6,94
83,
115,
352
2,98
3,20
633
,375
,746
32
,112
,856
30
,665
,346
29
,887
,806
28
,506
,442
10
.47
Pri
vate
Lan
dlin
es3,
228,
724
3,11
1,20
63,
029,
494
3,01
8,75
62,
894,
990
32,2
51,5
02
31,0
09,8
63
29,7
03,1
25
28,9
40,1
25
27,6
30,8
11
10.4
8
Pub
lic T
elep
hone
s11
4,41
011
2,46
810
7,45
096
,585
88,2
051,
127,
212
1,10
3,01
5 1,
012,
124
947,
715
875,
706
10.0
7
3.3
Co
mm
unic
atio
nsTa
ble
1: D
ata
for
Land
lines
/ M
inas
Ger
ais
and
Bra
zil -
200
9-20
13
Sou
rce:
Bra
zilia
n A
genc
y of
Tel
ecom
mun
icat
ions
(Ana
tel).
Pro
duc
ed b
y th
e C
entr
e fo
r S
tatis
tics
and
Info
rmat
ion
(CE
I) at
the
Joã
o P
inhe
iro F
ound
atio
n (F
JP).
(1) T
his
incl
udes
priv
ate
land
lines
and
pub
lic t
elep
hone
s in
use
, as
wel
l as
land
lines
whi
ch, w
hile
the
y ha
ve n
ot b
een
activ
ated
, hav
e b
een
inst
alle
d a
nd a
re a
vaila
ble
for
use.
(2) T
his
only
incl
udes
d
ata
from
the
Lan
dlin
e Te
lep
hone
Ser
vice
(STF
C),
not
dat
a fr
om a
utho
rized
com
pan
ies.
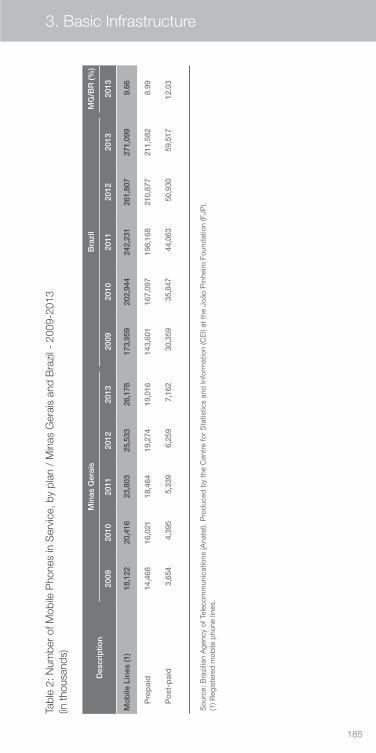
185
3. Basic Infrastructure
Des
crip
tion
Min
as G
erai
s B
razi
lM
G/B
R (%
)
2009
2010
2011
2012
2013
2009
2010
2011
2012
2013
2013
Mo
bile
Lin
es (1
)18
,122
20,4
1623
,803
25,5
3326
,178
173,
959
202,
944
242,
231
261,
807
271,
099
9.66
P
rep
aid
14,4
6816
,021
18,4
6419
,274
19,0
1614
3,60
116
7,09
719
8,16
821
0,87
721
1,58
28.
99
P
ost
-pai
d3,
654
4,39
55,
339
6,25
97,
162
30,3
5935
,847
44,0
6350
,930
59,5
1712
.03
Tabl
e 2:
Num
ber
of M
obile
Pho
nes
in S
ervi
ce, b
y pl
an /
Min
as G
erai
s an
d B
razi
l - 2
009-
2013
(in
thou
sand
s)
Sou
rce:
Bra
zilia
n A
genc
y of
Tel
ecom
mun
icat
ions
(Ana
tel).
Pro
duc
ed b
y th
e C
entr
e fo
r S
tatis
tics
and
Info
rmat
ion
(CE
I) at
the
Joã
o P
inhe
iro F
ound
atio
n (F
JP).
(1) R
egis
tere
d m
obile
pho
ne li
nes.
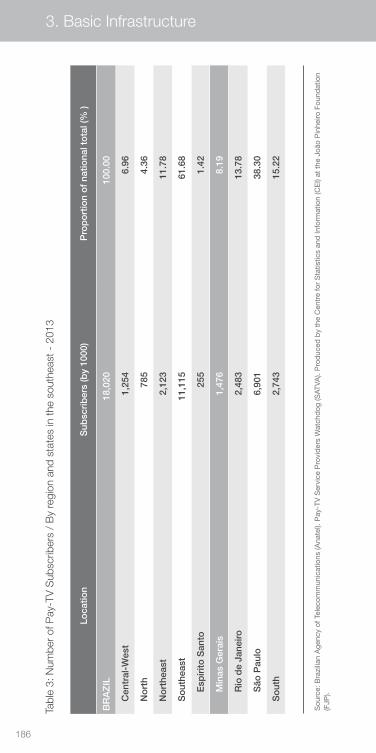
186
3. Basic Infrastructure
Loca
tion
Sub
scri
ber
s (b
y 10
00)
Pro
po
rtio
n o
f na
tiona
l to
tal (
% )
BR
AZ
IL18
,020
100.
00
C
entr
al-W
est
1,25
46.
96
N
ort
h78
54.
36
N
ort
heas
t2,
123
11.7
8
S
out
heas
t11
,115
61.6
8
Esp
írito
San
to25
51.
42
Min
as G
erai
s1,
476
8.19
Rio
de
Jane
iro2,
483
13.7
8
São
Pau
lo6,
901
38.3
0
S
out
h2,
743
15.2
2
Tabl
e 3:
Num
ber
of P
ay-T
V S
ubsc
riber
s /
By
regi
on a
nd s
tate
s in
the
sout
heas
t - 2
013
Sou
rce:
Bra
zilia
n A
genc
y of
Tel
ecom
mun
icat
ions
(Ana
tel).
Pay
-TV
Ser
vice
Pro
vid
ers
Wat
chd
og (S
ATVA
). P
rod
uced
by
the
Cen
tre
for
Sta
tistic
s an
d In
form
atio
n (C
EI)
at t
he J
oão
Pin
heiro
Fou
ndat
ion
(FJP
).
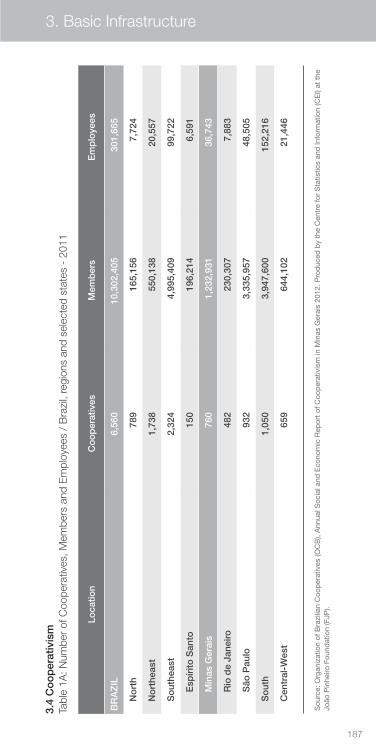
187
3. Basic Infrastructure
Loca
tion
Co
op
erat
ives
Mem
ber
sE
mp
loye
es
BR
AZ
IL6,
560
10,3
02,4
0530
1,66
5
N
ort
h78
916
5,15
67,
724
N
ort
heas
t1,
738
550,
138
20,5
57
S
out
heas
t2,
324
4,99
5,40
999
,722
Esp
írito
San
to15
019
6,21
46,
591
Min
as G
erai
s76
01,
232,
931
36,7
43
Rio
de
Jane
iro48
223
0,30
77,
883
São
Pau
lo93
23,
335,
957
48,5
05
S
out
h1,
050
3,94
7,60
015
2,21
6
C
entr
al-W
est
659
644,
102
21,4
46
3.4
Co
op
erat
ivis
mTa
ble
1A: N
umbe
r of
Coo
pera
tives
, Mem
bers
and
Em
ploy
ees
/ B
razi
l, re
gion
s an
d se
lect
ed s
tate
s -
2011
Sou
rce:
Org
aniz
atio
n of
Bra
zilia
n C
oop
erat
ives
(OC
B),
Ann
ual S
ocia
l and
Eco
nom
ic R
epor
t of
Coo
per
ativ
ism
in M
inas
Ger
ais
2012
. Pro
duc
ed b
y th
e C
entr
e fo
r S
tatis
tics
and
Info
rmat
ion
(CE
I) at
the
Jo
ão P
inhe
iro F
ound
atio
n (F
JP).
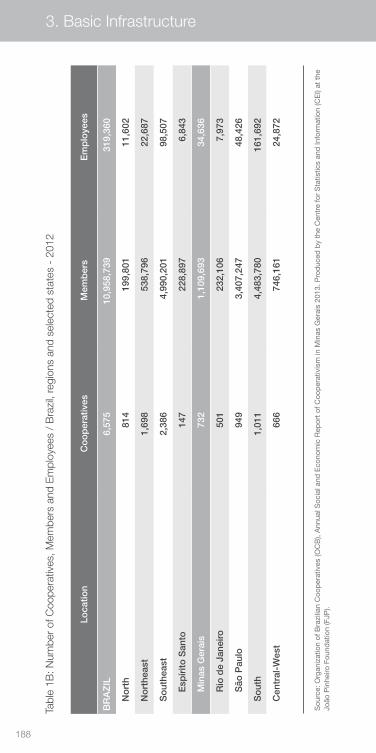
188
3. Basic Infrastructure
Loca
tion
Co
op
erat
ives
Mem
ber
sE
mp
loye
es
BR
AZ
IL6,
575
10,9
58,7
3931
9,36
0
N
ort
h81
419
9,80
111
,602
N
ort
heas
t1,
698
538,
796
22,6
87
S
out
heas
t2,
386
4,99
0,20
198
,507
Esp
írito
San
to14
722
8,89
76,
843
Min
as G
erai
s73
21,
109,
693
34,6
36
Rio
de
Jane
iro50
123
2,10
67,
973
São
Pau
lo94
93,
407,
247
48,4
26
S
out
h1,
011
4,48
3,78
016
1,69
2
C
entr
al-W
est
666
746,
161
24,8
72
Tabl
e 1B
: Num
ber
of C
oope
rativ
es, M
embe
rs a
nd E
mpl
oyee
s /
Bra
zil,
regi
ons
and
sele
cted
sta
tes
- 20
12
Sou
rce:
Org
aniz
atio
n of
Bra
zilia
n C
oop
erat
ives
(OC
B),
Ann
ual S
ocia
l and
Eco
nom
ic R
epor
t of
Coo
per
ativ
ism
in M
inas
Ger
ais
2013
. Pro
duc
ed b
y th
e C
entr
e fo
r S
tatis
tics
and
Info
rmat
ion
(CE
I) at
the
Jo
ão P
inhe
iro F
ound
atio
n (F
JP).
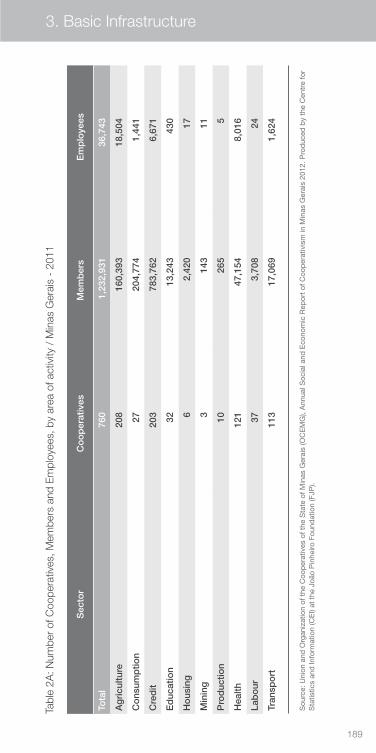
189
3. Basic Infrastructure
Sec
tor
Co
op
erat
ives
Mem
ber
sE
mp
loye
es
Tota
l76
01,
232,
931
36,7
43
Ag
ricu
lture
208
160,
393
18,5
04
Co
nsum
ptio
n27
204,
774
1,44
1
Cre
dit
203
783,
762
6,67
1
Ed
ucat
ion
3213
,243
430
Ho
usin
g6
2,42
017
Min
ing
314
311
Pro
duc
tion
1026
55
Hea
lth12
147
,154
8,01
6
Lab
our
373,
708
24
Tran
spo
rt11
317
,069
1,62
4
Tabl
e 2A
: Num
ber
of C
oope
rativ
es, M
embe
rs a
nd E
mpl
oyee
s, b
y ar
ea o
f act
ivity
/ M
inas
Ger
ais
- 20
11
Sou
rce:
Uni
on a
nd O
rgan
izat
ion
of t
he C
oop
erat
ives
of t
he S
tate
of M
inas
Ger
ais
(OC
EM
G),
Ann
ual S
ocia
l and
Eco
nom
ic R
epor
t of
Coo
per
ativ
ism
in M
inas
Ger
ais
2012
. Pro
duc
ed b
y th
e C
entr
e fo
r S
tatis
tics
and
Info
rmat
ion
(CE
I) at
the
Joã
o P
inhe
iro F
ound
atio
n (F
JP).
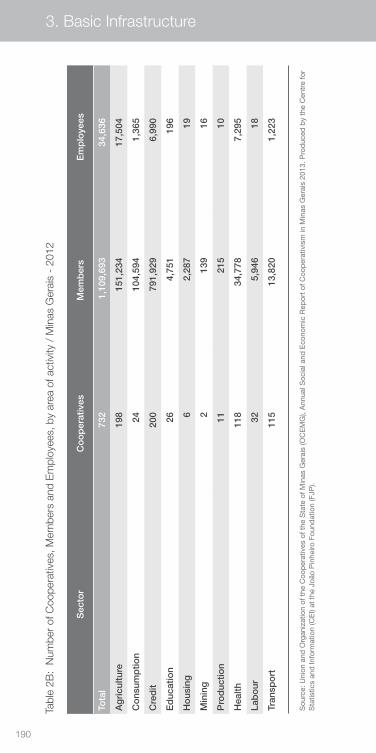
190
Sec
tor
Co
op
erat
ives
Mem
ber
sE
mp
loye
es
Tota
l73
21,
109,
693
34,6
36
Ag
ricu
lture
198
151,
234
17,5
04
Co
nsum
ptio
n24
104,
594
1,36
5
Cre
dit
200
791,
929
6,99
0
Ed
ucat
ion
264,
751
196
Ho
usin
g6
2,28
719
Min
ing
213
916
Pro
duc
tion
1121
510
Hea
lth11
834
,778
7,29
5
Lab
our
325,
946
18
Tran
spo
rt11
513
,820
1,22
3
Tabl
e 2B
: N
umbe
r of
Coo
pera
tives
, Mem
bers
and
Em
ploy
ees,
by
area
of a
ctiv
ity /
Min
as G
erai
s -
2012
Sou
rce:
Uni
on a
nd O
rgan
izat
ion
of t
he C
oop
erat
ives
of t
he S
tate
of M
inas
Ger
ais
(OC
EM
G),
Ann
ual S
ocia
l and
Eco
nom
ic R
epor
t of
Coo
per
ativ
ism
in M
inas
Ger
ais
2013
. Pro
duc
ed b
y th
e C
entr
e fo
r S
tatis
tics
and
Info
rmat
ion
(CE
I) at
the
Joã
o P
inhe
iro F
ound
atio
n (F
JP).
3. Basic Infrastructure
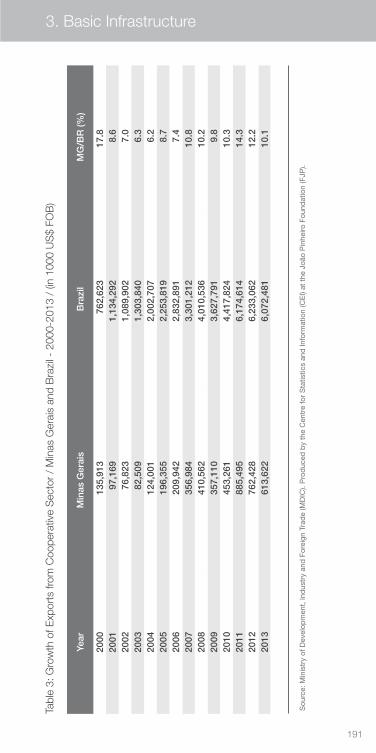
191
Year
Min
as G
erai
sB
razi
lM
G/B
R (%
)
2000
135,
913
762,
623
17.8
2001
97,1
691,
134,
292
8.6
2002
76,8
231,
089,
902
7.0
2003
82,5
091,
303,
840
6.3
2004
124,
001
2,00
2,70
76.
220
0519
6,35
52,
253,
819
8.7
2006
209,
942
2,83
2,89
17.
420
0735
6,98
43,
301,
212
10.8
2008
410,
562
4,01
0,53
610
.220
0935
7,11
03,
627,
791
9.8
2010
453,
261
4,41
7,82
410
.320
1188
5,49
56,
174,
614
14.3
2012
762,
428
6,23
3,06
212
.220
1361
3,62
26,
072,
481
10.1
Tabl
e 3:
Gro
wth
of E
xpor
ts fr
om C
oope
rativ
e S
ecto
r /
Min
as G
erai
s an
d B
razi
l - 2
000-
2013
/ (i
n 10
00 U
S$
FOB
)
Sou
rce:
Min
istr
y of
Dev
elop
men
t, In
dus
try
and
For
eign
Tra
de
(MD
IC).
Pro
duc
ed b
y th
e C
entr
e fo
r S
tatis
tics
and
Info
rmat
ion
(CE
I) at
the
Joã
o P
inhe
iro F
ound
atio
n (F
JP).
3. Basic Infrastructure

192192

193
Employment, Unemployment
and Income
4
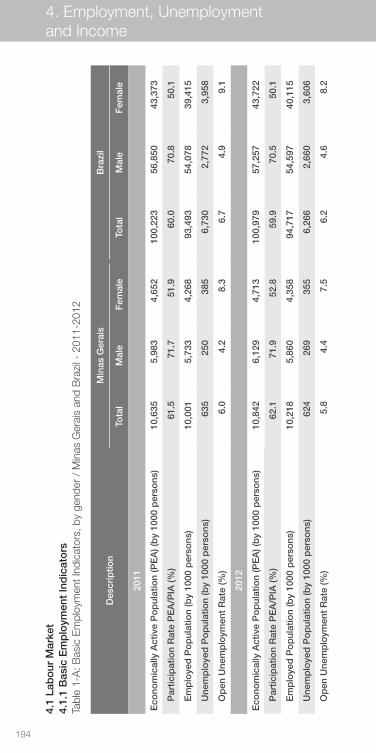
194
4. Employment, Unemployment and Income
Des
crip
tion
Min
as G
erai
sB
razi
l
Tota
lM
ale
Fem
ale
Tota
lM
ale
Fem
ale
2011
Eco
nom
ical
ly A
ctiv
e P
op
ulat
ion
(PE
A) (
by
1000
per
sons
)10
,635
5,98
34,
652
100,
223
56,8
5043
,373
P
artic
ipat
ion
Rat
e P
EA
/PIA
(%)
61.5
71.7
51.9
60.0
70.8
50.1
E
mp
loye
d P
op
ulat
ion
(by
1000
per
sons
)10
,001
5,73
34,
268
93,4
9354
,078
39,4
15
U
nem
plo
yed
Po
pul
atio
n (b
y 10
00 p
erso
ns)
635
250
385
6,73
02,
772
3,95
8
O
pen
Une
mp
loym
ent
Rat
e (%
)6.
04.
28.
36.
74.
99.
1
2012
Eco
nom
ical
ly A
ctiv
e P
op
ulat
ion
(PE
A) (
by
1000
per
sons
)10
,842
6,12
94,
713
100,
979
57,2
5743
,722
P
artic
ipat
ion
Rat
e P
EA
/PIA
(%)
62.1
71.9
52.8
59.9
70.5
50.1
E
mp
loye
d P
op
ulat
ion
(by
1000
per
sons
)10
,218
5,86
04,
358
94,7
1754
,597
40,1
15
U
nem
plo
yed
Po
pul
atio
n (b
y 10
00 p
erso
ns)
624
269
355
6,26
62,
660
3,60
6
O
pen
Une
mp
loym
ent
Rat
e (%
)5.
84.
47.
56.
24.
68.
2
4.1
Lab
our
Mar
ket
4.1.
1 B
asic
Em
plo
ymen
t In
dic
ato
rsTa
ble
1-A
: Bas
ic E
mpl
oym
ent I
ndic
ator
s, b
y ge
nder
/ M
inas
Ger
ais
and
Bra
zil -
201
1-20
12
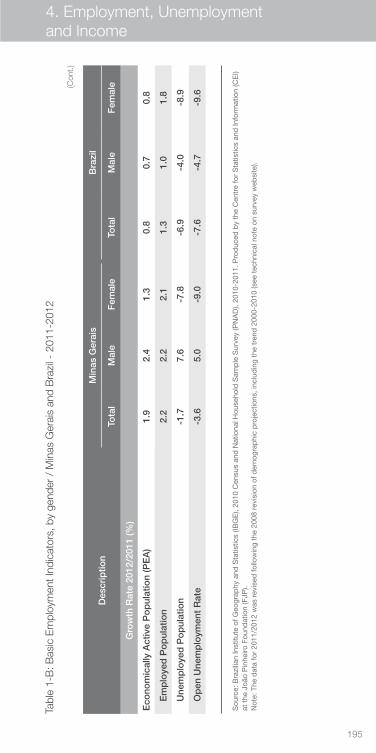
195
4. Employment, Unemployment and Income
Des
crip
tion
Min
as G
erai
sB
razi
l
Tota
lM
ale
Fem
ale
Tota
lM
ale
Fem
ale
2011
Eco
nom
ical
ly A
ctiv
e P
op
ulat
ion
(PE
A) (
by
1000
per
sons
)10
,635
5,98
34,
652
100,
223
56,8
5043
,373
P
artic
ipat
ion
Rat
e P
EA
/PIA
(%)
61.5
71.7
51.9
60.0
70.8
50.1
E
mp
loye
d P
op
ulat
ion
(by
1000
per
sons
)10
,001
5,73
34,
268
93,4
9354
,078
39,4
15
U
nem
plo
yed
Po
pul
atio
n (b
y 10
00 p
erso
ns)
635
250
385
6,73
02,
772
3,95
8
O
pen
Une
mp
loym
ent
Rat
e (%
)6.
04.
28.
36.
74.
99.
1
2012
Eco
nom
ical
ly A
ctiv
e P
op
ulat
ion
(PE
A) (
by
1000
per
sons
)10
,842
6,12
94,
713
100,
979
57,2
5743
,722
P
artic
ipat
ion
Rat
e P
EA
/PIA
(%)
62.1
71.9
52.8
59.9
70.5
50.1
E
mp
loye
d P
op
ulat
ion
(by
1000
per
sons
)10
,218
5,86
04,
358
94,7
1754
,597
40,1
15
U
nem
plo
yed
Po
pul
atio
n (b
y 10
00 p
erso
ns)
624
269
355
6,26
62,
660
3,60
6
O
pen
Une
mp
loym
ent
Rat
e (%
)5.
84.
47.
56.
24.
68.
2
Des
crip
tion
Min
as G
erai
sB
razi
l
Tota
lM
ale
Fem
ale
Tota
lM
ale
Fem
ale
Gro
wth
Rat
e 20
12/2
011
(%)
Eco
nom
ical
ly A
ctiv
e P
op
ulat
ion
(PE
A)
1.9
2.4
1.3
0.8
0.7
0.8
E
mp
loye
d P
op
ulat
ion
2.2
2.2
2.1
1.3
1.0
1.8
U
nem
plo
yed
Po
pul
atio
n-1
.77.
6-7
.8-6
.9-4
.0-8
.9
O
pen
Une
mp
loym
ent
Rat
e-3
.65.
0-9
.0-7
.6-4
.7-9
.6
Tabl
e 1-
B: B
asic
Em
ploy
men
t Ind
icat
ors,
by
gend
er /
Min
as G
erai
s an
d B
razi
l - 2
011-
2012
Sou
rce:
Bra
zilia
n In
stitu
te o
f Geo
grap
hy a
nd S
tatis
tics
(IBG
E),
2010
Cen
sus
and
Nat
iona
l Hou
seho
ld S
amp
le S
urve
y (P
NA
D),
2010
-201
1. P
rod
uced
by
the
Cen
tre
for
Sta
tistic
s an
d In
form
atio
n (C
EI)
at t
he J
oão
Pin
heiro
Fou
ndat
ion
(FJP
). N
ote:
The
dat
a fo
r 20
11/2
012
was
rev
ised
follo
win
g th
e 20
08 r
evis
ion
of d
emog
rap
hic
pro
ject
ions
, inc
lud
ing
the
tren
d 2
000-
2010
(see
tec
hnic
al n
ote
on s
urve
y w
ebsi
te).
(Con
t.)
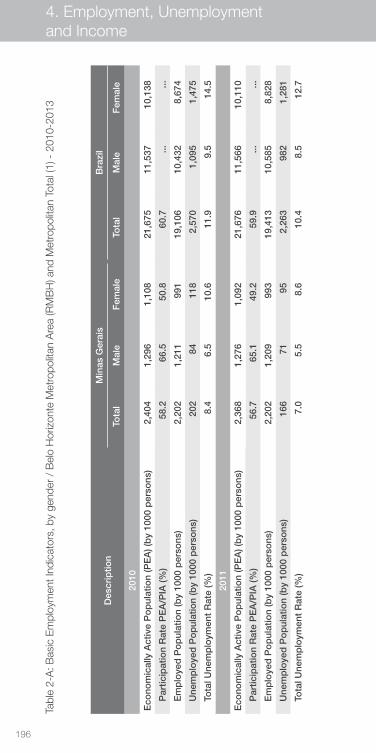
196
Des
crip
tion
Min
as G
erai
sB
razi
l
Tota
lM
ale
Fem
ale
Tota
lM
ale
Fem
ale
2010
Eco
nom
ical
ly A
ctiv
e P
op
ulat
ion
(PE
A) (
by
1000
per
sons
)2,
404
1,29
61,
108
21,6
7511
,537
10,1
38
P
artic
ipat
ion
Rat
e P
EA
/PIA
(%)
58.2
66.5
50.8
60.7
......
E
mp
loye
d P
op
ulat
ion
(by
1000
per
sons
)2,
202
1,21
199
119
,106
10,4
328,
674
U
nem
plo
yed
Po
pul
atio
n (b
y 10
00 p
erso
ns)
202
8411
82,
570
1,09
51,
475
To
tal U
nem
plo
ymen
t R
ate
(%)
8.4
6.5
10.6
11.9
9.5
14.5
2011
Eco
nom
ical
ly A
ctiv
e P
op
ulat
ion
(PE
A) (
by
1000
per
sons
)2,
368
1,27
61,
092
21,6
7611
,566
10,1
10
P
artic
ipat
ion
Rat
e P
EA
/PIA
(%)
56.7
65.1
49.2
59.9
......
E
mp
loye
d P
op
ulat
ion
(by
1000
per
sons
)2,
202
1,20
999
319
,413
10,5
858,
828
U
nem
plo
yed
Po
pul
atio
n (b
y 10
00 p
erso
ns)
166
7195
2,26
398
21,
281
To
tal U
nem
plo
ymen
t R
ate
(%)
7.0
5.5
8.6
10.4
8.5
12.7
Tabl
e 2-
A: B
asic
Em
ploy
men
t Ind
icat
ors,
by
gend
er /
Bel
o H
oriz
onte
Met
ropo
litan
Are
a (R
MB
H) a
nd M
etro
polit
an T
otal
(1) -
201
0-20
13
4. Employment, Unemployment and Income
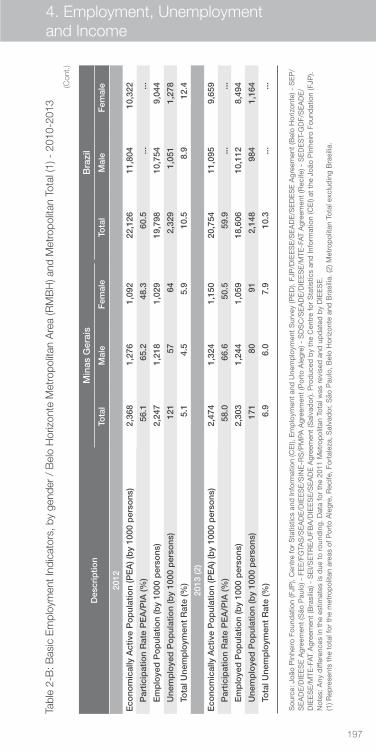
197
Des
crip
tion
Min
as G
erai
sB
razi
l
Tota
lM
ale
Fem
ale
Tota
lM
ale
Fem
ale
2010
Eco
nom
ical
ly A
ctiv
e P
op
ulat
ion
(PE
A) (
by
1000
per
sons
)2,
404
1,29
61,
108
21,6
7511
,537
10,1
38
P
artic
ipat
ion
Rat
e P
EA
/PIA
(%)
58.2
66.5
50.8
60.7
......
E
mp
loye
d P
op
ulat
ion
(by
1000
per
sons
)2,
202
1,21
199
119
,106
10,4
328,
674
U
nem
plo
yed
Po
pul
atio
n (b
y 10
00 p
erso
ns)
202
8411
82,
570
1,09
51,
475
To
tal U
nem
plo
ymen
t R
ate
(%)
8.4
6.5
10.6
11.9
9.5
14.5
2011
Eco
nom
ical
ly A
ctiv
e P
op
ulat
ion
(PE
A) (
by
1000
per
sons
)2,
368
1,27
61,
092
21,6
7611
,566
10,1
10
P
artic
ipat
ion
Rat
e P
EA
/PIA
(%)
56.7
65.1
49.2
59.9
......
E
mp
loye
d P
op
ulat
ion
(by
1000
per
sons
)2,
202
1,20
999
319
,413
10,5
858,
828
U
nem
plo
yed
Po
pul
atio
n (b
y 10
00 p
erso
ns)
166
7195
2,26
398
21,
281
To
tal U
nem
plo
ymen
t R
ate
(%)
7.0
5.5
8.6
10.4
8.5
12.7
Des
crip
tion
Min
as G
erai
sB
razi
l
Tota
lM
ale
Fem
ale
Tota
lM
ale
Fem
ale
2012
Eco
nom
ical
ly A
ctiv
e P
op
ulat
ion
(PE
A) (
by
1000
per
sons
)2,
368
1,27
61,
092
22,1
2611
,804
10,3
22
P
artic
ipat
ion
Rat
e P
EA
/PIA
(%)
56.1
65.2
48.3
60.5
......
E
mp
loye
d P
op
ulat
ion
(by
1000
per
sons
)2,
247
1,21
81,
029
19,7
9810
,754
9,04
4
U
nem
plo
yed
Po
pul
atio
n (b
y 10
00 p
erso
ns)
121
5764
2,32
91,
051
1,27
8
To
tal U
nem
plo
ymen
t R
ate
(%)
5.1
4.5
5.9
10.5
8.9
12.4
2013
(2)
Eco
nom
ical
ly A
ctiv
e P
op
ulat
ion
(PE
A) (
by
1000
per
sons
)2,
474
1,32
41,
150
20,7
5411
,095
9,65
9
P
artic
ipat
ion
Rat
e P
EA
/PIA
(%)
58.0
66.6
50.5
59.9
......
E
mp
loye
d P
op
ulat
ion
(by
1000
per
sons
)2,
303
1,24
41,
059
18,6
0610
,112
8,49
4
U
nem
plo
yed
Po
pul
atio
n (b
y 10
00 p
erso
ns)
171
8091
2,14
898
41,
164
To
tal U
nem
plo
ymen
t R
ate
(%)
6.9
6.0
7.9
10.3
......
Tabl
e 2-
B: B
asic
Em
ploy
men
t Ind
icat
ors,
by
gend
er /
Bel
o H
oriz
onte
Met
ropo
litan
Are
a (R
MB
H) a
nd M
etro
polit
an T
otal
(1) -
201
0-20
13
Sou
rce:
Joã
o P
inhe
iro F
ound
atio
n (F
JP),
Cen
tre
for
Sta
tistic
s an
d In
form
atio
n (C
EI),
Em
plo
ymen
t an
d U
nem
plo
ymen
t S
urve
y (P
ED
). FJ
P/D
IEE
SE
/SE
AD
E/S
ED
ES
E A
gree
men
t (B
elo
Hor
izon
te) -
SE
P/
SE
AD
E/D
IEE
SE
Agr
eem
ent
(São
Pau
lo) -
FE
E/F
GTA
S/S
EA
DE
/DIE
ES
E/S
INE
-RS
/PM
PA A
gree
men
t (P
orto
Ale
gre)
- S
DS
C/S
EA
DE
/DIE
ES
E/M
TE-F
AT A
gree
men
t (R
ecife
) - S
ED
ES
T-G
DF/
SE
AD
E/
DIE
ES
E/M
TE-F
AT A
gree
men
t (B
rasí
lia) -
SE
I/S
ETR
E/U
FBA
/DIE
ES
E/S
EA
DE
Agr
eem
ent
(Sal
vad
or).
Pro
duc
ed b
y th
e C
entr
e fo
r S
tatis
tics
and
Info
rmat
ion
(CE
I) at
the
Joã
o P
inhe
iro F
ound
atio
n (F
JP).
Not
es: A
ny d
iffer
ence
s in
the
est
imat
es is
due
to
roun
din
g. D
ata
for
the
2011
Met
rop
olita
n To
tal w
as r
evis
ed a
nd u
pd
ated
by
DIE
ES
E.
(1) R
epre
sent
s th
e to
tal f
or t
he m
etro
pol
itan
area
s of
Por
to A
legr
e, R
ecife
, For
tale
za, S
alva
dor
, São
Pau
lo, B
elo
Hor
izon
te a
nd B
rasí
lia. (
2) M
etro
pol
itan
Tota
l exc
lud
ing
Bra
sília
.
(Con
t.)
4. Employment, Unemployment and Income
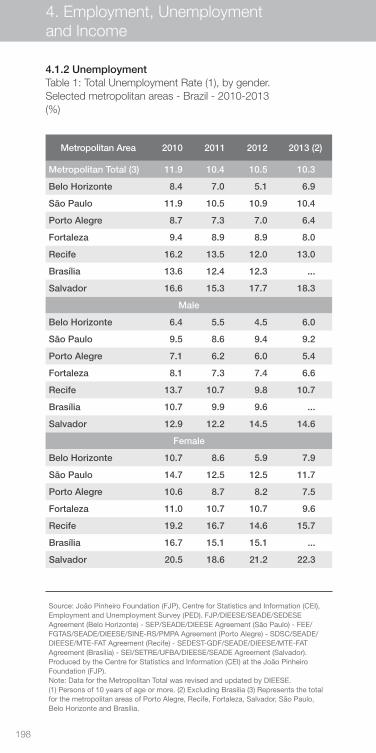
198
4.1.2 UnemploymentTable 1: Total Unemployment Rate (1), by gender.Selected metropolitan areas - Brazil - 2010-2013 (%)
Metropolitan Area 2010 2011 2012 2013 (2)
Metropolitan Total (3) 11.9 10.4 10.5 10.3
Belo Horizonte 8.4 7.0 5.1 6.9
São Paulo 11.9 10.5 10.9 10.4
Porto Alegre 8.7 7.3 7.0 6.4
Fortaleza 9.4 8.9 8.9 8.0
Recife 16.2 13.5 12.0 13.0
Brasília 13.6 12.4 12.3 ...
Salvador 16.6 15.3 17.7 18.3
Male
Belo Horizonte 6.4 5.5 4.5 6.0
São Paulo 9.5 8.6 9.4 9.2
Porto Alegre 7.1 6.2 6.0 5.4
Fortaleza 8.1 7.3 7.4 6.6
Recife 13.7 10.7 9.8 10.7
Brasília 10.7 9.9 9.6 ...
Salvador 12.9 12.2 14.5 14.6
Female
Belo Horizonte 10.7 8.6 5.9 7.9
São Paulo 14.7 12.5 12.5 11.7
Porto Alegre 10.6 8.7 8.2 7.5
Fortaleza 11.0 10.7 10.7 9.6
Recife 19.2 16.7 14.6 15.7
Brasília 16.7 15.1 15.1 ...
Salvador 20.5 18.6 21.2 22.3
Source: João Pinheiro Foundation (FJP), Centre for Statistics and Information (CEI), Employment and Unemployment Survey (PED). FJP/DIEESE/SEADE/SEDESE Agreement (Belo Horizonte) - SEP/SEADE/DIEESE Agreement (São Paulo) - FEE/FGTAS/SEADE/DIEESE/SINE-RS/PMPA Agreement (Porto Alegre) - SDSC/SEADE/DIEESE/MTE-FAT Agreement (Recife) - SEDEST-GDF/SEADE/DIEESE/MTE-FAT Agreement (Brasília) - SEI/SETRE/UFBA/DIEESE/SEADE Agreement (Salvador). Produced by the Centre for Statistics and Information (CEI) at the João Pinheiro Foundation (FJP). Note: Data for the Metropolitan Total was revised and updated by DIEESE. (1) Persons of 10 years of age or more. (2) Excluding Brasília (3) Represents the total for the metropolitan areas of Porto Alegre, Recife, Fortaleza, Salvador, São Paulo, Belo Horizonte and Brasília.
4. Employment, Unemployment and Income
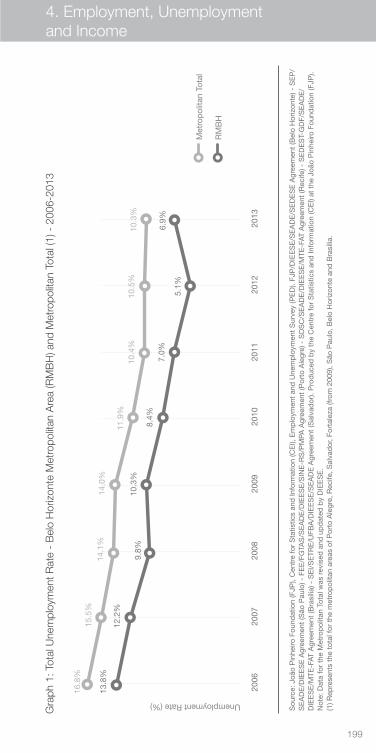
199
Gra
ph 1
: Tot
al U
nem
ploy
men
t Rat
e -
Bel
o H
oriz
onte
Met
ropo
litan
Are
a (R
MB
H) a
nd M
etro
polit
an T
otal
(1) -
200
6-20
13
Sou
rce:
Joã
o P
inhe
iro F
ound
atio
n (F
JP),
Cen
tre
for
Sta
tistic
s an
d In
form
atio
n (C
EI),
Em
plo
ymen
t an
d U
nem
plo
ymen
t S
urve
y (P
ED
). FJ
P/D
IEE
SE
/SE
AD
E/S
ED
ES
E A
gree
men
t (B
elo
Hor
izon
te) -
SE
P/
SE
AD
E/D
IEE
SE
Agr
eem
ent
(São
Pau
lo) -
FE
E/F
GTA
S/S
EA
DE
/DIE
ES
E/S
INE
-RS
/PM
PA A
gree
men
t (P
orto
Ale
gre)
- S
DS
C/S
EA
DE
/DIE
ES
E/M
TE-F
AT A
gree
men
t (R
ecife
) - S
ED
ES
T-G
DF/
SE
AD
E/
DIE
ES
E/M
TE-F
AT A
gree
men
t (B
rasí
lia) -
SE
I/S
ETR
E/U
FBA
/DIE
ES
E/S
EA
DE
Agr
eem
ent
(Sal
vad
or).
Pro
duc
ed b
y th
e C
entr
e fo
r S
tatis
tics
and
Info
rmat
ion
(CE
I) at
the
Joã
o P
inhe
iro F
ound
atio
n (F
JP).
Not
e: D
ata
for
the
Met
rop
olita
n To
tal w
as r
evis
ed a
nd u
pd
ated
by
DIE
ES
E.
(1) R
epre
sent
s th
e to
tal f
or t
he m
etro
pol
itan
area
s of
Por
to A
legr
e, R
ecife
, Sal
vad
or, F
orta
leza
(fro
m 2
009)
, São
Pau
lo, B
elo
Hor
izon
te a
nd B
rasí
lia.
2006
2007
2008
2009
2010
2011
2012
2013
15.5
%16
.8%
14.1
%14
.0%
11.9
%10
.4%
10.5
%10
.3%
12.2
%
13.8
%
9.8%
10.3
%
8.4%
7.0%
5.1%
6.9%
Unemployment Rate (%)
Met
rop
olita
n To
tal
RM
BH
4. Employment, Unemployment and Income
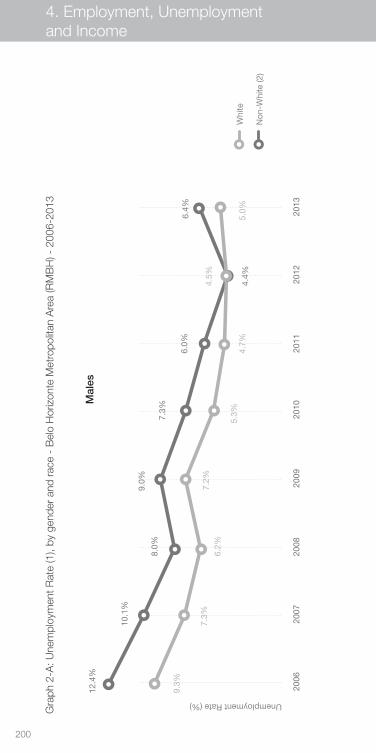
200
Gra
ph 2
-A: U
nem
ploy
men
t Rat
e (1
), by
gen
der
and
race
- B
elo
Hor
izon
te M
etro
polit
an A
rea
(RM
BH
) - 2
006-
2013
Mal
es
2006
2007
2008
2009
2010
2011
2012
2013
7.3%
9.3%
6.2%
7.2%
5.3%
4.7%
4.5%
5.0%
10.1
%
12.4
%
8.0%
9.0%
7.3%
6.0%
4.4%
6.4%
Unemployment Rate (%)
Whi
te
Non
-Whi
te (2
)
4. Employment, Unemployment and Income
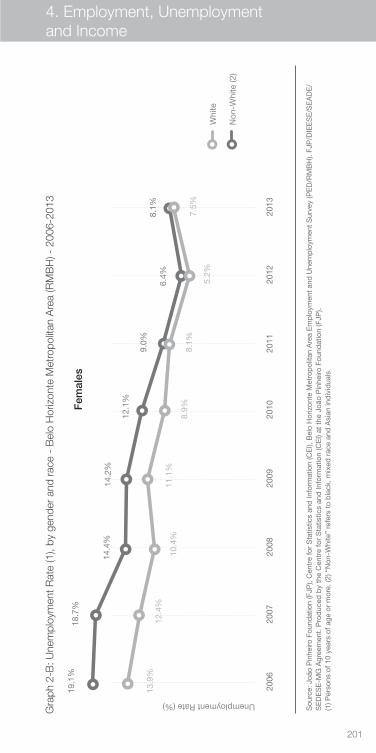
201
Gra
ph 2
-B: U
nem
ploy
men
t Rat
e (1
), by
gen
der
and
race
- B
elo
Hor
izon
te M
etro
polit
an A
rea
(RM
BH
) - 2
006-
2013
Sou
rce:
Joã
o P
inhe
iro F
ound
atio
n (F
JP),
Cen
tre
for
Sta
tistic
s an
d In
form
atio
n (C
EI),
Bel
o H
oriz
onte
Met
rop
olita
n A
rea
Em
plo
ymen
t and
Une
mp
loym
ent S
urve
y (P
ED
/RM
BH
). FJ
P/D
IEE
SE
/SE
AD
E/
SE
DE
SE
-MG
Agr
eem
ent.
Pro
duc
ed b
y th
e C
entr
e fo
r S
tatis
tics
and
Info
rmat
ion
(CE
I) at
the
Joã
o P
inhe
iro F
ound
atio
n (F
JP).
(1) P
erso
ns o
f 10
year
s of
age
or
mor
e. (2
) “N
on-W
hite
” re
fers
to
bla
ck, m
ixed
rac
e an
d A
sian
ind
ivid
uals
.
Fem
ales
2006
2007
2008
2009
2010
2011
2012
2013
12.4
%13
.9%
10.4
%11
.1%
8.9%
8.1%
5.2%
7.5%
18.7
%19
.1%
14.4
%14
.2%
12.1
%
9.0%
6.4%
8.1%
Unemployment Rate (%)
Whi
te
Non
-Whi
te (2
)
4. Employment, Unemployment and Income
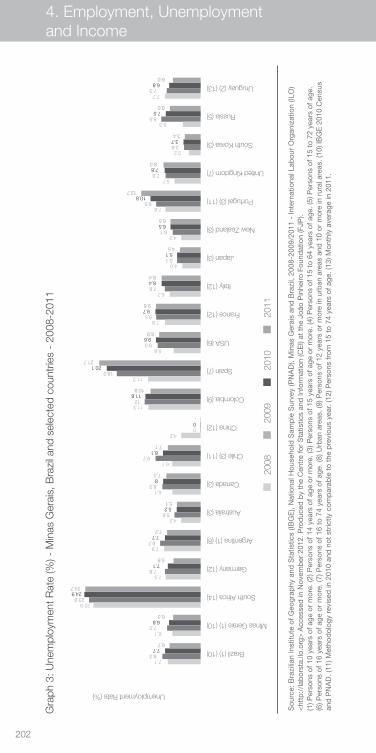
202
Gra
ph 3
: Une
mpl
oym
ent R
ate
(%) -
Min
as G
erai
s, B
razi
l and
sel
ecte
d co
untr
ies
- 20
08-2
011
Sou
rce:
Bra
zilia
n In
stitu
te o
f G
eogr
aphy
and
Sta
tistic
s (IB
GE
), N
atio
nal H
ouse
hold
Sam
ple
Sur
vey
(PN
AD
), M
inas
Ger
ais
and
Bra
zil,
2008
-200
9/20
11 -
Inte
rnat
iona
l Lab
our
Org
aniz
atio
n (IL
O)
<ht
tp:/
/lab
orst
a.ilo
.org
> A
cces
sed
in N
ovem
ber
201
2. P
rod
uced
by
the
Cen
tre
for
Sta
tistic
s an
d In
form
atio
n (C
EI)
at t
he J
oão
Pin
heiro
Fou
ndat
ion
(FJP
). (1
) Per
sons
of 1
0 ye
ars
of a
ge o
r m
ore.
(2) P
erso
ns o
f 14
year
s of
age
or
mor
e. (3
) Per
sons
of 1
5 ye
ars
of a
ge o
r m
ore.
(4) P
erso
ns o
f 15
to 6
4 ye
ars
of a
ge. (
5) P
erso
ns o
f 15
to 7
2 ye
ars
of a
ge.
(6) P
erso
ns o
f 16
year
s of
age
or
mor
e. (7
) Per
sons
of 1
6 to
74
year
s of
age
. (8)
Urb
an a
reas
. (9)
Per
sons
of 1
2 ye
ars
or m
ore
in u
rban
are
as a
nd 1
0 or
mor
e in
rur
al a
reas
. (10
) IB
GE
201
0 C
ensu
s an
d P
NA
D. (
11) M
etho
dol
ogy
revi
sed
in 2
010
and
not
str
ictly
com
par
able
to
the
pre
viou
s ye
ar. (
12) P
erso
ns fr
om 1
5 to
74
year
s of
age
. (13
) Mon
thly
ave
rage
in 2
011.
2008
2009
2010
2011
Brazil (1) (10)7.76.7
8.37.1
Minas Gerais (1) (10)6.86.0
7.26.1
South Africa (14)24.924.7
23.922.9
Germany (12)7.15.9
7.87.5
Argentina (1) (8)7.77.2
8.77.9
Australia (3)5.25.1
5.64.2
Canada (3)87.4
8.36.1
Chile (3) (11)8.17.1
9.76.1
China (12)0-
04.2
Colombia (9)11,810,8
1211,3
Spain (7)20.121.7
18.011.3
USA (6)9.68.9
9.35.8
France (12)9.79.6
9.57.8
Italy (12)8.48.4
7.86.7
Japan (3)5.14.5
5.14.0
New Zealand (3)6.56.5
6.14.2
Portugal (3) (11)10.812.7
9.57.6
United Kingdom (7)7.88.0
7.65.7
South Korea (3)3.73.4
3.63.2
Russia (5)7.56.0
8.56.3
Uruguay (2) (13)6.86.0
7.37.7
Unemployment Rate (%)
11.3
11.810.8
4. Employment, Unemployment and Income
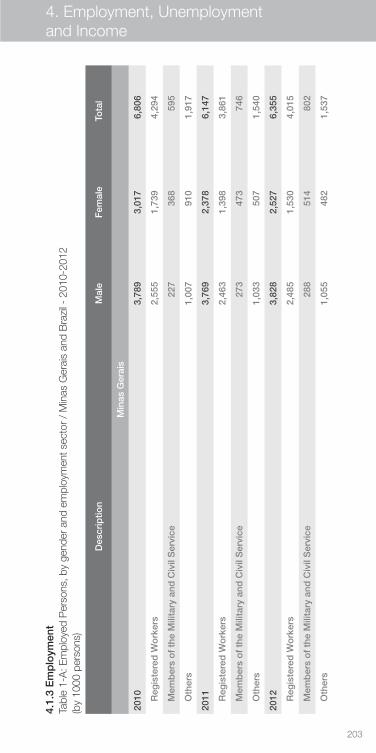
203
Des
crip
tion
Mal
eF
emal
eTo
tal
Min
as G
erai
s
2010
3,78
93,
017
6,80
6
R
egis
tere
d W
ork
ers
2,55
51,
739
4,29
4
M
emb
ers
of
the
Mili
tary
and
Civ
il S
ervi
ce22
736
859
5
O
ther
s1,
007
910
1,91
7
2011
3,76
92,
378
6,14
7
R
egis
tere
d W
ork
ers
2,46
31,
398
3,86
1
M
emb
ers
of
the
Mili
tary
and
Civ
il S
ervi
ce27
347
374
6
O
ther
s1,
033
507
1,54
0
2012
3,82
82,
527
6,35
5
R
egis
tere
d W
ork
ers
2,48
51,
530
4,01
5
M
emb
ers
of
the
Mili
tary
and
Civ
il S
ervi
ce28
851
480
2
O
ther
s1,
055
482
1,53
7
4.1.
3 E
mp
loym
ent
Tabl
e 1-
A: E
mpl
oyed
Per
sons
, by
gend
er a
nd e
mpl
oym
ent s
ecto
r / M
inas
Ger
ais
and
Bra
zil -
201
0-20
12
(by
1000
per
sons
)
4. Employment, Unemployment and Income
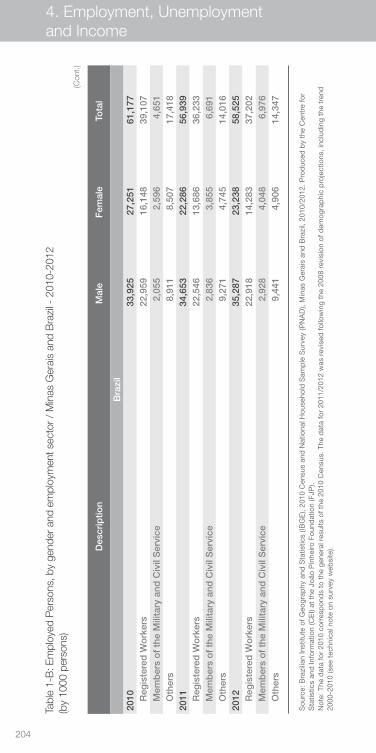
204
Des
crip
tion
Mal
eF
emal
eTo
tal
Bra
zil
2010
33,9
2527
,251
61,1
77
Reg
iste
red
Wo
rker
s 22
,959
16,1
4839
,107
M
emb
ers
of
the
Mili
tary
and
Civ
il S
ervi
ce2,
055
2,59
64,
651
O
ther
s8,
911
8,50
717
,418
2011
34,6
5322
,286
56,9
39
Reg
iste
red
Wo
rker
s 22
,546
13,6
8636
,233
M
emb
ers
of
the
Mili
tary
and
Civ
il S
ervi
ce2,
836
3,85
56,
691
O
ther
s9,
271
4,74
514
,016
2012
35,2
8723
,238
58,5
25
Reg
iste
red
Wo
rker
s 22
,918
14,2
8337
,202
M
emb
ers
of
the
Mili
tary
and
Civ
il S
ervi
ce2,
928
4,04
86,
976
O
ther
s9,
441
4,90
614
,347
Tabl
e 1-
B: E
mpl
oyed
Per
sons
, by
gend
er a
nd e
mpl
oym
ent s
ecto
r / M
inas
Ger
ais
and
Bra
zil -
201
0-20
12
(by
1000
per
sons
)(C
ont.)
Sou
rce:
Bra
zilia
n In
stitu
te o
f Geo
grap
hy a
nd S
tatis
tics
(IBG
E),
2010
Cen
sus
and
Nat
iona
l Hou
seho
ld S
amp
le S
urve
y (P
NA
D),
Min
as G
erai
s an
d B
razi
l, 20
10/2
012.
Pro
duc
ed b
y th
e C
entr
e fo
r S
tatis
tics
and
Info
rmat
ion
(CE
I) at
the
Joã
o P
inhe
iro F
ound
atio
n (F
JP).
Not
e: T
he d
ata
for
2010
cor
resp
ond
s to
the
gen
eral
res
ults
of t
he 2
010
Cen
sus.
The
dat
a fo
r 20
11/2
012
was
rev
ised
follo
win
g th
e 20
08 r
evis
ion
of d
emog
rap
hic
pro
ject
ions
, inc
lud
ing
the
tren
d
2000
-201
0 (s
ee t
echn
ical
not
e on
sur
vey
web
site
).
4. Employment, Unemployment and Income
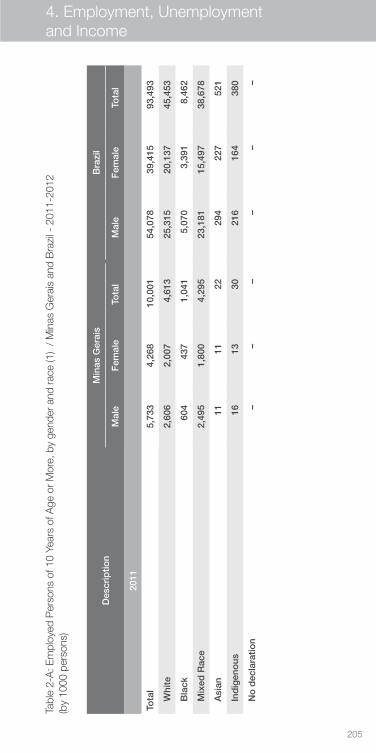
205
Sou
rce:
Bra
zilia
n In
stitu
te o
f Geo
grap
hy a
nd S
tatis
tics
(IBG
E),
2010
Cen
sus
and
Nat
iona
l Hou
seho
ld S
amp
le S
urve
y (P
NA
D),
Min
as G
erai
s an
d B
razi
l, 20
10/2
012.
Pro
duc
ed b
y th
e C
entr
e fo
r S
tatis
tics
and
Info
rmat
ion
(CE
I) at
the
Joã
o P
inhe
iro F
ound
atio
n (F
JP).
Not
e: T
he d
ata
for
2010
cor
resp
ond
s to
the
gen
eral
res
ults
of t
he 2
010
Cen
sus.
The
dat
a fo
r 20
11/2
012
was
rev
ised
follo
win
g th
e 20
08 r
evis
ion
of d
emog
rap
hic
pro
ject
ions
, inc
lud
ing
the
tren
d
2000
-201
0 (s
ee t
echn
ical
not
e on
sur
vey
web
site
).
Tabl
e 2-
A: E
mpl
oyed
Per
sons
of 1
0 Ye
ars
of A
ge o
r Mor
e, b
y ge
nder
and
race
(1)
/ M
inas
Ger
ais
and
Bra
zil -
201
1-20
12
(by
1000
per
sons
)
Des
crip
tion
Min
as G
erai
sB
razi
l
Mal
eF
emal
eTo
tal
Mal
eF
emal
eTo
tal
2011
Tota
l5,
733
4,26
810
,001
54,0
7839
,415
93,4
93
W
hite
2,60
62,
007
4,61
325
,315
20,1
3745
,453
B
lack
604
437
1,04
15,
070
3,39
18,
462
M
ixed
Rac
e2,
495
1,80
04,
295
23,1
8115
,497
38,6
78
A
sian
1111
2229
422
752
1
In
dig
eno
us16
1330
216
164
380
N
o d
ecla
ratio
n–
––
––
–
4. Employment, Unemployment and Income
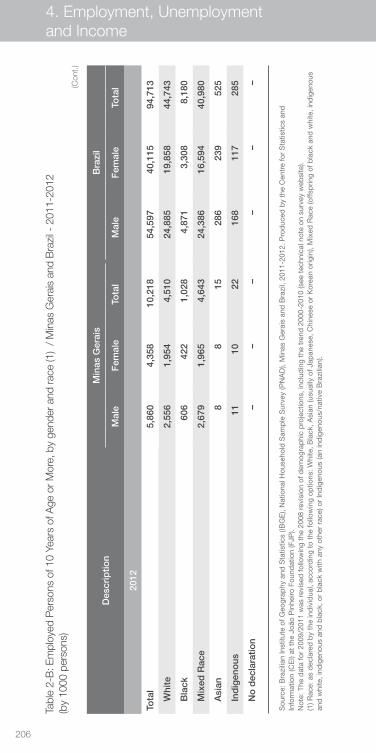
206
Tabl
e 2-
B: E
mpl
oyed
Per
sons
of 1
0 Ye
ars
of A
ge o
r Mor
e, b
y ge
nder
and
race
(1)
/ M
inas
Ger
ais
and
Bra
zil -
201
1-20
12
(by
1000
per
sons
)(C
ont.)
Des
crip
tion
Min
as G
erai
sB
razi
l
Mal
eF
emal
eTo
tal
Mal
eF
emal
eTo
tal
2012
Tota
l5,
860
4,35
810
,218
54,5
9740
,115
94,7
13
W
hite
2,55
61,
954
4,51
024
,885
19,8
5844
,743
B
lack
606
422
1,02
84,
871
3,30
88,
180
M
ixed
Rac
e2,
679
1,96
54,
643
24,3
8616
,594
40,9
80
A
sian
88
1528
623
952
5
In
dig
eno
us11
1022
168
117
285
N
o d
ecla
ratio
n–
––
––
–
Sou
rce:
Bra
zilia
n In
stitu
te o
f Geo
grap
hy a
nd S
tatis
tics
(IBG
E),
Nat
iona
l Hou
seho
ld S
amp
le S
urve
y (P
NA
D),
Min
as G
erai
s an
d B
razi
l, 20
11-2
012.
Pro
duc
ed b
y th
e C
entr
e fo
r S
tatis
tics
and
In
form
atio
n (C
EI)
at t
he J
oão
Pin
heiro
Fou
ndat
ion
(FJP
). N
ote:
The
dat
a fo
r 20
09/2
011
was
rev
ised
follo
win
g th
e 20
08 r
evis
ion
of d
emog
rap
hic
pro
ject
ions
, inc
lud
ing
the
tren
d 2
000-
2010
(see
tec
hnic
al n
ote
on s
urve
y w
ebsi
te).
(1) R
ace:
as
dec
lare
d b
y th
e in
div
idua
l, ac
cord
ing
to t
he fo
llow
ing
optio
ns: W
hite
, Bla
ck, A
sian
(usu
ally
of J
apan
ese,
Chi
nese
or
Kor
ean
orig
in),
Mix
ed R
ace
(offs
prin
g of
bla
ck a
nd w
hite
, ind
igen
ous
and
whi
te, i
ndig
enou
s an
d b
lack
, or
bla
ck w
ith a
ny o
ther
rac
e) o
r In
dig
enou
s (a
n in
dig
enou
s/na
tive
Bra
zilia
n).
4. Employment, Unemployment and Income
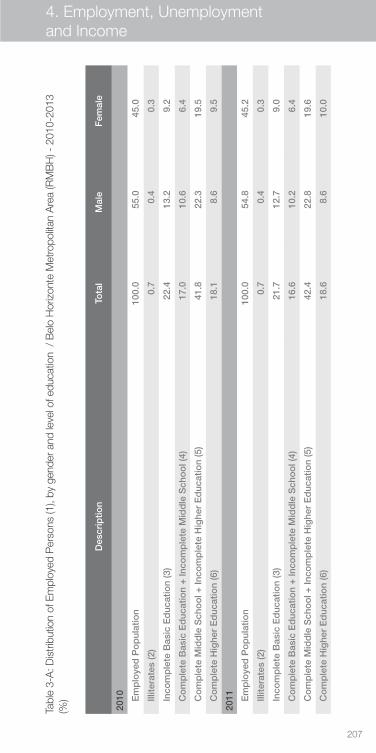
207
Des
crip
tion
Tota
lM
ale
Fem
ale
2010
E
mp
loye
d P
op
ulat
ion
100.
055
.045
.0
Ill
itera
tes
(2)
0.7
0.4
0.3
In
com
ple
te B
asic
Ed
ucat
ion
(3)
22.4
13.2
9.2
C
om
ple
te B
asic
Ed
ucat
ion
+ In
com
ple
te M
idd
le S
cho
ol (
4)17
.010
.66.
4
C
om
ple
te M
idd
le S
cho
ol +
Inco
mp
lete
Hig
her
Ed
ucat
ion
(5)
41.8
22.3
19.5
C
om
ple
te H
ighe
r E
duc
atio
n (6
)18
.18.
69.
5
2011
E
mp
loye
d P
op
ulat
ion
100.
054
.845
.2
Ill
itera
tes
(2)
0.7
0.4
0.3
In
com
ple
te B
asic
Ed
ucat
ion
(3)
21.7
12.7
9.0
C
om
ple
te B
asic
Ed
ucat
ion
+ In
com
ple
te M
idd
le S
cho
ol (
4)16
.610
.26.
4
C
om
ple
te M
idd
le S
cho
ol +
Inco
mp
lete
Hig
her
Ed
ucat
ion
(5)
42.4
22.8
19.6
C
om
ple
te H
ighe
r E
duc
atio
n (6
)18
.68.
610
.0
Tabl
e 3-
A: D
istr
ibut
ion
of E
mpl
oyed
Per
sons
(1),
by g
ende
r and
leve
l of e
duca
tion
/ B
elo
Hor
izon
te M
etro
polit
an A
rea
(RM
BH
) - 2
010-
2013
(%
)
4. Employment, Unemployment and Income
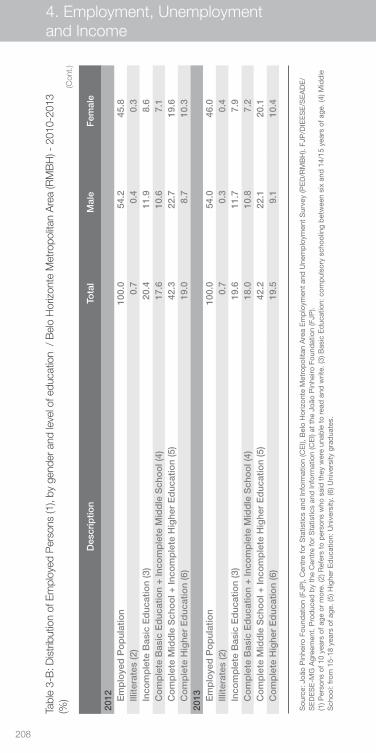
208
Tabl
e 3-
B: D
istr
ibut
ion
of E
mpl
oyed
Per
sons
(1),
by g
ende
r and
leve
l of e
duca
tion
/ B
elo
Hor
izon
te M
etro
polit
an A
rea
(RM
BH
) - 2
010-
2013
(%
)(C
ont.)
Des
crip
tion
Tota
lM
ale
Fem
ale
2012
Em
plo
yed
Po
pul
atio
n10
0.0
54.2
45.8
Ill
itera
tes
(2)
0.7
0.4
0.3
In
com
ple
te B
asic
Ed
ucat
ion
(3)
20.4
11.9
8.6
C
om
ple
te B
asic
Ed
ucat
ion
+ In
com
ple
te M
idd
le S
cho
ol (
4)17
.610
.67.
1
Co
mp
lete
Mid
dle
Sch
oo
l + In
com
ple
te H
ighe
r E
duc
atio
n (5
)42
.322
.719
.6
Co
mp
lete
Hig
her
Ed
ucat
ion
(6)
19.0
8.7
10.3
2013
Em
plo
yed
Po
pul
atio
n10
0.0
54.0
46.0
Ill
itera
tes
(2)
0.7
0.3
0.4
In
com
ple
te B
asic
Ed
ucat
ion
(3)
19.6
11.7
7.9
C
om
ple
te B
asic
Ed
ucat
ion
+ In
com
ple
te M
idd
le S
cho
ol (
4)18
.010
.87.
2
Co
mp
lete
Mid
dle
Sch
oo
l + In
com
ple
te H
ighe
r E
duc
atio
n (5
)42
.222
.120
.1
Co
mp
lete
Hig
her
Ed
ucat
ion
(6)
19.5
9.1
10.4
Sou
rce:
Joã
o P
inhe
iro F
ound
atio
n (F
JP),
Cen
tre
for
Sta
tistic
s an
d In
form
atio
n (C
EI),
Bel
o H
oriz
onte
Met
rop
olita
n A
rea
Em
plo
ymen
t an
d U
nem
plo
ymen
t S
urve
y (P
ED
/RM
BH
). FJ
P/D
IEE
SE
/SE
AD
E/
SE
DE
SE
-MG
Agr
eem
ent.
Pro
duc
ed b
y th
e C
entr
e fo
r S
tatis
tics
and
Info
rmat
ion
(CE
I) at
the
Joã
o P
inhe
iro F
ound
atio
n (F
JP).
(1) P
erso
ns o
f 10
year
s of
age
or
mor
e. (2
) Ref
ers
to p
erso
ns w
ho s
aid
the
y w
ere
unab
le t
o re
ad a
nd w
rite.
(3) B
asic
Ed
ucat
ion:
com
pul
sory
sch
oolin
g b
etw
een
six
and
14/
15 y
ears
of a
ge. (
4) M
idd
le
Sch
ool:
from
15-
18 y
ears
of a
ge. (
5) H
ighe
r E
duc
atio
n: U
nive
rsity
. (6)
Uni
vers
ity g
rad
uate
s.
4. Employment, Unemployment and Income
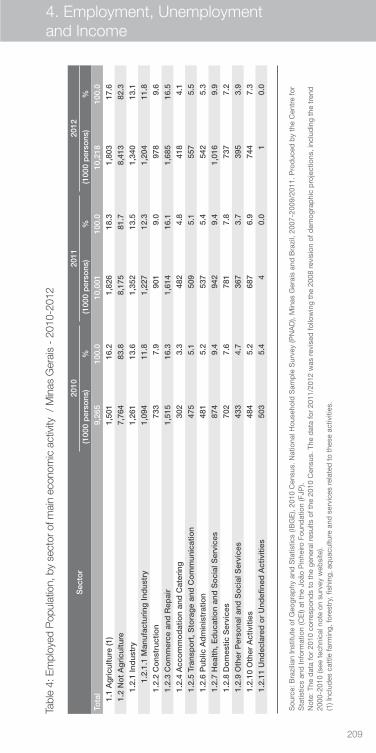
209
Sou
rce:
Joã
o P
inhe
iro F
ound
atio
n (F
JP),
Cen
tre
for
Sta
tistic
s an
d In
form
atio
n (C
EI),
Bel
o H
oriz
onte
Met
rop
olita
n A
rea
Em
plo
ymen
t an
d U
nem
plo
ymen
t S
urve
y (P
ED
/RM
BH
). FJ
P/D
IEE
SE
/SE
AD
E/
SE
DE
SE
-MG
Agr
eem
ent.
Pro
duc
ed b
y th
e C
entr
e fo
r S
tatis
tics
and
Info
rmat
ion
(CE
I) at
the
Joã
o P
inhe
iro F
ound
atio
n (F
JP).
(1) P
erso
ns o
f 10
year
s of
age
or
mor
e. (2
) Ref
ers
to p
erso
ns w
ho s
aid
the
y w
ere
unab
le t
o re
ad a
nd w
rite.
(3) B
asic
Ed
ucat
ion:
com
pul
sory
sch
oolin
g b
etw
een
six
and
14/
15 y
ears
of a
ge. (
4) M
idd
le
Sch
ool:
from
15-
18 y
ears
of a
ge. (
5) H
ighe
r E
duc
atio
n: U
nive
rsity
. (6)
Uni
vers
ity g
rad
uate
s.
Tabl
e 4:
Em
ploy
ed P
opul
atio
n, b
y se
ctor
of m
ain
econ
omic
act
ivity
/ M
inas
Ger
ais
- 20
10-2
012
Sec
tor
2010
2011
2012
(100
0 p
erso
ns)
%(1
000
per
sons
)%
(100
0 p
erso
ns)
%
Tota
l9,
265
100.
010
,001
100.
010
,218
100
.0
1.
1 A
gri
cultu
re (1
)1,
501
16.2
1,82
618
.31,
803
17.6
1.
2 N
ot
Ag
ricu
lture
7,76
483
.88,
175
81.7
8,41
382
.3
1.2.
1 In
dus
try
1,26
113
.61,
352
13.5
1,34
013
.1
1.
2.1.
1 M
anuf
actu
ring
Ind
ustr
y1,
094
11.8
1,22
712
.31,
204
11.8
1.2.
2 C
ons
truc
tion
733
7.9
901
9.0
978
9.6
1.2.
3 C
om
mer
ce a
nd R
epai
r1,
515
16.3
1,61
416
.11,
685
16.5
1.2.
4 A
cco
mm
od
atio
n an
d C
ater
ing
302
3.3
482
4.8
418
4.1
1.2.
5 Tr
ansp
ort
, Sto
rag
e an
d C
om
mun
icat
ion
475
5.1
509
5.1
557
5.5
1.2.
6 P
ublic
Ad
min
istr
atio
n48
15.
253
75.
454
25.
3
1.2.
7 H
ealth
, Ed
ucat
ion
and
So
cial
Ser
vice
s87
49.
494
29.
41,
016
9.9
1.2.
8 D
om
estic
Ser
vice
s70
27.
678
17.
873
77.
2
1.2.
9 O
ther
Per
sona
l and
So
cial
Ser
vice
s43
34.
736
73.
739
53.
9
1.2.
10 O
ther
Act
iviti
es48
45.
268
76.
974
47.
3
1.2.
11 U
ndec
lare
d o
r U
ndef
ined
Act
iviti
es50
35.
44
0.0
10.
0
Sou
rce:
Bra
zilia
n In
stitu
te o
f Geo
grap
hy a
nd S
tatis
tics
(IBG
E),
2010
Cen
sus.
Nat
iona
l Hou
seho
ld S
amp
le S
urve
y (P
NA
D),
Min
as G
erai
s an
d B
razi
l, 20
07-2
009/
2011
. Pro
duc
ed b
y th
e C
entr
e fo
r S
tatis
tics
and
Info
rmat
ion
(CE
I) at
the
Joã
o P
inhe
iro F
ound
atio
n (F
JP).
Not
e: T
he d
ata
for
2010
cor
resp
ond
s to
the
gen
eral
res
ults
of t
he 2
010
Cen
sus.
The
dat
a fo
r 20
11/2
012
was
rev
ised
follo
win
g th
e 20
08 r
evis
ion
of d
emog
rap
hic
pro
ject
ions
, inc
lud
ing
the
tren
d
2000
-201
0 (s
ee t
echn
ical
not
e on
sur
vey
web
site
). (1
) Inc
lud
es c
attle
farm
ing,
fore
stry
, fis
hing
, aq
uacu
lture
and
ser
vice
s re
late
d t
o th
ese
activ
ities
.
4. Employment, Unemployment and Income
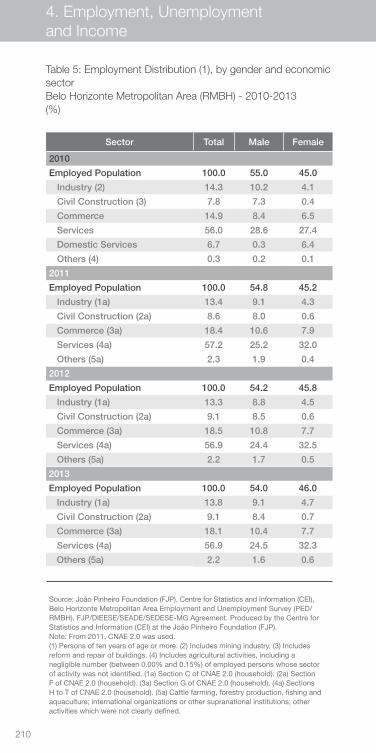
210
Sector Total Male Female
2010
Employed Population 100.0 55.0 45.0
Industry (2) 14.3 10.2 4.1
Civil Construction (3) 7.8 7.3 0.4
Commerce 14.9 8.4 6.5
Services 56.0 28.6 27.4
Domestic Services 6.7 0.3 6.4
Others (4) 0.3 0.2 0.1
2011
Employed Population 100.0 54.8 45.2
Industry (1a) 13.4 9.1 4.3
Civil Construction (2a) 8.6 8.0 0.6
Commerce (3a) 18.4 10.6 7.9
Services (4a) 57.2 25.2 32.0
Others (5a) 2.3 1.9 0.4
2012
Employed Population 100.0 54.2 45.8
Industry (1a) 13.3 8.8 4.5
Civil Construction (2a) 9.1 8.5 0.6
Commerce (3a) 18.5 10.8 7.7
Services (4a) 56.9 24.4 32.5
Others (5a) 2.2 1.7 0.5
2013
Employed Population 100.0 54.0 46.0
Industry (1a) 13.8 9.1 4.7
Civil Construction (2a) 9.1 8.4 0.7
Commerce (3a) 18.1 10.4 7.7
Services (4a) 56.9 24.5 32.3
Others (5a) 2.2 1.6 0.6
Source: João Pinheiro Foundation (FJP), Centre for Statistics and Information (CEI), Belo Horizonte Metropolitan Area Employment and Unemployment Survey (PED/RMBH). FJP/DIEESE/SEADE/SEDESE-MG Agreement. Produced by the Centre for Statistics and Information (CEI) at the João Pinheiro Foundation (FJP). Note: From 2011, CNAE 2.0 was used. (1) Persons of ten years of age or more. (2) Includes mining industry. (3) Includes reform and repair of buildings. (4) Includes agricultural activities, including a negligible number (between 0.00% and 0.15%) of employed persons whose sector of activity was not identified. (1a) Section C of CNAE 2.0 (household). (2a) Section F of CNAE 2.0 (household). (3a) Section G of CNAE 2.0 (household). (4a) Sections H to T of CNAE 2.0 (household). (5a) Cattle farming, forestry production, fishing and aquaculture; international organizations or other supranational institutions; other activities which were not clearly defined.
Table 5: Employment Distribution (1), by gender and economic sector Belo Horizonte Metropolitan Area (RMBH) - 2010-2013 (%)
4. Employment, Unemployment and Income
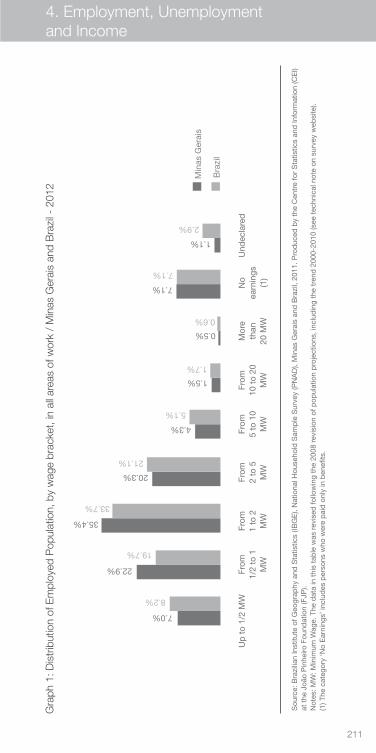
211
Gra
ph 1
: Dis
trib
utio
n of
Em
ploy
ed P
opul
atio
n, b
y w
age
brac
ket,
in a
ll ar
eas
of w
ork
/ M
inas
Ger
ais
and
Bra
zil -
201
2
Sou
rce:
Bra
zilia
n In
stitu
te o
f Geo
grap
hy a
nd S
tatis
tics
(IBG
E),
Nat
iona
l Hou
seho
ld S
amp
le S
urve
y (P
NA
D),
Min
as G
erai
s an
d B
razi
l, 20
11. P
rod
uced
by
the
Cen
tre
for
Sta
tistic
s an
d In
form
atio
n (C
EI)
at t
he J
oão
Pin
heiro
Fou
ndat
ion
(FJP
). N
otes
: MW
: Min
imum
Wag
e. T
he d
ata
in t
his
tab
le w
as r
evis
ed fo
llow
ing
the
2008
rev
isio
n of
pop
ulat
ion
pro
ject
ions
, inc
lud
ing
the
tren
d 2
000-
2010
(see
tec
hnic
al n
ote
on s
urve
y w
ebsi
te).
(1) T
he c
ateg
ory
‘No
Ear
ning
s’ in
clud
es p
erso
ns w
ho w
ere
pai
d o
nly
in b
enef
its.
From
1/2
to 1
MW
From
1 to
2M
W
From
2 to
5M
W
From
5 to
10
MW
From
10 t
o 20
MW
Mor
eth
an20
MW
No
earn
ings
(1)
Und
ecla
red
Up
to
1/2
MW
Min
as G
erai
s
Bra
zil
7.0%
22.9%
35.4%
20.3%
4.3%
1.5%
0.5%
7.1%
1.1%
8.2%
19.7%
33.7%
21.1%
5.1%
1.7%
7.1%
2.9%
0.6%
4. Employment, Unemployment and Income
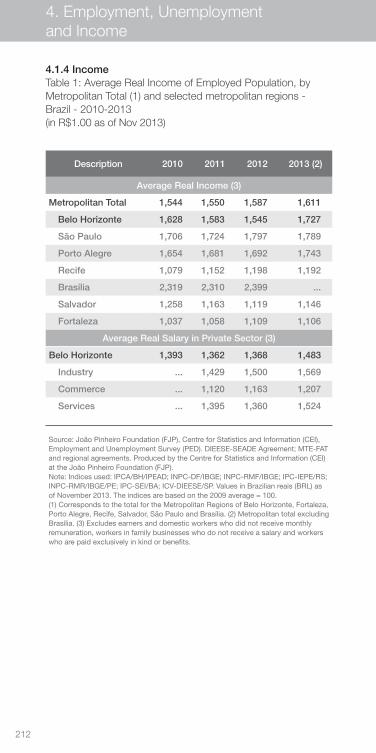
212
4.1.4 IncomeTable 1: Average Real Income of Employed Population, by Metropolitan Total (1) and selected metropolitan regions - Brazil - 2010-2013 (in R$1.00 as of Nov 2013)
Source: João Pinheiro Foundation (FJP), Centre for Statistics and Information (CEI), Employment and Unemployment Survey (PED). DIEESE-SEADE Agreement; MTE-FAT and regional agreements. Produced by the Centre for Statistics and Information (CEI) at the João Pinheiro Foundation (FJP). Note: Indices used: IPCA/BH/IPEAD; INPC-DF/IBGE; INPC-RMF/IBGE; IPC-IEPE/RS; INPC-RMR/IBGE/PE; IPC-SEI/BA; ICV-DIEESE/SP. Values in Brazilian reais (BRL) as of November 2013. The indices are based on the 2009 average = 100. (1) Corresponds to the total for the Metropolitan Regions of Belo Horizonte, Fortaleza, Porto Alegre, Recife, Salvador, São Paulo and Brasília. (2) Metropolitan total excluding Brasília. (3) Excludes earners and domestic workers who did not receive monthly remuneration, workers in family businesses who do not receive a salary and workers who are paid exclusively in kind or benefits.
Description 2010 2011 2012 2013 (2)
Average Real Income (3)
Metropolitan Total 1,544 1,550 1,587 1,611
Belo Horizonte 1,628 1,583 1,545 1,727
São Paulo 1,706 1,724 1,797 1,789
Porto Alegre 1,654 1,681 1,692 1,743
Recife 1,079 1,152 1,198 1,192
Brasília 2,319 2,310 2,399 ...
Salvador 1,258 1,163 1,119 1,146
Fortaleza 1,037 1,058 1,109 1,106
Average Real Salary in Private Sector (3)
Belo Horizonte 1,393 1,362 1,368 1,483
Industry ... 1,429 1,500 1,569
Commerce ... 1,120 1,163 1,207
Services ... 1,395 1,360 1,524
4. Employment, Unemployment and Income
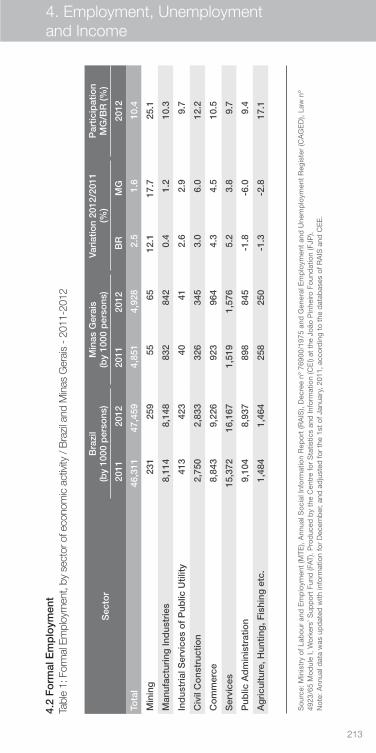
213
4.2
Fo
rmal
Em
plo
ymen
tTa
ble
1: F
orm
al E
mpl
oym
ent,
by s
ecto
r of e
cono
mic
act
ivity
/ B
razi
l and
Min
as G
erai
s -
2011
-201
2
Sec
tor
Bra
zil
(by
1000
per
sons
)M
inas
Ger
ais
(by
1000
per
sons
)Va
riat
ion
2012
/201
1 (%
)P
artic
ipat
ion
MG
/BR
(%)
2011
2012
2011
2012
BR
MG
2012
Tota
l46
,311
47,4
594,
851
4,92
82.
51.
610
.4
Min
ing
231
259
5565
12.1
17.7
25.1
Man
ufac
turi
ng In
dus
trie
s8,
114
8,14
883
284
20.
41.
210
.3
Ind
ustr
ial S
ervi
ces
of
Pub
lic U
tility
413
423
4041
2.6
2.9
9.7
Civ
il C
ons
truc
tion
2,75
02,
833
326
345
3.0
6.0
12.2
Co
mm
erce
8,84
39,
226
923
964
4.3
4.5
10.5
Ser
vice
s15
,372
16,1
671,
519
1,57
65.
23.
89.
7
Pub
lic A
dm
inis
trat
ion
9,10
48,
937
898
845
-1.8
-6.0
9.4
Ag
ricu
lture
, Hun
ting
, Fis
hing
etc
.1,
484
1,46
425
825
0-1
.3-2
.817
.1
Sou
rce:
Min
istr
y of
Lab
our
and
Em
plo
ymen
t (M
TE),
Ann
ual S
ocia
l Inf
orm
atio
n R
epor
t (R
AIS
), D
ecre
e nº
769
00/1
975
and
Gen
eral
Em
plo
ymen
t an
d U
nem
plo
ymen
t R
egis
ter
(CA
GE
D),
Law
nº
4923
/65
Mod
ule
I, W
orke
rs’ S
upp
ort
Fund
(FAT
). P
rod
uced
by
the
Cen
tre
for
Sta
tistic
s an
d In
form
atio
n (C
EI)
at t
he J
oão
Pin
heiro
Fou
ndat
ion
(FJP
). N
ote:
Ann
ual d
ata
was
up
dat
ed w
ith in
form
atio
n fo
r D
ecem
ber
, and
ad
just
ed fo
r th
e 1s
t of
Jan
uary
, 201
1, a
ccor
din
g to
the
dat
abas
es o
f RA
IS a
nd C
EE
.
4. Employment, Unemployment and Income
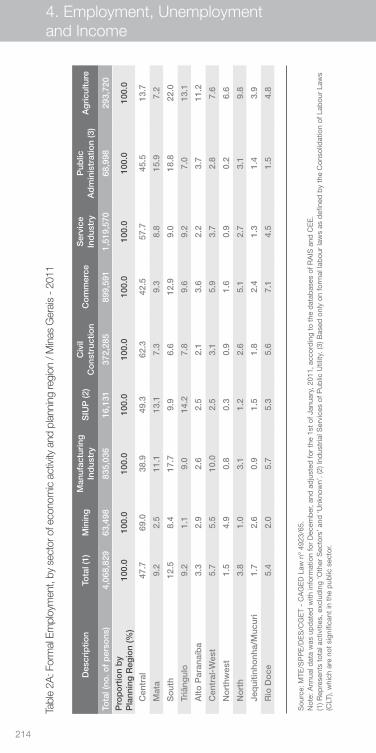
214
Tabl
e 2A
: For
mal
Em
ploy
men
t, by
sec
tor o
f eco
nom
ic a
ctiv
ity a
nd p
lann
ing
regi
on /
Min
as G
erai
s -
2011
Des
crip
tion
Tota
l (1)
Min
ing
Man
ufac
turi
ng
Ind
ustr
yS
IUP
(2)
Civ
il C
ons
truc
tion
Co
mm
erce
Ser
vice
In
dus
try
Pub
lic
Ad
min
istr
atio
n (3
)A
gri
cultu
re
Tota
l (no
. of
per
sons
)4,
068,
829
63,4
9883
5,03
616
,131
372,
285
899,
591
1,51
9,57
068
,998
293,
720
Pro
po
rtio
n b
y P
lann
ing
Reg
ion
(%)
100.
010
0.0
100.
010
0.0
100.
010
0.0
100.
010
0.0
100.
0
C
entr
al47
.769
.038
.949
.362
.342
.557
.745
.513
.7
M
ata
9.2
2.5
11.1
13.1
7.3
9.3
8.8
15.9
7.2
S
out
h12
.58.
417
.79.
96.
612
.99.
018
.822
.0
Tr
iâng
ulo
9.2
1.1
9.0
14.2
7.8
9.6
9.2
7.0
13.1
A
lto P
aran
aíb
a3.
32.
92.
62.
52.
13.
62.
23.
711
.2
C
entr
al-W
est
5.7
5.5
10.0
2.5
3.1
5.9
3.7
2.8
7.6
N
ort
hwes
t1.
54.
90.
80.
30.
91.
60.
90.
26.
6
N
ort
h3.
81.
03.
11.
22.
65.
12.
73.
19.
8
Je
qui
tinho
nha/
Muc
uri
1.7
2.6
0.9
1.5
1.8
2.4
1.3
1.4
3.9
R
io D
oce
5.4
2.0
5.7
5.3
5.6
7.1
4.5
1.5
4.8
Sou
rce:
MTE
/SP
PE
/DE
S/C
GE
T -
CA
GE
D L
aw n
º 49
23/6
5.
Not
e: A
nnua
l dat
a w
as u
pd
ated
with
info
rmat
ion
for
Dec
emb
er, a
nd a
dju
sted
for
the
1st
of J
anua
ry, 2
011,
acc
ord
ing
to t
he d
atab
ases
of R
AIS
and
CE
E.
(1) R
epre
sent
s to
tal a
ctiv
ities
, exc
lud
ing
‘Oth
er S
ecto
rs’ a
nd ‘U
nkno
wn’
. (2)
Ind
ustr
ial S
ervi
ces
of P
ublic
Util
ity. (
3) B
ased
onl
y on
form
al la
bou
r la
ws
as d
efin
ed b
y th
e C
onso
lidat
ion
of L
abou
r La
ws
(CLT
), w
hich
are
not
sig
nific
ant
in t
he p
ublic
sec
tor.
4. Employment, Unemployment and Income
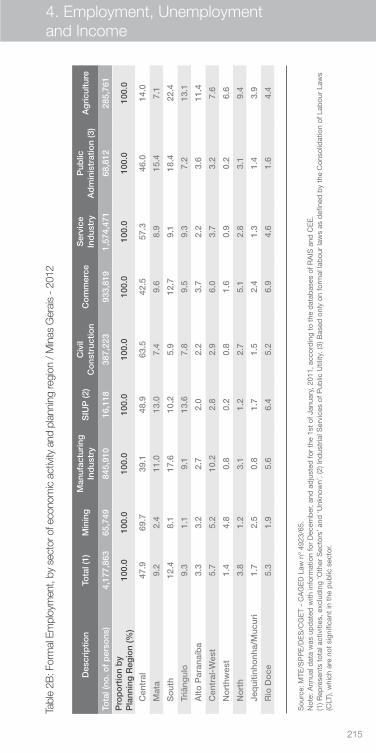
215
Tabl
e 2B
: For
mal
Em
ploy
men
t, by
sec
tor o
f eco
nom
ic a
ctiv
ity a
nd p
lann
ing
regi
on /
Min
as G
erai
s -
2012
Des
crip
tion
Tota
l (1)
Min
ing
Man
ufac
turi
ng
Ind
ustr
yS
IUP
(2)
Civ
il C
ons
truc
tion
Co
mm
erce
Ser
vice
In
dus
try
Pub
lic
Ad
min
istr
atio
n (3
)A
gri
cultu
re
Tota
l (no
. of
per
sons
)4,
177,
863
65,7
4984
5,91
016
,118
387,
223
933,
819
1,57
4,47
168
,812
285,
761
Pro
po
rtio
n b
y P
lann
ing
Reg
ion
(%)
100.
010
0.0
100.
010
0.0
100.
010
0.0
100.
010
0.0
100.
0
C
entr
al47
.969
.739
.148
.963
.542
.557
.346
.014
.0
M
ata
9.2
2.4
11.0
13.0
7.4
9.6
8.9
15.4
7.1
S
out
h12
.48.
117
.610
.25.
912
.79.
118
.422
.4
Tr
iâng
ulo
9.3
1.1
9.1
13.6
7.8
9.5
9.3
7.2
13.1
A
lto P
aran
aíb
a3.
33.
22.
72.
02.
23.
72.
23.
611
.4
C
entr
al-W
est
5.7
5.2
10.2
2.8
2.9
6.0
3.7
3.2
7.6
N
ort
hwes
t1.
44.
80.
80.
20.
81.
60.
90.
26.
6
N
ort
h3.
81.
23.
11.
22.
75.
12.
83.
19.
4
Je
qui
tinho
nha/
Muc
uri
1.7
2.5
0.8
1.7
1.5
2.4
1.3
1.4
3.9
R
io D
oce
5.3
1.9
5.6
6.4
5.2
6.9
4.6
1.6
4.4
Sou
rce:
MTE
/SP
PE
/DE
S/C
GE
T -
CA
GE
D L
aw n
º 49
23/6
5.
Not
e: A
nnua
l dat
a w
as u
pd
ated
with
info
rmat
ion
for
Dec
emb
er, a
nd a
dju
sted
for
the
1st
of J
anua
ry, 2
011,
acc
ord
ing
to t
he d
atab
ases
of R
AIS
and
CE
E.
(1) R
epre
sent
s to
tal a
ctiv
ities
, exc
lud
ing
‘Oth
er S
ecto
rs’ a
nd ‘U
nkno
wn’
. (2)
Ind
ustr
ial S
ervi
ces
of P
ublic
Util
ity. (
3) B
ased
onl
y on
form
al la
bou
r la
ws
as d
efin
ed b
y th
e C
onso
lidat
ion
of L
abou
r La
ws
(CLT
), w
hich
are
not
sig
nific
ant
in t
he p
ublic
sec
tor.
4. Employment, Unemployment and Income

216
Tabl
e 2C
: For
mal
Em
ploy
men
t, by
sec
tor o
f eco
nom
ic a
ctiv
ity a
nd p
lann
ing
regi
on /
Min
as G
erai
s -
2013
Des
crip
tion
Tota
l (1)
Min
ing
Man
ufac
turi
ng
Ind
ustr
yS
IUP
(2)
Civ
il C
ons
truc
tion
Co
mm
erce
Ser
vice
In
dus
try
Pub
lic
Ad
min
istr
atio
n (3
)A
gri
cultu
re
Tota
l (no
. of
per
sons
)4,
245,
159
66,2
3486
0,08
616
,566
385,
467
959,
386
1,61
1,06
271
,345
275,
013
Pro
po
rtio
n b
y P
lann
ing
Reg
ion
(%)
100.
010
0.0
100.
010
0.0
100.
010
0.0
100.
010
0.0
100.
0
C
entr
al47
.469
.838
.349
.962
.342
.256
.646
.014
.2
M
ata
9.3
2.4
10.9
13.0
7.8
9.7
8.9
15.0
7.2
S
out
h12
.47.
317
.69.
56.
012
.79.
318
.522
.4
Tr
iâng
ulo
9.4
1.0
9.2
13.3
8.3
9.5
9.5
7.9
13.2
A
lto P
aran
aíb
a3.
33.
02.
82.
52.
33.
72.
23.
411
.2
C
entr
al-W
est
6.0
5.3
11.1
2.4
2.9
6.0
3.8
2.9
7.8
N
ort
hwes
t1.
54.
90.
80.
21.
01.
60.
90.
26.
6
N
ort
h3.
81.
53.
20.
42.
75.
12.
93.
19.
4
Je
qui
tinho
nha/
Muc
uri
1.7
2.8
0.8
2.3
1.4
2.5
1.3
1.3
4.0
R
io D
oce
5.2
2.0
5.2
6.7
5.4
6.9
4.6
1.6
4.0
Sou
rce:
MTE
/SP
PE
/DE
S/C
GE
T -
CA
GE
D L
aw n
º 49
23/6
5.
Not
e: A
nnua
l dat
a w
as u
pd
ated
with
info
rmat
ion
for
Dec
emb
er, a
nd a
dju
sted
for
the
1st
of J
anua
ry, 2
011,
acc
ord
ing
to t
he d
atab
ases
of R
AIS
and
CE
E.
(1) R
epre
sent
s to
tal a
ctiv
ities
, exc
lud
ing
‘Oth
er S
ecto
rs’ a
nd ‘U
nkno
wn’
. (2)
Ind
ustr
ial S
ervi
ces
of P
ublic
Util
ity. (
3) B
ased
onl
y on
form
al la
bou
r la
ws
as d
efin
ed b
y th
e C
onso
lidat
ion
of L
abou
r La
ws
(CLT
), w
hich
are
not
sig
nific
ant
in t
he p
ublic
sec
tor.
4. Employment, Unemployment and Income

217
Price Behaviour
5
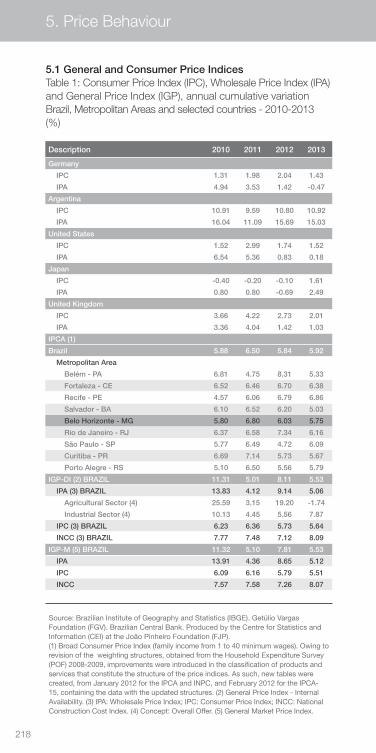
218
5. Price Behaviour
5.1 General and Consumer Price IndicesTable 1: Consumer Price Index (IPC), Wholesale Price Index (IPA) and General Price Index (IGP), annual cumulative variation Brazil, Metropolitan Areas and selected countries - 2010-2013 (%)
Description 2010 2011 2012 2013
Germany
IPC 1.31 1.98 2.04 1.43
IPA 4.94 3.53 1.42 -0.47
Argentina
IPC 10.91 9.59 10.80 10.92
IPA 16.04 11.09 15.69 15.03
United States
IPC 1.52 2.99 1.74 1.52
IPA 6.54 5.36 0.83 0.18
Japan
IPC -0.40 -0.20 -0.10 1.61
IPA 0.80 0.80 -0.69 2.49
United Kingdom
IPC 3.66 4.22 2.73 2.01
IPA 3.36 4.04 1.42 1.03
IPCA (1)
Brazil 5.88 6.50 5.84 5.92
Metropolitan Area
Belém - PA 6.81 4.75 8.31 5.33
Fortaleza - CE 6.52 6.46 6.70 6.38
Recife - PE 4.57 6.06 6.79 6.86
Salvador - BA 6.10 6.52 6.20 5.03
Belo Horizonte - MG 5.80 6.80 6.03 5.75
Rio de Janeiro - RJ 6.37 6.58 7.34 6.16
São Paulo - SP 5.77 6.49 4.72 6.09
Curitiba - PR 6.69 7.14 5.73 5.67
Porto Alegre - RS 5.10 6.50 5.56 5.79
IGP-DI (2) BRAZIL 11.31 5.01 8.11 5.53
IPA (3) BRAZIL 13.83 4.12 9.14 5.06
Agricultural Sector (4) 25.59 3.15 19.20 -1.74
Industrial Sector (4) 10.13 4.45 5.56 7.87
IPC (3) BRAZIL 6.23 6.36 5.73 5.64
INCC (3) BRAZIL 7.77 7.48 7.12 8.09
IGP-M (5) BRAZIL 11.32 5.10 7.81 5.53
IPA 13.91 4.36 8.65 5.12
IPC 6.09 6.16 5.79 5.51
INCC 7.57 7.58 7.26 8.07
Source: Brazilian Institute of Geography and Statistics (IBGE). Getúlio Vargas Foundation (FGV). Brazilian Central Bank. Produced by the Centre for Statistics and Information (CEI) at the João Pinheiro Foundation (FJP). (1) Broad Consumer Price Index (family income from 1 to 40 minimum wages). Owing to revision of the weighting structures, obtained from the Household Expenditure Survey (POF) 2008-2009, improvements were introduced in the classification of products and services that constitute the structure of the price indices. As such, new tables were created, from January 2012 for the IPCA and INPC, and February 2012 for the IPCA-15, containing the data with the updated structures. (2) General Price Index - Internal Availability. (3) IPA: Wholesale Price Index; IPC: Consumer Price Index; INCC: National Construction Cost Index. (4) Concept: Overall Offer. (5) General Market Price Index.
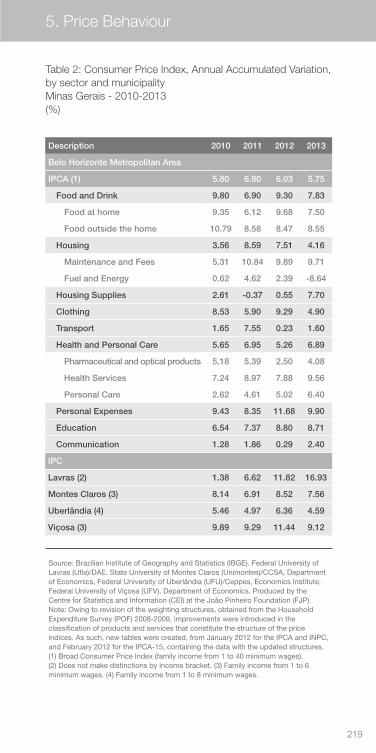
219
5. Price Behaviour
Table 2: Consumer Price Index, Annual Accumulated Variation, by sector and municipality Minas Gerais - 2010-2013 (%)
Description 2010 2011 2012 2013
Belo Horizonte Metropolitan Area
IPCA (1) 5.80 6.80 6.03 5.75
Food and Drink 9.80 6.90 9.30 7.83
Food at home 9.35 6.12 9.68 7.50
Food outside the home 10.79 8.58 8.47 8.55
Housing 3.56 8.59 7.51 4.16
Maintenance and Fees 5.31 10.84 9.89 9.71
Fuel and Energy 0.62 4.62 2.39 -8.64
Housing Supplies 2.61 -0.37 0.55 7.70
Clothing 8.53 5.90 9.29 4.90
Transport 1.65 7.55 0.23 1.60
Health and Personal Care 5.65 6.95 5.26 6.89
Pharmaceutical and optical products 5.18 5.39 2.50 4.08
Health Services 7.24 8.97 7.88 9.56
Personal Care 2.62 4.61 5.02 6.40
Personal Expenses 9.43 8.35 11.68 9.90
Education 6.54 7.37 8.80 8.71
Communication 1.28 1.86 0.29 2.40
IPC
Lavras (2) 1.38 6.62 11.82 16.93
Montes Claros (3) 8.14 6.91 8.52 7.56
Uberlândia (4) 5.46 4.97 6.36 4.59
Viçosa (3) 9.89 9.29 11.44 9.12
Source: Brazilian Institute of Geography and Statistics (IBGE). Federal University of Lavras (Ufla)/DAE. State University of Montes Claros (Unimontes)/CCSA, Department of Economics, Federal University of Uberlândia (UFU)/Ceppes, Economics Institute, Federal University of Viçosa (UFV), Department of Economics. Produced by the Centre for Statistics and Information (CEI) at the João Pinheiro Foundation (FJP). Note: Owing to revision of the weighting structures, obtained from the Household Expenditure Survey (POF) 2008-2009, improvements were introduced in the classification of products and services that constitute the structure of the price indices. As such, new tables were created, from January 2012 for the IPCA and INPC, and February 2012 for the IPCA-15, containing the data with the updated structures. (1) Broad Consumer Price Index (family income from 1 to 40 minimum wages). (2) Does not make distinctions by income bracket. (3) Family income from 1 to 6 minimum wages. (4) Family income from 1 to 8 minimum wages.

220220

221
Macroeconomic Aggregates
6
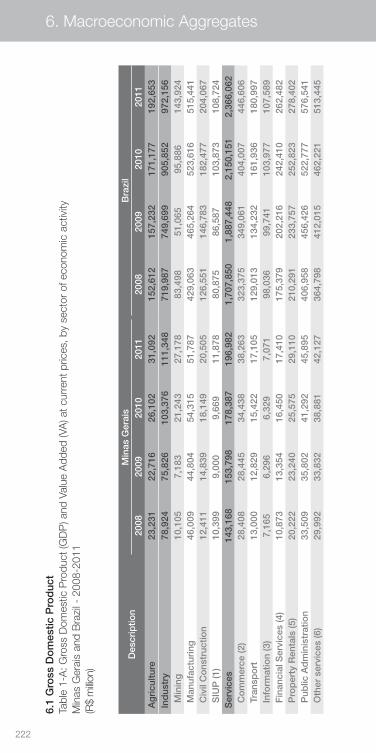
222
6. Macroeconomic Aggregates
6.1
Gro
ss D
om
estic
Pro
duc
tTa
ble
1-A
: Gro
ss D
omes
tic P
rodu
ct (G
DP
) and
Val
ue A
dded
(VA
) at c
urre
nt p
rices
, by
sect
or o
f eco
nom
ic a
ctiv
ityM
inas
Ger
ais
and
Bra
zil -
200
8-20
11
(R$
milli
on)
Des
crip
tion
Min
as G
erai
sB
razi
l20
0820
0920
1020
1120
0820
0920
1020
11 A
gri
cultu
re23
,231
22,7
1626
,102
31,0
9215
2,61
215
7,23
217
1,17
719
2,65
3 In
dus
try
78,9
2475
,826
103,
376
111,
348
719,
987
749,
699
905,
852
972,
156
M
inin
g10
,105
7,18
321
,243
27,1
7883
,498
51,0
6595
,886
143,
924
M
anuf
actu
ring
46,0
0944
,804
54,3
1551
,787
429,
063
465,
264
523,
616
515,
441
C
ivil
Co
nstr
uctio
n12
,411
14,8
3918
,149
20,5
0512
6,55
114
6,78
318
2,47
720
4,06
7
SIU
P (1
)10
,399
9,00
09,
669
11,8
7880
,875
86,5
8710
3,87
310
8,72
4 S
ervi
ces
143,
168
153,
798
178,
387
196,
982
1,70
7,85
01,
887,
448
2,15
0,15
12,
366,
062
C
om
mer
ce (2
)28
,408
28,4
4534
,438
38,2
6332
3,37
534
9,06
140
4,00
744
6,60
6
Tran
spo
rt13
,000
12,8
2915
,422
17,1
0512
9,01
313
4,23
216
1,93
618
0,99
7
Info
rmat
ion
(3)
7,16
56,
296
6,32
97,
071
98,0
3699
,741
103,
977
107,
589
F
inan
cial
Ser
vice
s (4
)10
,873
13,3
5416
,450
17,4
1017
5,37
920
2,21
624
2,41
026
2,48
2
Pro
per
ty R
enta
ls (5
)20
,222
23,2
4025
,575
29,1
1021
0,29
123
3,75
725
2,82
327
8,40
2
Pub
lic A
dm
inis
trat
ion
33,5
0935
,802
41,2
9245
,895
406,
958
456,
426
522,
777
576,
541
O
ther
ser
vice
s (6
)29
,992
33,8
3238
,881
42,1
2736
4,79
841
2,01
546
2,22
151
3,44
5
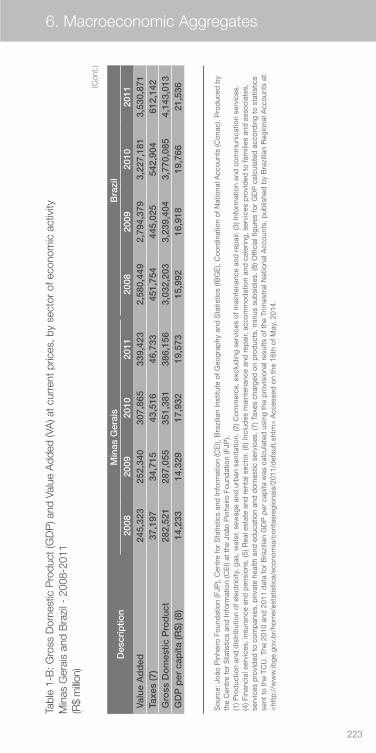
223
6. Macroeconomic Aggregates
Tabl
e 1-
B: G
ross
Dom
estic
Pro
duct
(GD
P) a
nd V
alue
Add
ed (V
A) a
t cur
rent
pric
es, b
y se
ctor
of e
cono
mic
act
ivity
Min
as G
erai
s an
d B
razi
l - 2
008-
2011
(R
$ m
illion
)
Des
crip
tion
Min
as G
erai
sB
razi
l20
0820
0920
1020
1120
0820
0920
1020
11 V
alue
Ad
ded
245,
323
252,
340
307,
865
339,
423
2,58
0,44
92,
794,
379
3,22
7,18
13,
530,
871
Tax
es (7
)37
,197
34,7
1543
,516
46,7
3345
1,75
444
5,02
554
2,90
461
2,14
2 G
ross
Do
mes
tic P
rod
uct
282,
521
287,
055
351,
381
386,
156
3,03
2,20
33,
239,
404
3,77
0,08
54,
143,
013
GD
P p
er c
apita
(R$)
(8)
14,2
3314
,329
17,9
3219
,573
15,9
9216
,918
19,7
6621
,536
Sou
rce:
Joã
o P
inhe
iro F
ound
atio
n (F
JP),
Cen
tre
for
Sta
tistic
s an
d In
form
atio
n (C
EI),
Bra
zilia
n In
stitu
te o
f Geo
grap
hy a
nd S
tatis
tics
(IBG
E),
Coo
rdin
atio
n of
Nat
iona
l Acc
ount
s (C
onac
). P
rod
uced
by
the
Cen
tre
for
Sta
tistic
s an
d In
form
atio
n (C
EI)
at t
he J
oão
Pin
heiro
Fou
ndat
ion
(FJP
). (1
) Pro
duc
tion
and
dis
trib
utio
n of
ele
ctric
ity, g
as, w
ater
, sew
age
and
urb
an s
anita
tion.
(2) C
omm
erce
, exc
lud
ing
serv
ices
of m
aint
enan
ce a
nd r
epai
r. (3
) Inf
orm
atio
n an
d c
omm
unic
atio
n se
rvic
es.
(4) F
inan
cial
ser
vice
s, in
sura
nce
and
pen
sion
s. (5
) Rea
l est
ate
and
ren
tal s
ecto
r. (6
) Inc
lud
es m
aint
enan
ce a
nd r
epai
r, ac
com
mod
atio
n an
d c
ater
ing,
ser
vice
s p
rovi
ded
to
fam
ilies
and
ass
ocia
tes,
se
rvic
es p
rovi
ded
to
com
pan
ies,
priv
ate
heal
th a
nd e
duc
atio
n an
d d
omes
tic s
ervi
ces.
(7) T
axes
cha
rged
on
pro
duc
ts, m
inus
sub
sid
ies.
(8) O
ffici
al fi
gure
s fo
r G
DP
cal
cula
ted
acc
ord
ing
to s
tatis
tics
sent
to
the
TCU
. The
201
0 an
d 2
011
dat
a fo
r B
razi
lian
GD
P p
er c
apita
was
cal
cula
ted
usi
ng t
he p
rovi
sion
al r
esul
ts o
f the
Trim
estr
al N
atio
nal A
ccou
nts,
pub
lishe
d b
y B
razi
lian
Reg
iona
l Acc
ount
s at
: <
http
://w
ww
.ibge
.gov
.br/
hom
e/es
tatis
tica/
econ
omia
/con
tasr
egio
nais
/201
1/d
efau
lt.sh
tm>
Acc
esse
d o
n th
e 16
th o
f May
, 201
4.
(Con
t.)
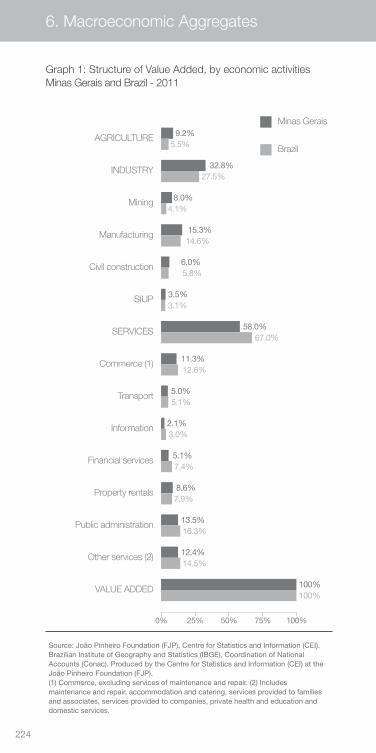
224
6. Macroeconomic Aggregates
Graph 1: Structure of Value Added, by economic activities Minas Gerais and Brazil - 2011
Source: João Pinheiro Foundation (FJP), Centre for Statistics and Information (CEI). Brazilian Institute of Geography and Statistics (IBGE), Coordination of National Accounts (Conac). Produced by the Centre for Statistics and Information (CEI) at the João Pinheiro Foundation (FJP). (1) Commerce, excluding services of maintenance and repair. (2) Includes maintenance and repair, accommodation and catering, services provided to families and associates, services provided to companies, private health and education and domestic services.
VALUE ADDED
Other services (2)
Public administration
Property rentals
Financial services
Information
Transport
Commerce (1)
SERVICES
SIUP
Civil construction
Manufacturing
Mining
INDUSTRY
AGRICULTUREBrazil
Minas Gerais
100%
12.4%
13.5%
8.6%
5.1%
2.1%
5.0%
11.3%
58.0%
3.5%
6.0%
15.3%
8.0%
32.8%
9.2%
100%
14.5%
16.3%
7.9%
7.4%
3.0%
5.1%
12.6%
67.0%
3.1%
5.8%
14.6%
4.1%
27.5%
5.5%
0% 25% 50% 75% 100%
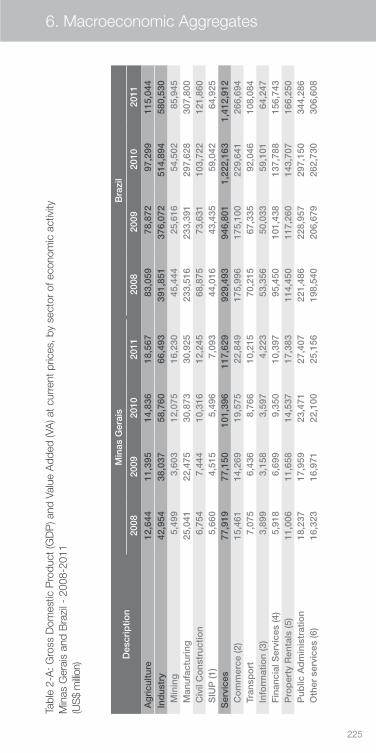
225
6. Macroeconomic Aggregates
Tabl
e 2-
A: G
ross
Dom
estic
Pro
duct
(GD
P) a
nd V
alue
Add
ed (V
A) a
t cur
rent
pric
es, b
y se
ctor
of e
cono
mic
act
ivity
Min
as G
erai
s an
d B
razi
l - 2
008-
2011
(U
S$
milli
on) D
escr
iptio
nM
inas
Ger
ais
Bra
zil
2008
2009
2010
2011
2008
2009
2010
2011
Ag
ricu
lture
12,6
4411
,395
14,8
3618
,567
83,0
5978
,872
97,2
9911
5,04
4 In
dus
try
42,9
5438
,037
58,7
6066
,493
391,
851
376,
072
514,
894
580,
530
M
inin
g5,
499
3,60
312
,075
16,2
3045
,444
25,6
1654
,502
85,9
45
Man
ufac
turi
ng25
,041
22,4
7530
,873
30,9
2523
3,51
623
3,39
129
7,62
830
7,80
0
Civ
il C
ons
truc
tion
6,75
47,
444
10,3
1612
,245
68,8
7573
,631
103,
722
121,
860
S
IUP
(1)
5,66
04,
515
5,49
67,
093
44,0
1643
,435
59,0
4264
,925
Ser
vice
s77
,919
77,1
5010
1,39
611
7,62
992
9,49
394
6,80
11,
222,
163
1,41
2,91
2
Co
mm
erce
(2)
15,4
6114
,269
19,5
7522
,849
175,
996
175,
100
229,
641
266,
694
Tr
ansp
ort
7,07
56,
436
8,76
610
,215
70,2
1567
,335
92,0
4610
8,08
4
Info
rmat
ion
(3)
3,89
93,
158
3,59
74,
223
53,3
5650
,033
59,1
0164
,247
F
inan
cial
Ser
vice
s (4
)5,
918
6,69
99,
350
10,3
9795
,450
101,
438
137,
788
156,
743
P
rop
erty
Ren
tals
(5)
11,0
0611
,658
14,5
3717
,383
114,
450
117,
260
143,
707
166,
250
P
ublic
Ad
min
istr
atio
n18
,237
17,9
5923
,471
27,4
0722
1,48
622
8,95
729
7,15
034
4,28
6
Oth
er s
ervi
ces
(6)
16,3
2316
,971
22,1
0025
,156
198,
540
206,
679
262,
730
306,
608
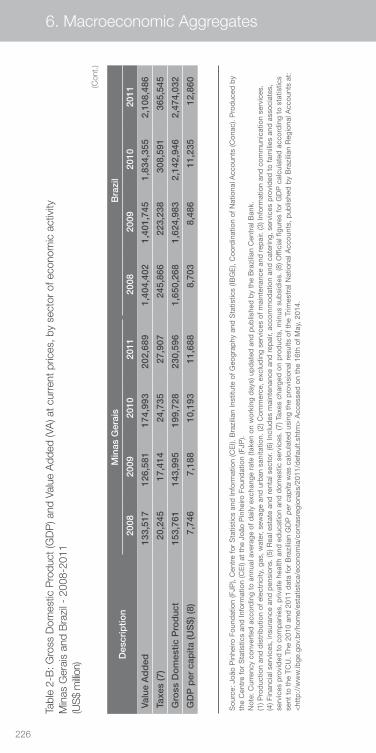
226
6. Macroeconomic Aggregates
Tabl
e 2-
B: G
ross
Dom
estic
Pro
duct
(GD
P) a
nd V
alue
Add
ed (V
A) a
t cur
rent
pric
es, b
y se
ctor
of e
cono
mic
act
ivity
Min
as G
erai
s an
d B
razi
l - 2
008-
2011
(U
S$
milli
on) D
escr
iptio
nM
inas
Ger
ais
Bra
zil
2008
2009
2010
2011
2008
2009
2010
2011
Val
ue A
dd
ed13
3,51
712
6,58
117
4,99
320
2,68
91,
404,
402
1,40
1,74
51,
834,
355
2,10
8,48
6
Tax
es (7
)20
,245
17,4
1424
,735
27,9
0724
5,86
622
3,23
830
8,59
136
5,54
5
Gro
ss D
om
estic
Pro
duc
t15
3,76
114
3,99
519
9,72
823
0,59
61,
650,
268
1,62
4,98
32,
142,
946
2,47
4,03
2
GD
P p
er c
apita
(US
$) (8
)7,
746
7,18
810
,193
11,6
888,
703
8,48
611
,235
12,8
60
Sou
rce:
Joã
o P
inhe
iro F
ound
atio
n (F
JP),
Cen
tre
for
Sta
tistic
s an
d In
form
atio
n (C
EI).
Bra
zilia
n In
stitu
te o
f Geo
grap
hy a
nd S
tatis
tics
(IBG
E),
Coo
rdin
atio
n of
Nat
iona
l Acc
ount
s (C
onac
). P
rod
uced
by
the
Cen
tre
for
Sta
tistic
s an
d In
form
atio
n (C
EI)
at t
he J
oão
Pin
heiro
Fou
ndat
ion
(FJP
). N
ote:
Cur
renc
y co
nver
ted
acc
ord
ing
to a
nnua
l ave
rage
of d
aily
exc
hang
e ra
te (t
aken
on
wor
king
day
s) u
pd
ated
and
pub
lishe
d b
y th
e B
razi
lian
Cen
tral
Ban
k.
(1) P
rod
uctio
n an
d d
istr
ibut
ion
of e
lect
ricity
, gas
, wat
er, s
ewag
e an
d u
rban
san
itatio
n. (2
) Com
mer
ce, e
xclu
din
g se
rvic
es o
f mai
nten
ance
and
rep
air.
(3) I
nfor
mat
ion
and
com
mun
icat
ion
serv
ices
. (4
) Fin
anci
al s
ervi
ces,
insu
ranc
e an
d p
ensi
ons.
(5) R
eal e
stat
e an
d r
enta
l sec
tor.
(6) I
nclu
des
mai
nten
ance
and
rep
air,
acco
mm
odat
ion
and
cat
erin
g, s
ervi
ces
pro
vid
ed t
o fa
mili
es a
nd a
ssoc
iate
s,
serv
ices
pro
vid
ed t
o co
mp
anie
s, p
rivat
e he
alth
and
ed
ucat
ion
and
dom
estic
ser
vice
s. (7
) Tax
es c
harg
ed o
n p
rod
ucts
, min
us s
ubsi
die
s. (8
) Offi
cial
figu
res
for
GD
P c
alcu
late
d a
ccor
din
g to
sta
tistic
s se
nt t
o th
e TC
U. T
he 2
010
and
201
1 d
ata
for
Bra
zilia
n G
DP
per
cap
ita w
as c
alcu
late
d u
sing
the
pro
visi
onal
res
ults
of t
he T
rimes
tral
Nat
iona
l Acc
ount
s, p
ublis
hed
by
Bra
zilia
n R
egio
nal A
ccou
nts
at:
<ht
tp:/
/ww
w.ib
ge.g
ov.b
r/ho
me/
esta
tistic
a/ec
onom
ia/c
onta
sreg
iona
is/2
011/
def
ault.
shtm
> A
cces
sed
on
the
16th
of M
ay, 2
014.
(Con
t.)
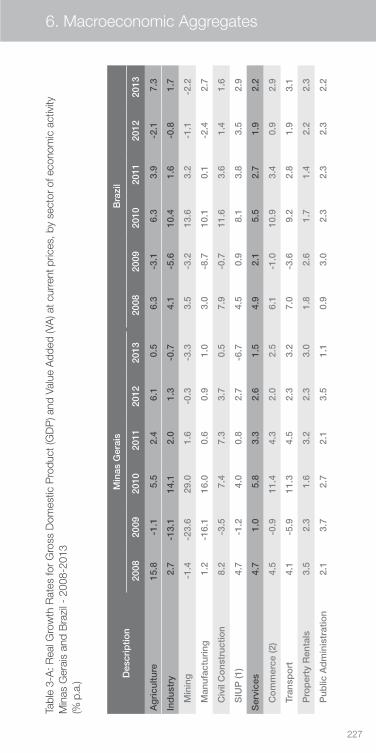
227
6. Macroeconomic Aggregates
Tabl
e 3-
A: R
eal G
row
th R
ates
for
Gro
ss D
omes
tic P
rodu
ct (G
DP
) and
Val
ue A
dded
(VA
) at c
urre
nt p
rices
, by
sect
or o
f eco
nom
ic a
ctiv
ityM
inas
Ger
ais
and
Bra
zil -
200
8-20
13
(% p
.a.)
Des
crip
tion
Min
as G
erai
sB
razi
l
2008
2009
2010
2011
2012
2013
2008
2009
2010
2011
2012
2013
Ag
ricu
lture
15.8
-1.1
5.5
2.4
6.1
0.5
6.3
-3.1
6.3
3.9
-2.1
7.3
Ind
ustr
y2.
7-1
3.1
14.1
2.0
1.3
-0.7
4.1
-5.6
10.4
1.6
-0.8
1.7
M
inin
g-1
.4-2
3.6
29.0
1.6
-0.3
-3.3
3.5
-3.2
13.6
3.2
-1.1
-2.2
M
anuf
actu
ring
1.2
-16.
116
.00.
60.
91.
03.
0-8
.710
.10.
1-2
.42.
7
C
ivil
Co
nstr
uctio
n8.
2-3
.57.
47.
33.
70.
57.
9-0
.711
.63.
61.
41.
6
S
IUP
(1)
4.7
-1.2
4.0
0.8
2.7
-6.7
4.5
0.9
8.1
3.8
3.5
2.9
Ser
vice
s4.
71.
05.
83.
32.
61.
54.
92.
15.
52.
71.
92.
2
C
om
mer
ce (2
)4.
5-0
.911
.44.
32.
02.
56.
1-1
.010
.93.
40.
92.
9
Tr
ansp
ort
4.1
-5.9
11.3
4.5
2.3
3.2
7.0
-3.6
9.2
2.8
1.9
3.1
P
rop
erty
Ren
tals
3.5
2.3
1.6
3.2
2.3
3.0
1.8
2.6
1.7
1.4
2.2
2.3
P
ublic
Ad
min
istr
atio
n2.
13.
72.
72.
13.
51.
10.
93.
02.
32.
32.
32.
2
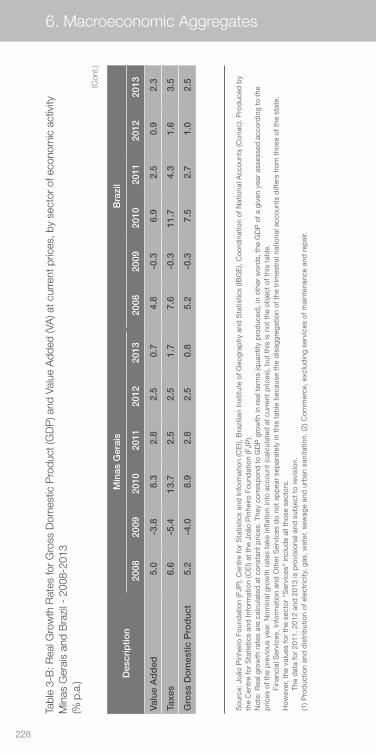
228
6. Macroeconomic Aggregates
Tabl
e 3-
B: R
eal G
row
th R
ates
for
Gro
ss D
omes
tic P
rodu
ct (G
DP
) and
Val
ue A
dded
(VA
) at c
urre
nt p
rices
, by
sect
or o
f eco
nom
ic a
ctiv
ityM
inas
Ger
ais
and
Bra
zil -
200
8-20
13
(% p
.a.)
Des
crip
tion
Min
as G
erai
sB
razi
l
2008
2009
2010
2011
2012
2013
2008
2009
2010
2011
2012
2013
Valu
e A
dd
ed5.
0-3
.88.
32.
82.
50.
74.
8-0
.36.
92.
50.
92.
3
Taxe
s6.
6-5
.413
.72.
52.
51.
77.
6-0
.311
.74.
31.
63.
5
Gro
ss D
om
estic
Pro
duc
t5.
2-4
.08.
92.
82.
50.
85.
2-0
.37.
52.
71.
02.
5
Sou
rce:
Joã
o P
inhe
iro F
ound
atio
n (F
JP),
Cen
tre
for
Sta
tistic
s an
d In
form
atio
n (C
EI),
Bra
zilia
n In
stitu
te o
f Geo
grap
hy a
nd S
tatis
tics
(IBG
E),
Coo
rdin
atio
n of
Nat
iona
l Acc
ount
s (C
onac
). P
rod
uced
by
the
Cen
tre
for
Sta
tistic
s an
d In
form
atio
n (C
EI)
at t
he J
oão
Pin
heiro
Fou
ndat
ion
(FJP
). N
ote:
Rea
l gro
wth
rat
es a
re c
alcu
late
d a
t co
nsta
nt p
rices
. The
y co
rres
pon
d t
o G
DP
gro
wth
in r
eal t
erm
s (q
uant
ity p
rod
uced
), in
oth
er w
ord
s, t
he G
DP
of a
giv
en y
ear
asse
ssed
acc
ord
ing
to t
he
pric
es o
f the
pre
viou
s ye
ar. N
omin
al g
row
th r
ates
tak
e in
flatio
n in
to a
ccou
nt (c
alcu
late
d a
t cu
rren
t p
rices
), b
ut t
his
is n
ot t
he o
bje
ct o
f thi
s ta
ble
.
Fina
ncia
l Ser
vice
s, In
form
atio
n an
d O
ther
Ser
vice
s d
o no
t ap
pea
r se
par
atel
y in
thi
s ta
ble
bec
ause
the
dis
aggr
egat
ion
of t
he t
rimes
tral
nat
iona
l acc
ount
s d
iffer
s fr
om t
hose
of t
he s
tate
. H
owev
er, t
he v
alue
s fo
r th
e se
ctor
“S
ervi
ces”
incl
ude
all t
hose
sec
tors
.
The
dat
a fo
r 20
11, 2
012
and
201
3 is
pro
visi
onal
and
sub
ject
to
revi
sion
. (1
) Pro
duc
tion
and
dis
trib
utio
n of
ele
ctric
ity, g
as, w
ater
, sew
age
and
urb
an s
anita
tion.
(2) C
omm
erce
, exc
lud
ing
serv
ices
of m
aint
enan
ce a
nd r
epai
r.
(Con
t.)
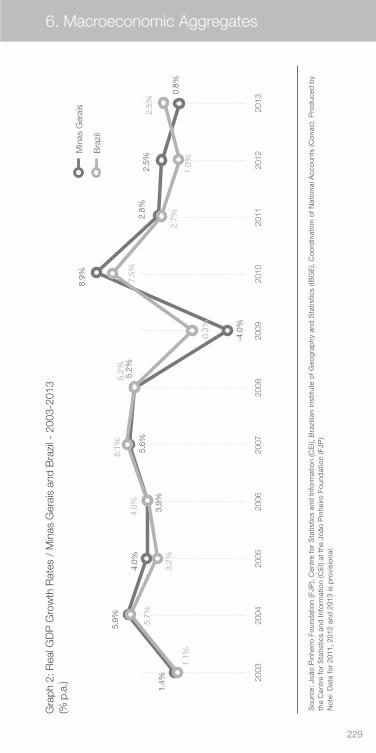
229
6. Macroeconomic Aggregates
Sou
rce:
Joã
o P
inhe
iro F
ound
atio
n (F
JP),
Cen
tre
for
Sta
tistic
s an
d In
form
atio
n (C
EI),
Bra
zilia
n In
stitu
te o
f Geo
grap
hy a
nd S
tatis
tics
(IBG
E),
Coo
rdin
atio
n of
Nat
iona
l Acc
ount
s (C
onac
). P
rod
uced
by
the
Cen
tre
for
Sta
tistic
s an
d In
form
atio
n (C
EI)
at t
he J
oão
Pin
heiro
Fou
ndat
ion
(FJP
). N
ote:
Dat
a fo
r 20
11, 2
012
and
201
3 is
pro
visi
onal
.
Gra
ph 2
: Rea
l GD
P G
row
th R
ates
/ M
inas
Ger
ais
and
Bra
zil -
200
3-20
13
(% p
.a.) 20
0320
0420
0520
0620
0720
0820
0920
1020
1120
1220
13
Min
as G
erai
s
Bra
zil
1.4%
5.9%
4.0%
3.9%
5.6%
-4.0
%
8.9%
2.8%
2.5%
0.8%
5.2%
1.1%
5.7%
3.2%
4.0%
6.1%
5.2%
-0.3
%
7.5%
1.0%
2.5%
2.7%
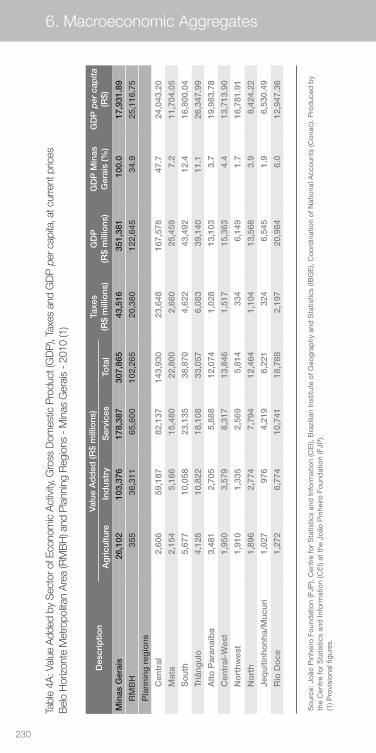
230
6. Macroeconomic Aggregates
Tabl
e 4A
: Val
ue A
dded
by
Sec
tor o
f Eco
nom
ic A
ctiv
ity, G
ross
Dom
estic
Pro
duct
(GD
P),
Taxe
s an
d G
DP
per
cap
ita, a
t cur
rent
pric
esB
elo
Hor
izon
te M
etro
polit
an A
rea
(RM
BH
) and
Pla
nnin
g R
egio
ns -
Min
as G
erai
s -
2010
(1)
Des
crip
tion
Valu
e A
dd
ed (R
$ m
illio
ns)
Taxe
s (R
$ m
illio
ns)
GD
P
(R$
mill
ions
)G
DP
Min
as
Ger
ais
(%)
GD
P p
er c
apita
(R
$) A
gri
cultu
reIn
dus
try
Ser
vice
sTo
tal
Min
as G
erai
s26
,102
103,
376
178,
387
307,
865
43,5
1635
1,38
110
0.0
17,9
31.8
9
R
MB
H35
536
,311
65,6
0010
2,26
520
,380
122,
645
34.9
25,1
16.7
5
P
lann
ing
reg
ions
C
entr
al2,
606
59,1
8782
,137
143,
930
23,6
4816
7,57
847
.724
,043
.20
M
ata
2,15
45,
166
15,4
8022
,800
2,66
025
,459
7.2
11,7
04.0
5
S
out
h5,
677
10,0
5823
,135
38,8
704,
622
43,4
9212
.416
,800
.04
Tr
iâng
ulo
4,12
810
,822
18,1
0833
,057
6,08
339
,140
11.1
26,3
47.9
9
A
lto P
aran
aíb
a3,
481
2,70
55,
888
12,0
741,
028
13,1
033.
719
,983
.78
C
entr
al-W
est
1,95
03,
579
8,31
713
,846
1,51
715
,363
4.4
13,7
13.9
0
N
ort
hwes
t1,
910
1,33
52,
569
5,81
433
46,
149
1.7
16,7
81.9
1
N
ort
h1,
896
2,77
47,
794
12,4
641,
104
13,5
683.
98,
424.
22
Je
qui
tinho
nha/
Muc
uri
1,02
797
64,
219
6,22
132
46,
545
1.9
6,53
0.49
R
io D
oce
1,27
26,
774
10,7
4118
,788
2,19
720
,984
6.0
12,9
47.3
6
Sou
rce:
Joã
o P
inhe
iro F
ound
atio
n (F
JP),
Cen
tre
for
Sta
tistic
s an
d In
form
atio
n (C
EI),
Bra
zilia
n In
stitu
te o
f Geo
grap
hy a
nd S
tatis
tics
(IBG
E),
Coo
rdin
atio
n of
Nat
iona
l Acc
ount
s (C
onac
). P
rod
uced
by
the
Cen
tre
for
Sta
tistic
s an
d In
form
atio
n (C
EI)
at t
he J
oão
Pin
heiro
Fou
ndat
ion
(FJP
). (1
) Pro
visi
onal
figu
res.
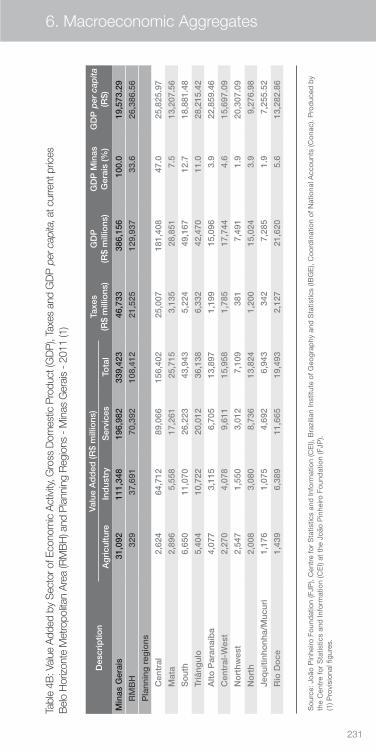
231
6. Macroeconomic Aggregates
Tabl
e 4B
: Val
ue A
dded
by
Sec
tor o
f Eco
nom
ic A
ctiv
ity, G
ross
Dom
estic
Pro
duct
(GD
P),
Taxe
s an
d G
DP
per
cap
ita, a
t cur
rent
pric
esB
elo
Hor
izon
te M
etro
polit
an A
rea
(RM
BH
) and
Pla
nnin
g R
egio
ns -
Min
as G
erai
s -
2011
(1)
Des
crip
tion
Valu
e A
dd
ed (R
$ m
illio
ns)
Taxe
s (R
$ m
illio
ns)
GD
P
(R$
mill
ions
)G
DP
Min
as
Ger
ais
(%)
GD
P p
er c
apita
(R
$) A
gri
cultu
reIn
dus
try
Ser
vice
sTo
tal
Min
as G
erai
s31
,092
111,
348
196,
982
339,
423
46,7
3338
6,15
610
0.0
19,5
73.2
9
R
MB
H32
937
,691
70,3
9210
8,41
221
,525
129,
937
33.6
26,3
86.5
6
P
lann
ing
reg
ions
C
entr
al2,
624
64,7
1289
,066
156,
402
25,0
0718
1,40
847
.025
,825
.97
M
ata
2,89
65,
558
17,2
6125
,715
3,13
528
,851
7.5
13,2
07.5
6
S
out
h6,
650
11,0
7026
,223
43,9
435,
224
49,1
6712
.718
,881
.48
Tr
iâng
ulo
5,40
410
,722
20,0
1236
,138
6,33
242
,470
11.0
28,2
15.4
2
A
lto P
aran
aíb
a4,
077
3,11
56,
705
13,8
971,
199
15,0
963.
922
,859
.46
C
entr
al-W
est
2,27
04,
078
9,61
115
,958
1,78
517
,744
4.6
15,6
97.0
9
N
ort
hwes
t2,
547
1,55
03,
012
7,10
938
17,
491
1.9
20,3
07.0
9
N
ort
h2,
008
3,08
08,
736
13,8
241,
200
15,0
243.
99,
276.
98
Je
qui
tinho
nha/
Muc
uri
1,17
61,
075
4,69
26,
943
342
7,28
51.
97,
255.
52
R
io D
oce
1,43
96,
389
11,6
6519
,493
2,12
721
,620
5.6
13,2
82.8
6
Sou
rce:
Joã
o P
inhe
iro F
ound
atio
n (F
JP),
Cen
tre
for
Sta
tistic
s an
d In
form
atio
n (C
EI),
Bra
zilia
n In
stitu
te o
f Geo
grap
hy a
nd S
tatis
tics
(IBG
E),
Coo
rdin
atio
n of
Nat
iona
l Acc
ount
s (C
onac
). P
rod
uced
by
the
Cen
tre
for
Sta
tistic
s an
d In
form
atio
n (C
EI)
at t
he J
oão
Pin
heiro
Fou
ndat
ion
(FJP
). (1
) Pro
visi
onal
figu
res.
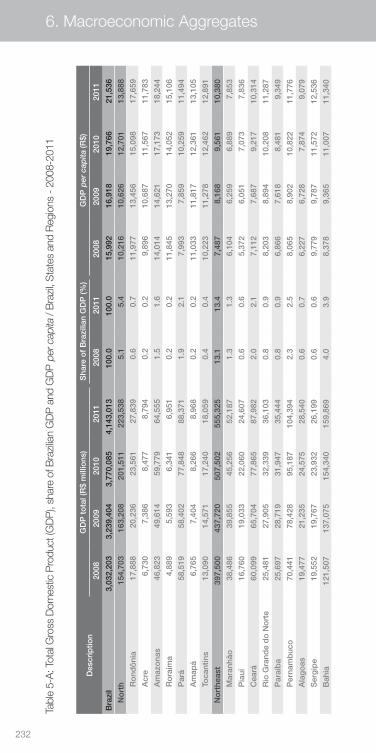
232
6. Macroeconomic Aggregates
Tabl
e 5-
A: T
otal
Gro
ss D
omes
tic P
rodu
ct (G
DP
), sh
are
of B
razi
lian
GD
P a
nd G
DP
per
cap
ita /
Bra
zil,
Sta
tes
and
Reg
ions
- 2
008-
2011
Des
crip
tion
GD
P t
ota
l (R
$ m
illio
ns)
Sha
re o
f B
razi
lian
GD
P (%
)G
DP
per
cap
ita (R
$)
2008
2009
2010
2011
2008
2011
2008
2009
2010
2011
Bra
zil
3,03
2,20
33,
239,
404
3,77
0,08
54,
143,
013
100.
010
0.0
15,9
9216
,918
19,7
6621
,536
N
ort
h15
4,70
316
3,20
820
1,51
122
3,53
85.
15.
410
,216
10,6
2612
,701
13,8
88
R
ond
ôni
a17
,888
20,2
3623
,561
27,8
390.
60.
711
,977
13,4
5615
,098
17,6
59
A
cre
6,73
07,
386
8,47
78,
794
0.2
0.2
9,89
610
,687
11,5
6711
,783
A
maz
ona
s46
,823
49,6
1459
,779
64,5
551.
51.
614
,014
14,6
2117
,173
18,2
44
R
ora
ima
4,88
95,
593
6,34
16,
951
0.2
0.2
11,8
4513
,270
14,0
5215
,106
P
ará
58,5
1958
,402
77,8
4888
,371
1.9
2.1
7,99
37,
859
10,2
5911
,494
A
map
á6,
765
7,40
48,
266
8,96
80.
20.
211
,033
11,8
1712
,361
13,1
05
To
cant
ins
13,0
9014
,571
17,2
4018
,059
0.4
0.4
10,2
2311
,278
12,4
6212
,891
N
ort
heas
t39
7,50
043
7,72
050
7,50
255
5,32
513
.113
.47,
487
8,16
89,
561
10,3
80
M
aran
hão
38,4
8639
,855
45,2
5652
,187
1.3
1.3
6,10
46,
259
6,88
97,
853
P
iauí
16,7
6019
,033
22,0
6024
,607
0.6
0.6
5,37
26,
051
7,07
37,
836
C
eará
60,0
9965
,704
77,8
6587
,982
2.0
2.1
7,11
27,
687
9,21
710
,314
R
io G
rand
e d
o N
ort
e25
,481
27,9
0532
,339
36,1
030.
80.
98,
203
8,89
410
,208
11,2
87
P
araí
ba
25,6
9728
,719
31,9
4735
,444
0.8
0.9
6,86
67,
618
8,48
19,
349
P
erna
mb
uco
70,4
4178
,428
95,1
8710
4,39
42.
32.
58,
065
8,90
210
,822
11,7
76
A
lag
oas
19,4
7721
,235
24,5
7528
,540
0.6
0.7
6,22
76,
728
7,87
49,
079
S
erg
ipe
19,5
5219
,767
23,9
3226
,199
0.6
0.6
9,77
99,
787
11,5
7212
,536
B
ahia
121,
507
137,
075
154,
340
159,
869
4.0
3.9
8,37
89,
365
11,0
0711
,340
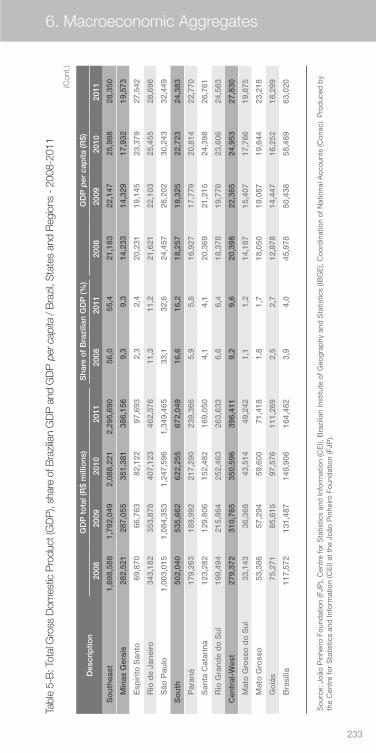
233
6. Macroeconomic Aggregates
Tabl
e 5-
B: T
otal
Gro
ss D
omes
tic P
rodu
ct (G
DP
), sh
are
of B
razi
lian
GD
P a
nd G
DP
per
cap
ita /
Bra
zil,
Sta
tes
and
Reg
ions
- 2
008-
2011
Des
crip
tion
GD
P t
ota
l (R
$ m
illio
ns)
Sha
re o
f B
razi
lian
GD
P (%
)G
DP
per
cap
ita (R
$)
2008
2009
2010
2011
2008
2011
2008
2009
2010
2011
S
out
heas
t1,
698,
588
1,79
2,04
92,
088,
221
2,29
5,69
056
,055
,421
,183
22,1
4725
,988
28,3
50
Min
as G
erai
s28
2,52
128
7,05
535
1,38
138
6,15
69,
39,
314
,233
14,3
2917
,932
19,5
73
Esp
írito
San
to69
,870
66,7
6382
,122
97,6
932,
32,
420
,231
19,1
4523
,379
27,5
42
Rio
de
Jane
iro34
3,18
235
3,87
840
7,12
346
2,37
611
,311
,221
,621
22,1
0325
,455
28,6
96
São
Pau
lo1,
003,
015
1,08
4,35
31,
247,
596
1,34
9,46
533
,132
,624
,457
26,2
0230
,243
32,4
49
S
out
h50
2,04
053
5,66
262
2,25
567
2,04
916
,616
,218
,257
19,3
2522
,723
24,3
83
Par
aná
179,
263
189,
992
217,
290
239,
366
5,9
5,8
16,9
2717
,779
20,8
1422
,770
San
ta C
atar
ina
123,
282
129,
806
152,
482
169,
050
4,1
4,1
20,3
6921
,215
24,3
9826
,761
Rio
Gra
nde
do
Sul
199,
494
215,
864
252,
483
263,
633
6,6
6,4
18,3
7819
,778
23,6
0624
,563
C
entr
al-W
est
279,
372
310,
765
350,
596
396,
411
9,2
9,6
20,3
9822
,365
24,9
5327
,830
Mat
o G
ross
o d
o S
ul33
,143
36,3
6843
,514
49,2
421,
11,
214
,187
15,4
0717
,766
19,8
75
Mat
o G
ross
o53
,386
57,2
9459
,600
71,4
181,
81,
718
,050
19,0
8719
,644
23,2
18
Go
iás
75,2
7185
,615
97,5
7611
1,26
92,
52,
712
,878
14,4
4716
,252
18,2
99
Bra
sília
117,
572
131,
487
149,
906
164,
482
3,9
4,0
45,9
7850
,438
58,4
8963
,020
Sou
rce:
Joã
o P
inhe
iro F
ound
atio
n (F
JP),
Cen
tre
for
Sta
tistic
s an
d In
form
atio
n (C
EI),
Bra
zilia
n In
stitu
te o
f Geo
grap
hy a
nd S
tatis
tics
(IBG
E),
Coo
rdin
atio
n of
Nat
iona
l Acc
ount
s (C
onac
). P
rod
uced
by
the
Cen
tre
for
Sta
tistic
s an
d In
form
atio
n (C
EI)
at t
he J
oão
Pin
heiro
Fou
ndat
ion
(FJP
).
(Con
t.)
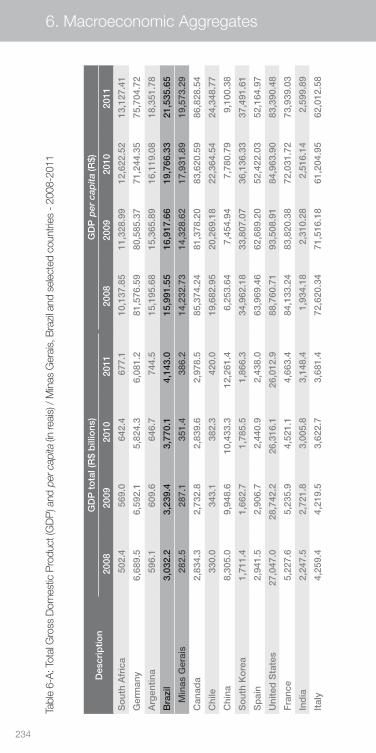
234
6. Macroeconomic Aggregates
Tabl
e 6-
A: T
otal
Gro
ss D
omes
tic P
rodu
ct (G
DP
) and
per
cap
ita (i
n re
ais)
/ M
inas
Ger
ais,
Bra
zil a
nd s
elec
ted
coun
tries
- 2
008-
2011
Des
crip
tion
GD
P t
ota
l (R
$ b
illio
ns)
GD
P p
er c
apita
(R$)
2008
2009
2010
2011
2008
2009
2010
2011
So
uth
Afr
ica
502.
456
9.0
642.
467
7.1
10,1
37.8
511
,328
.99
12,6
22.5
213
,127
.41
Ger
man
y6,
689.
56,
592.
15,
824.
36,
081.
281
,576
.59
80,5
85.3
771
,244
.35
75,7
04.7
2
Arg
entin
a 59
6.1
609.
664
6.7
744.
515
,195
.68
15,3
65.8
916
,119
.08
18,3
51.7
8
Bra
zil
3,03
2.2
3,23
9.4
3,77
0.1
4,14
3.0
15,9
91.5
516
,917
.66
19,7
66.3
321
,535
.65
M
inas
Ger
ais
282.
528
7.1
351.
438
6.2
14,2
32.7
314
,328
.62
17,9
31.8
919
,573
.29
Can
ada
2,83
4.3
2,73
2.8
2,83
9.6
2,97
8.5
85,3
74.2
481
,378
.20
83,6
20.5
986
,828
.54
Chi
le
330.
034
3.1
382.
342
0.0
19,6
82.9
520
,269
.18
22,3
64.5
424
,348
.77
Chi
na8,
305.
09,
948.
610
,433
.312
,261
.46,
253.
647,
454.
947,
780.
799,
100.
38
So
uth
Ko
rea
1,71
1.4
1,66
2.7
1,78
5.5
1,86
6.3
34,9
62.1
833
,807
.07
36,1
36.3
337
,491
.61
Sp
ain
2,94
1.5
2,90
6.7
2,44
0.9
2,43
8.0
63,9
69.4
662
,689
.20
52,4
22.0
352
,164
.97
Uni
ted
Sta
tes
27,0
47.0
28,7
42.2
26,3
16.1
26,0
12.9
88,7
60.7
193
,508
.91
84,9
63.9
083
,390
.48
Fra
nce
5,22
7.6
5,23
5.9
4,52
1.1
4,66
3.4
84,1
33.2
483
,820
.38
72,0
31.7
273
,939
.03
Ind
ia2,
247.
52,
721.
83,
005.
83,
148.
41,
934.
182,
310.
282,
516.
142,
599.
89
Ital
y4,
259.
44,
219.
53,
622.
73,
681.
472
,620
.34
71,5
16.1
861
,204
.95
62,0
12.5
8
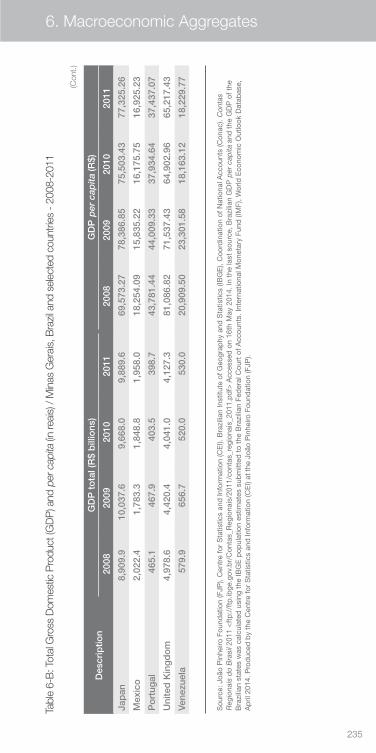
235
6. Macroeconomic Aggregates
Tabl
e 6-
B: T
otal
Gro
ss D
omes
tic P
rodu
ct (G
DP
) and
per
cap
ita (i
n re
ais)
/ M
inas
Ger
ais,
Bra
zil a
nd s
elec
ted
coun
tries
- 2
008-
2011
Des
crip
tion
GD
P t
ota
l (R
$ b
illio
ns)
GD
P p
er c
apita
(R$)
2008
2009
2010
2011
2008
2009
2010
2011
Jap
an8,
909.
910
,037
.69,
668.
09,
889.
669
,573
.27
78,3
86.8
575
,503
.43
77,3
25.2
6
Mex
ico
2,02
2.4
1,78
3.3
1,84
8.8
1,95
8.0
18,2
54.0
915
,835
.22
16,1
75.7
516
,925
.23
Po
rtug
al46
5.1
467.
940
3.5
398.
743
,781
.44
44,0
09.3
337
,934
.64
37,4
37.0
7
Uni
ted
Kin
gd
om
4,97
8.6
4,42
0.4
4,04
1.0
4,12
7.3
81,0
86.8
271
,537
.43
64,9
02.9
665
,217
.43
Vene
zuel
a57
9.9
656.
752
0.0
530.
020
,909
.50
23,3
01.5
818
,163
.12
18,2
29.7
7
Sou
rce:
Joã
o P
inhe
iro F
ound
atio
n (F
JP),
Cen
tre
for
Sta
tistic
s an
d In
form
atio
n (C
EI).
Bra
zilia
n In
stitu
te o
f Geo
grap
hy a
nd S
tatis
tics
(IBG
E),
Coo
rdin
atio
n of
Nat
iona
l Acc
ount
s (C
onac
). C
onta
s R
egio
nais
do
Bra
sil 2
011
<ft
p:/
/ftp
.ibge
.gov
.br/
Con
tas_
Reg
iona
is/2
011/
cont
as_r
egio
nais
_201
1.p
df>
Acc
esse
d o
n 16
th M
ay 2
014.
In t
he la
st s
ourc
e, B
razi
lian
GD
P p
er c
apita
and
the
GD
P o
f the
B
razi
lian
stat
es w
as c
alcu
late
d u
sing
the
IBG
E p
opul
atio
n es
timat
es s
ubm
itted
to
the
Bra
zilia
n Fe
der
al C
ourt
of A
ccou
nts.
Inte
rnat
iona
l Mon
etar
y Fu
nd (I
MF)
, Wor
ld E
cono
mic
Out
look
Dat
abas
e,
Ap
ril 2
014.
Pro
duc
ed b
y th
e C
entr
e fo
r S
tatis
tics
and
Info
rmat
ion
(CE
I) at
the
Joã
o P
inhe
iro F
ound
atio
n (F
JP).
(Con
t.)
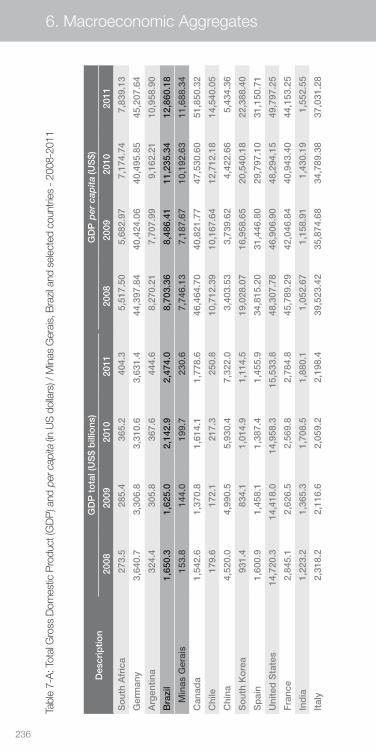
236
6. Macroeconomic Aggregates
Tabl
e 7-
A: T
otal
Gro
ss D
omes
tic P
rodu
ct (G
DP
) and
per
cap
ita (i
n U
S d
olla
rs) /
Min
as G
erai
s, B
razi
l and
sel
ecte
d co
untri
es -
200
8-20
11
Des
crip
tion
GD
P t
ota
l (U
S$
bill
ions
)G
DP
per
cap
ita (U
S$)
2008
2009
2010
2011
2008
2009
2010
2011
So
uth
Afr
ica
273.
528
5.4
365.
240
4.3
5,51
7.50
5,68
2.97
7,17
4.74
7,83
9.13
Ger
man
y3,
640.
73,
306.
83,
310.
63,
631.
444
,397
.84
40,4
24.0
640
,495
.85
45,2
07.6
4
Arg
entin
a 32
4.4
305.
836
7.6
444.
68,
270.
217,
707.
999,
162.
2110
,958
.90
Bra
zil
1,65
0.3
1,62
5.0
2,14
2.9
2,47
4.0
8,70
3.36
8,48
6.41
11,2
35.3
412
,860
.18
M
inas
Ger
ais
153.
814
4.0
199.
723
0.6
7,74
6.13
7,18
7.67
10,1
92.6
311
,688
.34
Can
ada
1,54
2.6
1,37
0.8
1,61
4.1
1,77
8.6
46,4
64.7
040
,821
.77
47,5
30.6
051
,850
.32
Chi
le
179.
617
2.1
217.
325
0.8
10,7
12.3
910
,167
.64
12,7
12.1
814
,540
.05
Chi
na4,
520.
04,
990.
55,
930.
47,
322.
03,
403.
533,
739.
624,
422.
665,
434.
36
So
uth
Ko
rea
931.
483
4.1
1,01
4.9
1,11
4.5
19,0
28.0
716
,958
.65
20,5
40.1
822
,388
.40
Sp
ain
1,60
0.9
1,45
8.1
1,38
7.4
1,45
5.9
34,8
15.2
031
,446
.80
29,7
97.1
031
,150
.71
Uni
ted
Sta
tes
14,7
20.3
14,4
18.0
14,9
58.3
15,5
33.8
48,3
07.7
846
,906
.90
48,2
94.1
549
,797
.25
Fra
nce
2,84
5.1
2,62
6.5
2,56
9.8
2,78
4.8
45,7
89.2
942
,046
.84
40,9
43.4
044
,153
.25
Ind
ia1,
223.
21,
365.
31,
708.
51,
880.
11,
052.
671,
158.
911,
430.
191,
552.
55
Ital
y2,
318.
22,
116.
62,
059.
22,
198.
439
,523
.42
35,8
74.6
834
,789
.38
37,0
31.2
8
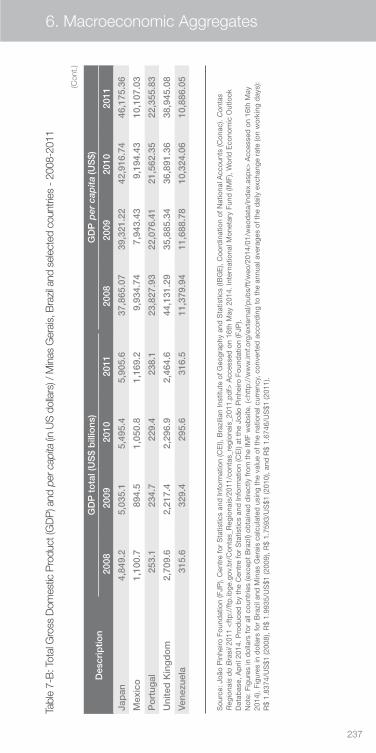
237
6. Macroeconomic Aggregates
Tabl
e 7-
B: T
otal
Gro
ss D
omes
tic P
rodu
ct (G
DP
) and
per
cap
ita (i
n U
S d
olla
rs) /
Min
as G
erai
s, B
razi
l and
sel
ecte
d co
untri
es -
200
8-20
11
Des
crip
tion
GD
P t
ota
l (U
S$
bill
ions
)G
DP
per
cap
ita (U
S$)
2008
2009
2010
2011
2008
2009
2010
2011
Jap
an4,
849.
25,
035.
15,
495.
45,
905.
637
,865
.07
39,3
21.2
242
,916
.74
46,1
75.3
6
Mex
ico
1,10
0.7
894.
51,
050.
81,
169.
29,
934.
747,
943.
439,
194.
4310
,107
.03
Po
rtug
al25
3.1
234.
722
9.4
238.
123
,827
.93
22,0
76.4
121
,562
.35
22,3
55.8
3
Uni
ted
Kin
gd
om
2,70
9.6
2,21
7.4
2,29
6.9
2,46
4.6
44,1
31.2
935
,885
.34
36,8
91.3
638
,945
.08
Vene
zuel
a31
5.6
329.
429
5.6
316.
511
,379
.94
11,6
88.7
810
,324
.06
10,8
86.0
5
Sou
rce:
Joã
o P
inhe
iro F
ound
atio
n (F
JP),
Cen
tre
for
Sta
tistic
s an
d In
form
atio
n (C
EI),
Bra
zilia
n In
stitu
te o
f Geo
grap
hy a
nd S
tatis
tics
(IBG
E),
Coo
rdin
atio
n of
Nat
iona
l Acc
ount
s (C
onac
). C
onta
s R
egio
nais
do
Bra
sil 2
011
<ft
p:/
/ftp
.ibge
.gov
.br/
Con
tas_
Reg
iona
is/2
011/
cont
as_r
egio
nais
_201
1.p
df>
Acc
esse
d o
n 16
th M
ay 2
014.
Inte
rnat
iona
l Mon
etar
y Fu
nd (I
MF)
, Wor
ld E
cono
mic
Out
look
D
atab
ase,
Ap
ril 2
014.
Pro
duc
ed b
y th
e C
entr
e fo
r S
tatis
tics
and
Info
rmat
ion
(CE
I) at
the
Joã
o P
inhe
iro F
ound
atio
n (F
JP).
Not
e: F
igur
es in
dol
lars
for
all c
ount
ries
(exc
ept
Bra
zil)
obta
ined
dire
ctly
from
the
IMF
web
site
. (<
http
://w
ww
.imf.o
rg/e
xter
nal/p
ubs/
ft/w
eo/2
014/
01/w
eod
ata/
ind
ex.a
spx>
Acc
esse
d o
n 16
th M
ay
2014
). Fi
gure
s in
dol
lars
for
Bra
zil a
nd M
inas
Ger
ais
calc
ulat
ed u
sing
the
val
ue o
f the
nat
iona
l cur
renc
y, c
onve
rted
acc
ord
ing
to t
he a
nnua
l ave
rage
s of
the
dai
ly e
xcha
nge
rate
(on
wor
king
day
s):
R$
1.83
74/U
S$1
(200
8), R
$ 1.
9935
/US
$1 (2
009)
, R$
1.75
93/U
S$1
(201
0), a
nd R
$ 1.
6746
/US
$1 (2
011)
.
(Con
t.)
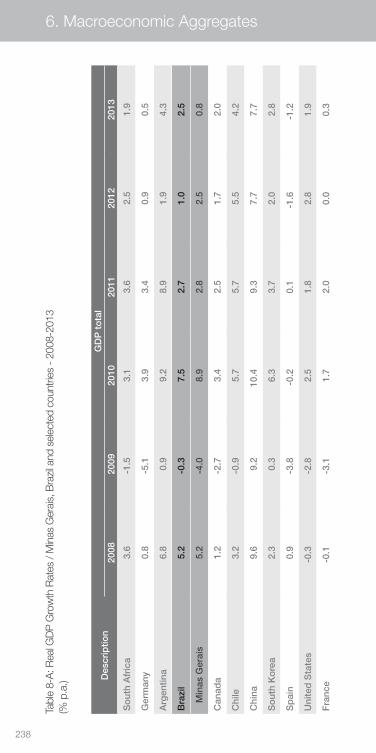
238
6. Macroeconomic Aggregates
Tabl
e 8-
A: R
eal G
DP
Gro
wth
Rat
es /
Min
as G
erai
s, B
razi
l and
sel
ecte
d co
untri
es -
200
8-20
13
(% p
.a.) D
escr
iptio
nG
DP
to
tal
2008
2009
2010
2011
2012
2013
So
uth
Afr
ica
3.6
-1.5
3.1
3.6
2.5
1.9
Ger
man
y0.
8-5
.13.
93.
40.
90.
5
Arg
entin
a 6.
80.
99.
28.
91.
94.
3
Bra
zil
5.2
-0.3
7.5
2.7
1.0
2.5
M
inas
Ger
ais
5.2
-4.0
8.9
2.8
2.5
0.8
Can
ada
1.2
-2.7
3.4
2.5
1.7
2.0
Chi
le
3.2
-0.9
5.7
5.7
5.5
4.2
Chi
na9.
69.
210
.49.
37.
77.
7
So
uth
Ko
rea
2.3
0.3
6.3
3.7
2.0
2.8
Sp
ain
0.9
-3.8
-0.2
0.1
-1.6
-1.2
Uni
ted
Sta
tes
-0.3
-2.8
2.5
1.8
2.8
1.9
Fra
nce
-0.1
-3.1
1.7
2.0
0.0
0.3
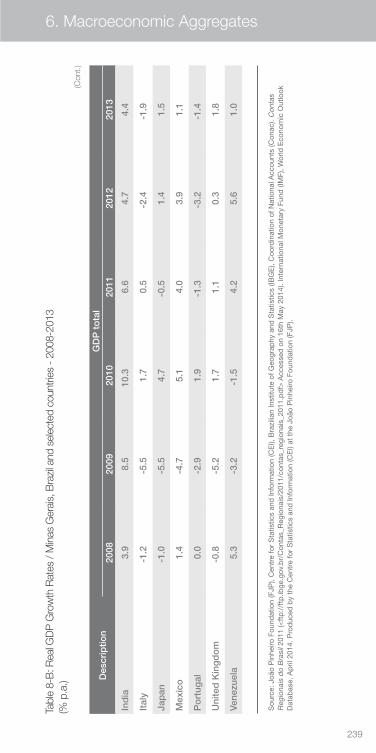
239
6. Macroeconomic Aggregates
Tabl
e 8-
B: R
eal G
DP
Gro
wth
Rat
es /
Min
as G
erai
s, B
razi
l and
sel
ecte
d co
untri
es -
200
8-20
13
(% p
.a.)D
escr
iptio
nG
DP
to
tal
2008
2009
2010
2011
2012
2013
So
uth
Afr
ica
3.6
-1.5
3.1
3.6
2.5
1.9
Ger
man
y0.
8-5
.13.
93.
40.
90.
5
Arg
entin
a 6.
80.
99.
28.
91.
94.
3
Bra
zil
5.2
-0.3
7.5
2.7
1.0
2.5
M
inas
Ger
ais
5.2
-4.0
8.9
2.8
2.5
0.8
Can
ada
1.2
-2.7
3.4
2.5
1.7
2.0
Chi
le
3.2
-0.9
5.7
5.7
5.5
4.2
Chi
na9.
69.
210
.49.
37.
77.
7
So
uth
Ko
rea
2.3
0.3
6.3
3.7
2.0
2.8
Sp
ain
0.9
-3.8
-0.2
0.1
-1.6
-1.2
Uni
ted
Sta
tes
-0.3
-2.8
2.5
1.8
2.8
1.9
Fra
nce
-0.1
-3.1
1.7
2.0
0.0
0.3
Des
crip
tion
GD
P t
ota
l20
0820
0920
1020
1120
1220
13
Ind
ia3.
98.
510
.36.
64.
74.
4
Ital
y-1
.2-5
.51.
70.
5-2
.4-1
.9
Jap
an-1
.0-5
.54.
7-0
.51.
41.
5
Mex
ico
1.4
-4.7
5.1
4.0
3.9
1.1
Po
rtug
al0.
0-2
.91.
9-1
.3-3
.2-1
.4
Uni
ted
Kin
gd
om
-0.8
-5.2
1.7
1.1
0.3
1.8
Vene
zuel
a5.
3-3
.2-1
.54.
25.
61.
0
Sou
rce:
Joã
o P
inhe
iro F
ound
atio
n (F
JP),
Cen
tre
for
Sta
tistic
s an
d In
form
atio
n (C
EI),
Bra
zilia
n In
stitu
te o
f Geo
grap
hy a
nd S
tatis
tics
(IBG
E),
Coo
rdin
atio
n of
Nat
iona
l Acc
ount
s (C
onac
). C
onta
s R
egio
nais
do
Bra
sil 2
011
(<ft
p:/
/ftp
.ibge
.gov
.br/
Con
tas_
Reg
iona
is/2
011/
cont
as_r
egio
nais
_201
1.p
df>
Acc
esse
d o
n 16
th M
ay 2
014)
. Int
erna
tiona
l Mon
etar
y Fu
nd (I
MF)
, Wor
ld E
cono
mic
Out
look
D
atab
ase,
Ap
ril 2
014.
Pro
duc
ed b
y th
e C
entr
e fo
r S
tatis
tics
and
Info
rmat
ion
(CE
I) at
the
Joã
o P
inhe
iro F
ound
atio
n (F
JP).
(Con
t.)
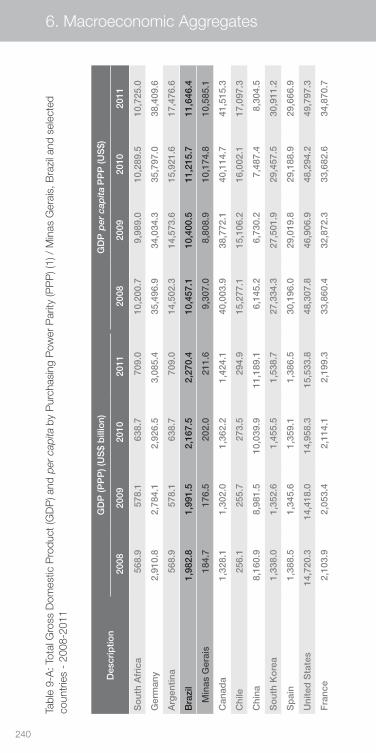
240
6. Macroeconomic Aggregates
Tabl
e 9-
A: T
otal
Gro
ss D
omes
tic P
rodu
ct (G
DP
) and
per
cap
ita b
y P
urch
asin
g P
ower
Par
ity (P
PP
) (1)
/ M
inas
Ger
ais,
Bra
zil a
nd s
elec
ted
coun
trie
s -
2008
-201
1
Des
crip
tion
GD
P (P
PP
) (U
S$
bill
ion)
GD
P p
er c
apita
PP
P (U
S$)
2008
2009
2010
2011
2008
2009
2010
2011
So
uth
Afr
ica
568.
957
8.1
638.
770
9.0
10,2
00.7
9,98
9.0
10,2
89.5
10,7
25.0
Ger
man
y2,
910.
82,
784.
12,
926.
53,
085.
435
,496
.934
,034
.335
,797
.038
,409
.6
Arg
entin
a 56
8.9
578.
163
8.7
709.
014
,502
.314
,573
.615
,921
.617
,476
.6
Bra
zil
1,98
2.8
1,99
1.5
2,16
7.5
2,27
0.4
10,4
57.1
10,4
00.5
11,2
15.7
11,6
46.4
M
inas
Ger
ais
184.
717
6.5
202.
021
1.6
9,30
7.0
8,80
8.9
10,1
74.8
10,5
85.1
Can
ada
1,32
8.1
1,30
2.0
1,36
2.2
1,42
4.1
40,0
03.9
38,7
72.1
40,1
14.7
41,5
15.3
Chi
le
256.
125
5.7
273.
529
4.9
15,2
77.1
15,1
06.2
16,0
02.1
17,0
97.3
Chi
na8,
160.
98,
981.
510
,039
.911
,189
.16,
145.
26,
730.
27,
487.
48,
304.
5
So
uth
Ko
rea
1,33
8.0
1,35
2.6
1,45
5.5
1,53
8.7
27,3
34.3
27,5
01.9
29,4
57.5
30,9
11.2
Sp
ain
1,38
8.5
1,34
5.6
1,35
9.1
1,38
6.5
30,1
96.0
29,0
19.8
29,1
88.9
29,6
66.9
Uni
ted
Sta
tes
14,7
20.3
14,4
18.0
14,9
58.3
15,5
33.8
48,3
07.8
46,9
06.9
48,2
94.2
49,7
97.3
Fra
nce
2,10
3.9
2,05
3.4
2,11
4.1
2,19
9.3
33,8
60.4
32,8
72.3
33,6
82.6
34,8
70.7
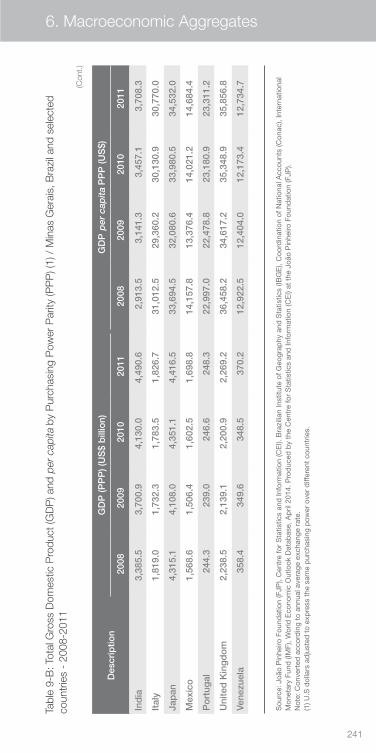
241
6. Macroeconomic Aggregates
Tabl
e 9-
B: T
otal
Gro
ss D
omes
tic P
rodu
ct (G
DP
) and
per
cap
ita b
y P
urch
asin
g P
ower
Par
ity (P
PP
) (1)
/ M
inas
Ger
ais,
Bra
zil a
nd s
elec
ted
coun
trie
s -
2008
-201
1
Des
crip
tion
GD
P (P
PP
) (U
S$
bill
ion)
GD
P p
er c
apita
PP
P (U
S$)
2008
2009
2010
2011
2008
2009
2010
2011
Ind
ia3,
385.
53,
700.
94,
130.
04,
490.
62,
913.
53,
141.
33,
457.
13,
708.
3
Ital
y1,
819.
01,
732.
31,
783.
51,
826.
731
,012
.529
,360
.230
,130
.930
,770
.0
Jap
an4,
315.
14,
108.
04,
351.
14,
416.
533
,694
.532
,080
.633
,980
.534
,532
.0
Mex
ico
1,56
8.6
1,50
6.4
1,60
2.5
1,69
8.8
14,1
57.8
13,3
76.4
14,0
21.2
14,6
84.4
Po
rtug
al24
4.3
239.
024
6.6
248.
322
,997
.022
,478
.823
,180
.923
,311
.2
Uni
ted
Kin
gd
om
2,23
8.5
2,13
9.1
2,20
0.9
2,26
9.2
36,4
58.2
34,6
17.2
35,3
48.9
35,8
56.8
Vene
zuel
a35
8.4
349.
634
8.5
370.
212
,922
.512
,404
.012
,173
.412
,734
.7
Sou
rce:
Joã
o P
inhe
iro F
ound
atio
n (F
JP),
Cen
tre
for
Sta
tistic
s an
d In
form
atio
n (C
EI).
Bra
zilia
n In
stitu
te o
f Geo
grap
hy a
nd S
tatis
tics
(IBG
E),
Coo
rdin
atio
n of
Nat
iona
l Acc
ount
s (C
onac
), In
tern
atio
nal
Mon
etar
y Fu
nd (I
MF)
, Wor
ld E
cono
mic
Out
look
Dat
abas
e, A
pril
201
4. P
rod
uced
by
the
Cen
tre
for
Sta
tistic
s an
d In
form
atio
n (C
EI)
at t
he J
oão
Pin
heiro
Fou
ndat
ion
(FJP
). N
ote:
Con
vert
ed a
ccor
din
g to
ann
ual a
vera
ge e
xcha
nge
rate
. (1
) U.S
dol
lars
ad
just
ed t
o ex
pre
ss t
he s
ame
pur
chas
ing
pow
er o
ver
diff
eren
t co
untr
ies.
(Con
t.)
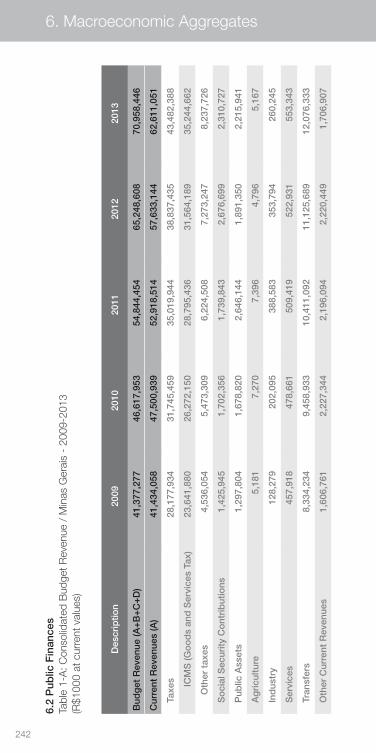
242
6. Macroeconomic Aggregates
6.2
Pub
lic F
inan
ces
Tabl
e 1-
A: C
onso
lidat
ed B
udge
t Rev
enue
/ M
inas
Ger
ais
- 20
09-2
013
(R$1
000
at c
urre
nt v
alue
s)
Des
crip
tion
2009
2010
2011
2012
2013
Bud
get
Rev
enue
(A+
B+
C+
D)
41,3
77,2
7746
,617
,953
54,8
44,4
5465
,248
,608
70,9
58,4
46
Cur
rent
Rev
enue
s (A
)41
,434
,058
47,5
00,9
3952
,918
,514
57,6
33,1
4462
,611
,051
Ta
xes
28,1
77,9
3431
,745
,459
35,0
19,9
4438
,837
,435
43,4
82,3
88
IC
MS
(Go
od
s an
d S
ervi
ces
Tax)
23,6
41,8
8026
,272
,150
28,7
95,4
3631
,564
,189
35,2
44,6
62
Oth
er t
axes
4,53
6,05
45,
473,
309
6,22
4,50
87,
273,
247
8,23
7,72
6
S
oci
al S
ecur
ity C
ont
rib
utio
ns1,
425,
945
1,70
2,35
61,
739,
843
2,67
6,69
92,
310,
727
P
ublic
Ass
ets
1,29
7,80
41,
678,
820
2,64
6,14
41,
891,
350
2,21
5,94
1
A
gri
cultu
re5,
181
7,27
07,
396
4,79
65,
167
In
dus
try
128,
279
202,
095
388,
583
353,
794
260,
245
S
ervi
ces
457,
918
478,
661
509,
419
522,
931
553,
343
Tr
ansf
ers
8,33
4,23
49,
458,
933
10,4
11,0
9211
,125
,689
12,0
76,3
33
O
ther
Cur
rent
Rev
enue
s1,
606,
761
2,22
7,34
42,
196,
094
2,22
0,44
91,
706,
907
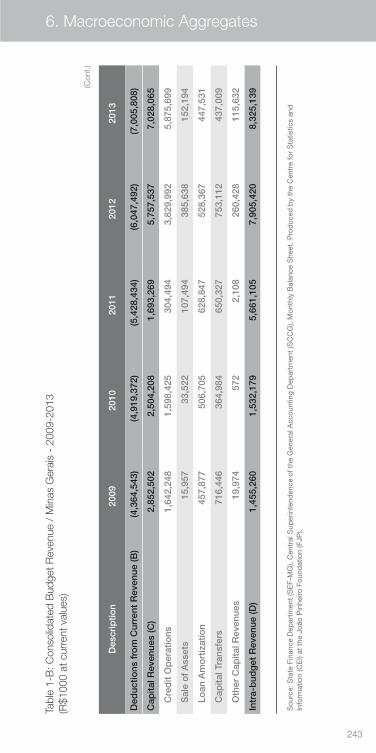
243
6. Macroeconomic Aggregates
Tabl
e 1-
B: C
onso
lidat
ed B
udge
t Rev
enue
/ M
inas
Ger
ais
- 20
09-2
013
(R$1
000
at c
urre
nt v
alue
s)
Des
crip
tion
2009
2010
2011
2012
2013
Ded
uctio
ns f
rom
Cur
rent
Rev
enue
(B)
(4,3
64,5
43)
(4,9
19,3
72)
(5,4
28,4
34)
(6,0
47,4
92)
(7,0
05,8
08)
Cap
ital R
even
ues
(C)
2,85
2,50
22,
504,
208
1,69
3,26
95,
757,
537
7,02
8,06
5
C
red
it O
per
atio
ns1,
642,
248
1,59
8,42
530
4,49
43,
829,
992
5,87
5,69
9
S
ale
of
Ass
ets
15,9
5733
,522
107,
494
385,
638
152,
194
Lo
an A
mo
rtiz
atio
n45
7,87
750
6,70
562
8,84
752
8,36
744
7,53
1
C
apita
l Tra
nsfe
rs71
6,44
636
4,98
465
0,32
775
3,11
243
7,00
9
O
ther
Cap
ital R
even
ues
19,9
7457
22,
108
260,
428
115,
632
Intr
a-b
udg
et R
even
ue (D
)1,
455,
260
1,53
2,17
95,
661,
105
7,90
5,42
08,
325,
139
Sou
rce:
Sta
te F
inan
ce D
epar
tmen
t (S
EF-
MG
), C
entr
al S
uper
inte
nden
ce o
f the
Gen
eral
Acc
ount
ing
Dep
artm
ent
(SC
CG
), M
onth
ly B
alan
ce S
heet
. Pro
duc
ed b
y th
e C
entr
e fo
r S
tatis
tics
and
In
form
atio
n (C
EI)
at t
he J
oão
Pin
heiro
Fou
ndat
ion
(FJP
).
(Con
t.)
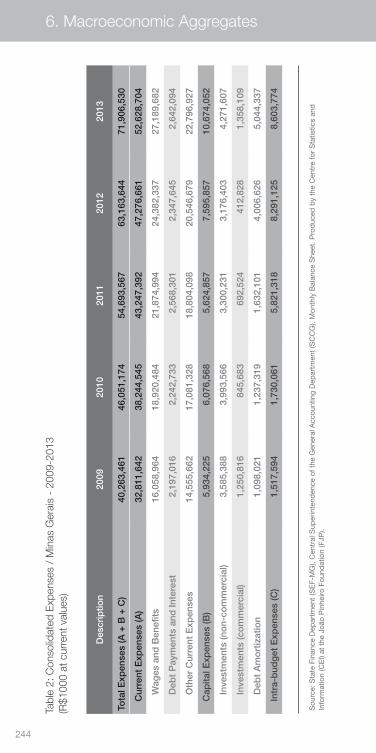
244
6. Macroeconomic Aggregates
Tabl
e 2:
Con
solid
ated
Exp
ense
s /
Min
as G
erai
s -
2009
-201
3 (R
$100
0 at
cur
rent
val
ues)
Des
crip
tion
2009
2010
2011
2012
2013
Tota
l Exp
ense
s (A
+ B
+ C
)40
,263
,461
46,0
51,1
7454
,693
,567
63,1
63,6
4471
,906
,530
C
urre
nt E
xpen
ses
(A)
32,8
11,6
4238
,244
,545
43,2
47,3
9247
,276
,661
52,6
28,7
04
Wag
es a
nd B
enef
its16
,058
,964
18,9
20,4
8421
,874
,994
24,3
82,3
3727
,189
,682
Deb
t P
aym
ents
and
Inte
rest
2,19
7,01
62,
242,
733
2,56
8,30
12,
347,
645
2,64
2,09
4
Oth
er C
urre
nt E
xpen
ses
14,5
55,6
6217
,081
,328
18,8
04,0
9820
,546
,679
22,7
96,9
27
C
apita
l Exp
ense
s (B
)5,
934,
225
6,07
6,56
85,
624,
857
7,59
5,85
710
,674
,052
Inve
stm
ents
(no
n-co
mm
erci
al)
3,58
5,38
83,
993,
566
3,30
0,23
13,
176,
403
4,27
1,60
7
Inve
stm
ents
(co
mm
erci
al)
1,25
0,81
684
5,68
369
2,52
441
2,82
81,
358,
109
Deb
t A
mo
rtiz
atio
n1,
098,
021
1,23
7,31
91,
632,
101
4,00
6,62
65,
044,
337
In
tra-
bud
get
Exp
ense
s (C
)1,
517,
594
1,73
0,06
15,
821,
318
8,29
1,12
58,
603,
774
Sou
rce:
Sta
te F
inan
ce D
epar
tmen
t (S
EF-
MG
), C
entr
al S
uper
inte
nden
ce o
f the
Gen
eral
Acc
ount
ing
Dep
artm
ent
(SC
CG
), M
onth
ly B
alan
ce S
heet
. Pro
duc
ed b
y th
e C
entr
e fo
r S
tatis
tics
and
In
form
atio
n (C
EI)
at t
he J
oão
Pin
heiro
Fou
ndat
ion
(FJP
).
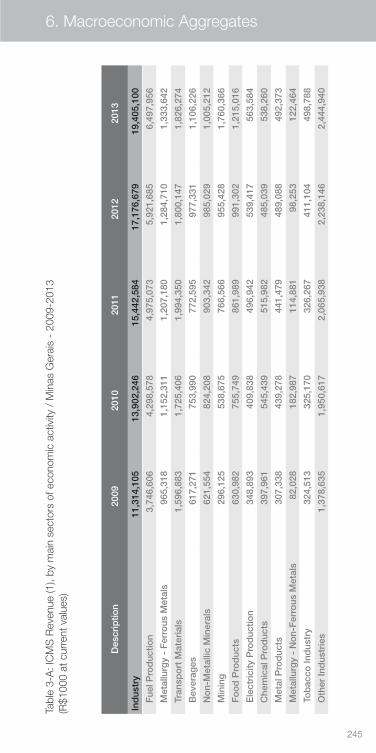
245
6. Macroeconomic Aggregates
Tabl
e 3-
A: I
CM
S R
even
ue (1
), by
mai
n se
ctor
s of
eco
nom
ic a
ctiv
ity /
Min
as G
erai
s -
2009
-201
3 (R
$100
0 at
cur
rent
val
ues)
Des
crip
tion
2009
2010
2011
2012
2013
Ind
ustr
y11
,314
,105
13,9
02,2
4615
,442
,584
17,1
76,6
7919
,405
,100
F
uel P
rod
uctio
n3,
746,
606
4,29
8,57
84,
975,
073
5,92
1,68
56,
497,
956
M
etal
lurg
y -
Fer
rous
Met
als
965,
318
1,15
2,31
11,
207,
180
1,28
4,71
01,
333,
642
Tr
ansp
ort
Mat
eria
ls1,
596,
883
1,72
5,40
61,
994,
350
1,80
0,14
71,
826,
274
B
ever
ages
617,
271
753,
990
772,
595
977,
331
1,10
6,22
6
N
on-
Met
allic
Min
eral
s 62
1,55
482
4,20
890
3,34
298
5,02
91,
005,
212
M
inin
g29
6,12
553
8,67
576
6,56
695
5,42
81,
760,
366
F
oo
d P
rod
ucts
630,
982
755,
749
861,
989
991,
302
1,21
5,01
6
E
lect
rici
ty P
rod
uctio
n34
8,89
340
9,83
849
6,94
253
9,41
756
3,58
4
C
hem
ical
Pro
duc
ts39
7,96
154
5,43
951
5,98
248
5,03
953
8,26
0
M
etal
Pro
duc
ts30
7,33
843
9,27
844
1,47
948
9,08
849
2,37
3
M
etal
lurg
y -
No
n-F
erro
us M
etal
s82
,028
182,
987
114,
881
98,2
5312
2,46
4
To
bac
co In
dus
try
324,
513
325,
170
326,
267
411,
104
498,
788
O
ther
Ind
ustr
ies
1,37
8,63
51,
950,
617
2,06
5,93
82,
238,
146
2,44
4,94
0
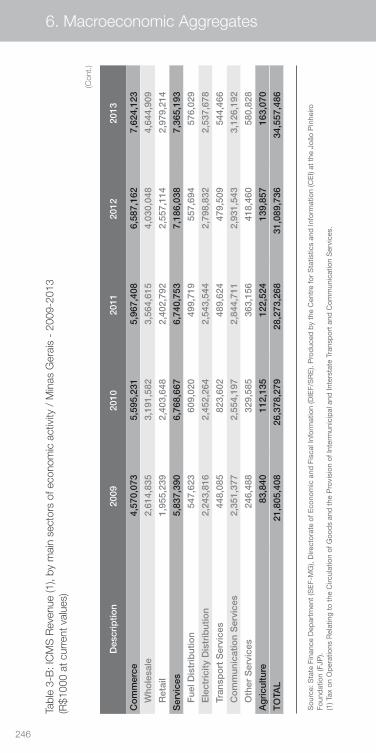
246
6. Macroeconomic Aggregates
Tabl
e 3-
B: I
CM
S R
even
ue (1
), by
mai
n se
ctor
s of
eco
nom
ic a
ctiv
ity /
Min
as G
erai
s -
2009
-201
3 (R
$100
0 at
cur
rent
val
ues)
Des
crip
tion
2009
2010
2011
2012
2013
Co
mm
erce
4,57
0,07
35,
595,
231
5,96
7,40
86,
587,
162
7,62
4,12
3
W
hole
sale
2,61
4,83
53,
191,
582
3,56
4,61
54,
030,
048
4,64
4,90
9
R
etai
l1,
955,
239
2,40
3,64
82,
402,
792
2,55
7,11
42,
979,
214
Ser
vice
s5,
837,
390
6,76
8,66
76,
740,
753
7,18
6,03
87,
365,
193
F
uel D
istr
ibut
ion
547,
623
609,
020
499,
719
557,
694
576,
029
E
lect
rici
ty D
istr
ibut
ion
2,24
3,81
62,
452,
264
2,54
3,54
42,
798,
832
2,53
7,67
8
Tr
ansp
ort
Ser
vice
s44
8,08
582
3,60
248
9,62
447
9,50
954
4,46
6
C
om
mun
icat
ion
Ser
vice
s2,
351,
377
2,55
4,19
72,
844,
711
2,93
1,54
33,
126,
192
O
ther
Ser
vice
s24
6,48
832
9,58
536
3,15
641
8,46
058
0,82
8
Ag
ricu
lture
83,8
4011
2,13
512
2,52
413
9,85
716
3,07
0
TO
TAL
21,8
05,4
0826
,378
,279
28,2
73,2
6831
,089
,736
34,5
57,4
86
(Con
t.)
Sou
rce:
Sta
te F
inan
ce D
epar
tmen
t (S
EF-
MG
), D
irect
orat
e of
Eco
nom
ic a
nd F
isca
l Inf
orm
atio
n (D
IEF/
SR
E).
Pro
duc
ed b
y th
e C
entr
e fo
r S
tatis
tics
and
Info
rmat
ion
(CE
I) at
the
Joã
o P
inhe
iro
Foun
dat
ion
(FJP
). (1
) Tax
on
Op
erat
ions
Rel
atin
g to
the
Circ
ulat
ion
of G
ood
s an
d t
he P
rovi
sion
of I
nter
mun
icip
al a
nd In
ters
tate
Tra
nsp
ort
and
Com
mun
icat
ion
Ser
vice
s.
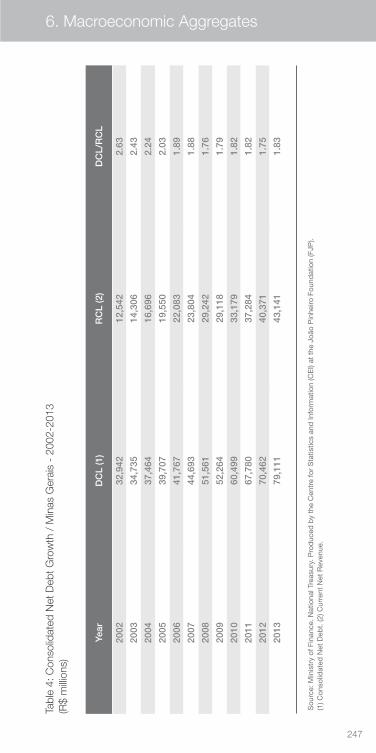
247
6. Macroeconomic Aggregates
Tabl
e 4:
Con
solid
ated
Net
Deb
t Gro
wth
/ M
inas
Ger
ais
- 20
02-2
013
(R$
milli
ons)
Year
DC
L (1
)R
CL
(2)
DC
L/R
CL
2002
32,9
4212
,542
2.63
2003
34,7
3514
,306
2.43
2004
37,4
6416
,696
2.24
2005
39,7
0719
,550
2.03
2006
41,7
6722
,083
1.89
2007
44,6
9323
,804
1.88
2008
51,5
6129
,242
1.76
2009
52,2
6429
,118
1.79
2010
60,4
9933
,179
1.82
2011
67,7
8037
,284
1.82
2012
70,4
6240
,371
1.75
2013
79,1
1143
,141
1.83
Sou
rce:
Min
istr
y of
Fin
ance
. Nat
iona
l Tre
asur
y. P
rod
uced
by
the
Cen
tre
for
Sta
tistic
s an
d In
form
atio
n (C
EI)
at t
he J
oão
Pin
heiro
Fou
ndat
ion
(FJP
). (1
) Con
solid
ated
Net
Deb
t. (2
) Cur
rent
Net
Rev
enue
.
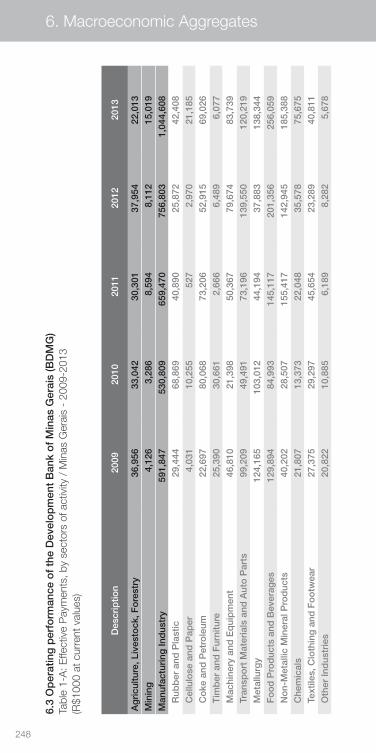
248
6. Macroeconomic Aggregates
6.3
Op
erat
ing
per
form
ance
of
the
Dev
elo
pm
ent
Ban
k o
f M
inas
Ger
ais
(BD
MG
)Ta
ble
1-A
: Effe
ctiv
e P
aym
ents
, by
sect
ors
of a
ctiv
ity /
Min
as G
erai
s -
2009
-201
3 (R
$100
0 at
cur
rent
val
ues)
Des
crip
tion
2009
2010
2011
2012
2013
Ag
ricu
lture
, Liv
esto
ck, F
ore
stry
36,9
5633
,042
30,3
0137
,954
22,0
13M
inin
g4,
126
3,28
68,
594
8,11
215
,019
Man
ufac
turi
ng In
dus
try
591,
847
530,
809
659,
470
756,
803
1,04
4,60
8
Rub
ber
and
Pla
stic
29,4
4468
,869
40,8
9025
,872
42,4
08
Cel
lulo
se a
nd P
aper
4,03
110
,255
527
2,97
021
,185
C
oke
and
Pet
role
um22
,697
80,0
6873
,206
52,9
1569
,026
T
imb
er a
nd F
urni
ture
25,3
9030
,661
2,66
66,
489
6,07
7
Mac
hine
ry a
nd E
qui
pm
ent
46,8
1021
,398
50,3
6779
,674
83,7
39
Tran
spo
rt M
ater
ials
and
Aut
o P
arts
99,2
0949
,491
73,1
9613
9,55
012
0,21
9
Met
allu
rgy
124,
165
103,
012
44,1
9437
,883
138,
344
F
oo
d P
rod
ucts
and
Bev
erag
es12
9,89
484
,993
145,
117
201,
356
256,
059
N
on-
Met
allic
Min
eral
Pro
duc
ts40
,202
28,5
0715
5,41
714
2,94
518
5,38
8
Che
mic
als
21,8
0713
,373
22,0
4835
,578
75,6
75
Text
iles,
Clo
thin
g a
nd F
oo
twea
r27
,375
29,2
9745
,654
23,2
8940
,811
O
ther
Ind
ustr
ies
20,8
2210
,885
6,18
98,
282
5,67
8
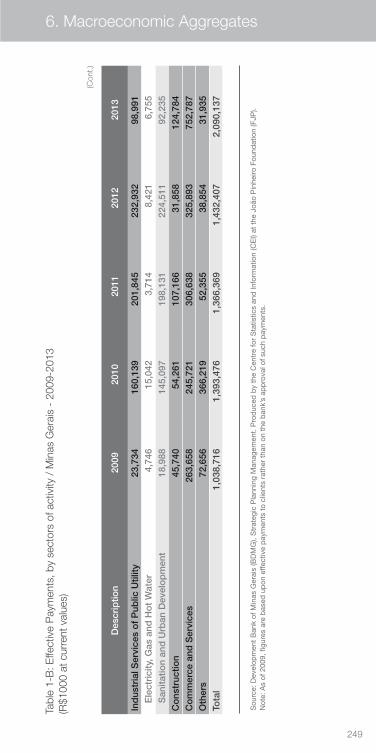
249
6. Macroeconomic Aggregates
Tabl
e 1-
B: E
ffect
ive
Pay
men
ts, b
y se
ctor
s of
act
ivity
/ M
inas
Ger
ais
- 20
09-2
013
(R$1
000
at c
urre
nt v
alue
s)
Des
crip
tion
2009
2010
2011
2012
2013
Ind
ustr
ial S
ervi
ces
of
Pub
lic U
tility
23,7
3416
0,13
920
1,84
523
2,93
298
,991
E
lect
rici
ty, G
as a
nd H
ot
Wat
er4,
746
15,0
423,
714
8,42
16,
755
S
anita
tion
and
Urb
an D
evel
op
men
t18
,988
145,
097
198,
131
224,
511
92,2
35C
ons
truc
tion
45,7
4054
,261
107,
166
31,8
5812
4,78
4C
om
mer
ce a
nd S
ervi
ces
263,
658
245,
721
306,
638
325,
893
752,
787
Oth
ers
72,6
5636
6,21
952
,355
38,8
5431
,935
Tota
l1,
038,
716
1,39
3,47
61,
366,
369
1,43
2,40
72,
090,
137
(Con
t.)
Sou
rce:
Dev
elop
men
t B
ank
of M
inas
Ger
ais
(BD
MG
), S
trat
egic
Pla
nnin
g M
anag
emen
t. P
rod
uced
by
the
Cen
tre
for
Sta
tistic
s an
d In
form
atio
n (C
EI)
at t
he J
oão
Pin
heiro
Fou
ndat
ion
(FJP
). N
ote:
As
of 2
009,
figu
res
are
bas
ed u
pon
effe
ctiv
e p
aym
ents
to
clie
nts
rath
er t
han
on t
he b
ank’
s ap
pro
val o
f suc
h p
aym
ents
.
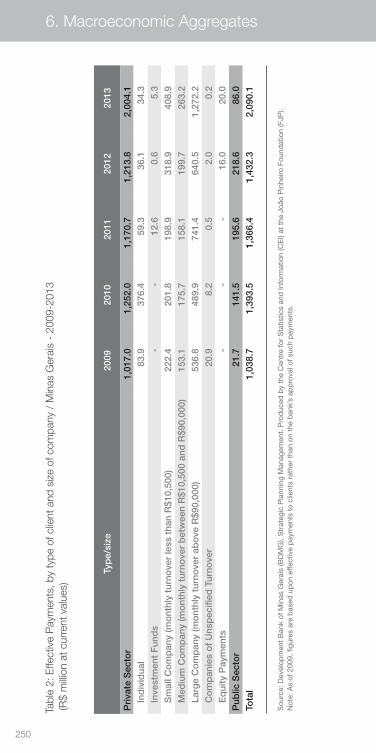
250
6. Macroeconomic Aggregates
Tabl
e 2:
Effe
ctiv
e P
aym
ents
, by
type
of c
lient
and
siz
e of
com
pany
/ M
inas
Ger
ais
- 20
09-2
013
(R$
milli
on a
t cur
rent
val
ues)
Typ
e/si
ze20
0920
1020
1120
1220
13
Pri
vate
Sec
tor
1,01
7.0
1,25
2.0
1,17
0.7
1,21
3.8
2,00
4.1
In
div
idua
l83
.937
6.4
59.3
36.1
34.3
In
vest
men
t F
und
s-
-12
.60.
65.
3
Sm
all C
om
pan
y (m
ont
hly
turn
ove
r le
ss t
han
R$1
0,50
0)22
2.4
201.
819
8.9
318.
940
8.9
M
ediu
m C
om
pan
y (m
ont
hly
turn
ove
r b
etw
een
R$1
0,50
0 an
d R
$90,
000)
153.
117
5.7
158.
119
9.7
263.
2
Larg
e C
om
pan
y (m
ont
hly
turn
ove
r ab
ove
R$9
0,00
0)53
6.8
489.
974
1.4
640.
51,
272.
2
Co
mp
anie
s o
f U
nsp
ecifi
ed T
urno
ver
20.9
8.2
0.5
2.0
0.2
E
qui
ty P
aym
ents
--
-16
.020
.0P
ublic
Sec
tor
21.7
141.
519
5.6
218.
686
.0To
tal
1,03
8.7
1,39
3.5
1,36
6.4
1,43
2.3
2,09
0.1
Sou
rce:
Dev
elop
men
t B
ank
of M
inas
Ger
ais
(BD
MG
), S
trat
egic
Pla
nnin
g M
anag
emen
t. P
rod
uced
by
the
Cen
tre
for
Sta
tistic
s an
d In
form
atio
n (C
EI)
at t
he J
oão
Pin
heiro
Fou
ndat
ion
(FJP
). N
ote:
As
of 2
009,
figu
res
are
bas
ed u
pon
effe
ctiv
e p
aym
ents
to
clie
nts
rath
er t
han
on t
he b
ank’
s ap
pro
val o
f suc
h p
aym
ents
.
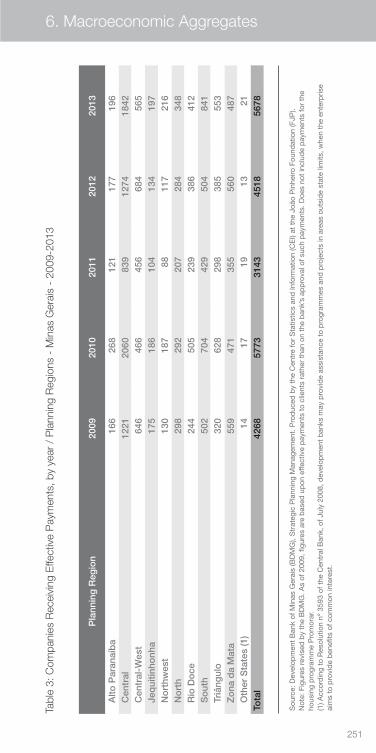
251
6. Macroeconomic Aggregates
Tabl
e 3:
Com
pani
es R
ecei
ving
Effe
ctiv
e P
aym
ents
, by
year
/ P
lann
ing
Reg
ions
- M
inas
Ger
ais
- 20
09-2
013
Pla
nnin
g R
egio
n20
0920
1020
1120
1220
13
A
lto P
aran
aíb
a16
626
812
117
719
6
Cen
tral
1221
2060
839
1274
1842
C
entr
al-W
est
646
466
456
684
565
Je
qui
tinho
nha
175
186
104
134
197
N
ort
hwes
t13
018
788
117
216
N
ort
h29
829
220
728
434
8
Rio
Do
ce24
450
523
938
641
2
So
uth
502
704
429
504
841
Tr
iâng
ulo
320
628
298
385
553
Z
ona
da
Mat
a55
947
135
556
048
7
Oth
er S
tate
s (1
)14
1719
1321
Tota
l42
6857
7331
4345
1856
78
Sou
rce:
Dev
elop
men
t B
ank
of M
inas
Ger
ais
(BD
MG
), S
trat
egic
Pla
nnin
g M
anag
emen
t. P
rod
uced
by
the
Cen
tre
for
Sta
tistic
s an
d In
form
atio
n (C
EI)
at t
he J
oão
Pin
heiro
Fou
ndat
ion
(FJP
). N
ote:
Fig
ures
rev
ised
by
the
BD
MG
. As
of 2
009,
figu
res
are
bas
ed u
pon
effe
ctiv
e p
aym
ents
to
clie
nts
rath
er t
han
on t
he b
ank’
s ap
pro
val o
f suc
h p
aym
ents
. Doe
s no
t in
clud
e p
aym
ents
for
the
hous
ing
pro
gram
me
Pro
mor
ar.
(1) A
ccor
din
g to
Res
olut
ion
nº 3
593
of t
he C
entr
al B
ank,
of J
uly
2008
, dev
elop
men
t b
anks
may
pro
vid
e as
sist
ance
to
pro
gram
mes
and
pro
ject
s in
are
as o
utsi
de
stat
e lim
its, w
hen
the
ente
rpris
e ai
ms
to p
rovi
de
ben
efits
of c
omm
on in
tere
st.
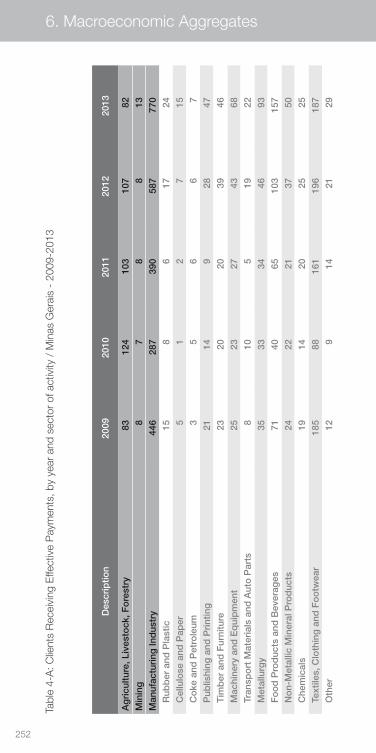
252
6. Macroeconomic Aggregates
Tabl
e 4-
A: C
lient
s R
ecei
ving
Effe
ctiv
e P
aym
ents
, by
year
and
sec
tor
of a
ctiv
ity /
Min
as G
erai
s -
2009
-201
3
Des
crip
tion
2009
2010
2011
2012
2013
Ag
ricu
lture
, Liv
esto
ck, F
ore
stry
8312
410
310
782
Min
ing
87
88
13M
anuf
actu
ring
Ind
ustr
y44
628
739
058
777
0
Rub
ber
and
Pla
stic
158
617
24
Cel
lulo
se a
nd P
aper
51
27
15
Co
ke a
nd P
etro
leum
35
66
7
Pub
lishi
ng a
nd P
rint
ing
2114
928
47
Tim
ber
and
Fur
nitu
re23
2020
3946
M
achi
nery
and
Eq
uip
men
t25
2327
4368
Tr
ansp
ort
Mat
eria
ls a
nd A
uto
Par
ts8
105
1922
M
etal
lurg
y35
3334
4693
F
oo
d P
rod
ucts
and
Bev
erag
es71
4065
103
157
N
on-
Met
allic
Min
eral
Pro
duc
ts24
2221
3750
C
hem
ical
s19
1420
2525
Te
xtile
s, C
loth
ing
and
Fo
otw
ear
185
8816
119
618
7
Oth
er12
914
2129
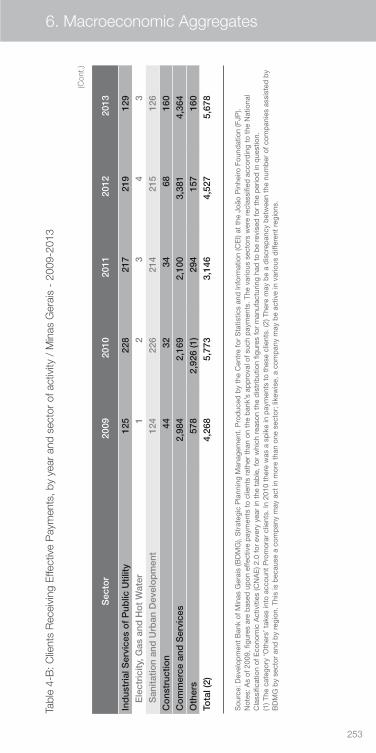
253
6. Macroeconomic Aggregates
Tabl
e 4-
B: C
lient
s R
ecei
ving
Effe
ctiv
e P
aym
ents
, by
year
and
sec
tor
of a
ctiv
ity /
Min
as G
erai
s -
2009
-201
3
Des
crip
tion
2009
2010
2011
2012
2013
Ag
ricu
lture
, Liv
esto
ck, F
ore
stry
8312
410
310
782
Min
ing
87
88
13M
anuf
actu
ring
Ind
ustr
y44
628
739
058
777
0
Rub
ber
and
Pla
stic
158
617
24
Cel
lulo
se a
nd P
aper
51
27
15
Co
ke a
nd P
etro
leum
35
66
7
Pub
lishi
ng a
nd P
rint
ing
2114
928
47
Tim
ber
and
Fur
nitu
re23
2020
3946
M
achi
nery
and
Eq
uip
men
t25
2327
4368
Tr
ansp
ort
Mat
eria
ls a
nd A
uto
Par
ts8
105
1922
M
etal
lurg
y35
3334
4693
F
oo
d P
rod
ucts
and
Bev
erag
es71
4065
103
157
N
on-
Met
allic
Min
eral
Pro
duc
ts24
2221
3750
C
hem
ical
s19
1420
2525
Te
xtile
s, C
loth
ing
and
Fo
otw
ear
185
8816
119
618
7
Oth
er12
914
2129
Sec
tor
2009
2010
2011
2012
2013
Ind
ustr
ial S
ervi
ces
of
Pub
lic U
tility
125
228
217
219
129
E
lect
rici
ty, G
as a
nd H
ot
Wat
er1
23
43
S
anita
tion
and
Urb
an D
evel
op
men
t12
422
621
421
512
6C
ons
truc
tion
4432
3468
160
Co
mm
erce
and
Ser
vice
s2,
984
2,16
92,
100
3,38
14,
364
Oth
ers
578
2,92
6 (1
)29
415
716
0To
tal (
2)4,
268
5,77
33,
146
4,52
75,
678
(Con
t.)
Sou
rce:
Dev
elop
men
t B
ank
of M
inas
Ger
ais
(BD
MG
), S
trat
egic
Pla
nnin
g M
anag
emen
t. P
rod
uced
by
the
Cen
tre
for
Sta
tistic
s an
d In
form
atio
n (C
EI)
at t
he J
oão
Pin
heiro
Fou
ndat
ion
(FJP
). N
otes
: As
of 2
009,
figu
res
are
bas
ed u
pon
effe
ctiv
e p
aym
ents
to
clie
nts
rath
er t
han
on t
he b
ank’
s ap
pro
val o
f suc
h p
aym
ents
. The
var
ious
sec
tors
wer
e re
clas
sifie
d a
ccor
din
g to
the
Nat
iona
l C
lass
ifica
tion
of E
cono
mic
Act
iviti
es (C
NA
E) 2
.0 fo
r ev
ery
year
in t
he t
able
, for
whi
ch r
easo
n th
e d
istr
ibut
ion
figur
es fo
r m
anuf
actu
ring
had
to
be
revi
sed
for
the
per
iod
in q
uest
ion.
(1
) The
cat
egor
y ‘O
ther
s’ t
akes
into
acc
ount
Pro
mor
ar c
lient
s. In
201
0 th
ere
was
a s
pik
e in
pay
men
ts t
o th
ese
clie
nts.
(2) T
here
may
be
a d
iscr
epan
cy b
etw
een
the
num
ber
of c
omp
anie
s as
sist
ed b
y B
DM
G b
y se
ctor
and
by
regi
on. T
his
is b
ecau
se a
com
pan
y m
ay a
ct in
mor
e th
an o
ne s
ecto
r; li
kew
ise,
a c
omp
any
may
be
activ
e in
var
ious
diff
eren
t re
gion
s.
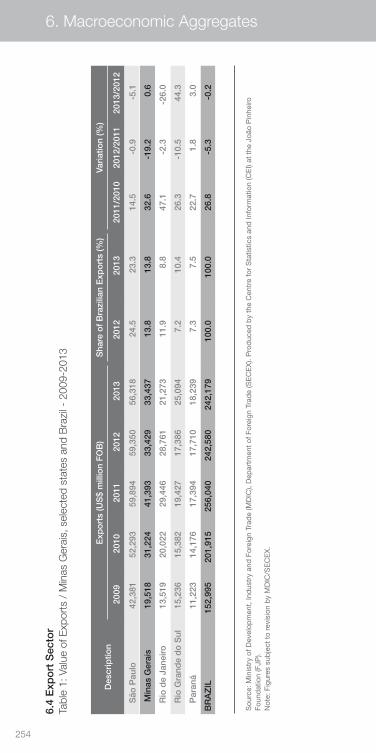
254
6. Macroeconomic Aggregates
6.4
Exp
ort
Sec
tor
Tabl
e 1:
Val
ue o
f Exp
orts
/ M
inas
Ger
ais,
sel
ecte
d st
ates
and
Bra
zil -
200
9-20
13
Des
crip
tion
Exp
ort
s (U
S$
mill
ion
FO
B)
Sha
re o
f B
razi
lian
Exp
ort
s (%
) Va
riat
ion
(%)
2009
2010
2011
2012
2013
2012
2013
2011
/201
020
12/2
011
2013
/201
2
S
ão P
aulo
42,3
8152
,293
59,8
9459
,350
56,3
1824
.523
.314
.5-0
.9-5
.1
M
inas
Ger
ais
19,5
1831
,224
41,3
9333
,429
33,4
3713
.813
.832
.6-1
9.2
0.6
R
io d
e Ja
neiro
13,5
1920
,022
29,4
4628
,761
21,2
7311
.98.
847
.1-2
.3-2
6.0
R
io G
rand
e d
o S
ul15
,236
15,3
8219
,427
17,3
8625
,094
7.2
10.4
26.3
-10.
544
.3
P
aran
á11
,223
14,1
7617
,394
17,7
1018
,239
7.3
7.5
22.7
1.8
3.0
BR
AZ
IL15
2,99
520
1,91
525
6,04
024
2,58
024
2,17
910
0.0
100.
026
.8-5
.3-0
.2
Sou
rce:
Min
istr
y of
Dev
elop
men
t, In
dus
try
and
For
eign
Tra
de
(MD
IC),
Dep
artm
ent
of F
orei
gn T
rad
e (S
EC
EX
). P
rod
uced
by
the
Cen
tre
for
Sta
tistic
s an
d In
form
atio
n (C
EI)
at t
he J
oão
Pin
heiro
Fo
und
atio
n (F
JP).
Not
e: F
igur
es s
ubje
ct t
o re
visi
on b
y M
DIC
/SE
CE
X.
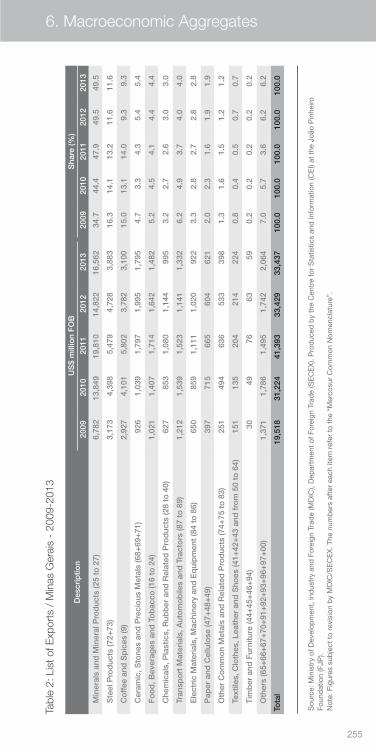
255
6. Macroeconomic Aggregates
Tabl
e 2:
Lis
t of E
xpor
ts /
Min
as G
erai
s -
2009
-201
3
Des
crip
tion
US
$ m
illio
n F
OB
Sha
re (%
)
2009
2010
2011
2012
2013
2009
2010
2011
2012
2013
M
iner
als
and
Min
eral
Pro
duc
ts (2
5 to
27)
6,78
213
,849
19,8
1014
,822
16,5
6234
.744
.447
.949
.549
.5
S
teel
Pro
duc
ts (7
2+73
)3,
173
4,39
85,
479
4,72
83,
883
16.3
14.1
13.2
11.6
11.6
C
off
ee a
nd S
pic
es (9
)2,
927
4,10
15,
802
3,78
23,
100
15.0
13.1
14.0
9.3
9.3
C
eram
ic, S
tone
s an
d P
reci
ous
Met
als
(68+
69+
71)
926
1,03
91,
797
1,99
51,
795
4.7
3.3
4.3
5.4
5.4
F
oo
d, B
ever
ages
and
To
bac
co (1
6 to
24)
1,02
11,
407
1,71
41,
642
1,48
25.
24.
54.
14.
44.
4
C
hem
ical
s, P
last
ics,
Rub
ber
and
Rel
ated
Pro
duc
ts (2
8 to
40)
627
853
1,08
01,
144
995
3.2
2.7
2.6
3.0
3.0
Tr
ansp
ort
Mat
eria
ls, A
uto
mo
bile
s an
d T
ract
ors
(87
to 8
9)1,
212
1,53
91,
523
1,14
11,
332
6.2
4.9
3.7
4.0
4.0
E
lect
ric
Mat
eria
ls, M
achi
nery
and
Eq
uip
men
t (8
4 to
86)
650
859
1,11
11,
020
922
3.3
2.8
2.7
2.8
2.8
P
aper
and
Cel
lulo
se (4
7+48
+49
)39
771
566
560
462
12.
02.
31.
61.
91.
9
O
ther
Co
mm
on
Met
als
and
Rel
ated
Pro
duc
ts (7
4+75
to
83)
251
494
636
533
398
1.3
1.6
1.5
1.2
1.2
Te
xtile
s, C
loth
es, L
eath
er a
nd S
hoes
(41+
42+
43 a
nd f
rom
50
to 6
4)15
113
520
421
422
40.
80.
40.
50.
70.
7
T
imb
er a
nd F
urni
ture
(44+
45+
46+
94)
3049
7663
590.
20.
20.
20.
20.
2
O
ther
s (6
5+66
+67
+70
+91
+92
+93
+96
+97
+00
)1,
371
1,78
61,
495
1,74
22,
064
7.0
5.7
3.6
6.2
6.2
Tota
l19
,518
31,2
2441
,393
33,4
2933
,437
100.
010
0.0
100.
010
0.0
100.
0
Sou
rce:
Min
istr
y of
Dev
elop
men
t, In
dus
try
and
For
eign
Tra
de
(MD
IC),
Dep
artm
ent
of F
orei
gn T
rad
e (S
EC
EX
). P
rod
uced
by
the
Cen
tre
for
Sta
tistic
s an
d In
form
atio
n (C
EI)
at t
he J
oão
Pin
heiro
Fo
und
atio
n (F
JP).
Not
e: F
igur
es s
ubje
ct t
o re
visi
on b
y M
DIC
/SE
CE
X. T
he n
umb
ers
afte
r ea
ch it
em r
efer
to
the
“Mer
cosu
r C
omm
on N
omen
clat
ure”
.
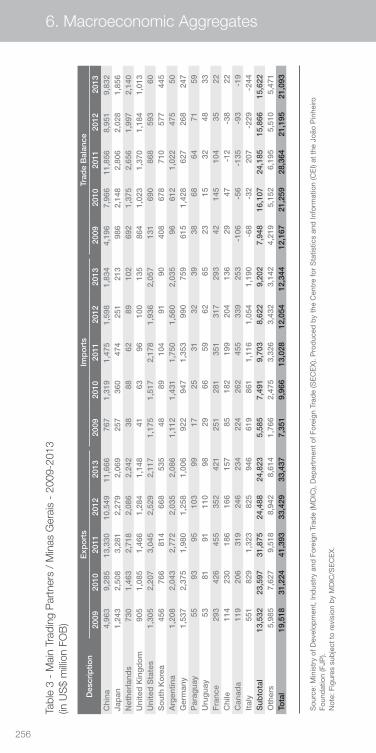
256
Tabl
e 3
- M
ain
Trad
ing
Par
tner
s /
Min
as G
erai
s -
2009
-201
3 (in
US
$ m
illion
FO
B)
Des
crip
tion
Exp
ort
sIm
po
rts
Trad
e B
alan
ce
2009
2010
2011
2012
2013
2009
2010
2011
2012
2013
2009
2010
2011
2012
2013
Chi
na4,
963
9,28
513
,330
10,5
4911
,666
767
1,31
91,
475
1,59
81,
834
4,19
67,
966
11,8
568,
951
9,83
2Ja
pan
1,24
32,
508
3,28
12,
279
2,06
925
736
047
425
121
398
62,
148
2,80
62,
028
1,85
6N
ethe
rlan
ds
730
1,46
32,
718
2,08
62,
242
3888
6289
102
692
1,37
52,
656
1,99
72,
140
Uni
ted
Kin
gd
om
905
1,08
51,
466
1,28
41,
148
4163
9610
013
586
41,
023
1,37
01,
184
1,01
3U
nite
d S
tate
s1,
305
2,20
73,
045
2,52
92,
117
1,17
51,
517
2,17
81,
936
2,05
713
169
086
859
360
So
uth
Ko
rea
456
766
814
668
535
4889
104
9190
408
678
710
577
445
Arg
entin
a1,
208
2,04
32,
772
2,03
52,
086
1,11
21,
431
1,75
01,
560
2,03
596
612
1,02
247
550
Ger
man
y1,
537
2,37
51,
980
1,25
81,
006
922
947
1,35
399
075
961
51,
428
627
268
247
Par
agua
y55
9395
103
9917
2531
3239
3868
6471
59U
rug
uay
5381
9111
098
2966
5962
6523
1532
4833
Fra
nce
293
426
455
352
421
251
281
351
317
293
4214
510
435
22C
hile
114
230
186
166
157
8518
219
920
413
629
47-1
2-3
822
Can
ada
119
206
319
246
234
224
262
455
339
253
-106
-56
-135
-93
-19
Ital
y55
182
91,
323
825
946
619
861
1,11
61,
054
1,19
0-6
8-3
220
7-2
29-2
44S
ubto
tal
13,5
3223
,597
31,8
7524
,488
24,8
235,
585
7,49
19,
703
8,62
29,
202
7,94
816
,107
24,1
8515
,866
15,6
22O
ther
s5,
985
7,62
79,
518
8,94
28,
614
1,76
62,
475
3,32
63,
432
3,14
24,
219
5,15
26,
195
5,51
05,
471
Tota
l19
,518
31,2
2441
,393
33,4
2933
,437
7,35
19,
966
13,0
2812
,054
12,3
4412
,167
21,2
5928
,364
21,1
9521
,093
Sou
rce:
Min
istr
y of
Dev
elop
men
t, In
dus
try
and
For
eign
Tra
de
(MD
IC),
Dep
artm
ent
of F
orei
gn T
rad
e (S
EC
EX
). P
rod
uced
by
the
Cen
tre
for
Sta
tistic
s an
d In
form
atio
n (C
EI)
at t
he J
oão
Pin
heiro
Fo
und
atio
n (F
JP).
Not
e: F
igur
es s
ubje
ct t
o re
visi
on b
y M
DIC
/SE
CE
X.
6. Macroeconomic Aggregates
257
Sou
rce:
Min
istr
y of
Dev
elop
men
t, In
dus
try
and
For
eign
Tra
de
(MD
IC),
Dep
artm
ent
of F
orei
gn T
rad
e (S
EC
EX
). P
rod
uced
by
the
Cen
tre
for
Sta
tistic
s an
d In
form
atio
n (C
EI)
at t
he J
oão
Pin
heiro
Fo
und
atio
n (F
JP).
Not
e: F
igur
es s
ubje
ct t
o re
visi
on b
y M
DIC
/SE
CE
X.
Demographic and Socioeconomic Features of the
Population
7
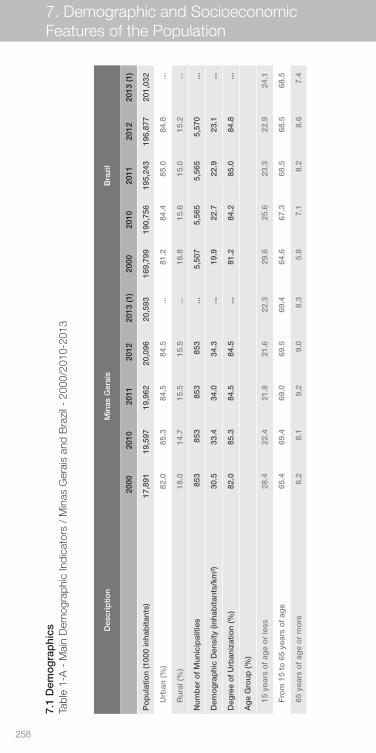
258
7. Demographic and Socioeconomic Features of the Population
7.1
Dem
og
rap
hics
Tabl
e 1-
A -
Mai
n D
emog
raph
ic In
dica
tors
/ M
inas
Ger
ais
and
Bra
zil -
200
0/20
10-2
013
Des
crip
tion
Min
as G
erai
sB
razi
l
20
0020
1020
1120
1220
13 (1
)20
0020
1020
1120
1220
13 (1
)
Po
pul
atio
n (1
000
inha
bita
nts)
17,8
9119
,597
19,9
6220
,096
20,5
9316
9,79
919
0,75
619
5,24
319
6,87
720
1,03
2
U
rban
(%)
82.0
85.3
84.5
84.5
...81
.284
.485
.084
.8...
R
ural
(%)
18.0
14.7
15.5
15.5
...18
.815
.615
.015
.2...
Num
ber
of
Mun
icip
aliti
es85
385
385
385
3...
5,50
75,
565
5,56
55,
570
...
Dem
og
rap
hic
Den
sity
(inh
abita
nts/
km²)
30.5
33.4
34.0
34.3
...19
.922
.722
.923
.1...
Deg
ree
of
Urb
aniz
atio
n (%
) 82
.085
.384
.584
.5...
81.2
84.2
85.0
84.8
...
Ag
e G
roup
(%)
15
yea
rs o
f ag
e o
r le
ss28
.422
.421
.821
.622
.329
.625
.623
.322
.924
.1
F
rom
15
to 6
5 ye
ars
of
age
65.4
69.4
69.0
69.5
69.4
64.6
67.3
68.5
68.5
68.5
65
yea
rs o
f ag
e o
r m
ore
6.2
8.1
9.2
9.0
8.3
5.8
7.1
8.2
8.6
7.4
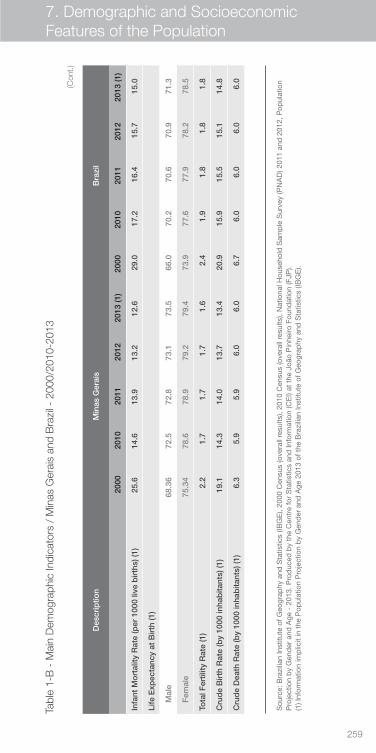
259
7. Demographic and Socioeconomic Features of the Population
Tabl
e 1-
B -
Mai
n D
emog
raph
ic In
dica
tors
/ M
inas
Ger
ais
and
Bra
zil -
200
0/20
10-2
013
Des
crip
tion
Min
as G
erai
sB
razi
l
20
0020
1020
1120
1220
13 (1
)20
0020
1020
1120
1220
13 (1
)
Infa
nt M
ort
ality
Rat
e (p
er 1
000
live
bir
ths)
(1)
25.6
14.6
13.9
13.2
12.6
29.0
17.2
16.4
15.7
15.0
Life
Exp
ecta
ncy
at B
irth
(1)
M
ale
68.3
672
.572
.873
.173
.566
.070
.270
.670
.971
.3
F
emal
e75
.34
78.6
78.9
79.2
79.4
73.9
77.6
77.9
78.2
78.5
Tota
l Fer
tility
Rat
e (1
)2.
21.
71.
71.
71.
62.
41.
91.
81.
81.
8
Cru
de
Bir
th R
ate
(by
1000
inha
bita
nts)
(1)
19.1
14.3
14.0
13.7
13.4
20.9
15.9
15.5
15.1
14.8
Cru
de
Dea
th R
ate
(by
1000
inha
bita
nts)
(1)
6.3
5.9
5.9
6.0
6.0
6.7
6.0
6.0
6.0
6.0
Sou
rce:
Bra
zilia
n In
stitu
te o
f Geo
grap
hy a
nd S
tatis
tics
(IBG
E),
2000
Cen
sus
(ove
rall
resu
lts),
2010
Cen
sus
(ove
rall
resu
lts),
Nat
iona
l Hou
seho
ld S
amp
le S
urve
y (P
NA
D) 2
011
and
201
2, P
opul
atio
n P
roje
ctio
n b
y G
end
er a
nd A
ge -
201
3. P
rod
uced
by
the
Cen
tre
for
Sta
tistic
s an
d In
form
atio
n (C
EI)
at t
he J
oão
Pin
heiro
Fou
ndat
ion
(FJP
). (1
) Inf
orm
atio
n im
plic
it in
the
Pop
ulat
ion
Pro
ject
ion
by
Gen
der
and
Age
201
3 of
the
Bra
zilia
n In
stitu
te o
f Geo
grap
hy a
nd S
tatis
tics
(IBG
E).
(Con
t.)
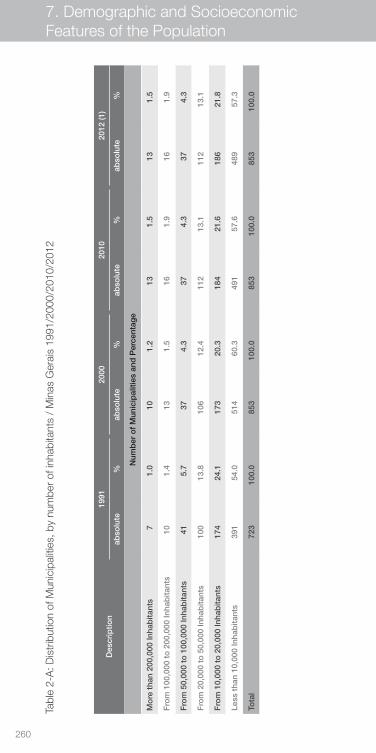
260
Tabl
e 2-
A: D
istr
ibut
ion
of M
unic
ipal
ities
, by
num
ber
of in
habi
tant
s /
Min
as G
erai
s 19
91/2
000/
2010
/201
2
Des
crip
tion
1991
2000
2010
2012
(1)
abso
lute
%ab
solu
te%
abso
lute
%ab
solu
te%
Num
ber
of
Mun
icip
aliti
es a
nd P
erce
ntag
e
Mo
re t
han
200,
000
Inha
bita
nts
71.
010
1.2
131.
513
1.5
Fro
m 1
00,0
00 t
o 2
00,0
00 In
hab
itant
s10
1.4
131.
516
1.9
161.
9
Fro
m 5
0,00
0 to
100
,000
Inha
bita
nts
415.
737
4.3
374.
337
4.3
Fro
m 2
0,00
0 to
50,
000
Inha
bita
nts
100
13.8
106
12.4
112
13.1
112
13.1
Fro
m 1
0,00
0 to
20,
000
Inha
bita
nts
174
24.1
173
20.3
184
21.6
186
21.8
Less
tha
n 10
,000
Inha
bita
nts
391
54.0
514
60.3
491
57.6
489
57.3
Tota
l72
310
0.0
853
100.
085
310
0.0
853
100.
0
7. Demographic and Socioeconomic Features of the Population
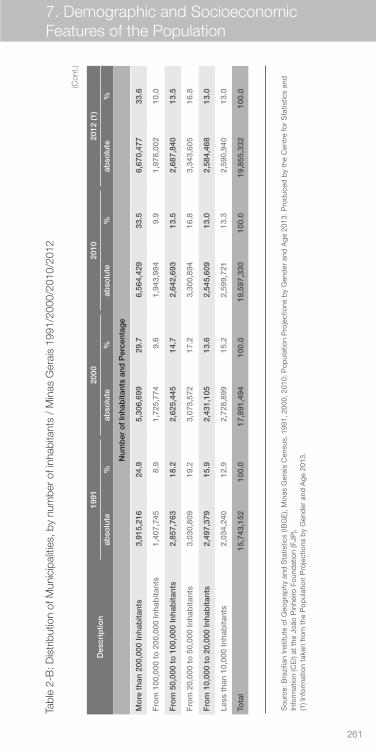
261
Tabl
e 2-
B: D
istr
ibut
ion
of M
unic
ipal
ities
, by
num
ber
of in
habi
tant
s /
Min
as G
erai
s 19
91/2
000/
2010
/201
2
(Con
t.)
Sou
rce:
Bra
zilia
n In
stitu
te o
f Geo
grap
hy a
nd S
tatis
tics
(IBG
E),
Min
as G
erai
s C
ensu
s, 1
991,
200
0, 2
010;
Pop
ulat
ion
Pro
ject
ions
by
Gen
der
and
Age
201
3. P
rod
uced
by
the
Cen
tre
for
Sta
tistic
s an
d
Info
rmat
ion
(CE
I) at
the
Joã
o P
inhe
iro F
ound
atio
n (F
JP).
(1) I
nfor
mat
ion
take
n fr
om t
he P
opul
atio
n P
roje
ctio
ns b
y G
end
er a
nd A
ge 2
013.
Des
crip
tion
1991
2000
2010
2012
(1)
abso
lute
%ab
solu
te%
abso
lute
%ab
solu
te%
Num
ber
of
Inha
bita
nts
and
Per
cent
age
Mo
re t
han
200,
000
Inha
bita
nts
3,91
5,21
624
.95,
306,
699
29.7
6,56
4,42
933
.56,
670,
477
33.6
Fro
m 1
00,0
00 t
o 2
00,0
00 In
hab
itant
s1,
407,
745
8.9
1,72
5,77
49.
61,
943,
984
9.9
1,97
8,00
210
.0
Fro
m 5
0,00
0 to
100
,000
Inha
bita
nts
2,85
7,76
318
.22,
625,
445
14.7
2,64
2,69
313
.52,
687,
840
13.5
Fro
m 2
0,00
0 to
50,
000
Inha
bita
nts
3,03
0,80
919
.23,
073,
572
17.2
3,30
0,89
416
.83,
343,
605
16.8
Fro
m 1
0,00
0 to
20,
000
Inha
bita
nts
2,49
7,37
915
.92,
431,
105
13.6
2,54
5,60
913
.02,
584,
468
13.0
Less
tha
n 10
,000
Inha
bita
nts
2,03
4,24
012
.92,
728,
899
15.2
2,59
9,72
113
.32,
590,
940
13.0
Tota
l15
,743
,152
100.
017
,891
,494
100.
019
,597
,330
100.
019
,855
,332
100.
0
7. Demographic and Socioeconomic Features of the Population
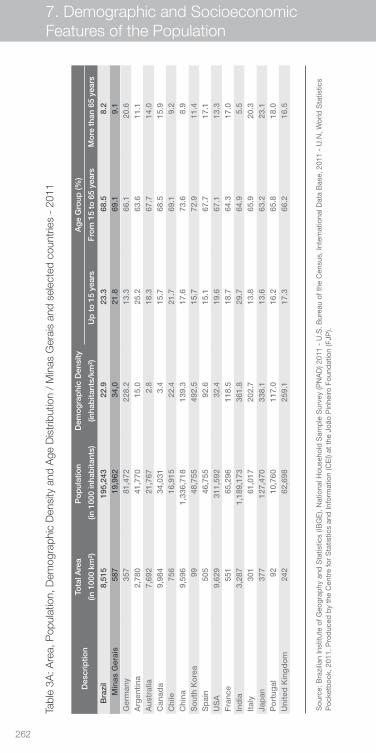
262
Tabl
e 3A
: Are
a, P
opul
atio
n, D
emog
raph
ic D
ensi
ty a
nd A
ge D
istr
ibut
ion
/ M
inas
Ger
ais
and
sele
cted
cou
ntrie
s -
2011
Des
crip
tion
Tota
l Are
aP
op
ulat
ion
Dem
og
rap
hic
Den
sity
Ag
e G
roup
(%)
(in 1
000
km²)
(in
1000
inha
bita
nts)
(inha
bita
nts/
km²)
Up
to
15
year
sF
rom
15
to 6
5 ye
ars
Mo
re t
han
65 y
ears
B
razi
l8,
515
195,
243
22.9
23.3
68.5
8.2
Min
as G
erai
s58
719
,962
34,0
21.8
69.1
9.1
Ger
man
y 35
781
,472
228.
213
.366
.120
.6A
rgen
tina
2,78
041
,770
15.0
25.2
63.6
11.1
Aus
tral
ia7,
692
21,7
672.
818
.367
.714
.0C
anad
a9,
984
34,0
313.
415
.768
.515
.9C
hile
756
16,9
1522
.421
.769
.19.
2C
hina
9,59
61,
336,
718
139.
317
.673
.68.
9S
out
h K
ore
a99
48,7
5549
2.5
15.7
72.9
11.4
Sp
ain
505
46,7
5592
.615
.167
.717
.1U
SA
9,62
931
1,59
232
.419
.667
.113
.3F
ranc
e55
165
,296
118.
518
.764
.317
.0In
dia
3,28
71,
189,
173
361.
829
.764
.95.
5It
aly
301
61,0
1720
2.7
13.8
65.9
20.3
Jap
an37
712
7,47
033
8.1
13.6
63.2
23.1
Po
rtug
al92
10,7
6011
7.0
16.2
65.8
18.0
Uni
ted
Kin
gd
om
242
62,6
9825
9.1
17.3
66.2
16.5
Sou
rce:
Bra
zilia
n In
stitu
te o
f Geo
grap
hy a
nd S
tatis
tics
(IBG
E),
Nat
iona
l Hou
seho
ld S
amp
le S
urve
y (P
NA
D) 2
011
- U
.S. B
urea
u of
the
Cen
sus,
Inte
rnat
iona
l Dat
a B
ase,
201
1 -
U.N
, Wor
ld S
tatis
tics
Poc
ketb
ook,
201
1. P
rod
uced
by
the
Cen
tre
for
Sta
tistic
s an
d In
form
atio
n (C
EI)
at t
he J
oão
Pin
heiro
Fou
ndat
ion
(FJP
).
7. Demographic and Socioeconomic Features of the Population
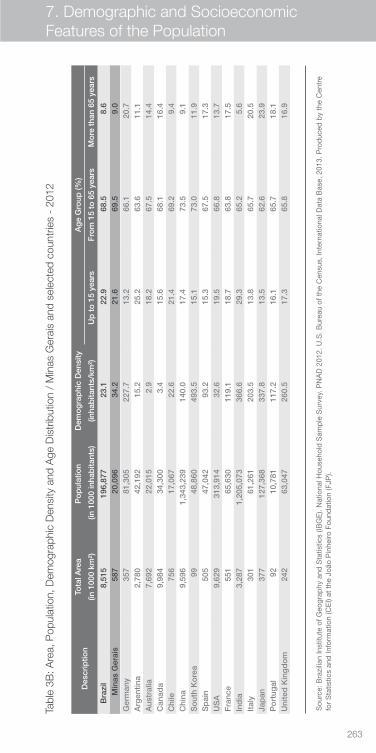
263
Tabl
e 3B
: Are
a, P
opul
atio
n, D
emog
raph
ic D
ensi
ty a
nd A
ge D
istr
ibut
ion
/ M
inas
Ger
ais
and
sele
cted
cou
ntrie
s -
2012
Des
crip
tion
Tota
l Are
aP
op
ulat
ion
Dem
og
rap
hic
Den
sity
Ag
e G
roup
(%)
(in 1
000
km²)
(in
1000
inha
bita
nts)
(inha
bita
nts/
km²)
Up
to
15
year
sF
rom
15
to 6
5 ye
ars
Mo
re t
han
65 y
ears
B
razi
l8,
515
196,
877
23.1
22.9
68.5
8.6
Min
as G
erai
s58
720
,096
34.2
21.6
69.5
9.0
Ger
man
y 35
781
,305
227.
713
.266
.120
.7A
rgen
tina
2,78
042
,192
15.2
25.2
63.6
11.1
Aus
tral
ia7,
692
22,0
152.
918
.267
.514
.4C
anad
a9,
984
34,3
003.
415
.668
.116
.4C
hile
756
17,0
6722
.621
.469
.29.
4C
hina
9,59
61,
343,
239
140.
017
.473
.59.
1S
out
h K
ore
a99
48,8
6049
3.5
15.1
73.0
11.9
Sp
ain
505
47,0
4293
.215
.367
.517
.3U
SA
9,62
931
3,91
432
.619
.566
.813
.7F
ranc
e55
165
,630
119.
118
.763
.817
.5In
dia
3,28
71,
205,
073
366.
629
.365
.25.
6It
aly
301
61,2
6120
3.5
13.8
65.7
20.5
Jap
an37
712
7,36
833
7.8
13.5
62.6
23.9
Po
rtug
al92
10,7
8111
7.2
16.1
65.7
18.1
Uni
ted
Kin
gd
om
242
63,0
4726
0.5
17.3
65.8
16.9
Sou
rce:
Bra
zilia
n In
stitu
te o
f Geo
grap
hy a
nd S
tatis
tics
(IBG
E).
Nat
iona
l Hou
seho
ld S
amp
le S
urve
y. P
NA
D 2
012.
U.S
. Bur
eau
of t
he C
ensu
s, In
tern
atio
nal D
ata
Bas
e, 2
013.
Pro
duc
ed b
y th
e C
entr
e fo
r S
tatis
tics
and
Info
rmat
ion
(CE
I) at
the
Joã
o P
inhe
iro F
ound
atio
n (F
JP).
7. Demographic and Socioeconomic Features of the Population
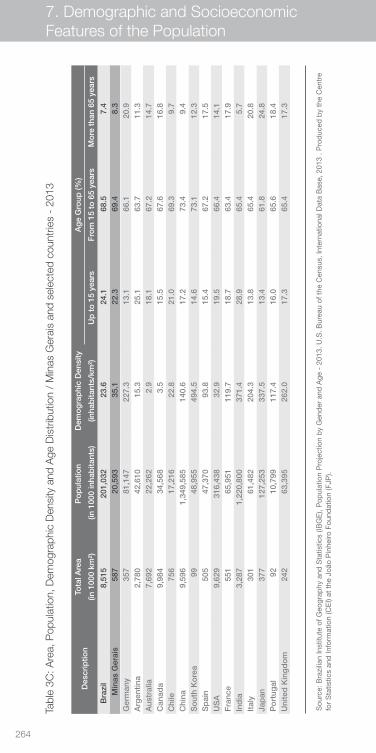
264
Tabl
e 3C
: Are
a, P
opul
atio
n, D
emog
raph
ic D
ensi
ty a
nd A
ge D
istr
ibut
ion
/ M
inas
Ger
ais
and
sele
cted
cou
ntrie
s -
2013
Des
crip
tion
Tota
l Are
aP
op
ulat
ion
Dem
og
rap
hic
Den
sity
Ag
e G
roup
(%)
(in 1
000
km²)
(in
1000
inha
bita
nts)
(inha
bita
nts/
km²)
Up
to
15
year
sF
rom
15
to 6
5 ye
ars
Mo
re t
han
65 y
ears
B
razi
l8,
515
201,
032
23.6
24.1
68.5
7.4
Min
as G
erai
s58
720
,593
35.1
22.3
69.4
8.3
Ger
man
y 35
781
,147
227.
313
.166
.120
.9A
rgen
tina
2,78
042
,610
15.3
25.1
63.7
11.3
Aus
tral
ia7,
692
22,2
622.
918
.167
.214
.7C
anad
a9,
984
34,5
683.
515
.567
.616
.8C
hile
756
17,2
1622
.821
.069
.39.
7C
hina
9,59
61,
349,
585
140.
617
.273
.49.
4S
out
h K
ore
a99
48,9
5549
4.5
14.6
73.1
12.3
Sp
ain
505
47,3
7093
.815
.467
.217
.5U
SA
9,62
931
6,43
832
.919
.566
.414
.1F
ranc
e55
165
,951
119.
718
.763
.417
.9In
dia
3,28
71,
220,
800
371.
428
.965
.45.
7It
aly
301
61,4
8220
4.3
13.8
65.4
20.8
Jap
an37
712
7,25
333
7.5
13.4
61.8
24.8
Po
rtug
al92
10,7
9911
7.4
16.0
65.6
18.4
Uni
ted
Kin
gd
om
242
63,3
9526
2.0
17.3
65.4
17.3
Sou
rce:
Bra
zilia
n In
stitu
te o
f Geo
grap
hy a
nd S
tatis
tics
(IBG
E),
Pop
ulat
ion
Pro
ject
ion
by
Gen
der
and
Age
- 2
013.
U.S
. Bur
eau
of t
he C
ensu
s, In
tern
atio
nal D
ata
Bas
e, 2
013
. Pro
duc
ed b
y th
e C
entr
e fo
r S
tatis
tics
and
Info
rmat
ion
(CE
I) at
the
Joã
o P
inhe
iro F
ound
atio
n (F
JP).
7. Demographic and Socioeconomic Features of the Population
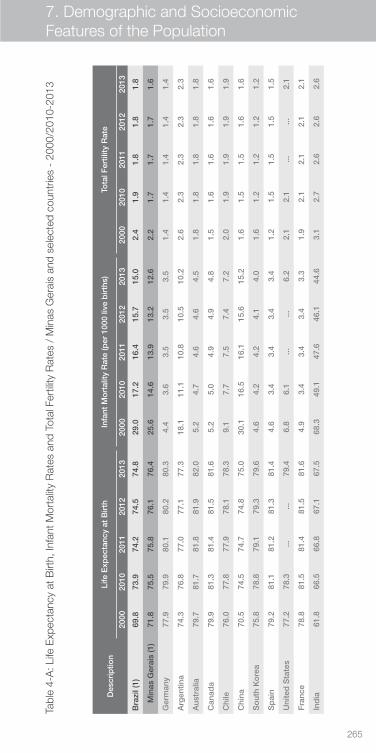
265
Tabl
e 4-
A: L
ife E
xpec
tanc
y at
Birt
h, In
fant
Mor
talit
y R
ates
and
Tot
al F
ertil
ity R
ates
/ M
inas
Ger
ais
and
sele
cted
cou
ntrie
s -
2000
/201
0-20
13
Des
crip
tion
Life
Exp
ecta
ncy
at B
irth
In
fant
Mo
rtal
ity R
ate
(per
100
0 liv
e b
irth
s)
Tota
l Fer
tility
Rat
e
2000
2010
2011
2012
2013
20
0020
1020
1120
1220
13
2000
2010
2011
2012
2013
Bra
zil (
1)69
.873
.974
.274
.574
.829
.017
.216
.415
.715
.02.
41.
91.
81.
81.
8
M
inas
Ger
ais
(1)
71.8
75.5
75.8
76.1
76.4
25.6
14.6
13.9
13.2
12.6
2.2
1.7
1.7
1.7
1.6
Ger
man
y77
.979
.980
.180
.280
.34.
43.
63.
53.
53.
51.
41.
41.
41.
41.
4
Arg
entin
a 74
.376
.877
.077
.177
.318
.111
.110
.810
.510
.22.
62.
32.
32.
32.
3
Aus
tral
ia79
.781
.781
.881
.982
.05.
24.
74.
64.
64.
51.
81.
81.
81.
81.
8
Can
ada
79.9
81.3
81.4
81.5
81.6
5.2
5.0
4.9
4.9
4.8
1.5
1.6
1.6
1.6
1.6
Chi
le76
.077
.877
.978
.178
.39.
17.
77.
57.
47.
22.
01.
91.
91.
91.
9
Chi
na70
.574
.574
.774
.875
.030
.116
.516
.115
.615
.21.
61.
51.
51.
61.
6
So
uth
Ko
rea
75.8
78.8
79.1
79.3
79.6
4.6
4.2
4.2
4.1
4.0
1.6
1.2
1.2
1.2
1.2
Sp
ain
79.2
81.1
81.2
81.3
81.4
4.6
3.4
3.4
3.4
3.4
1.2
1.5
1.5
1.5
1.5
Uni
ted
Sta
tes
77.2
78.3
......
79.4
6.8
6.1
......
6.2
2.1
2.1
......
2.1
Fra
nce
78.8
81.5
81.4
81.5
81.6
4.9
3.4
3.4
3.4
3.3
1.9
2.1
2.1
2.1
2.1
Ind
ia61
.866
.566
.867
.167
.568
.349
.147
.646
.144
.63.
12.
72.
62.
62.
6
7. Demographic and Socioeconomic Features of the Population
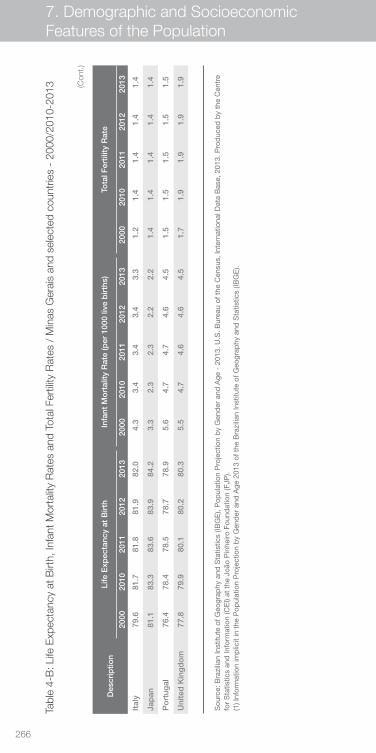
266
Sou
rce:
Bra
zilia
n In
stitu
te o
f Geo
grap
hy a
nd S
tatis
tics
(IBG
E),
Pop
ulat
ion
Pro
ject
ion
by
Gen
der
and
Age
- 2
013.
U.S
. Bur
eau
of t
he C
ensu
s, In
tern
atio
nal D
ata
Bas
e, 2
013.
Pro
duc
ed b
y th
e C
entr
e fo
r S
tatis
tics
and
Info
rmat
ion
(CE
I) at
the
Joã
o P
inhe
iro F
ound
atio
n (F
JP).
(1) I
nfor
mat
ion
imp
licit
in t
he P
opul
atio
n P
roje
ctio
n b
y G
end
er a
nd A
ge 2
013
of t
he B
razi
lian
Inst
itute
of G
eogr
aphy
and
Sta
tistic
s (IB
GE
).
Tabl
e 4-
B: L
ife E
xpec
tanc
y at
Birt
h, In
fant
Mor
talit
y R
ates
and
Tot
al F
ertil
ity R
ates
/ M
inas
Ger
ais
and
sele
cted
cou
ntrie
s -
2000
/201
0-20
13
Des
crip
tion
Life
Exp
ecta
ncy
at B
irth
In
fant
Mo
rtal
ity R
ate
(per
100
0 liv
e b
irth
s)
Tota
l Fer
tility
Rat
e
2000
2010
2011
2012
2013
20
0020
1020
1120
1220
13
2000
2010
2011
2012
2013
Ital
y79
.681
.781
.881
.982
.04.
33.
43.
43.
43.
31.
21.
41.
41.
41.
4
Jap
an81
.183
.383
.683
.984
.23.
32.
32.
32.
22.
21.
41.
41.
41.
41.
4
Po
rtug
al76
.478
.478
.578
.778
.95.
64.
74.
74.
64.
51.
51.
51.
51.
51.
5
Uni
ted
Kin
gd
om
77.8
79.9
80.1
80.2
80.3
5.5
4.7
4.6
4.6
4.5
1.7
1.9
1.9
1.9
1.9
(Con
t.)
7. Demographic and Socioeconomic Features of the Population
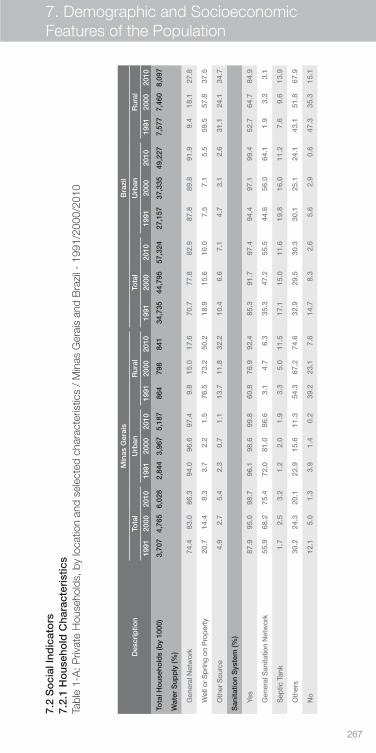
267
7.2
So
cial
Ind
icat
ors
7.2.
1 H
ous
eho
ld C
hara
cter
istic
sTa
ble
1-A
: Priv
ate
Hou
seho
lds,
by
loca
tion
and
sele
cted
cha
ract
eris
tics
/ M
inas
Ger
ais
and
Bra
zil -
199
1/20
00/2
010
Des
crip
tion
M
inas
Ger
ais
Bra
zil
Tota
lU
rban
Rur
alTo
tal
Urb
anR
ural
1991
2000
2010
1991
2000
2010
1991
2000
2010
1991
2000
2010
1991
2000
2010
1991
2000
2010
Tota
l Ho
useh
old
s (b
y 10
00)
3,70
74,
765
6,02
82,
844
3,96
75,
187
864
798
841
34,7
3544
,795
57,3
2427
,157
37,3
3549
,227
7,57
77,
460
8,09
7
Wat
er S
upp
ly (%
)
G
ener
al N
etw
ork
74.4
83.0
86.3
94.0
96.6
97.4
9.8
15.0
17.6
70.7
77.8
82.9
87.8
89.8
91.9
9.4
18.1
27.8
W
ell o
r Spr
ing
on P
rope
rty
20.7
14.4
8.3
3.7
2.2
1.5
76.5
73.2
50.2
18.9
15.6
10.0
7.5
7.1
5.5
59.5
57.8
37.5
O
ther
Sou
rce
4.9
2.7
5.4
2.3
0.7
1.1
13.7
11.8
32.2
10.4
6.6
7.1
4.7
3.1
2.6
31.1
24.1
34.7
San
itatio
n S
yste
m (%
)
Ye
s87
.995
.098
.796
.198
.699
.860
.876
.992
.485
.391
.797
.494
.497
.199
.452
.764
.784
.9
G
ener
al S
anita
tion
Net
wor
k55
.968
.275
.472
.081
.086
.63.
14.
76.
335
.347
.255
.544
.656
.064
.11.
93.
33.
1
S
eptic
Tan
k1.
72.
53.
21.
22.
01.
93.
35.
011
.517
.115
.011
.619
.816
.011
.27.
69.
613
.9
O
ther
s30
.224
.320
.122
.915
.611
.354
.367
.274
.632
.929
.530
.330
.125
.124
.143
.151
.867
.9
N
o12
.15.
01.
33.
91.
40.
239
.223
.17.
614
.78.
32.
65.
62.
90.
647
.335
.315
.1
7. Demographic and Socioeconomic Features of the Population
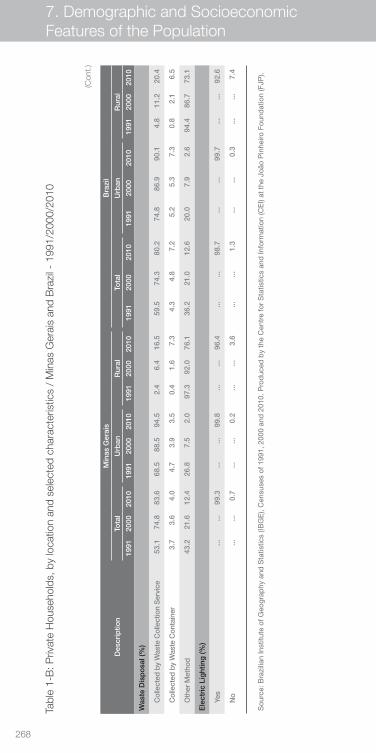
268
Des
crip
tion
M
inas
Ger
ais
Bra
zil
Tota
lU
rban
Rur
alTo
tal
Urb
anR
ural
1991
2000
2010
1991
2000
2010
1991
2000
2010
1991
2000
2010
1991
2000
2010
1991
2000
2010
Was
te D
isp
osa
l (%
)
C
olle
cted
by
Was
te C
olle
ctio
n S
ervi
ce53
.174
.883
.668
.588
.594
.52.
46.
416
.559
.574
.380
.274
.886
.990
.14.
811
.220
.4
C
olle
cted
by
Was
te C
onta
iner
3.7
3.6
4.0
4.7
3.9
3.5
0.4
1.6
7.3
4.3
4.8
7.2
5.2
5.3
7.3
0.8
2.1
6.5
O
ther
Met
hod
43.2
21.6
12.4
26.8
7.5
2.0
97.3
92.0
76.1
36.2
21.0
12.6
20.0
7.9
2.6
94.4
86.7
73.1
Ele
ctri
c Li
ght
ing
(%)
Ye
s...
...99
.3...
...99
.8...
...96
.4...
...98
.7...
...99
.7...
...92
.6
N
o...
...0.
7...
...0.
2...
...3.
6...
...1.
3...
...0.
3...
...7.
4
Tabl
e 1-
B: P
rivat
e H
ouse
hold
s, b
y lo
catio
n an
d se
lect
ed c
hara
cter
istic
s /
Min
as G
erai
s an
d B
razi
l - 1
991/
2000
/201
0
Sou
rce:
Bra
zilia
n In
stitu
te o
f Geo
grap
hy a
nd S
tatis
tics
(IBG
E),
Cen
suse
s of
199
1, 2
000
and
201
0. P
rod
uced
by
the
Cen
tre
for
Sta
tistic
s an
d In
form
atio
n (C
EI)
at t
he J
oão
Pin
heiro
Fou
ndat
ion
(FJP
).
(Con
t.)
7. Demographic and Socioeconomic Features of the Population
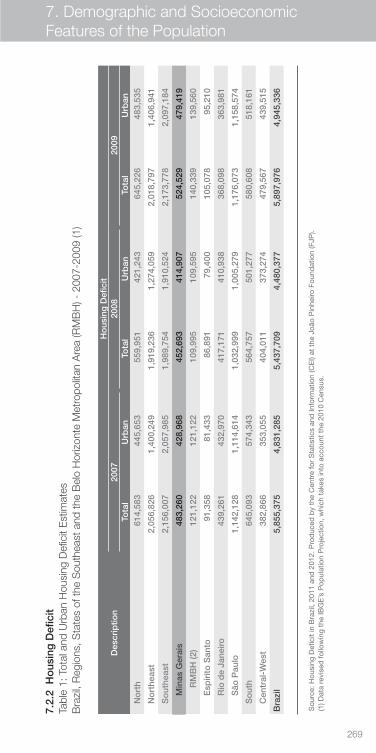
269
Des
crip
tion
H
ous
ing
Def
icit
20
0720
0820
09To
tal
Urb
anTo
tal
Urb
anTo
tal
Urb
an
No
rth
614,
583
445,
653
559,
951
421,
243
645,
226
483,
535
N
ort
heas
t2,
056,
826
1,40
0,24
91,
919,
236
1,27
4,05
92,
018,
797
1,40
6,94
1
S
out
heas
t2,
156,
007
2,05
7,98
51,
989,
754
1,91
0,52
42,
173,
778
2,09
7,18
4
Min
as G
erai
s48
3,26
042
8,96
8
452,
693
414,
907
52
4,52
947
9,41
9
R
MB
H (2
)12
1,12
212
1,12
210
9,99
510
9,59
514
0,33
913
9,56
0
Esp
írito
San
to91
,358
81,4
3386
,891
79,4
0010
5,07
895
,210
Rio
de
Jane
iro43
9,26
143
2,97
041
7,17
141
0,93
836
8,09
836
3,98
1
São
Pau
lo1,
142,
128
1,11
4,61
41,
032,
999
1,00
5,27
91,
176,
073
1,15
8,57
4
S
out
h64
5,09
357
4,34
356
4,75
750
1,27
758
0,60
851
8,16
1
C
entr
al-W
est
382,
866
353,
055
404,
011
373,
274
479,
567
439,
515
Bra
zil
5,85
5,37
54,
831,
285
5,43
7,70
94,
480,
377
5,89
7,97
64,
945,
336
Sou
rce:
Hou
sing
Def
icit
in B
razi
l, 20
11 a
nd 2
012.
Pro
duc
ed b
y th
e C
entr
e fo
r S
tatis
tics
and
Info
rmat
ion
(CE
I) at
the
Joã
o P
inhe
iro F
ound
atio
n (F
JP).
(1) D
ata
revi
sed
follo
win
g th
e IB
GE
’s P
opul
atio
n P
roje
ctio
n, w
hich
tak
es in
to a
ccou
nt t
he 2
010
Cen
sus.
7.2.
2 H
ous
ing
Def
icit
Tabl
e 1:
Tot
al a
nd U
rban
Hou
sing
Def
icit
Est
imat
esB
razi
l, R
egio
ns, S
tate
s of
the
Sou
thea
st a
nd th
e B
elo
Hor
izon
te M
etro
polit
an A
rea
(RM
BH
) - 2
007-
2009
(1)
7. Demographic and Socioeconomic Features of the Population
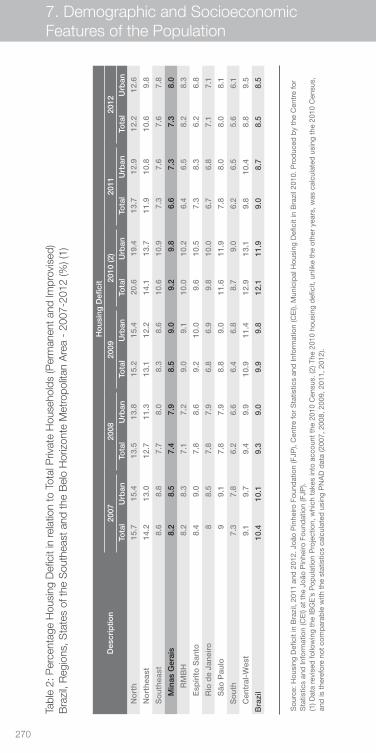
270
Des
crip
tion
Ho
usin
g D
efic
it20
0720
0820
0920
10 (2
)20
1120
12To
tal
Urb
anTo
tal
Urb
anTo
tal
Urb
anTo
tal
Urb
anTo
tal
Urb
anTo
tal
Urb
an
N
ort
h15
.715
.413
.513
.815
.215
.420
.619
.413
.712
.912
.212
.6
N
ort
heas
t14
.213
.012
.711
.313
.112
.214
.113
.711
.910
.810
.69.
8
S
out
heas
t8.
68.
87.
78.
08.
38.
610
.610
.97.
37.
67.
67.
8
Min
as G
erai
s8.
28.
5
7.4
7.9
8.
59.
0
9.2
9.8
6.
67.
3
7.3
8.0
R
MB
H8.
28.
37.
17.
29.
09.
110
.010
.26.
46.
58.
28.
3
Esp
írito
San
to8.
49.
07.
88.
69.
210
.09.
610
.57.
38.
36.
26.
8
Rio
de
Jane
iro8
8.5
7.8
7.9
6.8
6.9
9.8
10.0
6.7
6.8
7.1
7.1
São
Pau
lo9
9.1
7.8
7.9
8.8
9.0
11.6
11.9
7.8
8.0
8.0
8.1
S
out
h7.
37.
86.
26.
66.
46.
88.
79.
06.
26.
55.
66.
1
C
entr
al-W
est
9.1
9.7
9.4
9.9
10.9
11.4
12.9
13.1
9.8
10.4
8.8
9.5
Bra
zil
10.4
10.1
9.3
9.0
9.9
9.8
12.1
11.9
9.0
8.7
8.5
8.5
Sou
rce:
Hou
sing
Def
icit
in B
razi
l, 20
11 a
nd 2
012.
Joã
o P
inhe
iro F
ound
atio
n (F
JP),
Cen
tre
for
Sta
tistic
s an
d In
form
atio
n (C
EI),
Mun
icip
al H
ousi
ng D
efic
it in
Bra
zil 2
010.
Pro
duc
ed b
y th
e C
entr
e fo
r S
tatis
tics
and
Info
rmat
ion
(CE
I) at
the
Joã
o P
inhe
iro F
ound
atio
n (F
JP).
(1) D
ata
revi
sed
follo
win
g th
e IB
GE
’s P
opul
atio
n P
roje
ctio
n, w
hich
tak
es in
to a
ccou
nt t
he 2
010
Cen
sus.
(2) T
he 2
010
hous
ing
def
icit,
unl
ike
the
othe
r ye
ars,
was
cal
cula
ted
usi
ng t
he 2
010
Cen
sus,
an
d is
the
refo
re n
ot c
omp
arab
le w
ith t
he s
tatis
tics
calc
ulat
ed u
sing
PN
AD
dat
a (2
007,
200
8, 2
009,
201
1, 2
012)
.
Tabl
e 2:
Per
cent
age
Hou
sing
Def
icit
in re
latio
n to
Tot
al P
rivat
e H
ouse
hold
s (P
erm
anen
t and
Impr
ovis
ed)
Bra
zil,
Reg
ions
, Sta
tes
of th
e S
outh
east
and
the
Bel
o H
oriz
onte
Met
ropo
litan
Are
a -
2007
-201
2 (%
) (1)
7. Demographic and Socioeconomic Features of the Population
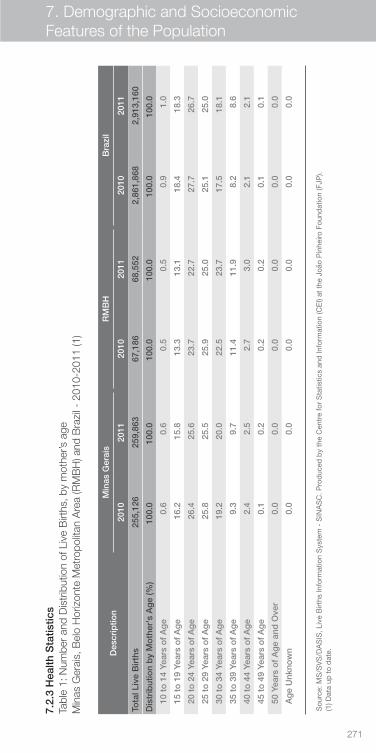
271
Sou
rce:
Hou
sing
Def
icit
in B
razi
l, 20
11 a
nd 2
012.
Joã
o P
inhe
iro F
ound
atio
n (F
JP),
Cen
tre
for
Sta
tistic
s an
d In
form
atio
n (C
EI),
Mun
icip
al H
ousi
ng D
efic
it in
Bra
zil 2
010.
Pro
duc
ed b
y th
e C
entr
e fo
r S
tatis
tics
and
Info
rmat
ion
(CE
I) at
the
Joã
o P
inhe
iro F
ound
atio
n (F
JP).
(1) D
ata
revi
sed
follo
win
g th
e IB
GE
’s P
opul
atio
n P
roje
ctio
n, w
hich
tak
es in
to a
ccou
nt t
he 2
010
Cen
sus.
(2) T
he 2
010
hous
ing
def
icit,
unl
ike
the
othe
r ye
ars,
was
cal
cula
ted
usi
ng t
he 2
010
Cen
sus,
an
d is
the
refo
re n
ot c
omp
arab
le w
ith t
he s
tatis
tics
calc
ulat
ed u
sing
PN
AD
dat
a (2
007,
200
8, 2
009,
201
1, 2
012)
.
Des
crip
tion
Min
as G
erai
sR
MB
HB
razi
l
2010
2011
2010
2011
2010
2011
Tota
l Liv
e B
irth
s25
5,12
625
9,86
3
67,1
8668
,552
2,
861,
868
2,91
3,16
0
Dis
trib
utio
n b
y M
oth
er's
Ag
e (%
)10
0.0
100.
0
100.
010
0.0
10
0.0
100.
0
10
to
14
Year
s o
f A
ge
0.6
0.6
0.5
0.5
0.9
1.0
15
to
19
Year
s o
f A
ge
16.2
15.8
13.3
13.1
18.4
18.3
20
to
24
Year
s o
f A
ge
26.4
25.6
23.7
22.7
27.7
26.7
25
to
29
Year
s o
f A
ge
25.8
25.5
25.9
25.0
25.1
25.0
30
to
34
Year
s o
f A
ge
19.2
20.0
22.5
23.7
17.5
18.1
35
to
39
Year
s o
f A
ge
9.3
9.7
11.4
11.9
8.2
8.6
40
to
44
Year
s o
f A
ge
2.4
2.5
2.7
3.0
2.1
2.1
45
to
49
Year
s o
f A
ge
0.1
0.2
0.2
0.2
0.1
0.1
50
Yea
rs o
f A
ge
and
Ove
r 0.
00.
00.
00.
00.
00.
0
A
ge
Unk
now
n0.
00.
00.
00.
00.
00.
0
Sou
rce:
MS
/SV
S/D
AS
IS, L
ive
Birt
hs In
form
atio
n S
yste
m -
SIN
AS
C. P
rod
uced
by
the
Cen
tre
for
Sta
tistic
s an
d In
form
atio
n (C
EI)
at t
he J
oão
Pin
heiro
Fou
ndat
ion
(FJP
).
(1) D
ata
up t
o d
ate.
7.2.
3 H
ealth
Sta
tistic
sTa
ble
1: N
umbe
r an
d D
istr
ibut
ion
of L
ive
Birt
hs, b
y m
othe
r’s a
geM
inas
Ger
ais,
Bel
o H
oriz
onte
Met
ropo
litan
Are
a (R
MB
H) a
nd B
razi
l - 2
010-
2011
(1)
7. Demographic and Socioeconomic Features of the Population
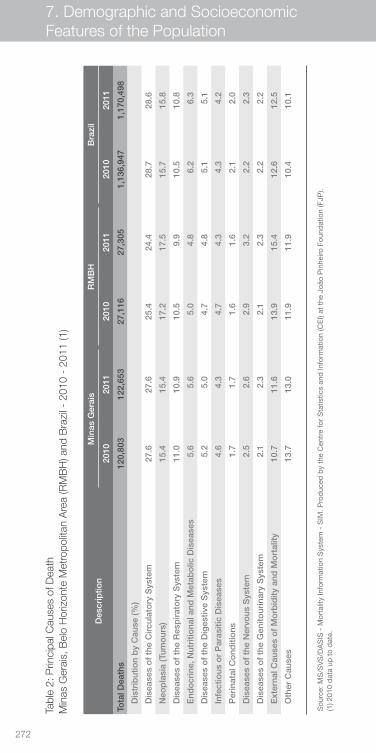
272
Des
crip
tion
Min
as G
erai
sR
MB
HB
razi
l
2010
2011
2010
2011
2010
2011
Tota
l Dea
ths
120,
803
122,
653
27,1
1627
,305
1,13
6,94
71,
170,
498
D
istr
ibut
ion
by
Cau
se (%
)
D
isea
ses
of
the
Circ
ulat
ory
Sys
tem
27.6
27.6
25.4
24.4
28.7
28.6
N
eop
lasi
a (T
umo
urs)
15.4
15.4
17.2
17.5
15.7
15.8
D
isea
ses
of
the
Res
pir
ato
ry S
yste
m11
.010
.910
.59.
910
.510
.8
E
ndo
crin
e, N
utri
tiona
l and
Met
abo
lic D
isea
ses
5.6
5.6
5.0
4.8
6.2
6.3
D
isea
ses
of
the
Dig
estiv
e S
yste
m5.
25.
04.
74.
85.
15.
1
In
fect
ious
or
Par
asiti
c D
isea
ses
4.6
4.3
4.7
4.3
4.3
4.2
P
erin
atal
Co
nditi
ons
1.7
1.7
1.6
1.6
2.1
2.0
D
isea
ses
of
the
Ner
vous
Sys
tem
2.5
2.6
2.9
3.2
2.2
2.3
D
isea
ses
of
the
Gen
itour
inar
y S
yste
m2.
12.
32.
12.
32.
22.
2
E
xter
nal C
ause
s o
f M
orb
idity
and
Mo
rtal
ity10
.711
.613
.915
.412
.612
.5
O
ther
Cau
ses
13.7
13.0
11.9
11.9
10.4
10.1
Sou
rce:
MS
/SV
S/D
AS
IS -
Mor
talit
y In
form
atio
n S
yste
m -
SIM
. Pro
duc
ed b
y th
e C
entr
e fo
r S
tatis
tics
and
Info
rmat
ion
(CE
I) at
the
Joã
o P
inhe
iro F
ound
atio
n (F
JP).
(1) 2
010
dat
a up
to
dat
e.
Tabl
e 2:
Prin
cipa
l Cau
ses
of D
eath
Min
as G
erai
s, B
elo
Hor
izon
te M
etro
polit
an A
rea
(RM
BH
) and
Bra
zil -
201
0 -
2011
(1)
7. Demographic and Socioeconomic Features of the Population
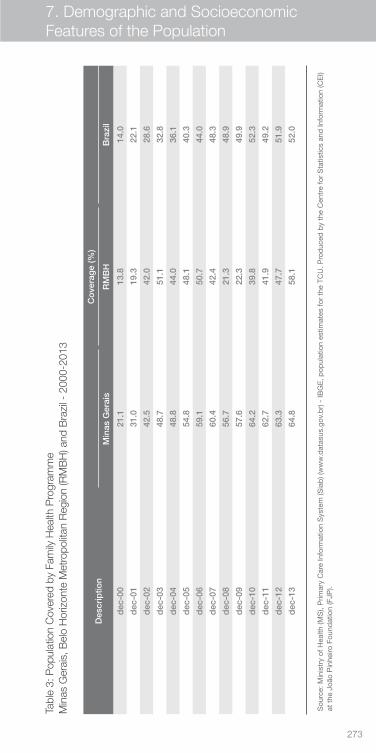
273
Sou
rce:
MS
/SV
S/D
AS
IS -
Mor
talit
y In
form
atio
n S
yste
m -
SIM
. Pro
duc
ed b
y th
e C
entr
e fo
r S
tatis
tics
and
Info
rmat
ion
(CE
I) at
the
Joã
o P
inhe
iro F
ound
atio
n (F
JP).
(1) 2
010
dat
a up
to
dat
e.
Des
crip
tion
C
ove
rag
e (%
)
Min
as G
erai
sR
MB
HB
razi
l
dec
-00
21.1
13.8
14.0
dec
-01
31.0
19.3
22.1
dec
-02
42.5
42.0
28.6
dec
-03
48.7
51.1
32.8
dec
-04
48.8
44.0
36.1
dec
-05
54.8
48.1
40.3
dec
-06
59.1
50.7
44.0
dec
-07
60.4
42.4
48.3
dec
-08
56.7
21.3
48.9
dec
-09
57.6
22.3
49.9
dec
-10
64.2
39.8
52.3
dec
-11
62.7
41.9
49.2
dec
-12
63.3
47.7
51.9
dec
-13
64.8
58.1
52.0
Sou
rce:
Min
istr
y of
Hea
lth (M
S),
Prim
ary
Car
e In
form
atio
n S
yste
m (S
iab
) (w
ww
.dat
asus
.gov
.br)
- IB
GE
, pop
ulat
ion
estim
ates
for
the
TCU
. Pro
duc
ed b
y th
e C
entr
e fo
r S
tatis
tics
and
Info
rmat
ion
(CE
I) at
the
Joã
o P
inhe
iro F
ound
atio
n (F
JP).
Tabl
e 3:
Pop
ulat
ion
Cov
ered
by
Fam
ily H
ealth
Pro
gram
me
Min
as G
erai
s, B
elo
Hor
izon
te M
etro
polit
an R
egio
n (R
MB
H) a
nd B
razi
l - 2
000-
2013
7. Demographic and Socioeconomic Features of the Population
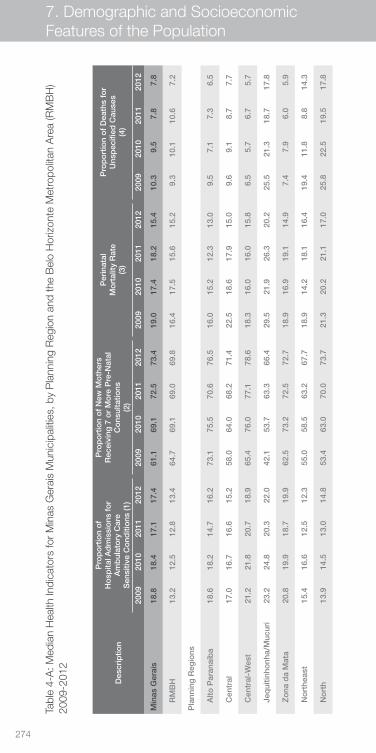
274
Tabl
e 4-
A: M
edia
n H
ealth
Indi
cato
rs fo
r M
inas
Ger
ais
Mun
icip
aliti
es, b
y P
lann
ing
Reg
ion
and
the
Bel
o H
oriz
onte
Met
ropo
litan
Are
a (R
MB
H)
2009
-201
2
Des
crip
tion
Pro
po
rtio
n o
f H
osp
ital A
dm
issi
ons
fo
r A
mb
ulat
ory
Car
e S
ensi
tive
Co
nditi
ons
(1)
P
rop
ort
ion
of
New
Mo
ther
s R
ecei
ving
7 o
r M
ore
Pre
-Nat
al
Co
nsul
tatio
ns
(2)
P
erin
atal
M
ort
ality
Rat
e (3
)
P
rop
ort
ion
of
Dea
ths
for
Uns
pec
ified
Cau
ses
(4)
2009
2010
2011
2012
20
0920
1020
1120
12
2009
2010
2011
2012
20
0920
1020
1120
12
Min
as G
erai
s18
.818
.417
.117
.461
.169
.172
.573
.419
.017
.418
.215
.410
.39.
57.
87.
8
R
MB
H13
.212
.512
.813
.464
.769
.169
.069
.816
.417
.515
.615
.29.
310
.110
.67.
2
Pla
nnin
g R
egio
ns
A
lto P
aran
aíb
a18
.618
.214
.716
.273
.175
.570
.676
.516
.015
.212
.313
.09.
57.
17.
36.
5
C
entr
al17
.016
.716
.615
.258
.064
.068
.271
.422
.518
.617
.915
.09.
69.
18.
77.
7
C
entr
al-W
est
21.2
21.8
20.7
18.9
65.4
76.0
77.1
78.6
18.3
16.0
16.0
15.8
6.5
5.7
6.7
5.7
Je
qui
tinho
nha/
Muc
uri
23.2
24.8
20.3
22.0
42.1
53.7
63.3
66.4
29.5
21.9
26.3
20.2
25.5
21.3
18.7
17.8
Z
ona
da
Mat
a20
.819
.918
.719
.962
.573
.272
.572
.718
.916
.919
.114
.97.
47.
96.
05.
9
N
ort
heas
t15
.416
.612
.512
.355
.058
.563
.267
.718
.914
.218
.116
.419
.411
.88.
814
.3
N
ort
h13
.914
.513
.014
.853
.463
.070
.073
.721
.320
.221
.117
.025
.822
.519
.517
.8
7. Demographic and Socioeconomic Features of the Population
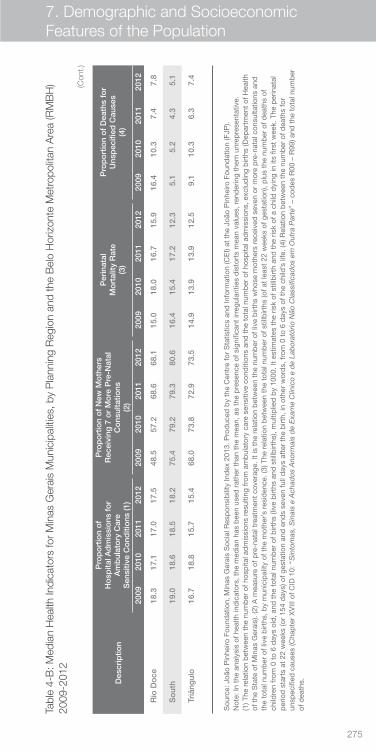
275
Tabl
e 4-
B: M
edia
n H
ealth
Indi
cato
rs fo
r M
inas
Ger
ais
Mun
icip
aliti
es, b
y P
lann
ing
Reg
ion
and
the
Bel
o H
oriz
onte
Met
ropo
litan
Are
a (R
MB
H)
2009
-201
2
Des
crip
tion
Pro
po
rtio
n o
f H
osp
ital A
dm
issi
ons
fo
r A
mb
ulat
ory
Car
e S
ensi
tive
Co
nditi
ons
(1)
P
rop
ort
ion
of
New
Mo
ther
s R
ecei
ving
7 o
r M
ore
Pre
-Nat
al
Co
nsul
tatio
ns
(2)
P
erin
atal
M
ort
ality
Rat
e (3
)
P
rop
ort
ion
of
Dea
ths
for
Uns
pec
ified
Cau
ses
(4)
2009
2010
2011
2012
20
0920
1020
1120
12
2009
2010
2011
2012
20
0920
1020
1120
12
R
io D
oce
18.3
17.1
17.0
17.5
48.5
57.2
68.6
68.1
15.0
18.0
16.7
15.9
16.4
10.3
7.4
7.8
S
out
h19
.018
.618
.518
.275
.479
.279
.380
.616
.415
.417
.212
.35.
15.
24.
35.
1
Tr
iâng
ulo
16.7
18.8
15.7
15.4
68.0
73.8
72.9
73.5
14.9
13.9
13.9
12.5
9.1
10.3
6.3
7.4
(Con
t.)
Sou
rce:
Joã
o P
inhe
iro F
ound
atio
n, M
inas
Ger
ais
Soc
ial R
esp
onsi
bili
ty In
dex
201
3. P
rod
uced
by
the
Cen
tre
for
Sta
tistic
s an
d In
form
atio
n (C
EI)
at t
he J
oão
Pin
heiro
Fou
ndat
ion
(FJP
). N
ote:
In t
he a
naly
sis
of h
ealth
ind
icat
ors,
the
med
ian
has
bee
n us
ed r
athe
r th
an t
he m
ean,
as
the
pre
senc
e of
sig
nific
ant
irreg
ular
ities
dis
tort
s m
ean
valu
es, r
end
erin
g th
em u
nrep
rese
ntat
ive.
(1
) The
rel
atio
n b
etw
een
the
num
ber
of h
osp
ital a
dm
issi
ons
resu
lting
from
am
bul
ator
y ca
re s
ensi
tive
cond
ition
s an
d t
he t
otal
num
ber
of h
osp
ital a
dm
issi
ons,
exc
lud
ing
birt
hs (D
epar
tmen
t of
Hea
lth
of t
he S
tate
of M
inas
Ger
ais)
. (2)
A m
easu
re o
f pre
-nat
al t
reat
men
t co
vera
ge. I
t is
the
rel
atio
n b
etw
een
the
num
ber
of l
ive
birt
hs w
hose
mot
hers
rec
eive
d s
even
or
mor
e p
re-n
atal
con
sulta
tions
and
th
e to
tal n
umb
er o
f liv
e b
irths
, by
mun
icip
ality
of t
he m
othe
r’s r
esid
ence
. (3)
The
rel
atio
n b
etw
een
the
tota
l num
ber
of s
tillb
irths
(of a
t le
ast
22 w
eeks
of g
esta
tion)
, plu
s th
e nu
mb
er o
f dea
ths
of
child
ren
from
0 t
o 6
day
s ol
d, a
nd t
he t
otal
num
ber
of b
irths
(liv
e b
irths
and
stil
lbirt
hs),
mul
tiplie
d b
y 10
00. I
t es
timat
es t
he r
isk
of s
tillb
irth
and
the
ris
k of
a c
hild
dyi
ng in
its
first
wee
k. T
he p
erin
atal
p
erio
d s
tart
s at
22
wee
ks (o
r 15
4 d
ays)
of g
esta
tion
and
end
s se
ven
full
day
s af
ter
the
birt
h, in
oth
er w
ord
s, fr
om 0
to
6 d
ays
of t
he c
hild
’s li
fe. (
4) R
elat
ion
bet
wee
n th
e nu
mb
er o
f dea
ths
for
unsp
ecifi
ed c
ause
s (C
hap
ter
XV
III o
f CID
10:
“S
into
mas
, Sin
ais
e A
chad
os A
norm
ais
de
Exa
me
Clín
ico
e d
e La
bor
atór
io N
ão C
lass
ifica
dos
em
Out
ra P
arte
” –
cod
es R
00 –
R99
) and
the
tot
al n
umb
er
of d
eath
s.
7. Demographic and Socioeconomic Features of the Population
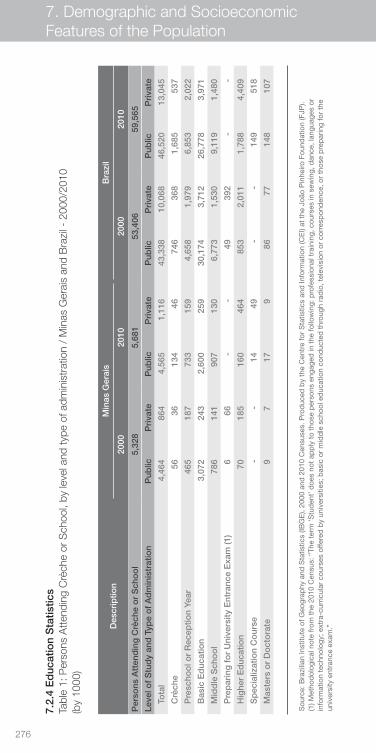
276
Des
crip
tion
Min
as G
erai
sB
razi
l
2000
2010
2000
2010
Per
sons
Att
end
ing
Crè
che
or
Sch
oo
l5,
328
5,68
1
53,4
0659
,565
Leve
l of
Stu
dy
and
Typ
e o
f A
dm
inis
trat
ion
Pub
licP
riva
teP
ublic
Pri
vate
P
ublic
Pri
vate
Pub
licP
riva
te
To
tal
4,46
486
44,
565
1,11
643
,338
10,0
6846
,520
13,0
45
C
rèch
e56
3613
446
746
368
1,68
553
7
P
resc
hoo
l or
Rec
eptio
n Ye
ar46
518
773
315
94,
658
1,97
96,
853
2,02
2
B
asic
Ed
ucat
ion
3,07
224
32,
600
259
30,1
743,
712
26,7
783,
971
M
idd
le S
cho
ol
786
141
907
130
6,77
31,
530
9,11
91,
480
P
rep
arin
g f
or
Uni
vers
ity E
ntra
nce
Exa
m (1
)6
66-
-49
392
--
H
ighe
r E
duc
atio
n70
185
160
464
853
2,01
11,
788
4,40
9
S
pec
ializ
atio
n C
our
se-
-14
49-
-14
951
8
M
aste
rs o
r D
oct
ora
te9
717
986
7714
810
7
Sou
rce:
Bra
zilia
n In
stitu
te o
f Geo
grap
hy a
nd S
tatis
tics
(IBG
E),
2000
and
201
0 C
ensu
ses.
Pro
duc
ed b
y th
e C
entr
e fo
r S
tatis
tics
and
Info
rmat
ion
(CE
I) at
the
Joã
o P
inhe
iro F
ound
atio
n (F
JP).
(1) M
etho
dol
ogic
al n
ote
from
the
201
0 C
ensu
s: “
The
term
‘Stu
den
t’ d
oes
not
app
ly t
o th
ose
per
sons
eng
aged
in t
he fo
llow
ing:
pro
fess
iona
l tra
inin
g, c
ours
es in
sew
ing,
dan
ce, l
angu
ages
or
info
rmat
ion
tech
nolo
gy; e
xtra
-cur
ricul
ar c
ours
es o
ffere
d b
y un
iver
sitie
s; b
asic
or
mid
dle
sch
ool e
duc
atio
n co
nduc
ted
thr
ough
rad
io, t
elev
isio
n or
cor
resp
ond
ence
, or
thos
e p
rep
arin
g fo
r th
e un
iver
sity
ent
ranc
e ex
am.”
7.2.
4 E
duc
atio
n S
tatis
tics
Tabl
e 1:
Per
sons
Att
endi
ng C
rèch
e or
Sch
ool,
by le
vel a
nd ty
pe o
f adm
inis
trat
ion
/ M
inas
Ger
ais
and
Bra
zil -
200
0/20
10
(by
1000
)
7. Demographic and Socioeconomic Features of the Population
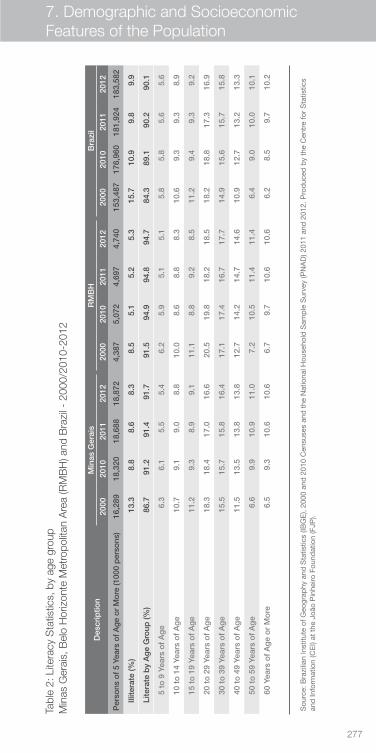
277
Sou
rce:
Bra
zilia
n In
stitu
te o
f Geo
grap
hy a
nd S
tatis
tics
(IBG
E),
2000
and
201
0 C
ensu
ses.
Pro
duc
ed b
y th
e C
entr
e fo
r S
tatis
tics
and
Info
rmat
ion
(CE
I) at
the
Joã
o P
inhe
iro F
ound
atio
n (F
JP).
(1) M
etho
dol
ogic
al n
ote
from
the
201
0 C
ensu
s: “
The
term
‘Stu
den
t’ d
oes
not
app
ly t
o th
ose
per
sons
eng
aged
in t
he fo
llow
ing:
pro
fess
iona
l tra
inin
g, c
ours
es in
sew
ing,
dan
ce, l
angu
ages
or
info
rmat
ion
tech
nolo
gy; e
xtra
-cur
ricul
ar c
ours
es o
ffere
d b
y un
iver
sitie
s; b
asic
or
mid
dle
sch
ool e
duc
atio
n co
nduc
ted
thr
ough
rad
io, t
elev
isio
n or
cor
resp
ond
ence
, or
thos
e p
rep
arin
g fo
r th
e un
iver
sity
ent
ranc
e ex
am.”
Sou
rce:
Bra
zilia
n In
stitu
te o
f Geo
grap
hy a
nd S
tatis
tics
(IBG
E),
2000
and
201
0 C
ensu
ses
and
the
Nat
iona
l Hou
seho
ld S
amp
le S
urve
y (P
NA
D) 2
011
and
201
2. P
rod
uced
by
the
Cen
tre
for
Sta
tistic
s an
d In
form
atio
n (C
EI)
at t
he J
oão
Pin
heiro
Fou
ndat
ion
(FJP
).
Tabl
e 2:
Lite
racy
Sta
tistic
s, b
y ag
e gr
oup
Min
as G
erai
s, B
elo
Hor
izon
te M
etro
polit
an A
rea
(RM
BH
) and
Bra
zil -
200
0/20
10-2
012
Des
crip
tion
Min
as G
erai
s
RM
BH
B
razi
l
2000
2010
2011
2012
20
0020
1020
1120
12
2000
2010
2011
2012
Per
sons
of 5
Yea
rs o
f Age
or
Mor
e (1
000
per
sons
)16
,289
18,3
2018
,688
18,8
724,
387
5,07
24,
697
4,74
015
3,48
717
6,96
018
1,92
418
3,58
2
Ill
itera
te (%
)13
.38.
88.
68.
38.
55.
15.
25.
315
.710
.99.
89.
9
Li
tera
te b
y A
ge
Gro
up (%
)86
.791
.291
.491
.791
.594
.994
.894
.784
.389
.190
.290
.1
5 to
9 Y
ears
of
Ag
e6.
36.
15.
55.
46.
25.
95.
15.
15.
85.
85.
65.
6
10 t
o 1
4 Ye
ars
of
Ag
e10
.79.
19.
08.
810
.08.
68.
88.
310
.69.
39.
38.
9
15 t
o 1
9 Ye
ars
of
Ag
e11
.29.
38.
99.
111
.18.
89.
28.
511
.29.
49.
39.
2
20 t
o 2
9 Ye
ars
of
Ag
e18
.318
.417
.016
.620
.519
.818
.218
.518
.218
.817
.316
.9
30 t
o 3
9 Ye
ars
of
Ag
e15
.515
.715
.816
.417
.117
.416
.717
.714
.915
.615
.715
.8
40 t
o 4
9 Ye
ars
of
Ag
e11
.513
.513
.813
.812
.714
.214
.714
.610
.912
.713
.213
.3
50 t
o 5
9 Ye
ars
of
Ag
e6.
69.
910
.911
.07.
210
.511
.411
.46.
49.
010
.010
.1
60 Y
ears
of
Ag
e o
r M
ore
6.5
9.3
10.6
10.6
6.7
9.7
10.6
10.6
6.2
8.5
9.7
10.2
7. Demographic and Socioeconomic Features of the Population
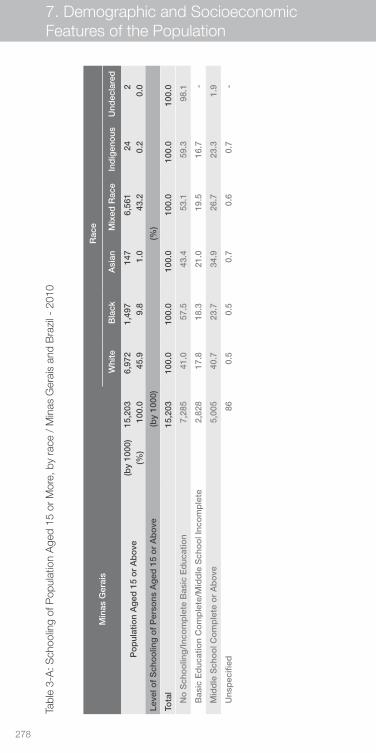
278
Min
as G
erai
s
R
ace
Whi
teB
lack
Asi
anM
ixed
Rac
e In
dig
eno
usU
ndec
lare
d
Po
pul
atio
n A
ged
15
or
Ab
ove
(by
1000
)15
,203
6,97
21,
497
147
6,56
124
2(%
)10
0.0
45.9
9.8
1.0
43.2
0.2
0.0
Leve
l of
Sch
oo
ling
of
Per
sons
Ag
ed 1
5 o
r A
bo
ve
(by
1000
)
(%
)
Tota
l
15,2
0310
0.0
100.
010
0.0
100.
010
0.0
100.
0
N
o S
cho
olin
g/I
nco
mp
lete
Bas
ic E
duc
atio
n
7,28
541
.057
.543
.453
.159
.398
.1
B
asic
Ed
ucat
ion
Co
mp
lete
/Mid
dle
Sch
oo
l Inc
om
ple
te
2,82
817
.818
.321
.019
.516
.7-
M
idd
le S
cho
ol C
om
ple
te o
r A
bo
ve
5,00
540
.723
.734
.926
.723
.31.
9
U
nsp
ecifi
ed
860.
50.
50.
70.
60.
7-
Tabl
e 3-
A: S
choo
ling
of P
opul
atio
n A
ged
15 o
r M
ore,
by
race
/ M
inas
Ger
ais
and
Bra
zil -
201
0
7. Demographic and Socioeconomic Features of the Population
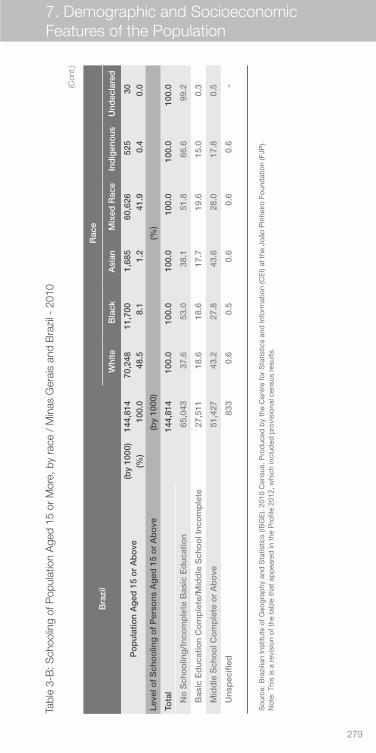
279
Bra
zil
Rac
e
Whi
teB
lack
Asi
anM
ixed
Rac
e In
dig
eno
usU
ndec
lare
d
Po
pul
atio
n A
ged
15
or
Ab
ove
(by
1000
)14
4,81
470
,248
11,7
001,
685
60,6
2652
530
(%)
100.
048
.58.
11.
241
.90.
40.
0
Leve
l of
Sch
oo
ling
of
Per
sons
Ag
ed 1
5 o
r A
bo
ve
(by
1000
)
(%
)
Tota
l
144,
814
100.
010
0.0
100.
010
0.0
100.
010
0.0
N
o S
cho
olin
g/I
nco
mp
lete
Bas
ic E
duc
atio
n
65,0
4337
.653
.038
.151
.866
.699
.2
B
asic
Ed
ucat
ion
Co
mp
lete
/Mid
dle
Sch
oo
l Inc
om
ple
te
27,5
1118
.618
.617
.719
.615
.00.
3
M
idd
le S
cho
ol C
om
ple
te o
r A
bo
ve
51,4
2743
.227
.843
.628
.017
.80.
5
U
nsp
ecifi
ed
833
0.6
0.5
0.6
0.6
0.6
-
Sou
rce:
Bra
zilia
n In
stitu
te o
f Geo
grap
hy a
nd S
tatis
tics
(IBG
E).
2010
Cen
sus.
Pro
duc
ed b
y th
e C
entr
e fo
r S
tatis
tics
and
Info
rmat
ion
(CE
I) at
the
Joã
o P
inhe
iro F
ound
atio
n (F
JP).
Not
e: T
his
is a
rev
isio
n of
the
tab
le t
hat
app
eare
d in
the
Pro
file
2012
, whi
ch in
clud
ed p
rovi
sion
al c
ensu
s re
sults
.
Tabl
e 3-
B: S
choo
ling
of P
opul
atio
n A
ged
15 o
r M
ore,
by
race
/ M
inas
Ger
ais
and
Bra
zil -
201
0
(Con
t.)
7. Demographic and Socioeconomic Features of the Population
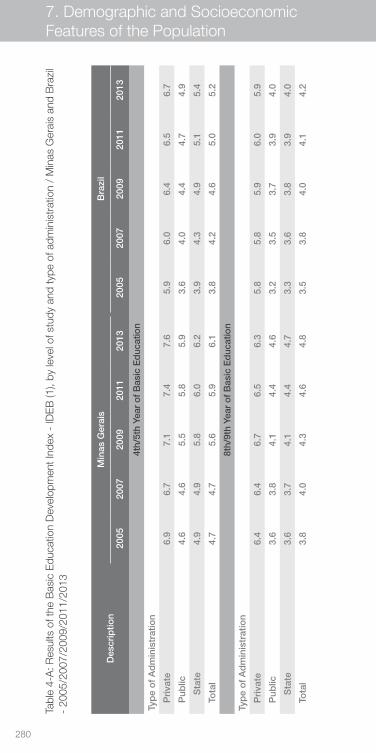
280
Tabl
e 4-
A: R
esul
ts o
f the
Bas
ic E
duca
tion
Dev
elop
men
t Ind
ex -
IDE
B (1
), by
leve
l of s
tudy
and
type
of a
dmin
istr
atio
n /
Min
as G
erai
s an
d B
razi
l -
2005
/200
7/20
09/2
011/
2013
Des
crip
tion
Min
as G
erai
s
Bra
zil
2005
2007
2009
2011
2013
20
0520
0720
0920
1120
13
4th/
5th
Year
of B
asic
Ed
ucat
ion
Typ
e o
f A
dm
inis
trat
ion
P
riva
te6.
96.
77.
17.
47.
65.
96.
06.
46.
56.
7
P
ublic
4.6
4.6
5.5
5.8
5.9
3.6
4.0
4.4
4.7
4.9
Sta
te4.
94.
95.
86.
06.
23.
94.
34.
95.
15.
4
To
tal
4.7
4.7
5.6
5.9
6.1
3.8
4.2
4.6
5.0
5.2
8th/
9th
Year
of B
asic
Ed
ucat
ion
Typ
e o
f A
dm
inis
trat
ion
P
riva
te6.
46.
46.
76.
56.
35.
85.
85.
96.
05.
9
P
ublic
3.6
3.8
4.1
4.4
4.6
3.2
3.5
3.7
3.9
4.0
Sta
te3.
63.
74.
14.
44.
73.
33.
63.
83.
94.
0
To
tal
3.8
4.0
4.3
4.6
4.8
3.5
3.8
4.0
4.1
4.2
7. Demographic and Socioeconomic Features of the Population
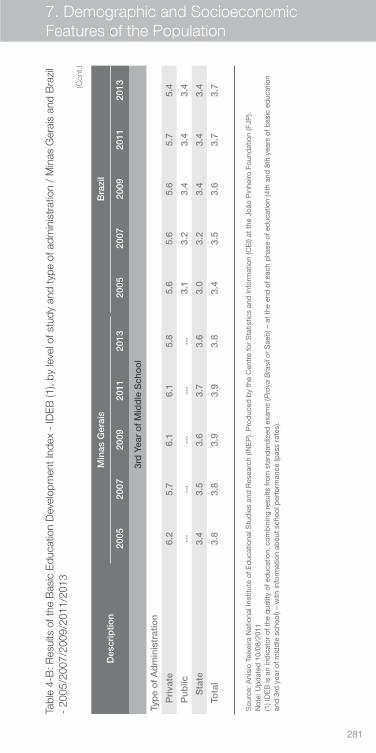
281
Des
crip
tion
Min
as G
erai
s
Bra
zil
2005
2007
2009
2011
2013
20
0520
0720
0920
1120
13
4th/
5th
Year
of B
asic
Ed
ucat
ion
Typ
e o
f A
dm
inis
trat
ion
P
riva
te6.
96.
77.
17.
47.
65.
96.
06.
46.
56.
7
P
ublic
4.6
4.6
5.5
5.8
5.9
3.6
4.0
4.4
4.7
4.9
Sta
te4.
94.
95.
86.
06.
23.
94.
34.
95.
15.
4
To
tal
4.7
4.7
5.6
5.9
6.1
3.8
4.2
4.6
5.0
5.2
8th/
9th
Year
of B
asic
Ed
ucat
ion
Typ
e o
f A
dm
inis
trat
ion
P
riva
te6.
46.
46.
76.
56.
35.
85.
85.
96.
05.
9
P
ublic
3.6
3.8
4.1
4.4
4.6
3.2
3.5
3.7
3.9
4.0
Sta
te3.
63.
74.
14.
44.
73.
33.
63.
83.
94.
0
To
tal
3.8
4.0
4.3
4.6
4.8
3.5
3.8
4.0
4.1
4.2
Tabl
e 4-
B: R
esul
ts o
f the
Bas
ic E
duca
tion
Dev
elop
men
t Ind
ex -
IDE
B (1
), by
leve
l of s
tudy
and
type
of a
dmin
istr
atio
n /
Min
as G
erai
s an
d B
razi
l -
2005
/200
7/20
09/2
011/
2013
(Con
t.)
Des
crip
tion
Min
as G
erai
s
Bra
zil
2005
2007
2009
2011
2013
20
0520
0720
0920
1120
13
3rd
Yea
r of
Mid
dle
Sch
ool
Typ
e o
f A
dm
inis
trat
ion
P
riva
te6.
25.
76.
16.
15.
85.
65.
65.
65.
75.
4
P
ublic
......
......
...3.
13.
23.
43.
43.
4
Sta
te3.
43.
53.
63.
73.
63.
03.
23.
43.
43.
4
To
tal
3.8
3.8
3.9
3.9
3.8
3.4
3.5
3.6
3.7
3.7
Sou
rce:
Aní
sio
Teix
eira
Nat
iona
l Ins
titut
e of
Ed
ucat
iona
l Stu
die
s an
d R
esea
rch
(INE
P).
Pro
duc
ed b
y th
e C
entr
e fo
r S
tatis
tics
and
Info
rmat
ion
(CE
I) at
the
Joã
o P
inhe
iro F
ound
atio
n (F
JP).
Not
e: U
pd
ated
10/
08/2
011
(1) I
DE
B is
an
ind
icat
or o
f the
qua
lity
of e
duc
atio
n, c
omb
inin
g re
sults
from
sta
ndar
diz
ed e
xam
s (P
rova
Bra
sil o
r S
aeb
) – a
t th
e en
d o
f eac
h p
hase
of e
duc
atio
n (4
th a
nd 8
th y
ears
of b
asic
ed
ucat
ion
and
3rd
yea
r of
mid
dle
sch
ool)
– w
ith in
form
atio
n ab
out
scho
ol p
erfo
rman
ce (p
ass
rate
s).
7. Demographic and Socioeconomic Features of the Population
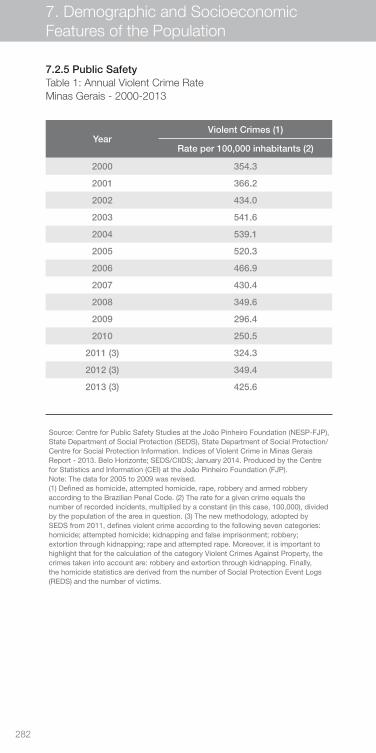
282
YearViolent Crimes (1)
Rate per 100,000 inhabitants (2)
2000 354.3
2001 366.2
2002 434.0
2003 541.6
2004 539.1
2005 520.3
2006 466.9
2007 430.4
2008 349.6
2009 296.4
2010 250.5
2011 (3) 324.3
2012 (3) 349.4
2013 (3) 425.6
7.2.5 Public SafetyTable 1: Annual Violent Crime RateMinas Gerais - 2000-2013
Source: Centre for Public Safety Studies at the João Pinheiro Foundation (NESP-FJP), State Department of Social Protection (SEDS), State Department of Social Protection/Centre for Social Protection Information. Indices of Violent Crime in Minas Gerais Report - 2013. Belo Horizonte; SEDS/CIIDS; January 2014. Produced by the Centre for Statistics and Information (CEI) at the João Pinheiro Foundation (FJP). Note: The data for 2005 to 2009 was revised. (1) Defined as homicide, attempted homicide, rape, robbery and armed robbery according to the Brazilian Penal Code. (2) The rate for a given crime equals the number of recorded incidents, multiplied by a constant (in this case, 100,000), divided by the population of the area in question. (3) The new methodology, adopted by SEDS from 2011, defines violent crime according to the following seven categories: homicide; attempted homicide; kidnapping and false imprisonment; robbery; extortion through kidnapping; rape and attempted rape. Moreover, it is important to highlight that for the calculation of the category Violent Crimes Against Property, the crimes taken into account are: robbery and extortion through kidnapping. Finally, the homicide statistics are derived from the number of Social Protection Event Logs (REDS) and the number of victims.
7. Demographic and Socioeconomic Features of the Population
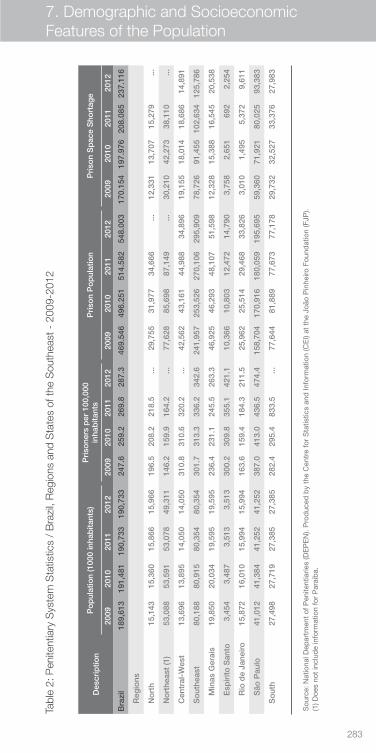
283
Tabl
e 2:
Pen
itent
iary
Sys
tem
Sta
tistic
s /
Bra
zil,
Reg
ions
and
Sta
tes
of th
e S
outh
east
- 2
009-
2012
Des
crip
tion
Po
pul
atio
n (1
000
inha
bita
nts)
P
riso
ners
per
100
,000
in
hab
itant
s
Pri
son
Po
pul
atio
n
Pri
son
Sp
ace
Sho
rtag
e
2009
2010
2011
2012
20
0920
1020
1120
12
2009
2010
2011
2012
20
0920
1020
1120
12
Bra
zil
189,
613
191,
481
190,
733
190,
733
247.
625
9.2
269.
828
7.3
469.
546
496.
251
514.
582
548.
003
170.
154
197.
976
208.
085
237.
116
R
egio
ns
N
ort
h15
,143
15,3
6015
,866
15,9
6619
6.5
208.
221
8.5
...29
,755
31,9
7734
,666
...12
,331
13,7
0715
,279
...
N
ort
heas
t (1
)53
,088
53,5
9153
,078
49,3
1114
6.2
159.
916
4.2
...77
,628
85,6
9887
,149
...30
,210
42,2
7338
,110
...
C
entr
al-W
est
13,6
9613
,895
14,0
5014
,050
310.
831
0.6
320.
2...
42,5
6243
,161
44,9
8834
,896
19,1
5518
,014
18,6
8614
,891
S
out
heas
t80
,188
80,9
1580
,354
80,3
5430
1.7
313.
333
6.2
342.
624
1,95
725
3,52
627
0,10
629
5,90
978
,726
91,4
5510
2,63
412
5,78
6
Min
as G
erai
s19
,850
20,0
3419
,595
19,5
9523
6.4
231.
124
5.5
263.
346
,925
46,2
9348
,107
51,5
9812
,328
15,3
8816
,545
20,5
38
Esp
írito
San
to3,
454
3,48
73,
513
3,51
330
0.2
309.
835
5.1
421.
110
,366
10,8
0312
,472
14,7
903,
758
2,65
169
22,
254
Rio
de
Jane
iro15
,872
16,0
1015
,994
15,9
9416
3.6
159.
418
4.3
211.
525
,962
25,5
1429
,468
33,8
263,
010
1,49
55,
372
9,61
1
São
Pau
lo41
,012
41,3
8441
,252
41,2
5238
7.0
413.
043
6.5
474.
415
8,70
417
0,91
618
0,05
919
5,69
559
,360
71,9
2180
,025
93,3
83
S
out
h27
,498
27,7
1927
,385
27,3
8528
2.4
295.
483
3.5
...77
,644
81,8
8977
,673
77,1
7829
,732
32,5
2733
,376
27,9
83
Sou
rce:
Nat
iona
l Dep
artm
ent
of P
enite
ntia
ries
(DE
PE
N).
Pro
duc
ed b
y th
e C
entr
e fo
r S
tatis
tics
and
Info
rmat
ion
(CE
I) at
the
Joã
o P
inhe
iro F
ound
atio
n (F
JP).
(1) D
oes
not
incl
ude
info
rmat
ion
for
Par
aíb
a.
7. Demographic and Socioeconomic Features of the Population
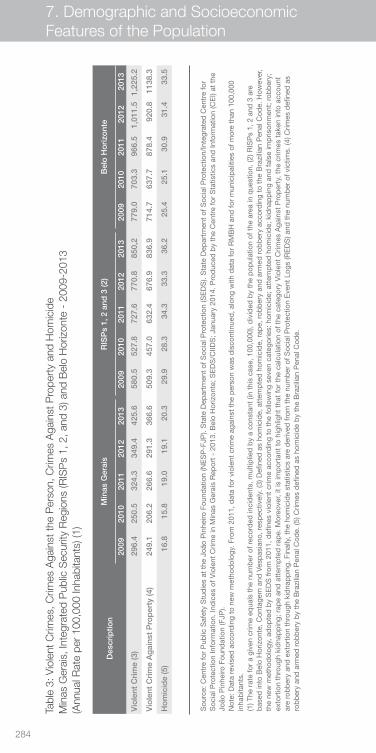
284
Tabl
e 3:
Vio
lent
Crim
es, C
rimes
Aga
inst
the
Per
son,
Crim
es A
gain
st P
rope
rty
and
Hom
icid
eM
inas
Ger
ais,
Inte
grat
ed P
ublic
Sec
urity
Reg
ions
(RIS
Ps
1, 2
, and
3) a
nd B
elo
Hor
izon
te -
200
9-20
13
(Ann
ual R
ate
per
100,
000
Inha
bita
nts)
(1)
Des
crip
tion
Min
as G
erai
s
RIS
Ps
1, 2
and
3 (2
)
Bel
o H
ori
zont
e
20
0920
1020
1120
1220
13
2009
2010
2011
2012
2013
20
0920
1020
1120
1220
13
Vio
lent
Cri
me
(3)
296.
425
0.5
324.
334
9.4
425.
658
0.5
527.
872
7.6
770.
885
0,2
779.
070
3.3
966.
51,
011.
51,
225.
2
Vio
lent
Cri
me
Ag
ains
t P
rop
erty
(4)
249.
120
6.2
266.
629
1.3
366.
650
9.3
457.
063
2.4
676.
983
6.9
714.
763
7.7
878.
492
0.8
1138
.3
Ho
mic
ide
(5)
16.8
15.8
19.0
19.1
20.3
29.9
28.3
34.3
33.3
36.2
25.4
25.1
30.9
31.4
33.5
Sou
rce:
Cen
tre
for
Pub
lic S
afet
y S
tud
ies
at t
he J
oão
Pin
heiro
Fou
ndat
ion
(NE
SP
-FJP
). S
tate
Dep
artm
ent
of S
ocia
l Pro
tect
ion
(SE
DS
). S
tate
Dep
artm
ent
of S
ocia
l Pro
tect
ion/
Inte
grat
ed C
entr
e fo
r S
ocia
l Pro
tect
ion
Info
rmat
ion.
Ind
ices
of V
iole
nt C
rime
in M
inas
Ger
ais
Rep
ort
- 20
13. B
elo
Hor
izon
te; S
ED
S/C
IIDS
; Jan
uary
201
4. P
rod
uced
by
the
Cen
tre
for
Sta
tistic
s an
d In
form
atio
n (C
EI)
at t
he
João
Pin
heiro
Fou
ndat
ion
(FJP
). N
ote:
Dat
a re
vise
d a
ccor
din
g to
new
met
hod
olog
y. F
rom
201
1, d
ata
for
viol
ent
crim
e ag
ains
t th
e p
erso
n w
as d
isco
ntin
ued
, alo
ng w
ith d
ata
for
RM
BH
and
for
mun
icip
aliti
es o
f mor
e th
an 1
00,0
00
inha
bita
nts.
(1
) The
rat
e fo
r a
give
n cr
ime
equa
ls t
he n
umb
er o
f rec
ord
ed in
cid
ents
, mul
tiplie
d b
y a
cons
tant
(in
this
cas
e, 1
00,0
00),
div
ided
by
the
pop
ulat
ion
of t
he a
rea
in q
uest
ion.
(2) R
ISP
s 1,
2 a
nd 3
are
b
ased
into
Bel
o H
oriz
onte
, Con
tage
m a
nd V
esp
asia
no, r
esp
ectiv
ely.
(3) D
efin
ed a
s ho
mic
ide,
att
emp
ted
hom
icid
e, r
ape,
rob
ber
y an
d a
rmed
rob
ber
y ac
cord
ing
to t
he B
razi
lian
Pen
al C
ode.
How
ever
, th
e ne
w m
etho
dol
ogy,
ad
opte
d b
y S
ED
S fr
om 2
011,
def
ines
vio
lent
crim
e ac
cord
ing
to t
he fo
llow
ing
seve
n ca
tego
ries:
hom
icid
e; a
ttem
pte
d h
omic
ide;
kid
nap
pin
g an
d fa
lse
imp
rison
men
t; r
obb
ery;
ex
tort
ion
thro
ugh
kid
nap
pin
g; r
ape
and
att
emp
ted
rap
e. M
oreo
ver,
it is
imp
orta
nt t
o hi
ghlig
ht t
hat
for
the
calc
ulat
ion
of t
he c
ateg
ory
Vio
lent
Crim
es A
gain
st P
rop
erty
, the
crim
es t
aken
into
acc
ount
ar
e ro
bb
ery
and
ext
ortio
n th
roug
h ki
dna
pp
ing.
Fin
ally
, the
hom
icid
e st
atis
tics
are
der
ived
from
the
num
ber
of S
ocia
l Pro
tect
ion
Eve
nt L
ogs
(RE
DS
) and
the
num
ber
of v
ictim
s. (4
) Crim
es d
efin
ed a
s ro
bb
ery
and
arm
ed r
obb
ery
by
the
Bra
zilia
n P
enal
Cod
e. (5
) Crim
es d
efin
ed a
s ho
mic
ide
by
the
Bra
zilia
n P
enal
Cod
e.
7. Demographic and Socioeconomic Features of the Population
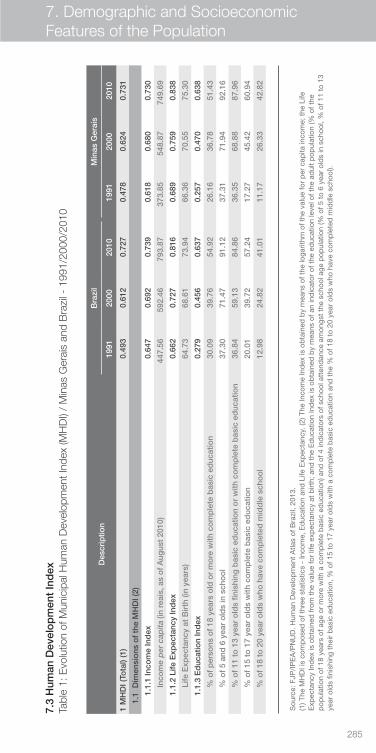
285
Des
crip
tion
Bra
zil
Min
as G
erai
s
1991
2000
2010
1991
2000
2010
1 M
HD
I (To
tal)
(1)
0.49
30.
612
0.72
7
0.47
80.
624
0.73
1
1.
1 D
imen
sio
ns o
f th
e M
HD
I (2)
1.1.
1 In
com
e In
dex
0.64
70.
692
0.73
90.
618
0.68
00.
730
In
com
e p
er c
apita
(in
reai
s, a
s o
f A
ugus
t 20
10)
447.
5659
2.46
793.
8737
3.85
548.
8774
9.69
1.1.
2 Li
fe E
xpec
tanc
y In
dex
0.66
20.
727
0.81
60.
689
0.75
90.
838
Li
fe E
xpec
tanc
y at
Bir
th (i
n ye
ars)
64.7
368
.61
73.9
466
.36
70.5
575
.30
1.1.
3 E
duc
atio
n In
dex
0.27
90.
456
0.63
70.
257
0.47
00.
638
%
of
per
sons
of
18 y
ears
old
or
mo
re w
ith c
om
ple
te b
asic
ed
ucat
ion
30.0
939
.76
54.9
226
.16
36.7
851
.43
%
of
5 an
d 6
yea
r o
lds
in s
cho
ol
37.3
071
.47
91.1
237
.31
71.9
492
.16
%
of
11 t
o 1
3 ye
ar o
lds
finis
hing
bas
ic e
duc
atio
n o
r w
ith c
om
ple
te b
asic
ed
ucat
ion
36.8
459
.13
84.8
636
.35
68.8
887
.96
%
of
15 t
o 1
7 ye
ar o
lds
with
co
mp
lete
bas
ic e
duc
atio
n20
.01
39.7
257
.24
17.2
745
.42
60.9
4
%
of
18 t
o 2
0 ye
ar o
lds
who
hav
e co
mp
lete
d m
idd
le s
cho
ol
12.9
824
.82
41.0
111
.17
26.3
342
.82
Sou
rce:
FJP
/IP
EA
/PN
UD
. Hum
an D
evel
opm
ent
Atla
s of
Bra
zil,
2013
. (1
) The
MH
DI i
s co
mp
osed
of t
hree
sta
tistic
s -
Inco
me,
Ed
ucat
ion
and
Life
Exp
ecta
ncy.
(2) T
he In
com
e In
dex
is o
bta
ined
by
mea
ns o
f the
loga
rithm
of t
he v
alue
for
per
cap
ita in
com
e; t
he L
ife
Exp
ecta
ncy
Ind
ex is
ob
tain
ed fr
om t
he v
alue
for
life
exp
ecta
ncy
at b
irth;
and
the
Ed
ucat
ion
Ind
ex is
ob
tain
ed b
y m
eans
of a
n in
dic
ator
of t
he e
duc
atio
n le
vel o
f the
ad
ult
pop
ulat
ion
(% o
f the
p
opul
atio
n of
18
year
s of
age
or
mor
e w
ith a
com
ple
te b
asic
ed
ucat
ion)
and
of 4
ind
icat
ors
of s
choo
l att
end
ance
am
ongs
t th
e sc
hool
age
pop
ulat
ion
(% o
f 5 t
o 6
year
old
s in
sch
ool,
% o
f 11
to 1
3 ye
ar o
lds
finis
hing
the
ir b
asic
ed
ucat
ion,
% o
f 15
to 1
7 ye
ar o
lds
with
a c
omp
lete
bas
ic e
duc
atio
n an
d t
he %
of 1
8 to
20
year
old
s w
ho h
ave
com
ple
ted
mid
dle
sch
ool).
7.3
Hum
an D
evel
op
men
t In
dex
Tabl
e 1:
Evo
lutio
n of
Mun
icip
al H
uman
Dev
elop
men
t Ind
ex (M
HD
I) /
Min
as G
erai
s an
d B
razi
l - 1
991/
2000
/201
0
7. Demographic and Socioeconomic Features of the Population
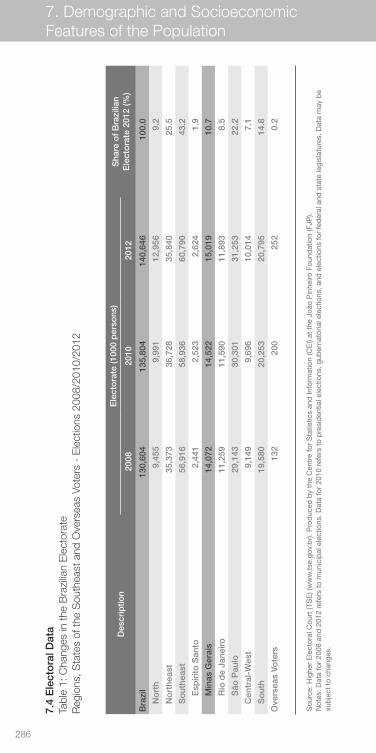
286
Des
crip
tion
Ele
cto
rate
(100
0 p
erso
ns)
Sha
re o
f B
razi
lian
Ele
cto
rate
201
2 (%
)20
0820
1020
12
Bra
zil
130,
604
135,
804
140,
646
100.
0
N
ort
h9,
455
9,99
112
,956
9.2
N
ort
heas
t35
,373
36,7
2835
,840
25.5
S
out
heas
t56
,916
58,9
3660
,790
43.2
Esp
írito
San
to2,
441
2,52
32,
624
1.9
Min
as G
erai
s14
,072
14,5
2215
,019
10.7
Rio
de
Jane
iro11
,259
11,5
9011
,893
8.5
São
Pau
lo29
,143
30,3
0131
,253
22.2
C
entr
al-W
est
9,14
99,
696
10,0
147.
1
S
out
h19
,580
20,2
5320
,795
14.8
Ove
rsea
s Vo
ters
132
200
252
0.2
Sou
rce:
Hig
her
Ele
ctor
al C
ourt
(TS
E) (
ww
w.t
se.g
ov.b
r). P
rod
uced
by
the
Cen
tre
for
Sta
tistic
s an
d In
form
atio
n (C
EI)
at t
he J
oão
Pin
heiro
Fou
ndat
ion
(FJP
). N
otes
: Dat
a fo
r 20
08 a
nd 2
012
refe
rs t
o m
unic
ipal
ele
ctio
ns. D
ata
for
2010
ref
ers
to p
resi
den
tial e
lect
ions
, gub
erna
toria
l ele
ctio
ns, a
nd e
lect
ions
for
fed
eral
and
sta
te le
gisl
atur
es. D
ata
may
be
sub
ject
to
chan
ges.
7.4
Ele
cto
ral D
ata
Tabl
e 1:
Cha
nges
in th
e B
razi
lian
Ele
ctor
ate
Reg
ions
, Sta
tes
of th
e S
outh
east
and
Ove
rsea
s Vo
ters
- E
lect
ions
200
8/20
10/2
012
7. Demographic and Socioeconomic Features of the Population
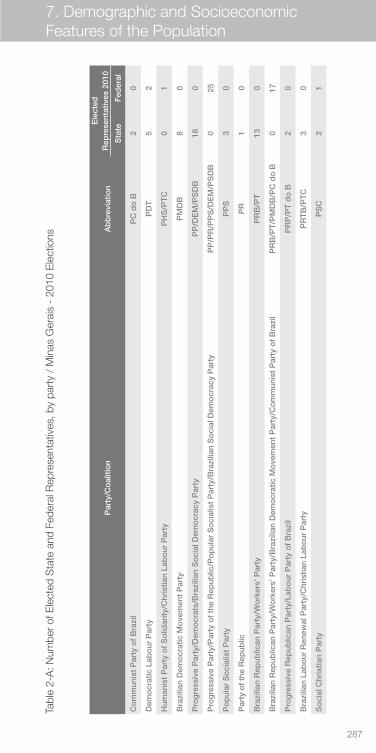
287
Sou
rce:
Hig
her
Ele
ctor
al C
ourt
(TS
E) (
ww
w.t
se.g
ov.b
r). P
rod
uced
by
the
Cen
tre
for
Sta
tistic
s an
d In
form
atio
n (C
EI)
at t
he J
oão
Pin
heiro
Fou
ndat
ion
(FJP
). N
otes
: Dat
a fo
r 20
08 a
nd 2
012
refe
rs t
o m
unic
ipal
ele
ctio
ns. D
ata
for
2010
ref
ers
to p
resi
den
tial e
lect
ions
, gub
erna
toria
l ele
ctio
ns, a
nd e
lect
ions
for
fed
eral
and
sta
te le
gisl
atur
es. D
ata
may
be
sub
ject
to
chan
ges.
Par
ty/C
oal
itio
nA
bb
revi
atio
n
Ele
cted
R
epre
sent
ativ
es 2
010
Sta
teF
eder
al
Co
mm
unis
t P
arty
of
Bra
zil
PC
do
B2
0
Dem
ocr
atic
Lab
our
Par
tyP
DT
52
Hum
anis
t P
arty
of
So
lidar
ity/C
hris
tian
Lab
our
Par
tyP
HS
/PT
C0
1
Bra
zilia
n D
emo
crat
ic M
ove
men
t P
arty
PM
DB
80
Pro
gre
ssiv
e P
arty
/Dem
ocr
ats/
Bra
zilia
n S
oci
al D
emo
crac
y P
arty
PP
/DE
M/P
SD
B18
0
Pro
gre
ssiv
e P
arty
/Par
ty o
f th
e R
epub
lic/P
op
ular
So
cial
ist
Par
ty/B
razi
lian
So
cial
Dem
ocr
acy
Par
tyP
P/P
R/P
PS
/DE
M/P
SD
B0
25
Po
pul
ar S
oci
alis
t P
arty
PP
S3
0
Par
ty o
f th
e R
epub
licP
R1
0
Bra
zilia
n R
epub
lican
Par
ty/W
ork
ers'
Par
tyP
RB
/PT
130
Bra
zilia
n R
epub
lican
Par
ty/W
ork
ers'
Par
ty/B
razi
lian
Dem
ocr
atic
Mo
vem
ent
Par
ty/C
om
mun
ist
Par
ty o
f B
razi
lP
RB
/PT
/PM
DB
/PC
do
B0
17
Pro
gre
ssiv
e R
epub
lican
Par
ty/L
abo
ur P
arty
of
Bra
zil
PR
P/P
T d
o B
20
Bra
zilia
n La
bo
ur R
enew
al P
arty
/Chr
istia
n La
bo
ur P
arty
PR
TB
/PT
C3
0
So
cial
Chr
istia
n P
arty
PS
C2
1
Tabl
e 2-
A: N
umbe
r of
Ele
cted
Sta
te a
nd F
eder
al R
epre
sent
ativ
es, b
y pa
rty
/ M
inas
Ger
ais
- 20
10 E
lect
ions
7. Demographic and Socioeconomic Features of the Population
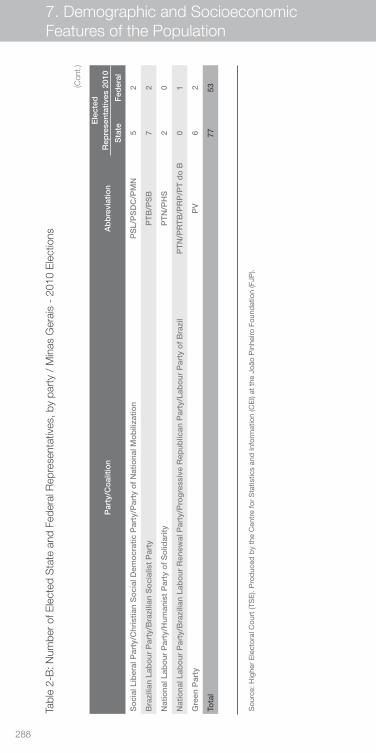
288
Par
ty/C
oal
itio
nA
bb
revi
atio
n
Ele
cted
R
epre
sent
ativ
es 2
010
Sta
teF
eder
al
So
cial
Lib
eral
Par
ty/C
hris
tian
So
cial
Dem
ocr
atic
Par
ty/P
arty
of
Nat
iona
l Mo
bili
zatio
nP
SL/
PS
DC
/PM
N5
2
Bra
zilia
n La
bo
ur P
arty
/Bra
zilia
n S
oci
alis
t P
arty
PT
B/P
SB
72
Nat
iona
l Lab
our
Par
ty/H
uman
ist
Par
ty o
f S
olid
arity
PT
N/P
HS
20
Nat
iona
l Lab
our
Par
ty/B
razi
lian
Lab
our
Ren
ewal
Par
ty/P
rog
ress
ive
Rep
ublic
an P
arty
/Lab
our
Par
ty o
f B
razi
lP
TN
/PR
TB
/PR
P/P
T d
o B
01
Gre
en P
arty
PV
62
Tota
l77
53
Tabl
e 2-
B: N
umbe
r of
Ele
cted
Sta
te a
nd F
eder
al R
epre
sent
ativ
es, b
y pa
rty
/ M
inas
Ger
ais
- 20
10 E
lect
ions
(Con
t.)
Sou
rce:
Hig
her
Ele
ctor
al C
ourt
(TS
E).
Pro
duc
ed b
y th
e C
entr
e fo
r S
tatis
tics
and
Info
rmat
ion
(CE
I) at
the
Joã
o P
inhe
iro F
ound
atio
n (F
JP).
7. Demographic and Socioeconomic Features of the Population
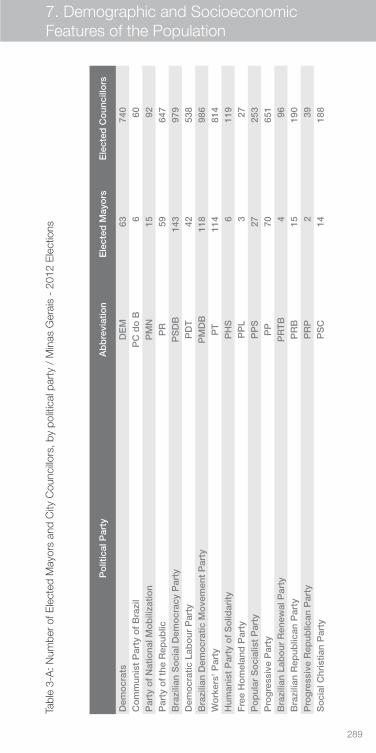
289
Po
litic
al P
arty
Ab
bre
viat
ion
Ele
cted
May
ors
Ele
cted
Co
unci
llors
Dem
ocr
ats
DE
M63
740
Co
mm
unis
t P
arty
of
Bra
zil
PC
do
B6
60P
arty
of
Nat
iona
l Mo
bili
zatio
nP
MN
1592
Par
ty o
f th
e R
epub
licP
R59
647
Bra
zilia
n S
oci
al D
emo
crac
y P
arty
PS
DB
143
979
Dem
ocr
atic
Lab
our
Par
tyP
DT
4253
8B
razi
lian
Dem
ocr
atic
Mo
vem
ent
Par
tyP
MD
B11
898
6W
ork
ers'
Par
tyP
T11
481
4H
uman
ist
Par
ty o
f S
olid
arity
PH
S6
119
Fre
e H
om
elan
d P
arty
PP
L3
27P
op
ular
So
cial
ist
Par
tyP
PS
2725
3P
rog
ress
ive
Par
tyP
P70
651
Bra
zilia
n La
bo
ur R
enew
al P
arty
PR
TB
496
Bra
zilia
n R
epub
lican
Par
tyP
RB
1519
0P
rog
ress
ive
Rep
ublic
an P
arty
PR
P2
39S
oci
al C
hris
tian
Par
tyP
SC
1418
8
Tabl
e 3-
A: N
umbe
r of
Ele
cted
May
ors
and
City
Cou
ncillo
rs, b
y po
litic
al p
arty
/ M
inas
Ger
ais
- 20
12 E
lect
ions
7. Demographic and Socioeconomic Features of the Population
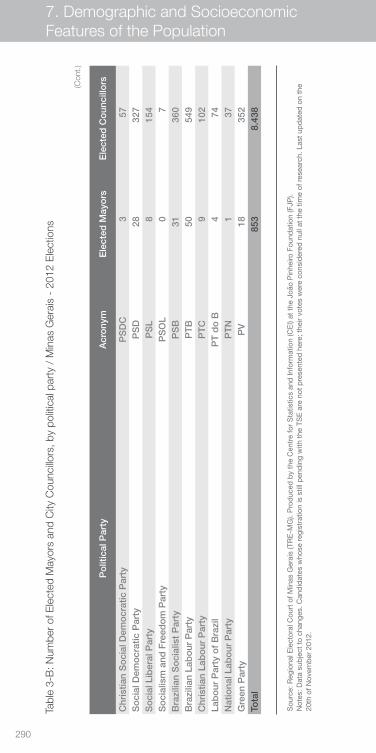
290
Po
litic
al P
arty
Acr
ony
mE
lect
ed M
ayo
rsE
lect
ed C
oun
cillo
rs
Chr
istia
n S
oci
al D
emo
crat
ic P
arty
PS
DC
357
So
cial
Dem
ocr
atic
Par
tyP
SD
2832
7S
oci
al L
iber
al P
arty
PS
L8
154
So
cial
ism
and
Fre
edo
m P
arty
PS
OL
07
Bra
zilia
n S
oci
alis
t P
arty
PS
B31
360
Bra
zilia
n La
bo
ur P
arty
PT
B50
549
Chr
istia
n La
bo
ur P
arty
PT
C9
102
Lab
our
Par
ty o
f B
razi
lP
T d
o B
474
Nat
iona
l Lab
our
Par
tyP
TN
137
Gre
en P
arty
PV
1835
2To
tal
85
38.
438
Tabl
e 3-
B: N
umbe
r of
Ele
cted
May
ors
and
City
Cou
ncillo
rs, b
y po
litic
al p
arty
/ M
inas
Ger
ais
- 20
12 E
lect
ions
(Con
t.)
Sou
rce:
Reg
iona
l Ele
ctor
al C
ourt
of M
inas
Ger
ais
(TR
E-M
G).
Pro
duc
ed b
y th
e C
entr
e fo
r S
tatis
tics
and
Info
rmat
ion
(CE
I) at
the
Joã
o P
inhe
iro F
ound
atio
n (F
JP).
Not
es: D
ata
sub
ject
to
chan
ges.
Can
did
ates
who
se r
egis
trat
ion
is s
till p
end
ing
with
the
TS
E a
re n
ot p
rese
nted
her
e; t
heir
vote
s w
ere
cons
ider
ed n
ull a
t th
e tim
e of
res
earc
h. L
ast
upd
ated
on
the
20th
of N
ovem
ber
201
2.
7. Demographic and Socioeconomic Features of the Population

291
Glossary
G
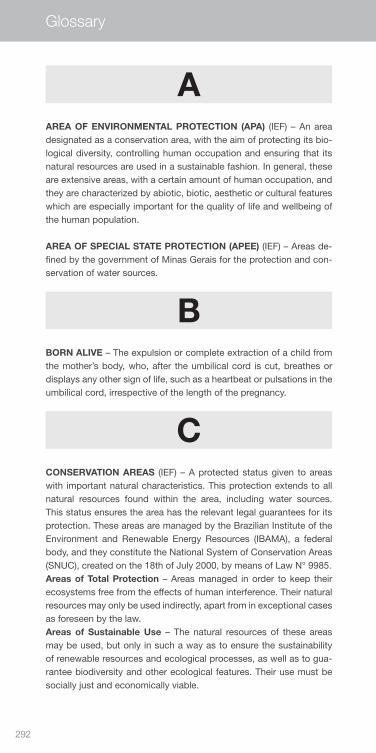
292
AAREA OF ENVIRONMENTAL PROTECTION (APA) (IEF) – An area designated as a conservation area, with the aim of protecting its bio-logical diversity, controlling human occupation and ensuring that its natural resources are used in a sustainable fashion. In general, these are extensive areas, with a certain amount of human occupation, and they are characterized by abiotic, biotic, aesthetic or cultural features which are especially important for the quality of life and wellbeing of the human population.
AREA OF SPECIAL STATE PROTECTION (APEE) (IEF) – Areas de-fined by the government of Minas Gerais for the protection and con-servation of water sources.
BBORN ALIVE – The expulsion or complete extraction of a child from the mother’s body, who, after the umbilical cord is cut, breathes or displays any other sign of life, such as a heartbeat or pulsations in the umbilical cord, irrespective of the length of the pregnancy.
CCONSERVATION AREAS (IEF) – A protected status given to areas with important natural characteristics. This protection extends to all natural resources found within the area, including water sources. This status ensures the area has the relevant legal guarantees for its protection. These areas are managed by the Brazilian Institute of the Environment and Renewable Energy Resources (IBAMA), a federal body, and they constitute the National System of Conservation Areas (SNUC), created on the 18th of July 2000, by means of Law N° 9985.Areas of Total Protection – Areas managed in order to keep their ecosystems free from the effects of human interference. Their natural resources may only be used indirectly, apart from in exceptional cases as foreseen by the law.Areas of Sustainable Use – The natural resources of these areas may be used, but only in such a way as to ensure the sustainability of renewable resources and ecological processes, as well as to gua-rantee biodiversity and other ecological features. Their use must be socially just and economically viable.
Glossary

293
CRUDE BIRTH RATE – The number of live births per 1,000 popula-tion in a given year.
CRUDE DEATH RATE – The number of deaths per 1,000 population in a given year.
EECOLOGICAL STATION – A publicly owned and managed conserva-tion area, the aim of which is to preserve the natural environment and provide opportunities for scientific research.
ECONOMICALLY ACTIVE POPULATION (PEA) (IBGE; Employment Survey) – Proportion of the PIA either employed or unemployed.
ELECTORATE – The section of the population eligible to vote and registered to do so with the Electoral Courts. Legally, in Brazil, voting is mandatory for citizens between the ages of 18 and 70. It is optional between the ages of 16 and 18 and after the age of 70.
EMPLOYED PERSONS (IBGE) – Persons who have work, either working for an employer, working independently, or those who work helping family members without being remunerated. Those who have spent a long time without working are not considered to be employed.Employees – Persons who work for one or more employers, with fi-xed working hours and remuneration in money, kind or goods;Freelance and Self-Employed – Persons who are economically ac-tive, engaging in a profession or trade, but without necessarily being employed by anyone;Employers – Persons who are economically active, engaging in a profession, with the help of one or more employees.
FFORMAL EMPLOYMENT – As recorded in the General Employment and Unemployment Register (CAGED) of the Ministry of Labour and Employment. It is a record of all jobs based on legal contracts whe-rever gainful employment occurs, in other words, employment gover-ned by the Consolidation of Labour Laws (CLT).
Glossary
294
GGENERAL MARKET PRICE INDEX (IGP-M) – Similar to the IGP-DI, except with regard to the period of price collection (21 from the pre-vious month and 20 from the month of reference). It was created in 1989 on the request of the business community.
GENERAL PRICE INDEX (INTERNAL AVAILABILITY) [IGP-DI] – A composite statistic which measures the evolution of prices. It consists of the Wholesale Price Index (IPA), the Consumer Price Index (IPC) and the National Construction Cost Index (INCC). It has been publi-shed by the Getúlio Vargas Foundation since 1944.
GEOGRAPHICAL MESOREGION – A homogenous unit of territorial subdivision, larger than a microregion, but smaller than a state or a territory. It consists of several microregions.
GROSS DOMESTIC PRODUCT (GDP) – The total value of goods and services produced within a country or given area over a year or given period. GDP is calculated as follows: GDP = Gross value added (total gross value of all domes-tic output – intermediate consumption [cost of materials, goods or supplies used in production]) + taxes on products – subsidies on pro-ducts. In principle, GDP is also equal to total expenditure on goo-ds and services valued at market price, as well as total income. It can therefore be used to express three indicators: production, expenditu-re and income.
HHOUSING DEFICIT – The need for new housing. Construction of new dwellings will solve problems specific to housing, as well as alleviating wider social problems.
HUMAN DEVELOPMENT INDEX (HDI) – Created in the early 1990s for the United Nations Development Programme (UNDP) by the special advisor Mahbub ul Haq, the IDH is composed of the following three ele-ments: 1) Life Expectancy; 2) Education, measured by a combination of adult literacy rates and combined gross enrolment ratio in primary, secondary and tertiary education; and 3) Income, measured by the purchasing power of the population, based on GDP per capita, adjus-ted to local costs of living by means of Purchasing Power Parity (PPP).
Glossary
295
Glossary
IINFANT MORTALITY RATE (per 1000 live births) – The relation be-tween the number of deaths of children of less than a year old, in a given period, and the number of live births during the same period.
INTEGRATED PUBLIC SECURITY REGIONS (RISPS) – The widest level of the Integrated Areas Project. In the RISPs, a regional com-mand of the Military Police corresponds with a department of the Civil Police. All planning and police activity in Minas Gerais is conducted through 18 RISPs, which are in turn subdivided into Areas of Inte-grated Public Security Coordination (ACISPs) and Integrated Public Security Areas (AISPs).
LLABOUR (IBGE):Remunerated Economic Occupation – In money, kind, goods, or any other form for the production of goods or services;Unremunerated Economic Occupation – Conducted for at least one hour during the week, in the following situations: helping a family member in their economic activity, religious institutions, agriculture, cooperative work, or as an apprentice or intern.
LIFE EXPECTANCY AT BIRTH – Average number of years an indivi-dual is expected to live, from the day of their birth.
NNATIONAL HOUSEHOLD SAMPLE SURVEY (PNAD) – Conducted annually by the Brazilian Institute of Geography and Statistics (IBGE), it investigates a range of socioeconomic indicators. Some are of a permanent nature, such as general population characteristics, while others are more variable. The largest category considered is metro-politan region.
NATURAL MONUMENT – A protected status given to natural featu-res of outstanding or unique value, on account of their rarity and/or natural beauty.
NOMINAL MONTHLY INCOME (IBGE) – The survey took into ac-count nominal monthly income deriving from the individual’s main job
296
Glossary
alongside any others they may have been engaged in during the week the survey was conducted.
OOPEN UNEMPLOYMENT RATE (IBGE) – Relation between num-ber of unemployed persons and the Economically Active Population (PEA) in the period of reference.
PPRIVATE HOUSEHOLD – A structurally independent residence, con-sisting of at least one room and a private entrance. It may be home to one, two or at most five families.
PRIVATE NATURAL HERITAGE AREA (RPPN) (IEF) – A permanently demarcated private area, the aim of which is to conserve biological diversity.
PUBLIC DEBT – The obligations of the state to its creditors, as de-fined by the relevant securities and contracts, for financial resources that it has borrowed. This debt may be internal (the creditor is located within national territory), external (the creditor is not located within national territory) or floating (short-term debts related to temporary financial difficulties, represented by negotiable securities).
PUBLIC EXPENDITURE – Spending programmed by the govern-ment, with the money coming from the state treasury. This is divided into two sub-categories:Current Expenditure – The recurring operational costs involved in government activities and public services. They do not contribute di-rectly to the creation or acquisition of any capital asset.Capital Expenditure – Expenses which contribute to acquiring or de-veloping a capital asset, or adding value to an asset which already exists, as well as transferring, by purchase or other means of acquisi-tion, ownership of an asset.
PURCHASING POWER PARITY (PPP) – The US dollar adjusted to express the same purchasing power across different countries.
297
Glossary
RRESIDENT POPULATION – The usual residents of a household, in other words, those persons for whom the household is the location of their habitual residence, whether or not they were present on the date the census was taken.
REVENUE – The income of the state treasury. It derives from current revenues (taxes, contributions, property, agriculture, industry, servi-ces, transfers and others) and capital revenues (credit operations, disposal of assets, amortization of loans, transfers and others).
SSANITATION SYSTEM – The sanitation facilities used by residents of private households were classified as follows:General Sanitation Network – The household’s plumbing is connec-ted to a system which delivers waste material to sewers managed by the area, region or municipality, even if the system does not possess a specific water treatment plant;Septic Tank – The household’s plumbing is connected to a septic tank, in other words, waste material is sent to a tank nearby, where it undergoes a treatment process, in which liquid waste may be sent to a general sewer of the area, region or municipality;Others – Waste material is sent directly to a ditch, river, lake or the sea, or the disposal of waste material does not correspond to any of the methods previously described.
STATE FOREST (FLOE) (IEF) – A publicly owned and managed con-servation area. It is a forested area home predominantly to native spe-cies. It aims to promote sustainable use of the forest’s resources and provide opportunities for scientific research.
STATE FUND – Accounting entity, without legal characteristics, cre-ated by law and characterized by the generation of specific revenue and/or assets that are linked to the realization of various objectives or services, according to Article 2°, of the State Law No 27, of the 18th of January 1993.
STATE PARK (IEF) – A publicly owned and managed conservation area, the aim of which is to preserve natural ecosystems of great ecological importance and aesthetic beauty, as well as facilitating scientific research, environmental education, ecological tourism and recreation.
298
Glossary
SUSTAINABLE DEVELOPMENT RESERVE (IEF) – A natural area home to traditional communities, whose existence is based on the sustainable use of local natural resources. Their methods have deve-loped over generations and adapted to local ecological conditions. They contribute to the preservation of the environment and the main-tenance of biological diversity.
TTOTAL FERTILITY RATE – The average number of children that would be born to a woman by the end of her reproductive life (up to 49 years of age).
TOTAL UNEMPLOYMENT RATE (Employment Survey) – Equivalent to the relation unemployed persons/PEA, and indicates the proportion of the PEA currently in a situation of open or concealed unemploy-ment (See Unemployed Persons).
UUNEMPLOYED (Employment Survey) – A term used to describe indi-viduals in one of the following situations:Open Unemployment – Individuals who had actively sought work in the 30 days prior to the survey, and who had not performed any work in the last seven days.Unemployment Concealed by Informal Work – Individuals who per-formed some kind of informal paid work (or individuals who worked voluntarily in family businesses, for example), who had sought other work in the 30 days prior to the survey, or if not, had done so at some point in the last 12 months.Unemployment Concealed by Discouragement – Unemployed in-dividuals who had not sought work in the last 30 days, either because of a perceived lack of opportunities or other circumstances. However, they had sought work in the last 12 months.
UNEMPLOYED PERSONS (IBGE) – Persons classified as unem-ployed were those who had not worked in the week the survey was conducted, but who had taken some measure to seek work in a 30-day reference period.
URBAN AND RURAL POPULATION:Urban Population – Corresponds to all persons and households lo-cated in the cities (municipal headquarters), towns (district headquar-ters), and isolated urban areas.
299
Glossary
Rural Population – Corresponds to all persons and households loca-ted outside urban limits, including fringe urban communities, villages and other small settlements.
VVALUE ADDED – Value which human activity adds to goods and ser-vices during the process of production. It is the value added to GDP by a range of economic activities, obtained by the difference between the total value of output and the value of intermediate consumption involved in these activities.
WWAGE (Employment Survey) – The gross salary (prior to tax deduc-tions) earned by a worker in the month prior to the survey. This takes into account earnings deducted for days off, as well as overtime pay, bonuses, etc. It does not take into account the thirteenth salary or indirect benefits. For employers, freelancers and others, it refers to their monthly earnings.
WASTE DISPOSAL – Waste generated by private households is clas-sified according to the following disposal methods:Collected by Waste Collection Service – Domestic waste is collec-ted directly from the household by a waste collection company (public or private) serving the local area.Collected by Waste Container – Waste is left in a container, tank or other deposit belonging to the waste collection company (public or private), which then collects it subsequently.Other Methods – Includes domestic waste incinerated or buried at the property on which the household is located; waste dumped on wasteland, in public areas, in rivers, lakes or the sea, or waste left at any other place that does not correspond to those described above.
WATER SUPPLY:General Network – The household is provided with water by a gene-ral distribution network. The water is piped to the household directly, or at least to the land or property on which it is located.Well or Spring on Property – The household is provided with water by a well or spring located on the land or property on which it is lo-cated.Other Source – The household is provided with water by a well or a spring located outside the property; by water tanker or rainwater col-lection; by river, dam, lake or stream; by a well or spring in the village; by a well or spring outside the village; or by another source that does
300
not correspond to those described above.
WILDLIFE RESERVE (IEF) – A conservation area, the aim of which is to preserve natural environments which provide conditions for the existence or reproduction of certain species or communities of local flora and resident or migratory fauna. These areas may be privately owned, as long as its protected status is compatible with the use of the land and local natural resources by the property owner.
WORKING AGE POPULATION (PIA) (IBGE; Employment Survey) – Corresponds to the population of 10 years of age or more.
Glossary

301
Abbreviations
A
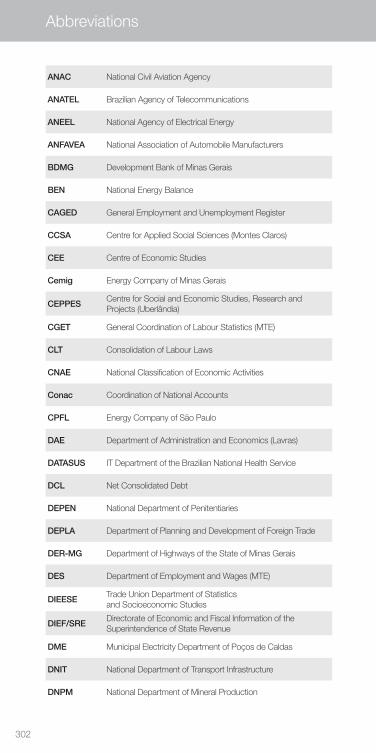
302
ANAC National Civil Aviation Agency
ANATEL Brazilian Agency of Telecommunications
ANEEL National Agency of Electrical Energy
ANFAVEA National Association of Automobile Manufacturers
BDMG Development Bank of Minas Gerais
BEN National Energy Balance
CAGED General Employment and Unemployment Register
CCSA Centre for Applied Social Sciences (Montes Claros)
CEE Centre of Economic Studies
Cemig Energy Company of Minas Gerais
CEPPESCentre for Social and Economic Studies, Research and Projects (Uberlândia)
CGET General Coordination of Labour Statistics (MTE)
CLT Consolidation of Labour Laws
CNAE National Classification of Economic Activities
Conac Coordination of National Accounts
CPFL Energy Company of São Paulo
DAE Department of Administration and Economics (Lavras)
DATASUS IT Department of the Brazilian National Health Service
DCL Net Consolidated Debt
DEPEN National Department of Penitentiaries
DEPLA Department of Planning and Development of Foreign Trade
DER-MG Department of Highways of the State of Minas Gerais
DES Department of Employment and Wages (MTE)
DIEESETrade Union Department of Statistics and Socioeconomic Studies
DIEF/SREDirectorate of Economic and Fiscal Information of the Superintendence of State Revenue
DME Municipal Electricity Department of Poços de Caldas
DNIT National Department of Transport Infrastructure
DNPM National Department of Mineral Production
Abbreviations
303
EEB Bragantina Electricity Company
Energisa
FAT Workers' Support Fund
FEE Economics and Statistics Foundation (Porto Alegre)
FGTAS Labour and Social Action Foundation of Rio Grande do Sul
FPM Municipality Participation Fund
GDF Government of the Federal District (Brasília)
GEMERC Market Development Support Management
IABr Brazilian Steel Institute
IBGE Brazilian Institute of Geography and Statistics
ICMSTax on Operations Relating to the Circulation of Goods and the Provision of Intermunicipal and Interstate Transport and Communication Services
ICV Cost of Living Index
IEPECentre for Economic Studies and Research (Rio Grande do Sul)
IEF State Forestry Institute
IGAM Institute of Water Management of Minas Gerais
IGP General Price Index
IGP-DI General Price Index – Internal Availability
IGP-M General Market Price Index
INEPAnísio Teixeira National Institute of Educational Studies and Research
Infraero Brazilian Company of Airport Infrastructure
INPC National Consumer Price Index
IPA Wholesale Price Index
IPC Consumer Price Index
IPCA Broad Consumer Price Index
LSPA Systematic Survey of Agricultural Production
MDIC Ministry of Development, Industry and Foreign Trade
MME Ministry of Mines and Energy
Abbreviations
304
Abbreviations
MTE Ministry of Labour and Employment
OCB Organization of Brazilian Cooperatives
OcemgUnion and Organization of the Cooperatives of the State of Minas Gerais
OCEs Organization of State Cooperatives
OIT International Labour Organization (ILO)
PAM Municipal Agricultural Survey
PEA Economically Active Population
PED Employment and Unemployment Survey
PIA Working Age Population
PMPA Municipal Administration of Porto Alegre
PNAD National Household Sample Survey
POF Working Age Population
PPC Purchasing Power Parity (PPP)
PPM Municipal Livestock Survey
RAIS Annual Social Information Report
RCL Current Net Revenue
REDS Integrated System of Social Protection
RMBH Belo Horizonte Metropolitan Area
SATVA Pay-TV Service Providers Watchdog
SDE Department of Economic Development (Brasília)
SDSC Department of Social Development and Citizenship (Recife)
SEADE State System of Data Analysis Foundation
SECEX Department of Foreign Trade
SEDESE State Department of Social Development (Minas Gerais)
SEDESTState Department for Social Development and Income Transfer (Brasília)
SEDS State Department of Social Protection
SEF State Finance Department
SEI Superintendence of Economic and Social Studies (Bahia)
305
Abbreviations
SEP Department of Planning and Economics (São Paulo)
Sescoop-MGNational Service of Cooperative Learning of the State of Minas Gerais
SETRE Department of Labour, Employment, Income and Sport (Bahia)
SIAB Primary Care Information System
SIAMIG Sugar Industry Union of the State of Minas Gerais
SIDRA IBGE Automatic Retrieval System
SINE National Employment System
SIUP Industrial Services of Public Utility
SNIC National Union of the Cement Industry
SPPE Department of Public Policy and Employment (MTE)
STFC Landline Telephone Service
TCU Brazilian Federal Court of Accounts
TRE-MG Regional Electoral Court of Minas Gerais
TSE Higher Electoral Court
UFBA Federal University of Bahia
UFLA-DAEFederal University of Lavras – Department of Administration and Economics
UFU/CeppesFederal University of Uberlândia – Centre for Socioeconomic Research
UFV Federal University of Viçosa
UNICA Union of the Sugarcane Industry
Unimontes-CCSA
State University of Montes Claros – Centre for Applied Social Sciences
306
EQUIPE TÉCNICA / TECHNICAL TEAM
Centro de Estatística e Informações/CEI / Centre for Statistics and Information (CEI)Adriana de Miranda RibeiroDanilo Gomes de FreitasEstevão de Almeida Vilela (Estagiário)João Bosco AssunçãoJuliana Lucena Ruas RianiMaria Aparecida Sales Souza SantosMaria Ramos de SouzaMarilene Cardoso GontijoMirela Castro Santos CamargosPlínio de Campos SouzaRaimundo de Sousa Leal FilhoRaquel de Mattos VianaReinaldo Carvalho de MoraisRonaldo Ronan Oleto (Coordenador)Thiago Rafael Corrêa de Almeida
Centro de Estudos de Políticas Públicas/CEPP / Centre for Public Policy Studies (CEPP)Eduardo Cerqueira BatitucciFátima Beatriz Carneiro Teixeira P. Fortes
Centro de Pesquisas Aplicadas/CPA / Centre for Applied Rese-arch (CPA)Elisa Maria Pinto da RochaFernando Martins Prates Maria Luiza de Aguiar MarquesMônica Galupo Fonseca CostaOlinto José Oliveira NogueiraSérgio Luiz Félix da Silva
Editoração Eletrônica / Desktop PublishingEditora Água Branca
Tradução / TranslationTom Gatehouse para Patacom Consultoria Linguística
Revisão em Português / Portuguese RevisionVanessa Ribeiro Brandão
Revisão em Inglês / English RevisionTom Gatehouse para Patacom Consultoria Linguística
Agradecimentos / AcknowledgementsCarlos Antônio Gonçalves de Jesus (DNPM), Hércio José Ramos Brandão (ANEEL), Tonyedson Pereira e Lana (BDMG), Arlindo Reis (Instituto Aço Brasil) e Fernanda de Souza Braga (IGAM).

307

308

Araxá, MG - BrasilTel: (34) 3669.3000Fax: (34) 3669.3100www.cbmm.com.br