Embed Size (px)
Citation preview
Report
A Guide to Regional Schools Commissioners National Foundation for Educational Research (NFER)
A Guide to Regional Schools Commissioners September 2015
Ben Durbin Karen Wespieser
Daniele Bernardinelli
Geoff Gee
Published in September 2015 By the National Foundation for Educational Research, The Mere, Upton Park, Slough, Berkshire SL1 2DQ www.nfer.ac.uk
© 2015 National Foundation for Educational Research Registered Charity No. 313392 ISBN: 978-1-910008-78-2 How to cite this publication: Durbin, B., Wespieser, K., Bernardinelli, D. and Gee, G. (2015). A Guide to Regional Schools Commissioners. Slough: NFER.
Contents
1 At a glance 2
2 What is a Regional Schools Commissioner? 3
A shift from Whitehall to the regions 3 An expanding role 3 Not a replacement for Local Authorities 4 Greater clarity and transparency needed 4 Further reading 5
3 What are the characteristics of the RSC regions? 6
Academisation varies by region and phase 6 Some RSCs will be more challenged than others 7 Finding new sponsors is crucial 9 Rising pupil numbers will make the job harder 10
4 Region profiles 11
5 Methodology 20
1 At a glance
In September 2014 eight Regional Schools
Commissioners (RSCs) were appointed to oversee the
growing numbers of academies in England. Since taking
up post, further announcements have indicated that their
roles will expand to include decision-making in tackling
underperformance in Local Authority (LA) maintained
schools, and for coasting schools. RSCs are rapidly
becoming an important and powerful part of the English
education system.
This report explains the background and role of the RSCs,
and presents an analysis of characteristics and
challenges for each region. The analysis is presented as
a comparative overview, followed by eight individual
‘region profiles’.
Academisation varies by region and phase
Nationally, 64 per cent of secondary schools are academies, compared to only
16 per cent of primary schools. However, the extent of academisation is highly
variable between and within regions. This will affect the role of the RSCs: some
will be more focussed on existing academies and others on establishing new
ones or the performance of LA maintained schools.
Some RSCs will be more challenged than others
There is a wide variation in the numbers of coasting and ‘below floor’ schools
per region. There are two regions with over 300 schools requiring attention, and
one with fewer than 150. Many of these schools are already academies. Given
the focus of the RSC role in tackling underperformance, the use of metrics
identifying the proportion of schools in these categories would provide a
transparent way of monitoring their performance over time.
Finding new sponsors is crucial
RSCs’ abilities to tackle underperformance are primarily realised through
academy sponsors. The regions which have the greatest need for high quality
sponsors to take on underperforming schools tend to be those with the smallest
pool of existing sponsors operating in the region with high potential1 for taking
on additional schools. RSCs are therefore likely to need to look beyond their
current pool of sponsors for support.
Rising pupil numbers will make the job harder
Although RSCs are not responsible for school place planning, increasing
pressure on school capacity provides an important backdrop to their role, and is
likely to exacerbate their challenges.
1 Based on DfE’s briefing note on high performing sponsors – see methodology section
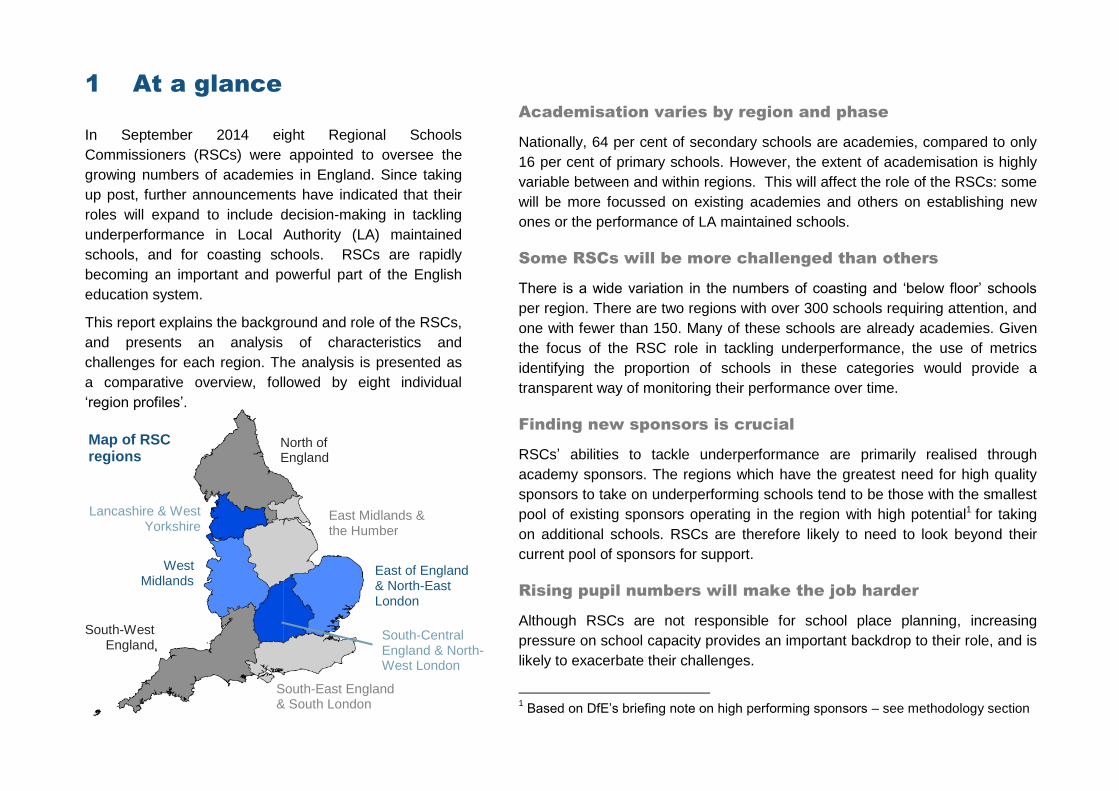
North of England
East Midlands & the Humber
East of England & North-East London
Lancashire & West Yorkshire
South-Central England & North-West London
South-East England & South London
South-West England
West Midlands
Map of RSC regions
NFER: A Guide to Regional Schools Commissioners 3
2 What is a Regional Schools
Commissioner?
A shift from Whitehall to the regions
The Department for Education (DfE) announced the introduction
of Regional Schools Commissioners (RSCs) in December 2013.
The change was described in a letter from the Schools
Commissioner, Frank Green, of April 2014, as ‘a shift in
emphasis from decision-making in Whitehall to more involvement
by schools at a regional level,’. The original definition of their role,
focussed on academies, was described by the DfE as follows:
“From September 2014, eight new Regional Schools
Commissioners (RSCs) were appointed as directors of the
department to take decisions in the Secretary of State’s name
on the operation of the academies regime. RSCs, with the
help of elected Head Teacher Boards, will approve
applications for new academies and free schools, approve
and monitor sponsor capacity. They will also take intervention
action where either performance [or governance] is poor”.
DfE Accountability Statement, January 2015
Giving evidence to the House of Commons Bill Committee for the
Education and Adoption Bill in June 2015, one RSC described
the work of his team as comprising three elements:
“We forge as many partnerships as possible to address the
issue of capacity—we work extensively with the local
authorities, teaching schools and significant academy trusts
in the area. Secondly, we spend significant time looking to be
very clear about addressing failure in academies and calling
academy trusts to account for where they are not ensuring
success. Thirdly, we look to the best schools in the system to
form multi-academy trusts”.
Tim Coulson, RSC for East of England
An expanding role
In June 2015 DfE announced an extension of the RSC role in a
letter to Local Authority Directors of Children’s Services:
“I have decided to delegate decision-making on tackling
underperformance in maintained schools through
sponsored academy arrangements to RSCs”.
Lord Nash, Parliamentary Under-Secretary of State for Schools.
The Education and Adoption Bill, published June 2015, embodies
the Conservative Manifesto commitment to address coasting
schools. Introducing the Second Reading of the Bill, Nicky
Morgan explained that RSCs would also have a key role in this
process.
“The education measures in the Bill will be enacted by those
commissioners, supported by the advice of the outstanding
headteachers who have been elected to regional boards.”
“ ...the Bill [as introduced] does not propose any automatic
interventions for coasting schools. Coasting schools will be
eligible for intervention, but regional schools commissioners
NFER: A Guide to Regional Schools Commissioners 4
will have the discretion to decide the most appropriate course
of action.”
Nicky Morgan, Secretary of State for Education
Lord Nash told the Bill Committee on 30th June ‘I expect in time
we may need more regional schools commissioners—they will
certainly need more people.’
On 20th July 2015 DfE issued a joint policy paper with the
Department for Business, Innovation and Skills on post-16
education and training institutions. It announced a programme
of area-based reviews, each of which will be ‘led by a steering
group composed of a range of stakeholders within the area; likely
members include… Regional Schools Commissioners’.
Then, on 12th August 2015 DfE issued notice of a contract,
valued at £12m over two years, for education specialists who
would be commissioned by the RSCs to ‘help deliver the
Department’s aim to ensure high educational standards in
academies and free schools and to secure sponsorship
arrangements for maintained schools moving to academy status.’
The criteria for evaluating bidders put the greatest weighting on
showing expertise and experience in school improvement.
Not a replacement for Local Authorities
Despite their expanding role, RSCs are currently seen as an
additional part of the education system, rather than a
replacement for any existing body.
In their report on School Oversight and Intervention (January
2015), the House of Commons Public Accounts Committee
describe the situation as ‘complex.’ RSCs operate alongside
Ofsted, the Education Funding Agency and local authorities in
discharging their responsibilities. In the course of introducing the
second reading of the Education and Adoption Bill, Nicky Morgan
stated that this will continue to be the case: ‘I would like to
emphasise the continuing role we expect local authorities to play,
alongside regional schools commissioners, in challenging their
schools to improve.’
Local authorities also retain a range of responsibilities relating to
all state schools including securing sufficient school places and
through the Local Safeguarding Children Board, safeguarding.
For many LA maintained schools, the LA is the admissions
authority. RSCs have no formal role in complaints about schools
or in the distribution of revenue funding to schools.
Greater clarity and transparency needed
The House of Commons Education Committee’s report on
academies and free schools was published in January 2015 and
the Government responded in March. The committee’s view was
that
The RSC regions are too large as currently devised
the DfE, as a matter of urgency, [should] clarify the respective
roles of local authorities and RSCs in relation to academies
Greater transparency is also needed regarding the process
and criteria by which sponsors are authorised and matched
with schools.
NFER: A Guide to Regional Schools Commissioners 5
‘an Ofsted inspection judgement for each academy chain
would [ ] help Regional Schools Commissioners monitor
chain performance.’
The Public Accounts Committee (PAC) report on School
oversight and intervention (January 2015) noted that the eight
RSC are ‘a welcome recognition of the need to provide more
local intelligence and oversight for the growing number of
academies’. However, ‘it is hard to believe that the
Commissioners will have enough local knowledge on their
own.’ The PAC recommended that:
In the next 18 months, the Department should evaluate the
effectiveness of the Regional Schools Commissioners.
The department should obtain independent judgements of the
capacity of sponsors that run more than one academy, and
should use this to determine which sponsors are able to grow
and when it should intervene with particular sponsors.
In its response, the Government agreed with the PAC’s
recommendations.
Further reading
This report builds on NFER’s programme of research into
academies and the new structures that are emerging around
them. This can be found at at www.nfer.ac.uk/academies, and
includes:
A factsheet introducing academies – what they are and
what we know about their performance
A guide to the evidence on academies, providing an
accessible overview of the key research
A think piece exploring the rationale behind the
academies programme, and issues for further expansion
Analysis of Key Stage 4 academy performance in 2014,
and how this compares to similar local authority
maintained schools.
NFER: A Guide to Regional Schools Commissioners 6
3 What are the characteristics
of the RSC regions?
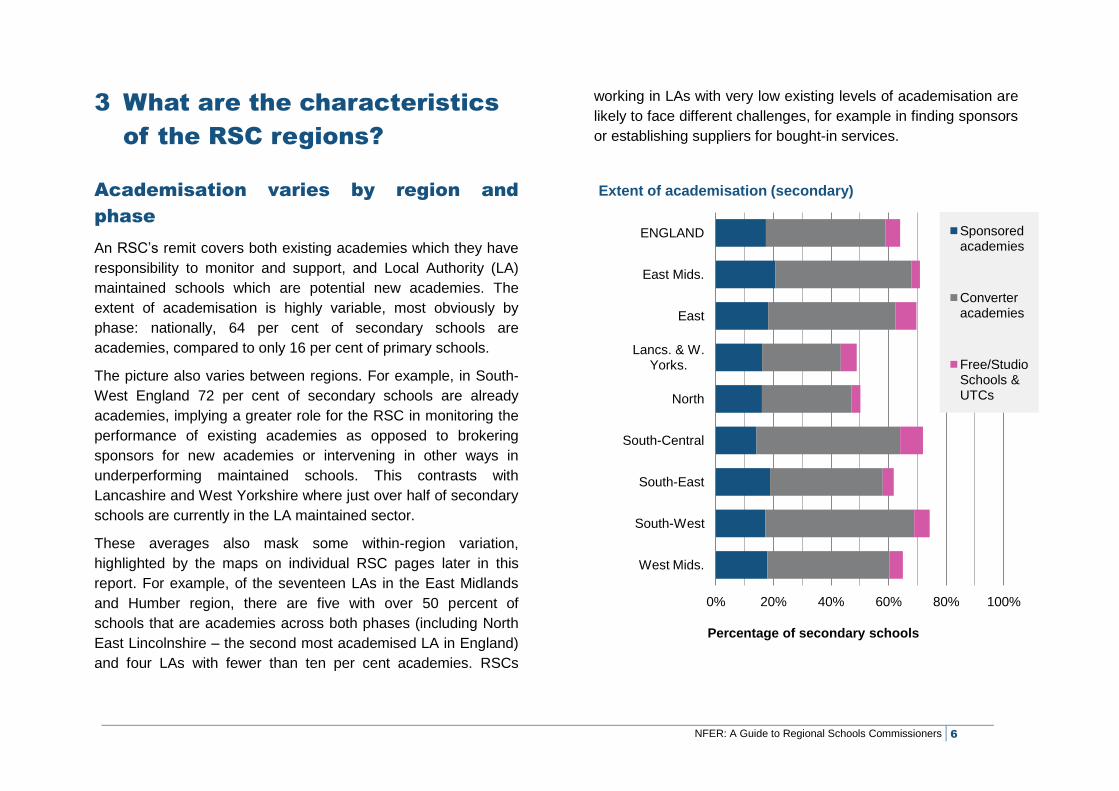
Academisation varies by region and
phase
An RSC’s remit covers both existing academies which they have
responsibility to monitor and support, and Local Authority (LA)
maintained schools which are potential new academies. The
extent of academisation is highly variable, most obviously by
phase: nationally, 64 per cent of secondary schools are
academies, compared to only 16 per cent of primary schools.
The picture also varies between regions. For example, in South-
West England 72 per cent of secondary schools are already
academies, implying a greater role for the RSC in monitoring the
performance of existing academies as opposed to brokering
sponsors for new academies or intervening in other ways in
underperforming maintained schools. This contrasts with
Lancashire and West Yorkshire where just over half of secondary
schools are currently in the LA maintained sector.
These averages also mask some within-region variation,
highlighted by the maps on individual RSC pages later in this
report. For example, of the seventeen LAs in the East Midlands
and Humber region, there are five with over 50 percent of
schools that are academies across both phases (including North
East Lincolnshire – the second most academised LA in England)
and four LAs with fewer than ten per cent academies. RSCs
working in LAs with very low existing levels of academisation are
likely to face different challenges, for example in finding sponsors
or establishing suppliers for bought-in services.
0% 20% 40% 60% 80% 100%
ENGLAND
East Mids.
East
Lancs. & W. Yorks.
North
South-Central
South-East
South-West
West Mids.
Percentage of secondary schools
Extent of academisation (secondary)
Sponsored academies
Converter academies
Free/Studio Schools & UTCs
NFER: A Guide to Regional Schools Commissioners 7
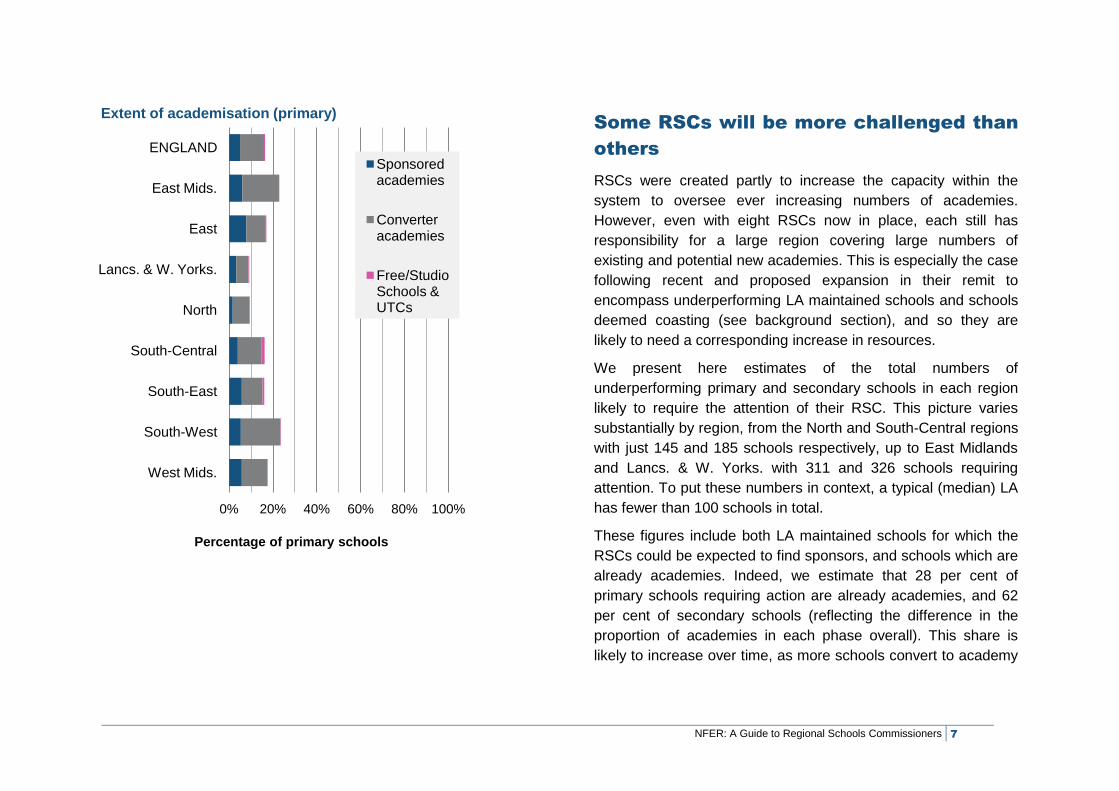
Some RSCs will be more challenged than
others
RSCs were created partly to increase the capacity within the
system to oversee ever increasing numbers of academies.
However, even with eight RSCs now in place, each still has
responsibility for a large region covering large numbers of
existing and potential new academies. This is especially the case
following recent and proposed expansion in their remit to
encompass underperforming LA maintained schools and schools
deemed coasting (see background section), and so they are
likely to need a corresponding increase in resources.
We present here estimates of the total numbers of
underperforming primary and secondary schools in each region
likely to require the attention of their RSC. This picture varies
substantially by region, from the North and South-Central regions
with just 145 and 185 schools respectively, up to East Midlands
and Lancs. & W. Yorks. with 311 and 326 schools requiring
attention. To put these numbers in context, a typical (median) LA
has fewer than 100 schools in total.
These figures include both LA maintained schools for which the
RSCs could be expected to find sponsors, and schools which are
already academies. Indeed, we estimate that 28 per cent of
primary schools requiring action are already academies, and 62
per cent of secondary schools (reflecting the difference in the
proportion of academies in each phase overall). This share is
likely to increase over time, as more schools convert to academy
0% 20% 40% 60% 80% 100%
ENGLAND
East Mids.
East
Lancs. & W. Yorks.
North
South-Central
South-East
South-West
West Mids.
Percentage of primary schools
Extent of academisation (primary)
Sponsored academies
Converter academies
Free/Studio Schools & UTCs
NFER: A Guide to Regional Schools Commissioners 8
status, and may lead to RSCs increasingly having to intervene in
existing academies.
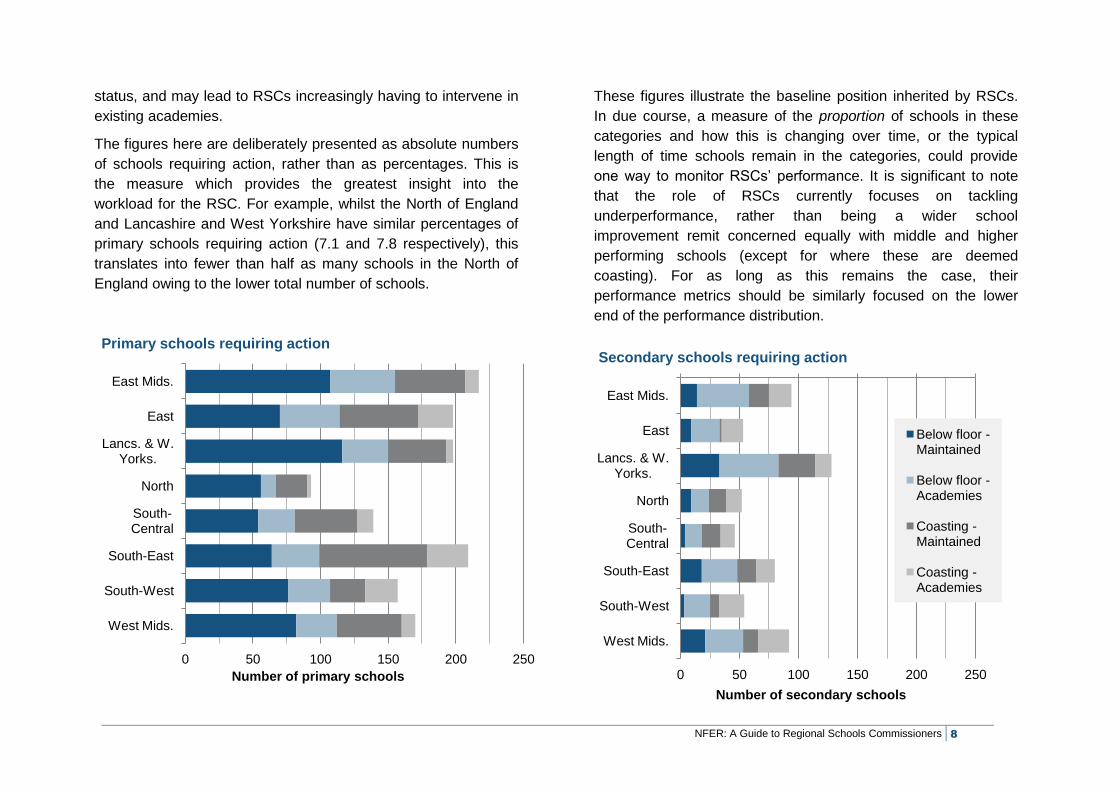
The figures here are deliberately presented as absolute numbers
of schools requiring action, rather than as percentages. This is
the measure which provides the greatest insight into the
workload for the RSC. For example, whilst the North of England
and Lancashire and West Yorkshire have similar percentages of
primary schools requiring action (7.1 and 7.8 respectively), this
translates into fewer than half as many schools in the North of
England owing to the lower total number of schools.
These figures illustrate the baseline position inherited by RSCs.
In due course, a measure of the proportion of schools in these
categories and how this is changing over time, or the typical
length of time schools remain in the categories, could provide
one way to monitor RSCs’ performance. It is significant to note
that the role of RSCs currently focuses on tackling
underperformance, rather than being a wider school
improvement remit concerned equally with middle and higher
performing schools (except for where these are deemed
coasting). For as long as this remains the case, their
performance metrics should be similarly focused on the lower
end of the performance distribution.
0 50 100 150 200 250
East Mids.
East
Lancs. & W. Yorks.
North
South-Central
South-East
South-West
West Mids.
Number of primary schools
Primary schools requiring action
0 50 100 150 200 250
East Mids.
East
Lancs. & W. Yorks.
North
South-Central
South-East
South-West
West Mids.
Number of secondary schools
Secondary schools requiring action
Below floor - Maintained
Below floor - Academies
Coasting - Maintained
Coasting - Academies
NFER: A Guide to Regional Schools Commissioners 9
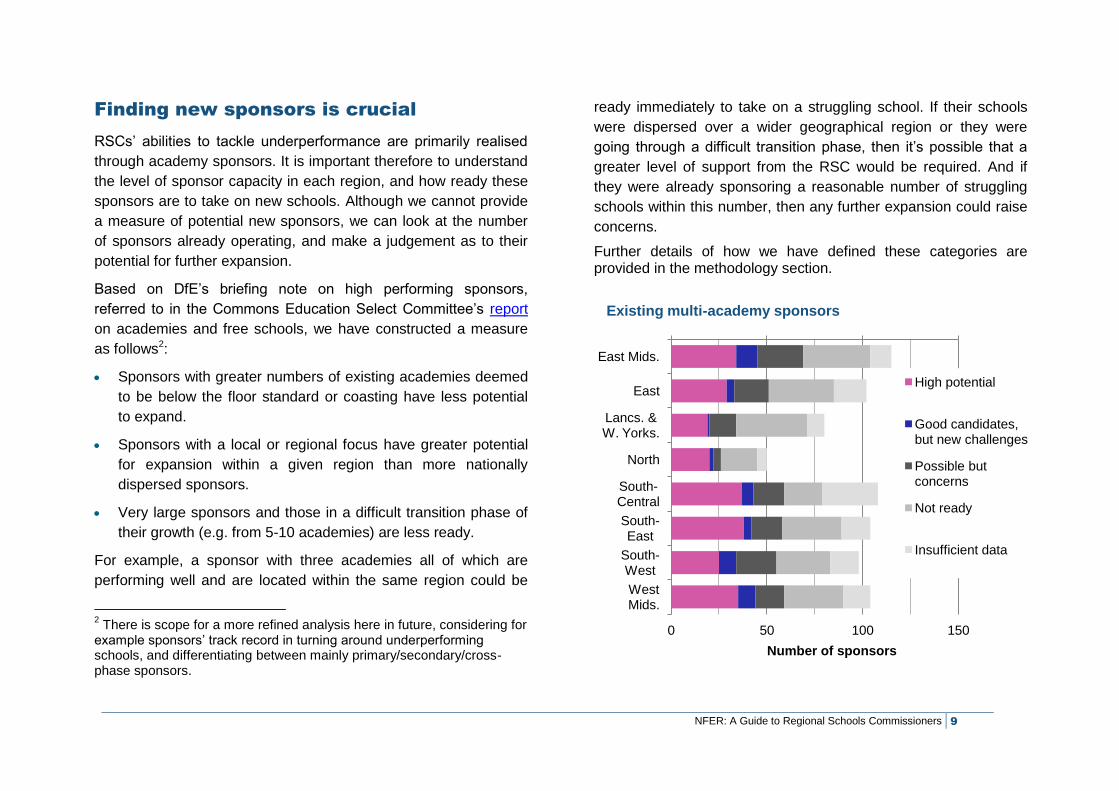
Finding new sponsors is crucial
RSCs’ abilities to tackle underperformance are primarily realised
through academy sponsors. It is important therefore to understand
the level of sponsor capacity in each region, and how ready these
sponsors are to take on new schools. Although we cannot provide
a measure of potential new sponsors, we can look at the number
of sponsors already operating, and make a judgement as to their
potential for further expansion.
Based on DfE’s briefing note on high performing sponsors,
referred to in the Commons Education Select Committee’s report
on academies and free schools, we have constructed a measure
as follows2:
Sponsors with greater numbers of existing academies deemed
to be below the floor standard or coasting have less potential
to expand.
Sponsors with a local or regional focus have greater potential
for expansion within a given region than more nationally
dispersed sponsors.
Very large sponsors and those in a difficult transition phase of
their growth (e.g. from 5-10 academies) are less ready.
For example, a sponsor with three academies all of which are
performing well and are located within the same region could be
2 There is scope for a more refined analysis here in future, considering for
example sponsors’ track record in turning around underperforming schools, and differentiating between mainly primary/secondary/cross-phase sponsors.
ready immediately to take on a struggling school. If their schools
were dispersed over a wider geographical region or they were
going through a difficult transition phase, then it’s possible that a
greater level of support from the RSC would be required. And if
they were already sponsoring a reasonable number of struggling
schools within this number, then any further expansion could raise
concerns.
Further details of how we have defined these categories are provided in the methodology section.
0 50 100 150
East Mids.
East
Lancs. & W. Yorks.
North
South-Central
South-East
South-West
West Mids.
Number of sponsors
Existing multi-academy sponsors
High potential
Good candidates, but new challenges
Possible but concerns
Not ready
Insufficient data
NFER: A Guide to Regional Schools Commissioners 10
This once again presents a highly variable picture
between regions. By definition we would expect larger
numbers of existing sponsors to already be operating in
larger regions and those with higher levels of
academisation, such as East Midlands & the Humber.
We would also expect a larger proportion of sponsors to
be ready for further expansion in regions where existing
academies are already performing well.
Both of these factors compound to create a scenario
where the regions with greatest need have the least
capacity to address this need. For example, Lancashire
& West Yorkshire has over 300 schools requiring action
from the RSC, and just 20 sponsors which we estimate
as having high potential to take on new schools
immediately or with some support. At the opposite
extreme, we estimate that South-Central England and
North-West London has fewer than 200 schools
requiring action and a pool of over 40 sponsors who
could potentially take on new schools relatively easily.
Even in the best cases, these ratios still imply a need for
RSCs to look beyond their current pool of sponsors for
support. This could include existing sponsors not
currently operating in their region, local high-performing
schools not currently in a multi-academy arrangement,
or new sponsors identified from among local employers
or charities. However, each of these present additional
challenges (and workload) for the RSC in question.
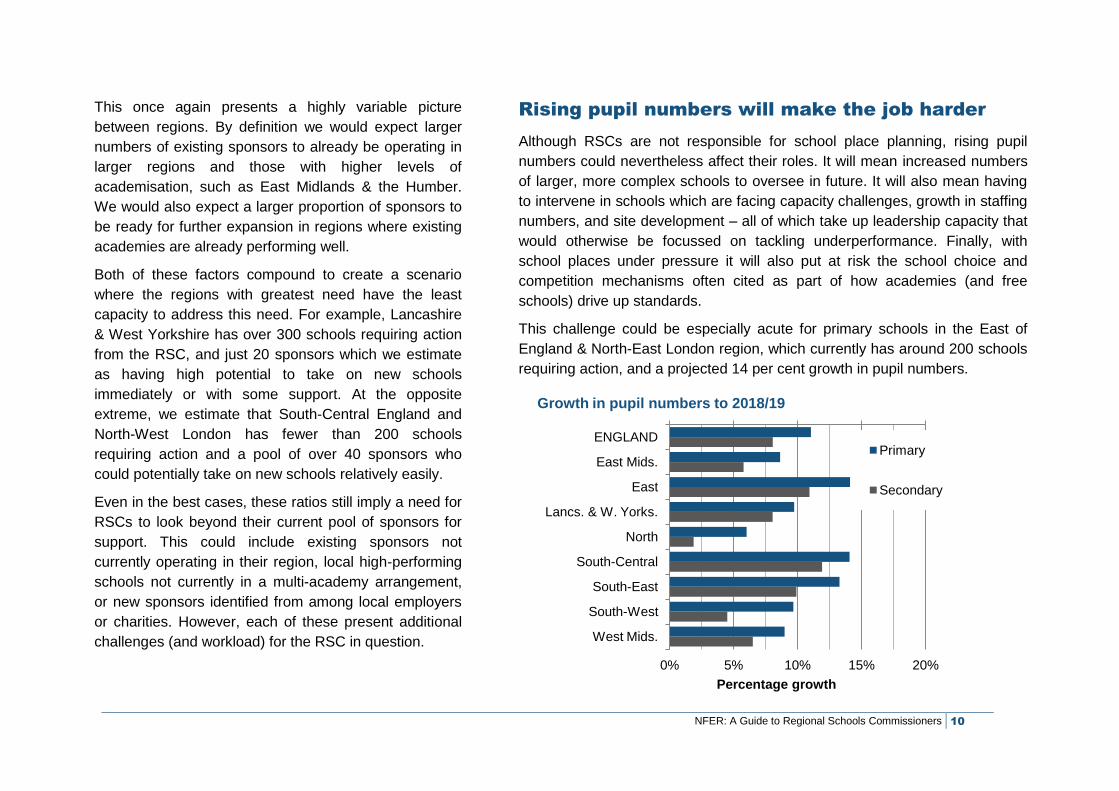
Rising pupil numbers will make the job harder
Although RSCs are not responsible for school place planning, rising pupil
numbers could nevertheless affect their roles. It will mean increased numbers
of larger, more complex schools to oversee in future. It will also mean having
to intervene in schools which are facing capacity challenges, growth in staffing
numbers, and site development – all of which take up leadership capacity that
would otherwise be focussed on tackling underperformance. Finally, with
school places under pressure it will also put at risk the school choice and
competition mechanisms often cited as part of how academies (and free
schools) drive up standards.
This challenge could be especially acute for primary schools in the East of
England & North-East London region, which currently has around 200 schools
requiring action, and a projected 14 per cent growth in pupil numbers.
0% 5% 10% 15% 20%
ENGLAND
East Mids.
East
Lancs. & W. Yorks.
North
South-Central
South-East
South-West
West Mids.
Percentage growth
Growth in pupil numbers to 2018/19
Primary
Secondary
NFER: A Guide to Regional Schools Commissioners 11
4 Region profiles
NFER: A Guide to Regional Schools Commissioners 12
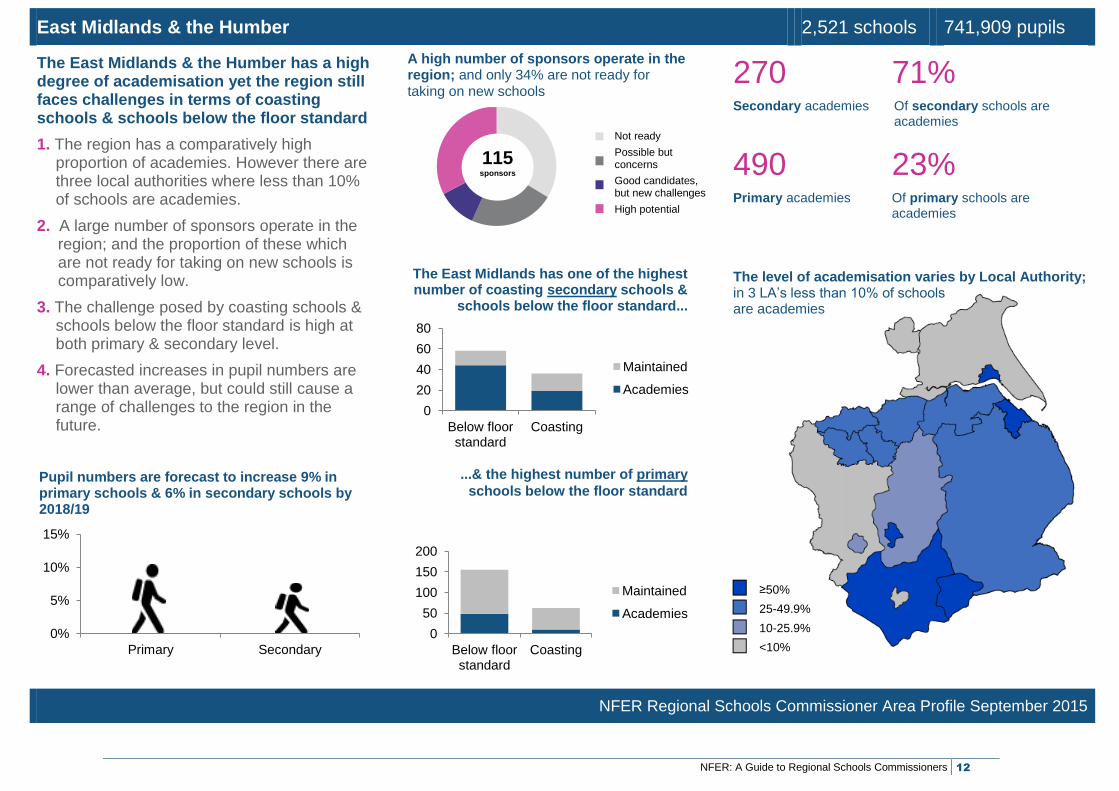
East Midlands & the Humber 2,521 schools 741,909 pupils
The East Midlands & the Humber has a high degree of academisation yet the region still faces challenges in terms of coasting schools & schools below the floor standard
1. The region has a comparatively high proportion of academies. However there are three local authorities where less than 10% of schools are academies.
2. A large number of sponsors operate in the region; and the proportion of these which are not ready for taking on new schools is comparatively low.
3. The challenge posed by coasting schools & schools below the floor standard is high at both primary & secondary level.
4. Forecasted increases in pupil numbers are lower than average, but could still cause a range of challenges to the region in the future.
270 Secondary academies
71% Of secondary schools are academies
490 Primary academies
23% Of primary schools are academies
The level of academisation varies by Local Authority; in 3 LA’s less than 10% of schools are academies
NFER Regional Schools Commissioner Area Profile September 2015
0
20
40
60
80
Below floor standard
Coasting
East Mids.
Maintained
Academies
0%
5%
10%
15%
Primary Secondary
0
50
100
150
200
Below floor standard
Coasting
East Mids.
Maintained
Academies
A high number of sponsors operate in the region; and only 34% are not ready for taking on new schools
115 sponsors
Not ready
Possible but concerns
Good candidates, but new challenges
High potential
Pupil numbers are forecast to increase 9% in primary schools & 6% in secondary schools by 2018/19
The East Midlands has one of the highest number of coasting secondary schools &
schools below the floor standard...
...& the highest number of primary
schools below the floor standard
≥50%
25-49.9%
10-25.9%
<10%
NFER: A Guide to Regional Schools Commissioners 13
0%
5%
10%
15%
Primary Secondary
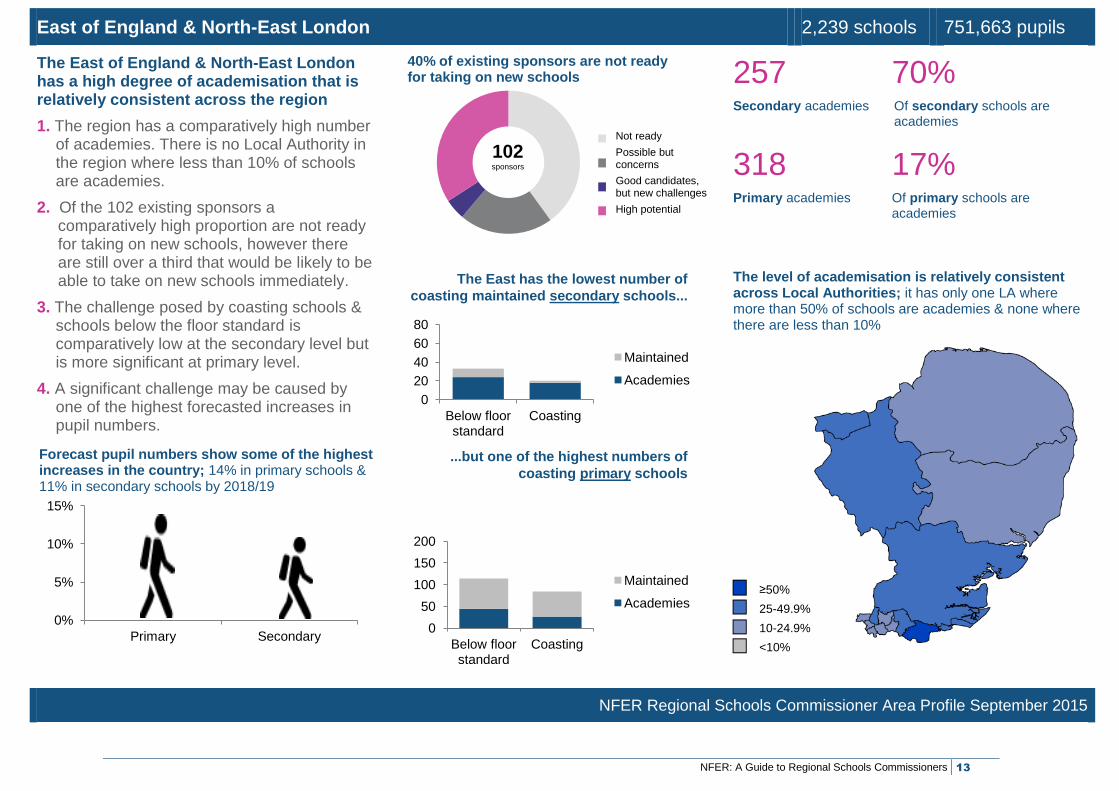
East of England & North-East London 2,239 schools 751,663 pupils
The East of England & North-East London has a high degree of academisation that is relatively consistent across the region
1. The region has a comparatively high number of academies. There is no Local Authority in the region where less than 10% of schools are academies.
2. Of the 102 existing sponsors a comparatively high proportion are not ready for taking on new schools, however there are still over a third that would be likely to be able to take on new schools immediately.
3. The challenge posed by coasting schools & schools below the floor standard is comparatively low at the secondary level but is more significant at primary level.
4. A significant challenge may be caused by one of the highest forecasted increases in pupil numbers.
257 Secondary academies
70% Of secondary schools are academies
318 Primary academies
17% Of primary schools are academies
The level of academisation is relatively consistent across Local Authorities; it has only one LA where more than 50% of schools are academies & none where there are less than 10%
NFER Regional Schools Commissioner Area Profile September 2015
0
20
40
60
80
Below floor standard
Coasting
East
Maintained
Academies
0
50
100
150
200
Below floor standard
Coasting
East
Maintained
Academies
Forecast pupil numbers show some of the highest increases in the country; 14% in primary schools & 11% in secondary schools by 2018/19
102 sponsors
The East has the lowest number of
coasting maintained secondary schools...
...but one of the highest numbers of
coasting primary schools
≥50%
25-49.9%
10-24.9%
<10%
Not ready
Possible but concerns
Good candidates, but new challenges
High potential
40% of existing sponsors are not ready for taking on new schools
NFER: A Guide to Regional Schools Commissioners 14
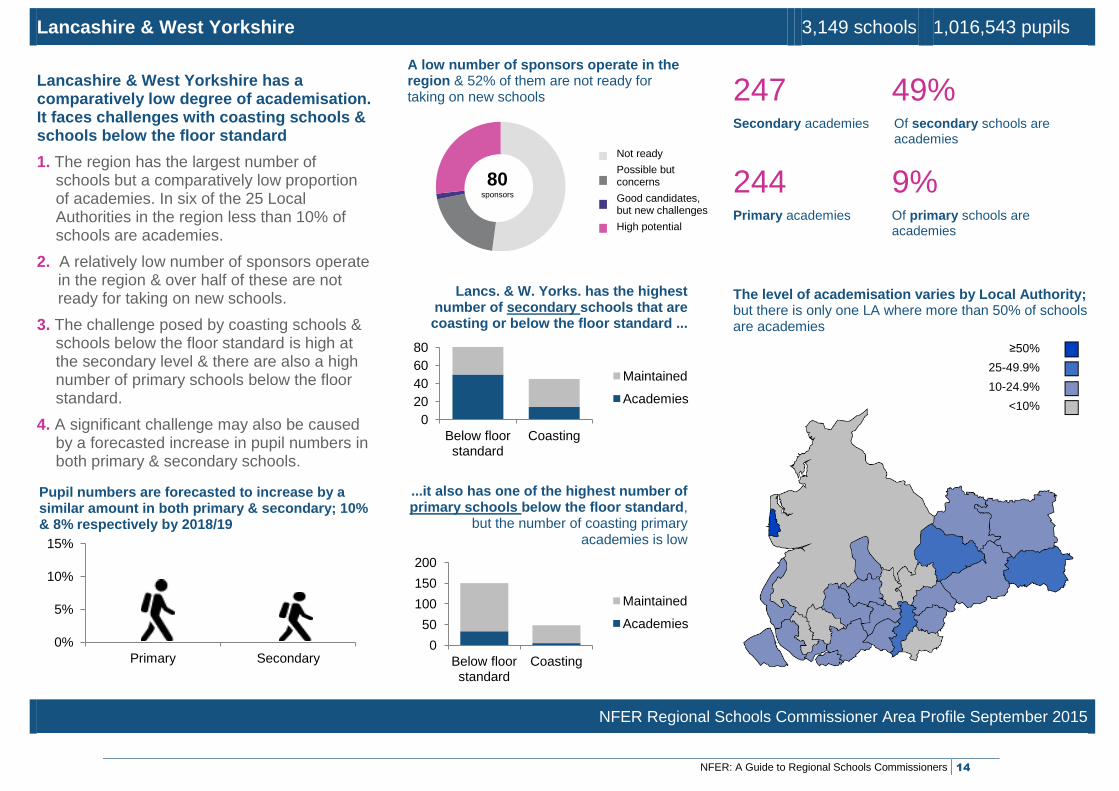
Lancashire & West Yorkshire 3,149 schools 1,016,543 pupils
Lancashire & West Yorkshire has a comparatively low degree of academisation. It faces challenges with coasting schools & schools below the floor standard
1. The region has the largest number of schools but a comparatively low proportion of academies. In six of the 25 Local Authorities in the region less than 10% of schools are academies.
2. A relatively low number of sponsors operate in the region & over half of these are not ready for taking on new schools.
3. The challenge posed by coasting schools & schools below the floor standard is high at the secondary level & there are also a high number of primary schools below the floor standard.
4. A significant challenge may also be caused by a forecasted increase in pupil numbers in both primary & secondary schools.
247 Secondary academies
49% Of secondary schools are academies
244 Primary academies
9% Of primary schools are academies
The level of academisation varies by Local Authority; but there is only one LA where more than 50% of schools are academies
NFER Regional Schools Commissioner Area Profile September 2015
0
20
40
60
80
Below floor standard
Coasting
Lancs. & W. Yorks.
Maintained
Academies
0%
5%
10%
15%
Primary Secondary 0
50
100
150
200
Below floor standard
Coasting
Lancs. & W. Yorks.
Maintained
Academies
A low number of sponsors operate in the region & 52% of them are not ready for taking on new schools
80 sponsors
Pupil numbers are forecasted to increase by a similar amount in both primary & secondary; 10% & 8% respectively by 2018/19
Lancs. & W. Yorks. has the highest number of secondary schools that are coasting or below the floor standard ...
...it also has one of the highest number of primary schools below the floor standard,
but the number of coasting primary academies is low
≥50%
25-49.9%
10-24.9%
<10%
Not ready
Possible but concerns
Good candidates, but new challenges
High potential
NFER: A Guide to Regional Schools Commissioners 15
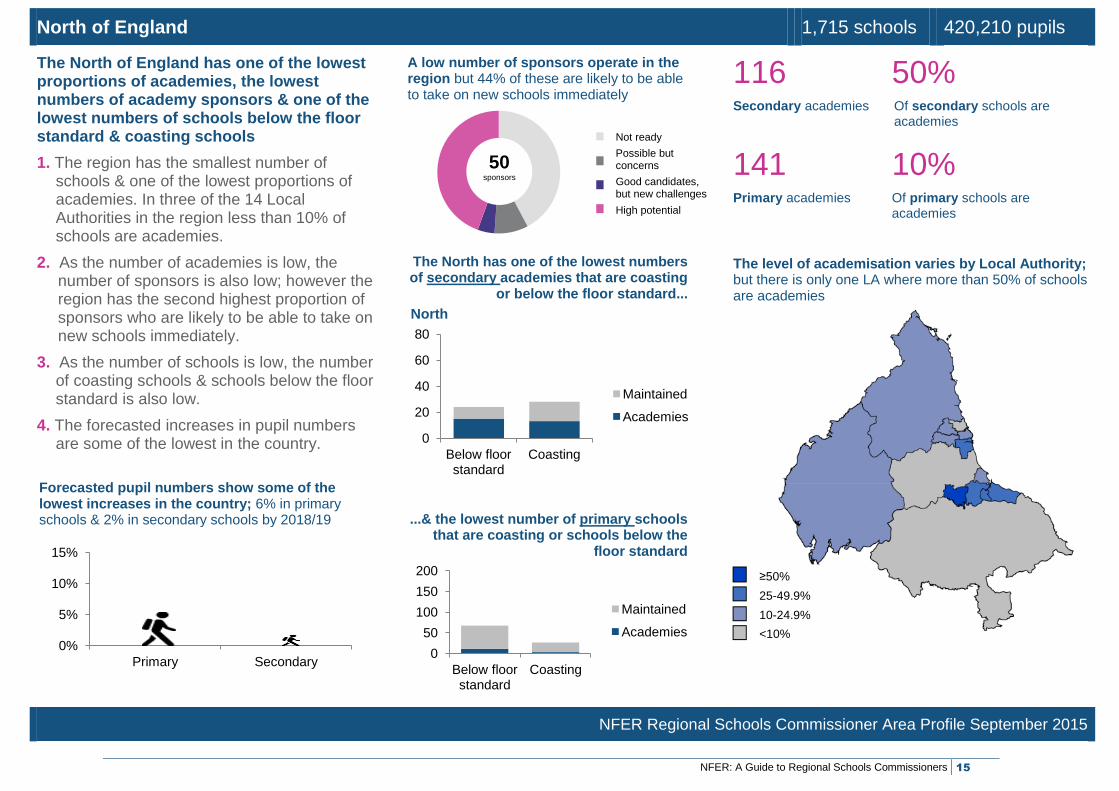
A low number of sponsors operate in the region but 44% of these are likely to be able to take on new schools immediately
North of England 1,715 schools 420,210 pupils
The North of England has one of the lowest proportions of academies, the lowest numbers of academy sponsors & one of the lowest numbers of schools below the floor standard & coasting schools
1. The region has the smallest number of schools & one of the lowest proportions of academies. In three of the 14 Local Authorities in the region less than 10% of schools are academies.
2. As the number of academies is low, the number of sponsors is also low; however the region has the second highest proportion of sponsors who are likely to be able to take on new schools immediately.
3. As the number of schools is low, the number of coasting schools & schools below the floor standard is also low.
4. The forecasted increases in pupil numbers are some of the lowest in the country.
116 Secondary academies
50% Of secondary schools are academies
141 Primary academies
10% Of primary schools are academies
The level of academisation varies by Local Authority; but there is only one LA where more than 50% of schools are academies
NFER Regional Schools Commissioner Area Profile September 2015
0
20
40
60
80
Below floor standard
Coasting
North
Maintained
Academies
0%
5%
10%
15%
Primary Secondary 0
50
100
150
200
Below floor standard
Coasting
North
Maintained
Academies
50 sponsors
Forecasted pupil numbers show some of the lowest increases in the country; 6% in primary schools & 2% in secondary schools by 2018/19
The North has one of the lowest numbers of secondary academies that are coasting
or below the floor standard...
...& the lowest number of primary schools that are coasting or schools below the
floor standard
≥50%
25-49.9%
10-24.9%
<10%
Not ready
Possible but concerns
Good candidates, but new challenges
High potential
NFER: A Guide to Regional Schools Commissioners 16
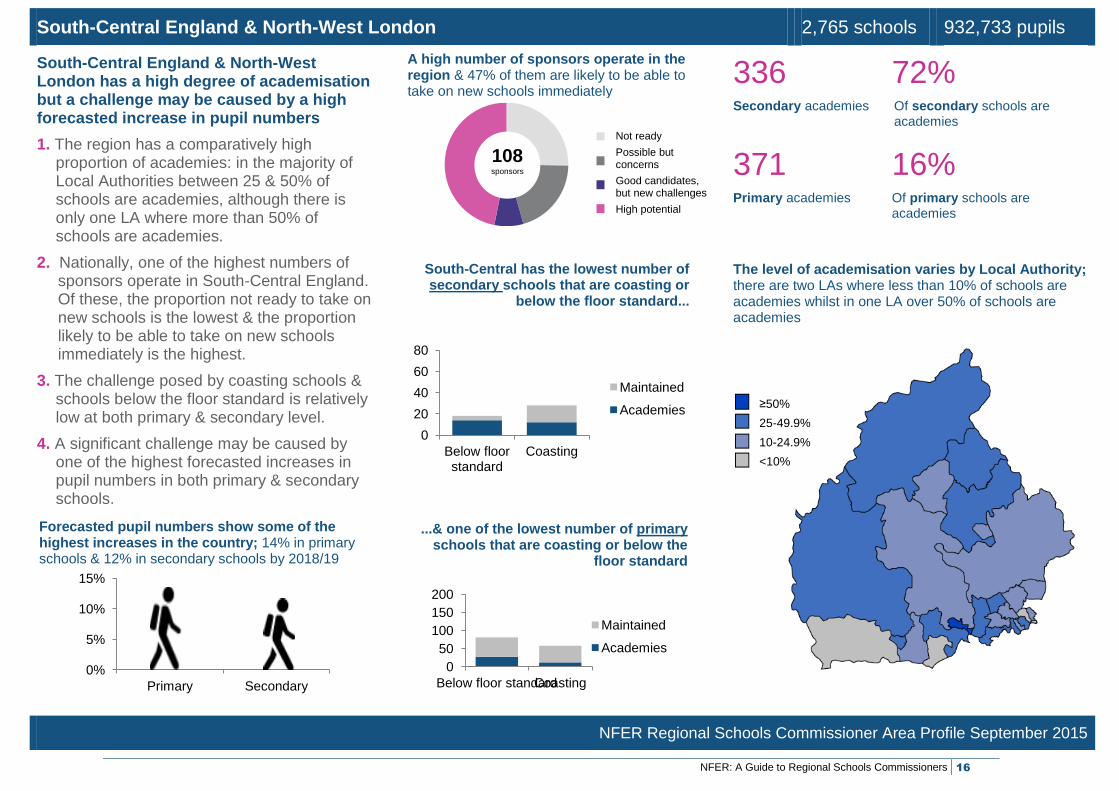
South-Central England & North-West London 2,765 schools 932,733 pupils
South-Central England & North-West London has a high degree of academisation but a challenge may be caused by a high forecasted increase in pupil numbers
1. The region has a comparatively high proportion of academies: in the majority of Local Authorities between 25 & 50% of schools are academies, although there is only one LA where more than 50% of schools are academies.
2. Nationally, one of the highest numbers of sponsors operate in South-Central England. Of these, the proportion not ready to take on new schools is the lowest & the proportion likely to be able to take on new schools immediately is the highest.
3. The challenge posed by coasting schools & schools below the floor standard is relatively low at both primary & secondary level.
4. A significant challenge may be caused by one of the highest forecasted increases in pupil numbers in both primary & secondary schools.
336 Secondary academies
72% Of secondary schools are academies
371 Primary academies
16% Of primary schools are academies
The level of academisation varies by Local Authority; there are two LAs where less than 10% of schools are academies whilst in one LA over 50% of schools are academies
NFER Regional Schools Commissioner Area Profile September 2015
0
20
40
60
80
Below floor standard
Coasting
South-Central
Maintained
Academies
0%
5%
10%
15%
Primary Secondary
0
50
100
150
200
Below floor standard Coasting
South-Central
Maintained
Academies
108 sponsors
Forecasted pupil numbers show some of the highest increases in the country; 14% in primary schools & 12% in secondary schools by 2018/19
Not ready
Possible but concerns
Good candidates, but new challenges
High potential
South-Central has the lowest number of secondary schools that are coasting or
below the floor standard...
...& one of the lowest number of primary schools that are coasting or below the
floor standard
≥50%
25-49.9%
10-24.9%
<10%
A high number of sponsors operate in the region & 47% of them are likely to be able to take on new schools immediately
NFER: A Guide to Regional Schools Commissioners 17
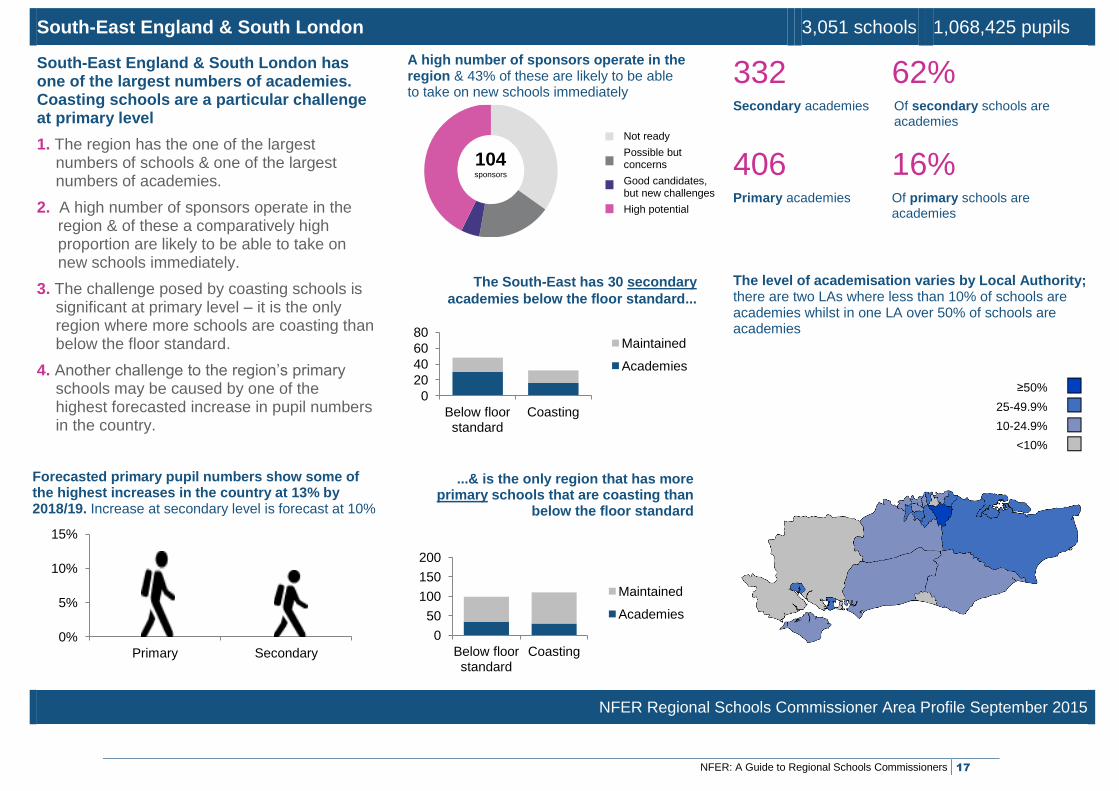
South-East England & South London 3,051 schools 1,068,425 pupils
South-East England & South London has one of the largest numbers of academies. Coasting schools are a particular challenge at primary level
1. The region has the one of the largest numbers of schools & one of the largest numbers of academies.
2. A high number of sponsors operate in the region & of these a comparatively high proportion are likely to be able to take on new schools immediately.
3. The challenge posed by coasting schools is significant at primary level – it is the only region where more schools are coasting than below the floor standard.
4. Another challenge to the region’s primary schools may be caused by one of the highest forecasted increase in pupil numbers in the country.
332 Secondary academies
62% Of secondary schools are academies
406 Primary academies
16% Of primary schools are academies
The level of academisation varies by Local Authority; there are two LAs where less than 10% of schools are academies whilst in one LA over 50% of schools are academies
NFER Regional Schools Commissioner Area Profile September 2015
0
20
40
60
80
Below floor standard
Coasting
Maintained
Academies
0%
5%
10%
15%
Primary Secondary
0
50
100
150
200
Below floor standard
Coasting
South-East
Maintained
Academies
104 sponsors
Forecasted primary pupil numbers show some of the highest increases in the country at 13% by 2018/19. Increase at secondary level is forecast at 10%
The South-East has 30 secondary
academies below the floor standard...
...& is the only region that has more primary schools that are coasting than
below the floor standard
≥50%
25-49.9%
10-24.9%
<10%
Not ready
Possible but concerns
Good candidates, but new challenges
High potential
A high number of sponsors operate in the region & 43% of these are likely to be able to take on new schools immediately
NFER: A Guide to Regional Schools Commissioners 18
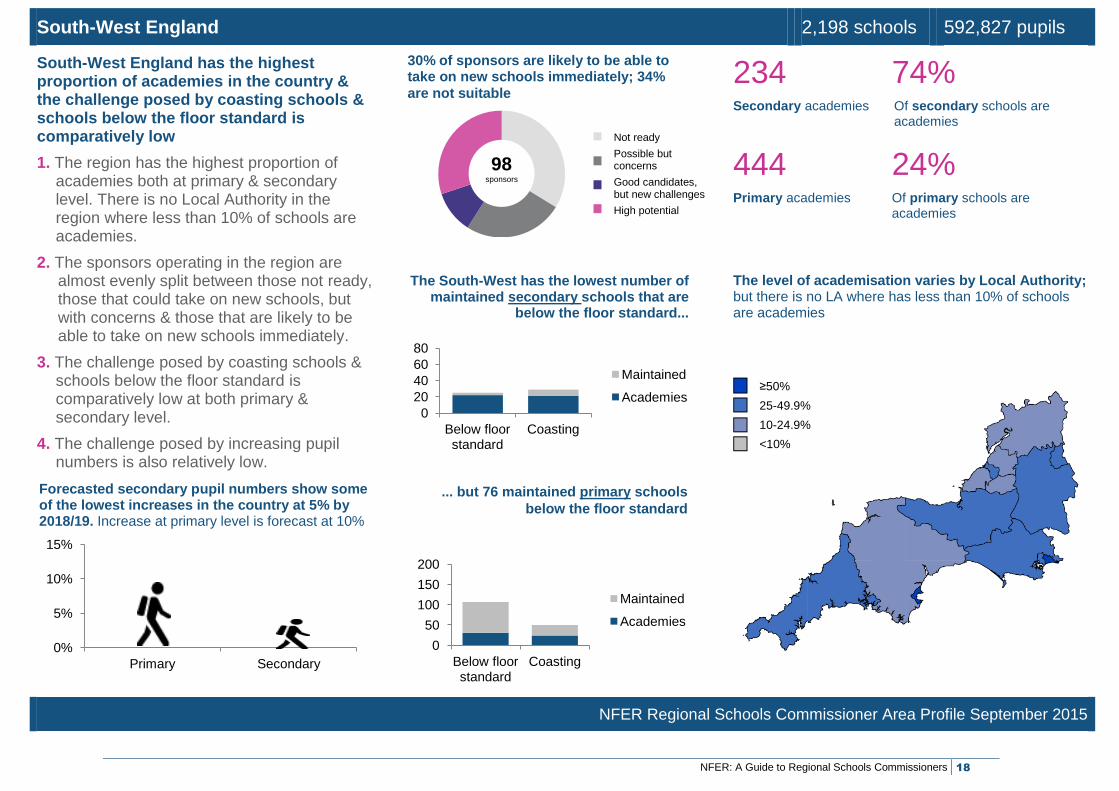
South-West England 2,198 schools 592,827 pupils
South-West England has the highest proportion of academies in the country & the challenge posed by coasting schools & schools below the floor standard is comparatively low
1. The region has the highest proportion of academies both at primary & secondary level. There is no Local Authority in the region where less than 10% of schools are academies.
2. The sponsors operating in the region are almost evenly split between those not ready, those that could take on new schools, but with concerns & those that are likely to be able to take on new schools immediately.
3. The challenge posed by coasting schools & schools below the floor standard is comparatively low at both primary & secondary level.
4. The challenge posed by increasing pupil numbers is also relatively low.
234 Secondary academies
74% Of secondary schools are academies
444 Primary academies
24% Of primary schools are academies
The level of academisation varies by Local Authority; but there is no LA where has less than 10% of schools are academies
NFER Regional Schools Commissioner Area Profile September 2015
0
20
40
60
80
Below floor standard
Coasting
South-West
Maintained
Academies
0%
5%
10%
15%
Primary Secondary
0
50
100
150
200
Below floor standard
Coasting
South-West
Maintained
Academies
98 sponsors
Forecasted secondary pupil numbers show some of the lowest increases in the country at 5% by 2018/19. Increase at primary level is forecast at 10%
The South-West has the lowest number of maintained secondary schools that are
below the floor standard...
... but 76 maintained primary schools
below the floor standard
≥50%
25-49.9%
10-24.9%
<10%
Not ready
Possible but concerns
Good candidates, but new challenges
High potential
30% of sponsors are likely to be able to take on new schools immediately; 34%
are not suitable
NFER: A Guide to Regional Schools Commissioners 19
≥50%
25-49.9%
10-24.9%
<10%
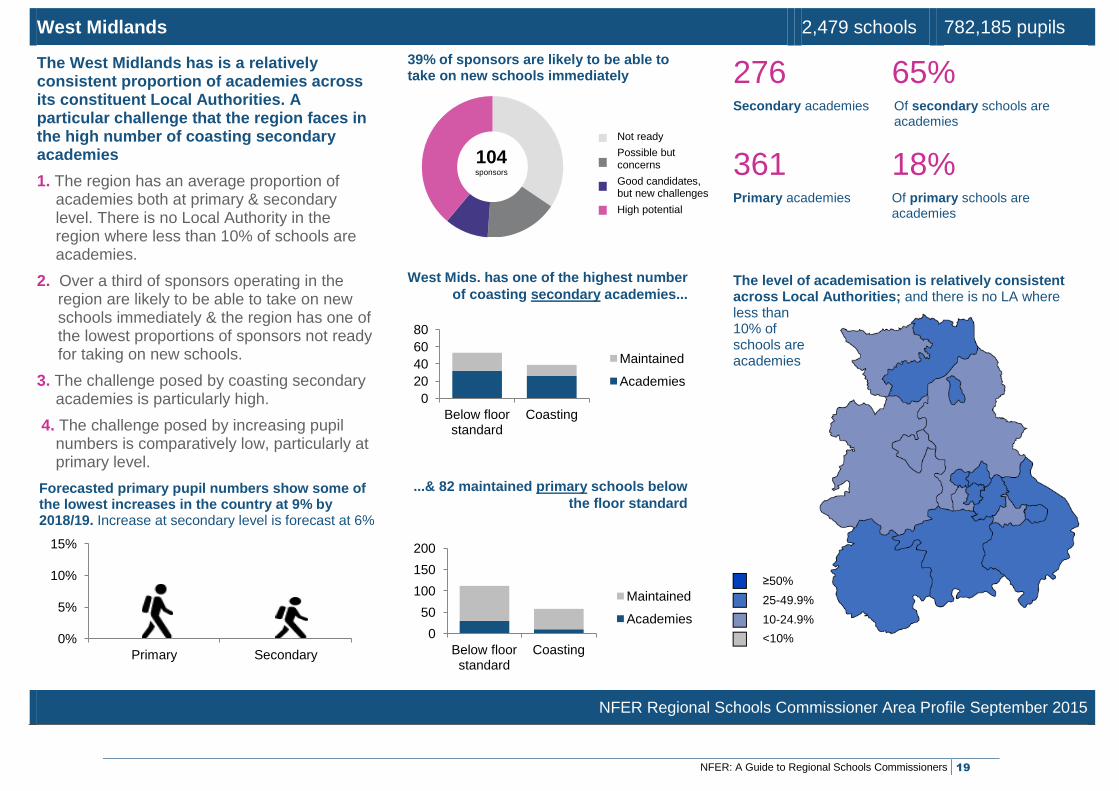
West Midlands 2,479 schools 782,185 pupils
The West Midlands has is a relatively consistent proportion of academies across its constituent Local Authorities. A particular challenge that the region faces in the high number of coasting secondary academies
1. The region has an average proportion of academies both at primary & secondary level. There is no Local Authority in the region where less than 10% of schools are academies.
2. Over a third of sponsors operating in the region are likely to be able to take on new schools immediately & the region has one of the lowest proportions of sponsors not ready for taking on new schools.
3. The challenge posed by coasting secondary academies is particularly high.
4. The challenge posed by increasing pupil numbers is comparatively low, particularly at primary level.
276 Secondary academies
65% Of secondary schools are academies
361 Primary academies
18% Of primary schools are academies
The level of academisation is relatively consistent across Local Authorities; and there is no LA where less than 10% of schools are academies
NFER Regional Schools Commissioner Area Profile September 2015
0
20
40
60
80
Below floor standard
Coasting
West Mids.
Maintained
Academies
0%
5%
10%
15%
Primary Secondary
0
50
100
150
200
Below floor standard
Coasting
West Mids.
Maintained
Academies
104 sponsors
Forecasted primary pupil numbers show some of the lowest increases in the country at 9% by 2018/19. Increase at secondary level is forecast at 6%
West Mids. has one of the highest number
of coasting secondary academies...
...& 82 maintained primary schools below
the floor standard
Not ready
Possible but concerns
Good candidates, but new challenges
High potential
39% of sponsors are likely to be able to take on new schools immediately
NFER: A Guide to Regional Schools Commissioners 20
5 Methodology
NFER: A Guide to Regional Schools Commissioners 21
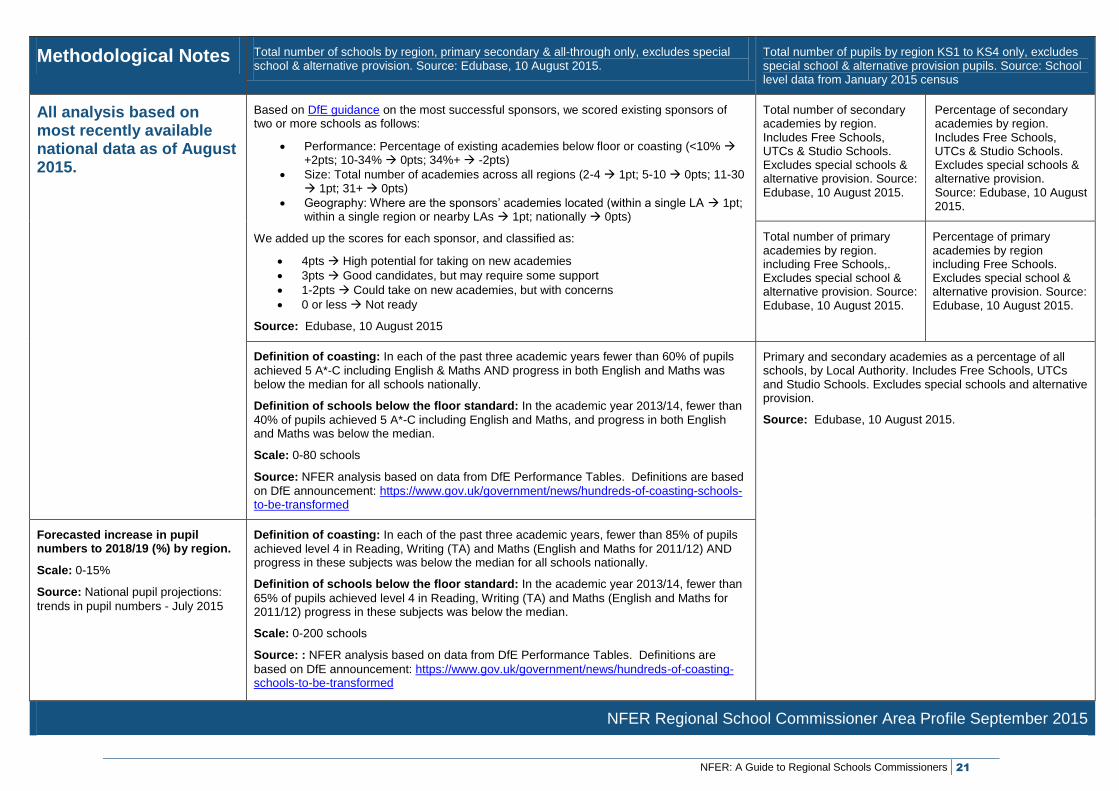
Methodological Notes Total number of schools by region, primary secondary & all-through only, excludes special school & alternative provision. Source: Edubase, 10 August 2015.
Total number of pupils by region KS1 to KS4 only, excludes special school & alternative provision pupils. Source: School level data from January 2015 census
All analysis based on most recently available national data as of August 2015.
Based on DfE guidance on the most successful sponsors, we scored existing sponsors of two or more schools as follows:
Performance: Percentage of existing academies below floor or coasting (<10% +2pts; 10-34% 0pts; 34%+ -2pts)
Size: Total number of academies across all regions (2-4 1pt; 5-10 0pts; 11-30 1pt; 31+ 0pts)
Geography: Where are the sponsors’ academies located (within a single LA 1pt; within a single region or nearby LAs 1pt; nationally 0pts)
We added up the scores for each sponsor, and classified as:
4pts High potential for taking on new academies
3pts Good candidates, but may require some support
1-2pts Could take on new academies, but with concerns
0 or less Not ready
Source: Edubase, 10 August 2015
Total number of secondary academies by region. Includes Free Schools, UTCs & Studio Schools. Excludes special schools & alternative provision. Source: Edubase, 10 August 2015.
Percentage of secondary academies by region. Includes Free Schools, UTCs & Studio Schools. Excludes special schools & alternative provision. Source: Edubase, 10 August 2015.
Total number of primary academies by region. including Free Schools,. Excludes special school & alternative provision. Source: Edubase, 10 August 2015.
Percentage of primary academies by region including Free Schools. Excludes special school & alternative provision. Source: Edubase, 10 August 2015.
Definition of coasting: In each of the past three academic years fewer than 60% of pupils
achieved 5 A*-C including English & Maths AND progress in both English and Maths was below the median for all schools nationally.
Definition of schools below the floor standard: In the academic year 2013/14, fewer than
40% of pupils achieved 5 A*-C including English and Maths, and progress in both English and Maths was below the median.
Scale: 0-80 schools
Source: NFER analysis based on data from DfE Performance Tables. Definitions are based
on DfE announcement: https://www.gov.uk/government/news/hundreds-of-coasting-schools-to-be-transformed
Primary and secondary academies as a percentage of all schools, by Local Authority. Includes Free Schools, UTCs and Studio Schools. Excludes special schools and alternative provision.
Source: Edubase, 10 August 2015.
Forecasted increase in pupil numbers to 2018/19 (%) by region.
Scale: 0-15%
Source: National pupil projections:
trends in pupil numbers - July 2015
Definition of coasting: In each of the past three academic years, fewer than 85% of pupils
achieved level 4 in Reading, Writing (TA) and Maths (English and Maths for 2011/12) AND progress in these subjects was below the median for all schools nationally.
Definition of schools below the floor standard: In the academic year 2013/14, fewer than
65% of pupils achieved level 4 in Reading, Writing (TA) and Maths (English and Maths for 2011/12) progress in these subjects was below the median.
Scale: 0-200 schools
Source: : NFER analysis based on data from DfE Performance Tables. Definitions are
based on DfE announcement: https://www.gov.uk/government/news/hundreds-of-coasting-schools-to-be-transformed
NFER Regional School Commissioner Area Profile September 2015
NFER: A Guide to Regional Schools Commissioners 22
ISBN: 978-1-910008-78-2
NFER Ref: RSCR