Embed Size (px)
Citation preview

A G U I D E T O
POLLUTION PREVENTION
P L A N N I N G
Meeting the Requirements of the Waste Reduction Policy Act
Save Money
Reduce Risk
Eliminate Waste
T E X A S C O M M I S S I O N O N E N V I R O N M E N T A L Q U A L I T YRG-409 (Rev. 5/17) www.tceq.texas.gov/publications/rg/rg-409.html


i
A G U I D E T O
POLLUTION PREVENTION
P L A N N I N G
Meeting the Requirements of theWaste Reduction Policy Act
Save Money | Reduce Risk | Eliminate Waste
For additional assistance with P2 regulations, visit
www.P2Plan.org

ii
Bryan W. Shaw, Ph.D., P.E., ChairmanToby Baker, Commissioner
Jon Niermann, Commissioner
Richard A. Hyde, P.E., Executive Director
Published and distributed by Texas Commission on Environmental Quality
P.O. Box 13087Austin, TX 78711-3087
We authorize you to use or reproduce any original material contained in this publication—that is, any material we did not obtain from other sources. Please acknowledge the TCEQ as your source.
Copies of this publication are available for public use through the Texas State Library, other state depository libraries, and the TCEQ Library, in compliance with state depository law. For more information on TCEQ publications visit our website at:
tceq.texas.gov/publications
The TCEQ is an equal opportunity employer. The agency does not allow discrimination on the basis of race, color, religion, national origin, sex, disability, age, sexual orientation, or veteran status. In compliance with the Americans with Disabilities Act, this document may be requested in alternate formats by contacting the TCEQ at 512-239-0010 or 1-800-RELAY-TX (TDD), or by writing P.O. Box 13087, Austin, TX 78711-3087. printed on recycled paper
How is our customer service? tceq.texas.gov/customersurvey

iii
Contents
INTRODUCTION .................................................................... 1Who Should Read This Guide ................................................ 1How to Use This Guide ........................................................... 1How to Get Assistance ........................................................... 1
CHAPTER 1. PREVENTING POLLUTION ............................ 3What Is Pollution Prevention? ................................................. 3Why P2? .................................................................................. 3 P2 Is Texas Law .................................................................. 3 P2 Is Paperwork Reduction ................................................ 4 Reduction of TRI Requirements .......................................... 4 P2 Saves Money ................................................................. 4 P2 Reduces Your Risk ........................................................ 4 Reduction of Hazardous Waste Regulatory
Requirements ..................................................................... 4 Enhancing Public Image .................................................... 4
CHAPTER 2. COMPLYING WITH THE WASTE REDUCTION POLICY ACT ...................................... 5Hazardous Waste ................................................................... 5 Getting Information on Hazardous Waste .......................... 5Toxics Release Inventory (TRI) ............................................... 5 Form R versus Form A ........................................................ 6 Getting Help with the TRI .................................................... 6P2 Planning Requirements ..................................................... 6Due Dates ............................................................................... 6 Facilities New to P2 Planning ............................................. 6 P2 Plan Renewal ................................................................. 6 Annual Reporting Requirements ........................................ 7 Base-Year Date ................................................................... 7 If You Are Late .................................................................... 8Exemption from P2 Planning .................................................. 8Graduating from P2 Planning ................................................. 8The P2 Planning Process ....................................................... 8 Seven Steps to Pollution Prevention Planning .................... 8
CHAPTER 3. IDENTIFYING YOUR PROCESSES AND WASTES ................................................ 9Forming a Site Assessment Team .......................................... 9 Directions for Worksheet 1: Assessment Team .................. 9Conducting the Site Assessment ........................................... 9Diagramming Your Processes .............................................. 11 Directions for Worksheet 2: Process Flow Diagram ......... 11Identifying Waste from Activities .......................................... 12
CHAPTER 4. PRIORITIZING YOUR WASTE ...................... 15Directions for Worksheet 3: Prioritized List of Wastes .......... 15 Filling out Worksheet 3 ..................................................... 15 Assessing the Risk ........................................................... 15 Estimating Cost ................................................................. 15
CHAPTER 5. IDENTIFYING YOUR P2 PROJECTS ........... 19Developing Your Options ..................................................... 19Researching the Internet ...................................................... 19Getting Answers to Permitting Questions............................. 19
CHAPTER 6. PRIORITIZING YOUR PROJECTS AND SETTING GOALS ................................... 21Technical and Economic Evaluation ..................................... 21Technical Feasibility ............................................................. 21Economic Feasibility ............................................................. 21 How Complex Should Your Analysis Be? ......................... 22 Simple Economic Analysis ............................................... 22
Identifying Hidden Costs .................................................. 22 Full-Cost Accounting ........................................................ 22Environmental Media Shift .................................................... 23Risk Evaluation ..................................................................... 23Setting Goals and an Implementation Schedule .................. 23 Directions for Worksheet 4, Project Description
and Goals ......................................................................... 23
CHAPTER 7. TRAINING EMPLOYEES ON P2 AWARENESS ........................................................... 27Questions Your Assessment Team Can Address ................. 27Evaluating Your Training Program ........................................ 27 Directions for Worksheet 5, Employee Awareness
and Training ...................................................................... 27
CHAPTER 8. DOCUMENTING THE P2 PLAN .................... 31Documentation of the Pollution Prevention Plan and Executive Summary ...................................................... 31 Documentation Requirements for LQGs or TRI
Reporters .......................................................................... 31 Documentation Requirements for SQGs Who
Are Not TRI Reporters ...................................................... 31P2 Plan Format and When to Revise .................................... 31
CHAPTER 9. REPORTING ANNUALLY ............................. 37Purpose of the Annual Progress Report ............................... 37Reporting Online through STEERS ....................................... 37Instructions for Completing the APR Form ........................... 38 Part 1. Facility Description ................................................ 38 Part 2. Projected Amounts for Goal Year .......................... 38 Part 3. Reduction Achievement for the Report Year ......... 39
CHAPTER 10. SUBMITTING DOCUMENTS ....................... 43Submitting the Executive Summary...................................... 43Submitting Annual Progress Reports (APRs) ....................... 43Getting Additional Assistance .............................................. 43
APPENDICESA. Resources for Pollution Prevention Planning ................. 46B. Source Reduction Activities by Category ...................... 47C. Full-Cost Accounting Worksheet .................................... 48D. P2 Annual Progress Report Form .................................. 53
FIGURES1. Avenues of Waste .......................................................... 112. A Sample Facility Operations Diagram .......................... 11
TABLES1. Hazardous Waste Generator Categories ......................... 52. Basic P2 Planning Requirements by Facility Type ........... 73. P2 Planning Requirements and Worksheets Guidance ... 74. Minimum Documentation Requirements for LQGs or
TRI Form R Reporters .................................................... 325. Minimum Document Requirements for SQGs That
Do Not Report on TRI Form R ........................................ 32
EXAMPLES1. A Completed Worksheet 1 ............................................... 92. A Process Flow Diagram ................................................ 123. A True Cost Analysis ...................................................... 164. A Simple Economic-Feasibility Analysis ........................ 22
iv
5. Comparison of the Cost of Using Hazardous Solvent at an Auto Repair Shop ..................................... 22
6. Estimating the Number of Employees ............................ 397. Calculating Five-Year Source Reduction ....................... 398. Calculating Percent Waste Minimization ........................ 409. Basic Source-Reduction Estimation ............................... 4010. Estimating Source Reduction When There Is a
Change in the Production Rate ...................................... 4011. Materials Reported under Both TRI and Hazardous
Waste Regulations ......................................................... 4112. Waste-Reduction Option: Installing a Two-Gallon
Solvent-Distillation Unit .................................................. 4913. Step 6 (Worksheet 7): Comparing Costs Using
Waste-Reduction vs Business as Usual ......................... 50
WORKSHEETS1. Assessment team ........................................................... 102. Process Flow Diagram ................................................... 133a. Prioritized List of Hazardous Wastes ............................. 173b. Prioritized List of TRI Releases and Transfers ................ 184. Project Description and Goals ....................................... 245. Employee Awareness and Training ................................ 286. Executive Summary and Certificate of Completeness
and Correctness ............................................................ 337. Full-Cost Accounting Worksheet .................................... 51
FORMP2 Annual Progress Report (Form TCEQ-00784) ................. 53

1
Introduction
T he Waste Reduction Policy Act (WRPA) of 1991 was adopted by the Texas Legislature to reduce the volume, toxicity, adverse public health, and environmental effects of pollutants in
Texas. The WRPA pollution prevention planning law is contained in the Texas Health and Safety Code, Sections 361.501–361.510. Rules implementing WRPA are found in Title 30 of the Texas Administrative Code (30 TAC) Chapter 335, Subchapter Q. The Texas Commission on Environmental Quality (TCEQ) administers these rules.
Waste Reduction is mandated by the U.S. Congress in the 1984 Hazardous and Solid Waste Amendments to the Resource Conservation and Recovery Act (RCRA). This and other RCRA provisions have led to more effective waste management and decreases in hazardous waste generation and toxic contaminant releases.
Who Should Read This GuideThis guide discusses the pollution prevention law, takes you through the steps of pollution prevention planning, and includes forms for documenting your P2 Plan and its progress. The intended users for this guide include:
� Large quantity generators (LQGs) of hazardous waste
� Small quantity generators (SQGs) of hazardous waste
� Toxics Release Inventory (TRI) Form R reportersFacilities that are SQGs of hazardous waste and
do not report on the TRI Form R have fewer require-ments under the WRPA, but they still must prepare a plan. The Pollution Prevention Planning requirements do not apply to conditionally exempt small quantity generators (CESQGs) if they don’t report on the TRI Form R.
How to Use This GuideThe guide will lead you through the following processes:
� Developing a pollution prevention program for your facility.
� Writing your Pollution Prevention (P2) Plan and Executive Summary.
� Completing Annual Progress Reports (APRs).If your facility does not have a P2 Plan in place, but
is already incorporating pollution prevention activities into plant operations, the planning process will be useful in documenting existing activities and developing new projects for your plan.
If you have a P2 Plan in place, you may use this guide to verify that all required elements have been covered in your plan, or to guide you through the preparation and submission of the Executive Summary and the Annual Progress Reports.
How to Get AssistanceThe Pollution Prevention and Education (PPE) section of the TCEQ provides guidance and technical assistance to companies that are subject to Pollution Prevention Planning. Our goal is to help find innova-tive approaches to waste reduction and management, while saving time and money, and promoting sustain-able economic growth.
The Pollution Prevention staff strive to assist companies in maintaining compliance and reducing waste by offering educational workshops, access to web-based resources (at <www.P2Plan.org>), and P2 technical assis-tance over the phone. You can contact us at 512-239-3143. We’ll answer your questions about P2 requirements, help you find ways to reduce waste, and tell you more about other opportunities to prevent pollution.
AcronymsAPR Annual Progress ReportCESQG Conditionally Exempt Small Quantity GeneratorCFR Code of Federal RegulationsEMS Environmental Management SystemEPA U.S. Environmental Protection AgencyHAP Hazardous Air PollutantsLQG Large Quantity GeneratorP2 Pollution PreventionRCRA Resource Conservation and Recovery ActSDS Safety Data SheetsSQG Small Quantity GeneratorSTEERS State of Texas Environmental Electronic
Reporting SystemTCEQ Texas Commission on Environmental QualityTEEA Texas Environmental Excellence AwardTRI Toxics Release InventoryVOC Volatile Organic CompoundWRPA Waste Reduction Policy ActSWPPP Storm Water Pollution Prevention Plan

2

3
CHAPTER 1.
Preventing Pollution
In this chapter . . . � Discover the preferred strategies for waste management.
� Learn how to use your required P2 Plan as a stepping stone to an environmental management system (EMS).
Since its inception in the early 1990s, WRPA has proven that successful pollution prevention begins with planning and making a strong commitment to reducing waste. The first group of facilities
to comply with the P2 planning law in the 1990s reduced hazardous waste generation by 25 percent. Nearly half of these compliant facilities reported annual cost savings of more than $40,000. By contrast, facilities without P2 Plans increased hazardous waste generation by 7 percent. The conclusion was obvious: P2 planning reduces waste and saves money.
Since then, facilities throughout the state have used P2 planning to reduce the state’s overall generation of hazard-ous waste and toxic chemicals. According to the P2 Annual Progress Reports (APRs) submitted by facilities from 1998 to 2014, Texas companies have reduced the amount of haz-ardous waste generated by more than 13 million tons. They also prevented the release and transfer of over 4 million tons of toxic chemicals. Hundreds of case studies show how facilities’ innovations in P2 have resulted in both pollution reduction and monetary savings.
There are many reasons to develop a P2 Plan that reduces waste generation and toxic releases and transfers to the environment. Six important reasons to practice pollution prevention are:
1. Economic incentives2. Paperwork reduction3. Reduced liability4. Regulatory requirements5. Enhanced public image6. Improved human health and the environment
What Is Pollution Prevention?Pollution prevention is avoiding the disposal or release of substances into the environment by means of source reduc-tion and waste minimization. However, certain approaches to pollution prevention are preferred over others, because they are more effective. The Texas Solid Waste Disposal Act describes a preferred order of waste management strategies, known as the waste management hierarchy, which ranks the strategies from most to least preferable. The waste management hierarchy applies to both hazardous and nonhazardous waste, as well as to air and water releases.
This guide focuses on the most preferred strategies: source reduction, reuse, and recycling.
The Texas definition of pollution prevention highlights source reduction and waste minimization as strategies for preventing pollution. These definitions are found in 30 TAC Chapter 335, Subchapter Q, Section 471 (13 and 16):
Source reduction—any practice that “reduces the amount of any hazardous substance, pollutant, or contaminant entering a waste stream, or otherwise released to the environment (including fugitive emis-sions) prior to recycling, treatment, or disposal.”
Waste minimization—any practice that “reduces the environmental or health hazards associated with hazardous wastes, pollutants, or contaminants. Examples include reuse, recycling, neutralization, and detoxification.”
Source reduction is the most preferable strategy for your bottom line and the environment. Source reduction only occurs when you make a change that allows you to generate the same amount of product with less pollution. This means increased efficiency in the conversion of raw materials to marketable products or services. However, reductions in pollution and waste generation due to plant closures, decreases in production, or regulatory changes do not qualify as source reduction.
Under Texas requirements for P2 planning, companies are asked to make a reasonable search for source-reduction and waste-minimization projects to address all activities that generate reportable hazardous wastes and/or TRI chemicals. You may also address other wastes, such as water use, solid waste, air emissions, and energy consump-tion. Evaluation of your other wastes can increase your savings through reduced operating and disposal costs.
Why P2?Pollution prevention offers many benefits to both the environment and businesses.
P2 Is Texas LawIn the state of Texas, P2 planning is mandatory for all large and small generators of hazardous waste, as well as all TRI Form R reporters. The goal of the Texas state policy

4
on pollutants and contaminants is to reduce pollution at its source and to minimize the impact of pollution. This can result in reduced risks to public health and the environment, as well as the prevention of penalties and fines accrued from noncompliance with P2 and other environmental laws.
P2 Is Paperwork ReductionGenerating and releasing large quantities of hazardous wastes and toxic chemicals can result in increased permit requirements. The paperwork required for environmental reporting and record keeping can be extensive. This paperwork can cost you time and money.
Fortunately, as you lessen environmental impacts, you may also reduce—even eliminate—many reporting require-ments. Integration of P2 techniques may even help you drop below reporting thresholds for other requirements.
Reduction of TRI RequirementsThose who report on the Environmental Protection Agency’s TRI Form R can also reduce paperwork through P2 planning. Each reportable TRI chemical requires a sepa-rate Form R. If your facility reduces reportable chemicals that are managed or released to levels that are below the reporting thresholds, you may be able to use Form A. This form is significantly shorter to complete and is not subject to the P2 planning requirements. For more information on TRI, see “Toxics Release Inventory” in Chapter 2.
No matter what type of waste you generate, release, or transfer, you will find that integrating the planning process into facility operations helps you find ways to reduce or even eliminate the need to report hazardous waste and TRI.
P2 Saves MoneyPollution control and waste management activities cost money. The generation of waste and release of pollution can also trigger additional costs associated with liability and employee time spent on waste-handling and regulatory-compliance activities. Hundreds of facilities have proven that preventing pollution at its source saves industry millions in operating costs and has a quick payback period. Pollution control, which is often more expensive to implement, almost never pays for itself, and rarely reduces operating costs.
Despite this trend, many companies are reluctant to try innovative P2 ideas, and often choose expensive pollu-tion control methods over money-saving reduction efforts. When all critical decision-making factors are taken into account (see Chapter 6) during the P2 planning process, companies are able to make better management decisions, and they begin saving money almost immediately. Texas facilities have reported big savings from developing practi-cal P2 Plans.
P2 Reduces Your RiskOnce your facility generates a hazardous waste, you are legally responsible for the proper management of that
waste. Federal and state laws target hazardous waste generators as being at least partially responsible for the cleanup of wastes that leak from disposal sites.
Hazardous chemicals pose immediate health concerns because they are caustic or flammable, or have some other harmful characteristic. Even a small spill of some chemicals can contaminate the groundwater and lead to costly remediation projects. By reducing your handling of toxic chemicals, you can:
� Reduce your long-term liability and health and safety risks.
� Avoid using off-site treatment, storage, or disposal that could cause financial liability when operators mismanage waste and design improper disposal facilities.
� Gain better insurance options, which may not be available to high-risk facilities with higher treat-ment and disposal costs.
� Reduce your expenses by reducing the cause of your liability—your hazardous waste and toxic releases and transfers.
Reduction of Hazardous Waste Regulatory RequirementsIt pays to be aware of your generator status and to try to reduce it to a lower level. As you switch to less-hazardous materials, incorporate cleaner processes, and reduce your overall environmental impacts, you can reduce your regulatory burden and may be able to change your generator status, reaping even greater benefits.
For example, if your facility is a large quantity generator (LQG) and becomes a small quantity generator (SQG), you may benefit from increased storage time and fewer pollution prevention requirements (see Chapter 2 for details on P2 planning requirements). If your facility is already an SQG, your P2 planning requirements could be eliminated by becoming a conditionally exempt small quantity generator (CESQG).
Enhancing Public ImageWith the availability of the internet, the public is more informed than ever about environmental issues. People are more aware of the potential effects that hazardous waste and other forms of pollution can have on their health.
Companies that are environmentally aware and work toward waste reduction can thereby improve their working relationship with the public, their neighbors, and their customers. In addition, pollution prevention allows you to profit while doing the right thing.
Following is a summary of the benefits of voluntary P2 planning:
� Improves your company’s environmental image.
� Shows regulators and the community that you care about compliance with Texas laws and the environment.
� Protects our health and our environment.

5
CHAPTER 2.
Complying with the Waste Reduction Policy Act
In this chapter . . . � Learn WRPA requirements for LQGs, SQGs, and those who report on the EPA’s TRI Form R.
� Understand Texas requirements for P2 planning.
Hazardous Waste“Hazardous waste” is any waste that is defined as being hazardous in Title 40 of the Code of Federal Regulations (40 CFR), Section 261.3. There are two different ways that a waste can be designated as hazardous:
� It can be “listed” as hazardous.
� It can have hazardous characteristics.A complete list of the listed wastes can be found in
40 CFR 261, Subpart D. You can find more information on the U.S. Environmental Protection Agency (EPA) website, at <www.EPA.gov/laws-regulations>.
There are three categories of hazardous waste generators:
� Conditionally Exempt Small Quantity Generators (CESQGs)
� Small Quantity Generators (SQGs)
� Large Quantity Generators (LQGs)CESQGs generate no more than 220 pounds (100 kg,
or about half a 55-gal drum) per month of hazardous waste and less than 2.2 pounds (1 kg, or less than one quart) per month of acutely hazardous waste.
SQGs generate more than 220 pounds but less than 2,200 pounds (100 kg to 1,000 kg, or half of a 55-gallon drum to five 55-gallon drums) per month of hazardous waste and less than 2.2 pounds per month of acutely hazardous waste.
LQGs generate more than 2,200 pounds per month of hazardous waste or more than 2.2 pounds per month of acutely hazardous waste.
Getting Information on Hazardous WasteFor more information on hazardous waste registration and reporting, you can contact the TCEQ Registration and Reporting Help Line at 512-239-6413; for waste determina-tion and classification assistance, call 512-239-6412.
Toxics Release Inventory (TRI) Certain facilities that use or produce toxic chemicals above specific thresholds are required to report annually under the federal Emergency Planning and Community Right-to-Know Act (EPCRA). Section 313 of the EPCRA involves the Toxics Release Inventory (TRI). It requires certain facilities to report chemical releases, whether they be from normal operations or from accidental incidents.
These TRI reports must be sent to both the EPA and the TCEQ. TRI reports are used to inform the public and government officials of on-site releases, off-site transfers, and other waste management activities at each reporting facility. TRI-reported information is publicly available at the EPA’s TRI
Table 1. Hazardous Waste Generator Categories
Generator Status
How much hazardous waste you can generate per month
How much acutely hazardous waste you can generate per month
How much hazardous waste you can collect in a waste management unit1
Length of time you can store it in a waste management unit from the time accumulation begins2
CESQGup to 220 lb
(about half a 55-gallon drum of liquid)
up to 2.2 lb (about 1 quart)
up to 2,200 lb (about five 55-gallon
drums of liquid)no time limit
SQG 220 to 2,200 lb up to 2.2 lbup to 13,200 lb
(about 30 55-gallon drums of liquid)
180 days3
LQG over 2,200 lb over 2.2 lb any amount 90 days
1. A waste management unit is an area in your facility where you collect, treat, or store the waste that you generate. It may be a storage shed, a room, an area within a berm, a solvent-distillation unit, etc.
2. Accumulation begins when the storage container is placed in the waste management unit. Containers must be labeled “hazardous” and dated.3. The limit is 270 days if the treatment, storage, and disposal facility (TSDF) is more than 200 miles away.

6
website: <www.epa.gov/toxics-release-inventory-tri-program/>. This website also provides reporting materials and instructions.
A facility must file TRI reports if it meets all three of the following criteria:
1. Has 10 or more full-time employees.2. Has a NAICS code on the EPCRA list.3. Manufactures, processes, or otherwise uses any
EPCRA Section 313 chemicals in quantities greater than the established thresholds within a calendar year. Certain persistent, bioaccumulating, toxic (PBT) chemicals have a very low threshold.
All federal facilities, regardless of their NAICS code, must submit TRI reports as specified by Executive Order 13423.
If you think you use one of these chemicals, visit the EPA’s webpage <www.epa.gov/toxics-release-inventory-tri-program/tri-listed-chemicals>. This list also provides the threshold quantities of the chemicals that trigger TRI reporting.
Form R Versus Form AFacilities reporting under the EPA’s TRI submit their information on either Form R or Form A. Knowing the differences between the two forms can lead to significant reductions in your paperwork under TRI and WRPA requirements (see Table 2).
The TRI Form R is a five-page document seeking in-formation on the facility and on one specific chemical. One Form R must be submitted for each TRI chemical reported by the company.
If a facility has small amounts of a TRI chemical in its waste, it may be eligible to report on the two-page TRI Form A (also known as alternate threshold). Form A reports do not trigger P2 planning and reporting requirements. In addition, you can report multiple chemicals on a single Form A. Check with the EPA’s TRI website listed above, or the hotline numbers given below, to determine if you can use Form A instead of Form R. Using the techniques in this book, you may be able to get below the Form R threshold, and therefore reduce your EPA and WRPA reporting requirements.
Note: Some facilities report on Form R for some chemicals and on Form A for others. If you submit even one Form R for one chemical, WRPA applies to you for all of your chemicals.
Getting Help with the TRIIf you need more help with the TRI, call the EPCRA hotline, maintained by the EPA, at 800-424-9346. You can also call the Texas TRI hotline, at 512-239-4TRI (4874).
P2 Planning RequirementsUnder Texas law, all SQGs, LQGs, and TRI Form R reporters must prepare a P2 Plan, keep a copy of that plan on-site for inspection, and submit an Executive Summary with a signed Certificate of Completeness and
Correctness of that plan to the TCEQ. The P2 Plan is the core requirement and should be an intrinsic part of your facility’s operating procedures.
Failure to have a complete P2 Plan in place is a violation of the Texas Administrative Code and is subject to penalties of up to $25,000 per violation per day. Companies often make the mistake of completing only the Annual Progress Reports (APRs), without ever completing a P2 Plan. (APRs are based on the P2 Plan, and have no meaning without projects and goals to measure.) Other companies misplace their P2 Plan as personnel change, or forget to renew their plan at the end of the five-year cycle. If your company grows significantly, causing waste to increase or change, you may need to revise your plan before the end of the five-year cycle. Exact requirements are located in 30 TAC, Chapter 335, Subchapter Q.
LQGs and/or TRI Form R reporters must also submit APRs to the TCEQ. The purpose of the APR is to track progress toward your facility’s goals, and to quantify the success of your projects. If you are unable to report source reduction in any year, you may need to review your projects to find a more successful pollution prevention option and update your plan.
Due DatesIf you are new to the P2 planning requirements, a sum-mary of due dates for P2 Plans, Executive Summaries, and Annual Progress Reports is laid out in the following sections for your convenience.
Facilities New to P2 PlanningYou have 90 days from the date the first Annual Waste Summary is submitted or TRI Form R is filed—whichever comes first—to have a five-year P2 Plan in place and on-site for review by an investigator. Once your P2 Plan is completed, submit the Executive Summary of your P2 Plan and signed Certificate of Completeness and Correctness to the TCEQ. By the end of the fifth calendar year, you must renew your five-year P2 Plan.
For example, if you submitted a TRI Form R on July 1, 2016, you should:
� Have a five-year P2 Plan, with a begin date of Jan. 1, 2017, in place by Sept. 28, 2016.
� Submit the Executive Summary and signed Certificate to the TCEQ by Sept. 28, 2016.
� Renew the five-year P2 Plan by Jan. 1, 2022.
P2 Plan RenewalFacilities that have completed a five-year reporting cycle must go through the entire planning process again and develop a new five-year P2 Plan. Then, a new Executive Summary of your P2 Plan, along with a signed Certificate of Completeness and Correctness, must be submitted to the TCEQ by Jan. 1 of the first year of the new plan. For example, if the fifth year of your plan is 2020, then you must renew your P2 Plan and submit your Executive Summary to the TCEQ by Jan. 1, 2021.

7
Annual Reporting RequirementsFacilities that are LQGs or TRI Form R reporters must also report annually on the Annual Progress Report (APR), a required TCEQ report, which is due July 1 of each year. Reports are for your source reduction activities from the previous calendar year. For example, if you submit your APR form July 1, 2017, you are reporting source reduc-tion activities you have accomplished from Jan. 1, 2016, through Dec. 31, 2016. The first APR is due after the first year of the very first P2 Plan. If the very first P2 Plan covers the years 2016 to 2020, the first APR is due July 1, 2017.
For more information about annual reporting, please see Chapter 10 of this document, or see the “Online P2 Annual Progress Reporting (STEERS)” link at <www.P2Plan.org>.
Base-Year DateThe P2 rule requires you to report your base-year waste generation or TRI chemical releases. The base year is the year prior to the first year of your plan. For example, if your P2 Plan covers the years 2016 through 2020, your base year is 2015. Your plan should include a list of your generated
Table 2. Basic P2 Planning Requirements by Facility TypeGenerator Status TRI Form A or Do Not Report TRI TRI Form R
Do not report Annual Waste Summary No requirements under WRPA
Prepare a P2 Plan, and keep it on-site. Submit
the Executive Summary and a signed Certificate.
Submit APRs.
CESQG No requirements under WRPA
SQG Prepare a P2 Plan, and keep it on-site. Submit the Executive Summary and a signed Certificate. No APRs required.
LQG Prepare a P2 Plan, and keep it on-site. Submit the Executive Summary and a signed Certificate. Submit APRs.
Table 3. P2 Planning Requirements and Worksheets GuidanceWRPA Requirements Worksheets
Designation of responsibility for achieving goals is not required, but is highly recommended to ensure success.
Worksheet 1. Assessment Team
P2 Plan
1. Prepare an initial survey of facility’s activities that generate hazardous waste and/or release of TRI chemicals [30 TAC 335.474(1)(A)].
Worksheet 2. Facility Process Diagram
2. Prepare a prioritized list of pollutants and contaminants to be reduced [30 TAC 335.474(1)(J)(iv)].
Worksheet 3. Prioritized List of Facility Wastes
3. Prioritize source reduction and waste-minimization projects [30 TAC 335.474(1)(B)].4. Explain P2 projects to be undertaken, with discussion of technical and economic considerations, and environmental and human health risks in selecting projects [30 TAC 335.474(1)(C)].5. Estimate type and amount of reduction anticipated [30 TAC 335.474(1)(D)].6. Prepare a schedule of implementation for each project [30 TAC 335.474(1)(E)].7. Set measurable pollution prevention goals for entire facility, including incremental goals [30 TAC 335.474(1)(F)].8. Discuss projects that may result in the release of a different pollutant or contaminant, or may shift the release to another medium [30 TAC 335.474(1)(H)].1
Worksheet 4. Project Description and Goals
9. Explain employee awareness and training programs to aid in accomplishing P2 goals [30 TAC 335.474(1)(G)].1
Worksheet 5. Employee Awareness and Training
Documentation
Five-Year P2 Plan10. Prepare a five-year Pollution Prevention Plan [30 TAC 335.474]. Worksheets 2–5
Executive Summary of Five-Year P2 Plan 11. Submit Executive Summary of the plan to the TCEQ [30 TAC 335.474(1)(J)].12. Submit certification that the plan is complete and correct by owner or corporate officer who has authority to commit company’s resources to implement the plan [30 TAC 335.474(1)(I)].
Worksheet 6. Executive Summary and Certificate of Completeness and Correctness
Annual Progress Report 13. Submit a P2 Annual Progress Report to assess the facility’s progress in implementing the plan and achieving goals [30 TAC 335.476(1)].2
TCEQ Pollution Prevention Annual Progress Report (Required Form)
1. Not required for facilities that are SQGs or non-TRI Form R reporters, but is recommended.2. SQGs or non-TRI Form R reporters may meet annual reporting requirements by submitting an Annual Waste Summary [30 TAC 335.476].

8
hazardous wastes and reportable TRI releases and transfers for the year 2015.
If you do not have this data available, you should use the most recent available data. Many facilities create or renew their P2 Plans to submit their Executive Summary in January and may not have the prior year’s waste data available. In these cases, plans often use the most current, complete data, which may be two years prior to the plan’s first year (e.g. 2014 waste or TRI data for a plan beginning with 2016).
If You Are LateIf you have missed a submission deadline, lost your existing plan or Executive Summary, or been subject to P2 regula-tions for a while but have never developed a plan, contact the TCEQ Pollution Prevention Team at 512-239-3143. Our assistance specialists will help you get back on track and achieve regulatory compliance.
For additional assistance with P2 regulations, visit our website, at <www.P2Plan.org>.
Exemption from P2 PlanningOwners and operators of facilities that are required to report under the P2 planning law may request an exemp-tion from the TCEQ executive director. The exemption request must be resubmitted annually, and is not subject to automatic re-approval. To receive an exemption, the facility must provide the following:
� Evidence that the facility has reduced the amount of pollutants and contaminants generated or released by 90 percent since the base year (the year prior to the first year of your current plan).
� A description of the potential impact on human health and the environment of any remaining hazardous waste generated, or pollutant or contaminant released.
� Demonstration that additional reductions are not economically and technically feasible.
Before pursuing an exemption, consider which will take less time—obtaining an exemption every year, or preparing a P2 Plan once every five years.
Note: Very few exemptions have been granted, and nearly all have been cases in which the facility has ceased operations and is going through remediation. If you believe you qualify for an exemption, please contact the TCEQ Pollution Prevention Team, at 512-239-3143.
Graduating from P2 PlanningMany facilities have graduated from the P2 planning and reporting requirements by reducing their hazardous wastes and TRI chemicals to levels below reporting thresholds. If you no longer report on TRI Form R and have become a CESQG of hazardous waste, you are no longer subject to the P2 planning requirements. This is the ultimate goal of the P2 program.
The TCEQ would like to recognize facilities that are no longer subject to P2 planning requirements. If you have instituted a pollution prevention pro-gram that resulted in significant reductions, used an innovative process, or incorporated significant educational or community out-reach, please tell us your story by applying for a Texas Environmental Excellence Award. For more information and submission instruc-tions please visit <www.TEEA.org> or contact the TEEA Program Coordinator at 512-239-3143.
Fast Facts � All SQGs, LQGs, and/or TRI Form R reporters are required to prepare a Pollution Prevention Plan.
� All LQGs or TRI Form R reporters are required to report annually on their progress.
� TCEQ worksheets are not required for the P2 Plan, but the TCEQ Annual Progress Report forms are required for the Annual Progress Report.
The P2 Planning ProcessNow that you are familiar with the requirements of the P2 Planning law, you’ll need to understand the overall process of pollution prevention planning. There are many ways to approach the planning process, and each facility may develop its own unique approach, as long as the required elements are covered. The TCEQ has developed a practical seven-step approach.
Seven Steps to Pollution Prevention Planning1. Identify your processes and wastes.2. Prioritize your wastes.3. Identify your options.4. Prioritize projects and set goals.5. Train employees on P2 awareness.6. Document the P2 Plan.7. Report results annually.

9
CHAPTER 3.
Identifying Your Processes and Wastes
In this chapter . . . � Learn who should be on your site-assessment team.
� Learn how to conduct a site assessment.
� Find out how to identify all of your activities that generate waste.
T his chapter deals with Step 1 of the P2 planning process: identifying your processes and wastes.
The P2 planning law requires that you iden-tify all hazardous wastes, TRI chemicals, and the
activities or processes that they result from. The ultimate goal is to generate less waste and fewer toxic pollutants through P2 projects.
Forming a Site Assessment TeamCreating an assessment team is not required, but often proves very useful in increasing employee involvement in pollution prevention activities and ensuring that you do not overlook any significant waste or process during the initial investigation. An assessment team is also an effective way to delegate responsibility and to increase the chances for successful implementation of projects. Worksheet 1 provides a starting point for selecting and recording who will be on your assessment team.
Although not required by P2 planning, forming a team is the best way to truly identify wastes and the activities that generate them. The team is also helpful in identifying options.
Directions for Worksheet 1: Assessment TeamFor larger, more complex sites, we recommend involving one representative from each major process
at a facility—someone familiar with operational requirements and employees. Smaller facilities may only need two to three people on their assessment team. Companies should use their own judgment to determine the number of team members that will best suit their needs, and who is selected.
A team leader who is familiar with the facility, the people, and the processes should be chosen. It is also very important for the team leader to want to reduce and eliminate wastes.
Conducting the Site AssessmentConducting an in-depth site assessment is an essential phase of the planning process. All facilities generating hazardous waste or releasing or transferring toxic chemi-cals can benefit from a thorough look at overall facility operations and processes.
This requires you to go upstream from the point of discharge and see what you are doing at your facility that results in the generation of the waste. This is the first step toward finding a way to reduce your waste. Your assessment should cover all process flows and operations, including:
� Any area where you make a product
� Shipping and receiving areas
� Storage areas for raw material and hazardous waste
� Waste generation points
� Product/by-product areas
Example 1. A Completed Worksheet 1P2 Plan Assessment Team
Company: ________________________________________ Site: ______________________Date: _________________
P2 Function Team Member Department/Telephone Responsibilities
Team Leader Fred Smith Environmental / x0056Project implementation
Setting up monthly meetings Project monitoring
Team Employee Training Dale Crow Fleets / x0045 Train new employees on P2 issues Retrain old employees (corrective action)
Current five-year WRPA P2 Plan valid ________________ through ________________ Next revision due __________________
XYZ Corporation Austin Facility 12/5/17
1/1/2018 12/31/2022 1/1/2023

10
Worksheet 1: Assessment Team
P2 Plan Assessment Team
Company: _____________________________________ Site: ____________________ Date: ________________
P2 Function Team Member Department/Telephone Responsibilities
Current five-year WRPA P2 Plan valid ________________ through ________________. Next revision due _________________.

11
� Unit processes
� Modes of transportation
� Administrative areas
� Employee service and recreational areas
� Any area with activity
You may find it helpful to diagram facility processes or create a flow chart of operations, services, and products in order to identify areas for inspection.
If you already know the process that is generating the waste, you can examine that process more closely and look for alternative ways of getting the results. For instance, your TRI Form R may list toluene. As you walk through your plant, you may find that this chemical is being used as a solvent in one part of your facility and for parts washing in another part of the facility. Once you know the process, you can examine options: What other solvents could dis-solve the chemical you are working with? Could mechani-cal or sonic parts-washing machines be used instead? There is no “one size fits all” option for every facility to reduce waste, but every facility can benefit from knowing the process that leads to the generation of the waste.
During the course of identifying the sources of your hazardous wastes and toxic releases, keep your eyes open for other areas of environmental concern. Assess potential regulatory, legal, and business risks, as well as health, safety, and environmental risks associated with processes or operations at your facility. In addition, you’ll want to consider the full range of operating conditions, potential incidents, and emergency scenarios.
Diagramming Your ProcessesLike many companies, your facility probably operates several different processes. Start your P2 assessment by creating a simple facility-operations diagram. The
diagram outlined in Figure 2, for example, has four major operations: coatings, metal finishing, vehicle maintenance, and thermoset resins.
After completing a general facility-operations diagram, you will need to break each individual process down into a more detailed process flow diagram. The process flow diagram will illustrate the major steps in your process, and pinpoint exactly where and when your waste is created. Example 2 illustrates a process flow diagram for a coatings operation. You may not have a coatings operation at your facility, but the example should help you create diagrams for any process.
Directions for Worksheet 2: Process Flow DiagramProcess flow diagrams are not required under the P2 planning law, but are useful in locating potential areas for pollution prevention activity and site assessment. You can make your diagrams simple or detailed—based on the size and complexity of your operations.
If the diagram isn’t large enough to cover all the steps in your process, feel free to add boxes in the empty space at the bottom of the page, or to create your own diagrams.
Complete a separate process flow diagram for each major process at your facility, and for smaller processes as necessary.
Figure 2. A Sample Facility Operations Diagram
Metal Finishing
Vehicle Maintenance
Thermoset Resins
Coatings Operation
Shelf Life
SpoiledMaterials
ContaminatedChemicals
Spills
Trash andScrap
FilterResidue
Byproducts
DirtySolvents
SpentChemicals
Leaks
MaintenanceWaste
Wastewater PackagingStock
Waste Oils
Off-SpecProduct
Package andProduct Damage
Wash BaySludge
Tires
Oil
Cooling
Heating
Vola
tile
Org
anic
Com
poun
ds (V
OC
s)
PROCESS PRODUCTINPUT
Figure 1. Avenues of Waste

12
The Annual Progress Report form is the only required form. You are required to have the elements listed in Table 3, but you do not have to use the worksheets provided in this document. The worksheets are examples that you can use. Facilities can choose their own unique style and format for writing a P2 Plan, follow the worksheets in this guide, or combine their own approach with the TCEQ examples.
Identifying Waste from ActivitiesAs you assess the waste streams for your facility, keep in mind that WRPA requires facilities to describe each activity that either generates hazardous waste or results in the re-lease of a TRI chemical, or both. P2 planning also requires that facilities provide a complete list of:
� all hazardous waste generated, and the volume of each (see your Annual Waste Summary), and
� all reportable TRI releases and the volume of each (see your TRI Form R).
As the team assesses each process at your facility, check for odors, leaks, spills, and drips, as well as discarded waste materials in trash bins. These are excellent indicators of waste, inefficiency, and money-saving opportunities.
As you search for environmental concerns, look for interaction between employees and machinery, inputs, outputs, energy sources, products, and services employed by, or rendered at your facility. Take notice of anything that can positively or negatively interact with or affect employees, surrounding communities, your facility, the overall company, and the environment.
To improve the effectiveness of your plan and increase your savings, we recommend that you expand your efforts to include nonhazardous wastes and all other areas of inefficiency. Finding ways to reduce all forms of waste while improving operational efficiency also makes good business sense and helps the environment.
You will be able to compile a thorough list of wastes to reduce by questioning the operation, efficiency, potential impact, and liability of each process or activity at your facility.
Once you have completed your site assessment and finished diagramming your process flows, you should have all the information you need to list your hazardous wastes and TRI releases and transfers as required by P2 planning. You may want to cross-check the data you collected with your most recent Annual Waste Summary and TRI reports.
By going through these steps you should be able to look at your facility with a fresh perspective, and identify problems that may have previously been overlooked. Now you can proceed with Step 2 in the planning process: prioritizing your wastes for project development.
Fast Facts � Discovering the process that generates a waste can point the way to a money-saving reduction.
� The best way to get results from a Pollution Prevention Plan is to involve many people in the process.
Example 2. A Process Flow Diagram
PROCESS
Customer wants a product
Purchasing
Surface preparation
Coating
Cleanup
Painted part
WASTE GENERATED
Old paints, overstocked paints, off-spec coatings, aerosol spray cans
Painted wastes, solvents, blasting media
Overspray, paint wastes, tape, old uniforms
Paint-gun cleanup, old rags, solvents, paint wastes

13
Worksheet 2: Process Flow DiagramMake as many copies as you need to cover all the processes at your facility.
Facility: __________________________________________________ Date: ______________________________
PROCESS WASTE GENERATED

14

15
CHAPTER 4.
Prioritizing Your Waste
In this chapter . . . � Learn how to prioritize your waste.
� Discover the real cost of your pollutant and how to reduce it.
T his chapter explains Step 2 of the P2 planning process. In this step, you will use Worksheet 3 to list and prioritize your facility’s wastes, as required by P2 planning. Every facility will have
different ways of prioritizing their wastes. Your assessment team should be able to decide how many waste streams will be targeted for reduction and why those waste streams take priority over others.
Some things to consider when managing the waste are:
� Threat to workers, the public, and the environment
� Cost of disposal
� Amount of waste generated
� Environmental regulations
� Residual lifetimeThere are a number of ways to prioritize your wastes.
One way is to determine which wastes are generated in the highest quantities and which wastes are costing you the most money. In addition to quantity and cost, consider the level of environmental and human-health risks associated with the wastes on your list.
Look at waste quantity, cost, and risk when identifying which waste deserves priority at your facility.
By addressing the issue now, you’ll save time and money, and avoid planning low-impact projects for waste streams that are of low risk and of less significance. Worksheet 3 will help you prioritize the waste streams, so spend a little time on it and make sure you use accurate information.
Directions for Worksheet 3: Prioritized List of WastesP2 planning requires that you list all reportable hazard-ous waste and TRI chemicals, but you may also list non-hazardous wastes identified during your site assessment. Once you have completed this worksheet, you will have a better idea where to focus your P2 efforts.
Filling out Worksheet 3 � List all reportable hazardous wastes and/or TRI releases and transfers.
� List the activity or activities that generate each waste stream.
� Determine the total volume (tons) of each waste stream. This information can be pulled from your Annual Waste Summary, TRI reports, and site assessment report. If the same waste comes from different activities, record the quantity generated from each activity.
� Determine whether the waste is a low, medium, or high risk to human health and the environment (see “Assessing the Risk,” below).
� Determine the total cost, including the hidden cost, of managing each of the wastes (see “Estimating Cost,” below).
� After considering the significance of each waste on the list, indicate which wastes will have priority with a check mark when you begin looking for reduction options.
Assessing the RiskWhen assessing the risk of a waste stream, you should look at the chemical or compound characteristics, health hazards, and environmental hazards associated with the waste stream. Information that will help you includes:
� Safety Data Sheets (SDSs). SDSs, which accompany all chemicals, describe compound characteristics and health hazards.
� The National Institute for Occupational Safety and Health (NIOSH) Pocket Guide to Chemical Hazards. The Pocket Guide helps you recognize and control occupational chemical hazards. Website: <www.cdc.gov/niosh>.
Please note that risk determination is highly variable at different facilities and should be determined by your assessment team, according to your facility standards.
Estimating CostMany facilities only calculate the disposal cost when estimating cost of a waste stream, but there are many hidden costs that you should also consider. It is estimated that waste-stream costs are underestimated by four to seven times, because many times hidden costs are overlooked. By identifying the hidden costs, you can

16
identify opportunities for savings (see Chapter 6). Hidden costs may include:
� inspection and permit fees
� preparation costs
� record-keeping and reporting costs
� liability for accidents and fines
� sampling and testing fees
� safety equipment and secondary containment structures
� storage and containers
� employee trainingA simple true cost analysis is shown in the following
example:
Example 3. A True Cost AnalysisTrue Cost Analysis
Xylene purchase cost ($3.00/gal) × (1,500 gal/yr) = $4,500/yr
Disposal cost (4 drums/yr) × ($450/drum) = $1,800/yr
Total $6,300/yr
Hidden costs (includes cost of drums, labels, and handling and manifesting the waste)
$1,000/yr
TRUE COST TOTAL $7,300/yr

17
Worksheet 3A. Prioritized List of Hazardous Wastes
P2 Assessment
Company: _____________________________________ Site: ____________________ Date: ____________________
Priority Waste Activity Volume Risk Cost
✓ Example: solvent (xylene) Example: cleanup 4 drums/yr Medium $7,300/yr
Current five-year WRPA P2 Plan valid ________________ through ________________. Next revision due _________________.

18
Worksheet 3B. Prioritized List of TRI Releases and Transfers
P2 Assessment
Company: _____________________________________ Site: ____________________ Date: ____________________
Priority TRI Chemical Activity Volume Risk Cost
Current five-year WRPA P2 Plan valid ________________ through ________________. Next revision due _________________.
19
CHAPTER 5.
Identifying Your P2 Projects
In this chapter . . . � Learn how to develop P2 options.
� Learn what the TCEQ and P2 Program websites have to offer.
� Learn when to be cautious when doing P2 internet research.
T his chapter deals with Step 3, the most critical part of the P2 planning process. Step 3 involves the identification of projects that can reduce your waste at the source or minimize its environmental
impact. Identification of projects and the various options available to you can be challenging because it varies from facility to facility.
A metal-finishing operation may benefit from reducing its flow rate, while a fleet-maintenance facility may benefit from switching to bypass filters. Even facilities with similar processes can have radically different projects.
P2 planning requires you to have a list of prioritized projects for reducing waste, and also to consider the economic and technical feasibility of these projects. P2 planning does give you flexibility to decide what kind of projects work best for your facility.
Finding an option that reduces waste, saves money, and works for your facility is very challenging. It requires you to question your current way of thinking about how you do business. It also requires you to be creative and to look at what others have done.
Developing Your OptionsYou can develop options that work for your facility by:
� Consulting with your P2 assessment team. Ask them how they would reduce waste at the facility. The best options often come from line workers who are intimately familiar with the daily operations of the process that generates the waste.
� Researching the internet to find other options. An internet resource list is kept at the TCEQ Pollution Prevention website, <www.P2Plan.org>.
� Contacting P2 experts from the TCEQ’s Pollution Prevention Assistance Team and other groups.
Researching the InternetOne of the best ways to find an option for your facility is to use the Internet. The Internet has a wealth of knowledge.
Most people who use the Internet to look for P2 options find the Internet a good starting point. It is a way to locate trade associations throughout the world, to identify potential vendors, or to find a name of an expert who can be contacted in a specific industry. Many people find options for pollution prevention simply by using an Internet search engine. The issue with the Internet is not whether you can find information, but if you can find information that is rel-evant to your needs. A simple search on “pollution preven-tion” using a search engine will yield a lot of information, but may not help you find information relevant to your industry. We recommend that you use search engines as a starting point for identification of options. Often searching using more specific search parameters, such as the type of waste you have or the kind of chemical you are trying to eliminate, can lead to more useful results. Once you have identified these options, you should use traditional means of verifying vendor claims and advice from others.
� TCEQ Pollution Prevention Resources The TCEQ website has links to the various rules, programs, and resources available for pollution prevention at <www.TCEQ.texas.gov> under the “Pollution Prevention” navigation link.
� Pollution Prevention Program website The TCEQ Pollution Prevention Program maintains a list of resources at <www.P2Plan.org>. These resources can be a starting point for further resources and tools.
Getting Answers to Permitting QuestionsKeep in mind that some of the options presented may require a permit from the TCEQ. For example, before installing a solvent distillation unit, check whether you need an air permit or some other form of authorization. If you have permitting questions, or other regulatory issues, call the Small Business Assistance Hotline at 800-447-2827, or the Industrial and Hazardous Waste Permits Section at 512-239-2335.

20

21
CHAPTER 6.
Prioritizing Your Projectsand Setting Goals
In this chapter . . . � Learn to choose the best projects.
� Find hidden costs when managing your waste.
� Set goals and schedules to ensure successful implementation of projects.
O nce you have identified a few P2 options for your wastes, you will need to determine which ones will work best for your facility—Step 4 of the P2 planning process.
P2 planning requires that you:
� Discuss the technical and economic feasibility of each P2 project.
� List the environmental and human-health risks associated with each project.
� Identify cases where implementing your P2 projects will result in the release of a different pollutant or contaminant, or may shift the release to another medium.
The level to which you discuss these three things is up to you. Some options are simple and easy to evaluate, while others require more detailed study.
Technical and Economic EvaluationDuring your search for options, you may have discovered more than one way to reduce a particular waste, or too many options to implement all at once. You can approach this difficult decision by looking at six critical decision-making factors to help determine which option is best for your facility:
1. Technical viability of the proposed project (technical feasibility).
2. The cost of implementation (economic feasibility).
3. Compatibility with existing systems.4. Complexity of the project.5. Ability to measure and observe results.6. Ability to test ideas before full implementation
(when needed).The first two factors (technical and economic
feasibility) are required steps in the P2 planning process. Evaluation of the technical and economic feasibility of proposed projects will help you determine which projects to commit company resources to and how to set your reduction goals.
Technical FeasibilityTo determine the technical feasibility of a project, your assessment team should ask some basic questions:
� Will product quality be maintained?
� Will installations stop production? If so, how long?
� Will training be required for the new system?
� Will the new equipment work with the old equipment?
� Will production increase, or decrease?Your team will probably think of many other
pertinent questions to help determine if an option is a practical solution for your facility. If the results for a particular option are determined to be unacceptable to the facility, you may want to look for another option. If you cannot find a suitable option for your prioritized waste, you may want to select a different waste to work on instead. Also keep watching for technical innovations that could be incorporated into your plan at a later date.
Economic FeasibilityA critical element of a feasibility analysis is the economic aspect. Economic feasibility has two benefits for your facility.
� Efficiency—you can identify areas to reduce waste and save money.
� Evaluation—you can compare options identified in the technical-feasibility section.
By examining the economic feasibility, companies have saved money while reducing waste. This is possible because waste is, by definition, inefficient use of raw materials. Isolating the costs associated with wastes, instead of adding them into overhead expenses, allows a company to make an informed decision when implementing their plan.
The core elements of evaluating the economic feasibility of a pollution prevention option are:
� Waste cost evaluation—What are the costs of generating waste?
� Project cost evaluation—What will the pollution prevention option cost? What are the savings of the option?
� Comparison—Does the option save money, or cost money?

22
How Complex Should Your Analysis Be?P2 planning requires an analysis of the economic feasibility of your projects, but does not specify how detailed your analysis must be. The detail of your analysis depends on a variety of factors, such as the number of projects you have, how much capital is needed, and internal company policies.
As with personal finances, the level of analysis for a business depends on individual needs. Some people never review their credit-card statements. They have a rough idea of how much they spend and only look closely at their spending if that amount drastically changes. They may never go into debt, but they aren’t always sure where their money goes.
Other people may use some of the popular software to identify exactly how much money they spend and where they spend it. These people are able to spot waste in their spending habits and to manage their money more efficiently.
Likewise, with P2 planning, your economic analysis may be minimal, ensuring only that the project doesn’t cost too much. This is particularly effective on simple projects. However, a simple cost comparison could overlook some of the hidden costs, such as labor, liability, and regulatory compliance. To get the most benefit from your plan, you may wish to sharpen your pencil and do a full-cost account-ing of your projects.
Simple Economic AnalysisIf you have several options, you might want to start your economic-feasibility analysis by comparing the costs of the different projects. This simple comparison is a way to identify some of the better projects and to eliminate some of the economically impractical options. A simple analysis is particularly good at identifying the “low-hanging fruit,” or options that are easy and inexpensive to implement. A review of a hypothetical company, Joe’s Paint Shop, offers four quick economic analyses.
Joe’s Paint Shop generates hazardous waste as a result of paint-booth operations. Kelly, the shop manager, worked with the employees to develop the four options in Example 4.
Even a simple look at the options shows three things:
� Option 1 saves money. The only costs are for a worker to take a few minutes to rotate the filter. The shop adopted this option immediately.
� Option 2 costs more initially, but the savings are realized quickly, so the shop adopted this option, as well. Options 1 and 2 together saved the shop $150 initially, and even more money over the long term, due to the reuse potential of the Styrofoam filters.
� Options 3 and 4 looked promising, but Kelly decided to do a more detailed analysis before adopting them.
Identifying Hidden CostsAs stated in Chapter 4, sometimes people are not aware of how much they are spending on managing waste. These costs are usually counted as overhead. It is estimated that waste-stream costs are underestimated by four to seven times, because many times hidden costs are overlooked. By identifying the hidden costs, you can identify opportunities for savings. Hidden costs may include:
� inspection and permit fees
� preparation costs
� record-keeping and reporting costs
� liability for accidents and fines
� sampling and testing fees
� safety equipment and secondary containment structures
� storage and containers
� employee training
Full-Cost AccountingFor complex projects that may span many years, full-cost accounting is the best option for evaluating a pollution pre-vention project. You will need to involve your accounting
Example 4. A Simple Economic-Feasibility AnalysisOption Saves $ by Savings Costs
1. Rotating filters Filters last twice as long because ones in low-use areas are switched out with ones in high-use areas.
$5.00/filter or $100/yr minimal
2. Substituting filters with baffled Styrofoam elements
Last four times longer between replacements and can be washed off for reuse.
$5.00/filter or $200/yr
$10/filter or $100, 1st year
3. Switching to water-based paints Water-based paints to meet shop needs are more expensive. ? 2.00/gal
4. Switching to an automated paint-gun washing system
Saves on labor and solvent usage. Reduces gun clogging. $900/yr $800 (one time)
Example 5. Comparison of the Cost of Using Hazardous Solvent at an Auto Repair ShopCost Bay 1 – Hazardous Solvent Bay 2 – Nonhazardous Soap Solvent
Solvent cost ($3.00/gal) × (1,500 gal/yr) = $4,500/yr ($5.00/gal) × (300 gal/yr) = $1,500/yr
Solvent disposal cost (4 drums/yr) × $450/drum = $1,800/yr $0.00/yr
Total costs $6,300/yr $1,500/yr

23
staff, as well as technical staff, to find the true cost of doing business and to evaluate the feasibility of switching to another method.
The advantage of going through this process is that environmental decisions are made like any other business decision; they take into account the overall profitability of the project for the company. If you manage an Environ-mental Health and Safety department at a large facility, you have an opportunity, through accounting, to turn your department into a profit center.
In Example 5, Sally, an auto-shop office manager, at-tributed the environmental costs to the process area. By do-ing this, she was able to identify inefficiencies and convince some mechanics to switch to nonhazardous solvents.
Two bays at the automobile repair shop use parts wash-ers. Auto Bay 1 uses a hazardous solvent to clean parts and Bay 2 has switched to a nonhazardous parts washer. The hazardous solvent is picked up by a company and recycled off-site.
Sally, the office manager, would like to switch Bay 1 to the nonhazardous soap solvent, but the Bay 1 repair techni-cians claim that the soap washers slow work down. The owner agreed with the Bay 1 mechanics, because he saw that they repaired vehicles quicker than the mechanics in Bay 2.
Sally looked at some of the true costs of using a hazardous solvent (see Example 5).
One thing Sally realized when she looked at the costs was that even though the soap costs more per gallon, the mechanics use less of it, so it lasts longer. Over a one-year period, Bay 1 used 1,200 more gallons of hazardous solvents than Bay 2 used of soap, which resulted in an extra $3,000 dollars in expenses. Additionally, the auto shop spent $1,800 to dispose of the hazardous waste solvent.
In other words, when you factored in volume used and waste disposal, Bay 1 was costing the service station at least $4,800 more than Bay 2. It didn’t take long for Bay 1 to switch, once the owner realized that the costs of using hazardous solvents in Bay 1 actually outweighed the slower pace of Bay 2. Sally got a raise, and now spends a lot less time doing paperwork.
In this example, Bay 1 was originally seen as more profitable, when in fact they were simply shifting the cost of handling the waste out of their area. In other words, both bays were paying for Bay 1’s waste expenses.
These are some of the factors to include when going through the process of full environmental cost accounting. If you would like to go through a full environmental cost-accounting process, a detailed worksheet is in Appendix C. This worksheet will guide you through six basic steps to save money by reducing waste.
Environmental Media ShiftP2 planning requires that you document if there is a media shift when you implement your new projects. A media shift is the transfer of a pollutant from one environmental media (air, water, soil) to another. By definition, most source reduction projects don’t have a media shift. If your projects
will result in a media transfer, you must identify this in your plan (see Worksheet 4).
Risk EvaluationIt is important to remember that hazard and risk are not the same. A hazard is defined as something that can cause harm, such as chemicals and electricity. A risk is the chance that the environment or a person will be harmed by a hazard.
When you are evaluating risks, you are looking for the potential that the hazards you identified will cause harm. It is also beneficial to think about who or what will be harmed: Is this a risk to human health or the environment? Once you have identified your risks, determine if your existing safeguards are sufficient, or if more should be done to minimize risks.
One way to evaluate the health and environmental risks of a possible product substitution is to review the safety data sheet (SDS) for each possible substitute and to weigh the risks.
Setting Goals and an Implementation ScheduleOnce you have a good project, you will need to set a sched-ule for implementation. This will ensure that your projects will be moved from the drawing board into your operations. P2 Plans must establish goals, evaluate environmental im-pact, and set milestones as required by the P2 Planning law.
Common goals include:
� Percent of hazardous waste to be decreased
� Tons of toxic chemicals reduced
� Reduction in releases of volatile organic compounds
� Gallons of water to be savedAn implementation schedule includes dates by which
critical project steps must be complete. For instance, if you plan to reduce your TRI chemical use to zero over the next five years, your milestones might look like this:
� Eliminate methylene chloride in the machine shop by Feb. 5, 2017.
� Identify alternative solvents for tetrachloroethylene by Feb. 5, 2018.
� Find an alternative, low-level, styrene monomer by July 2, 2019.
� Have no TRI chemicals on-site by 2020.
Note: Failure to meet the reduction goals stated in your facility’s plan is not a violation of the P2 plan-ning law, and does not expose you to any penalties.
Directions for Worksheet 4, Project Description and GoalsUse this worksheet (see below) to describe all the required elements of your prioritized projects and facility goals, including:
� Name of waste to be reduced and amount of reduction you expect to achieve by the end of the five-year plan.
� Type of project (source reduction or waste minimization).

24
Worksheet 4: Project Description and GoalsUse a separate worksheet for each prioritized project.
Facility name: ____________________________________ 5-year planning cycle: From year _________ to _________
Target waste or TRI chemical: ________________________ This project is: Source reduction activity? Waste-minimization activity? a. Amount of waste generated at base year: ________________________
b. Amount of reduction anticipated: _______________________________
c. Amount of waste generated at 5th year (a minus b): ________________
Facility goals (5th-year goals): _________________________________________________________________________
_________________________________________________________________________________________________
_________________________________________________________________________________________________
_________________________________________________________________________________________________
_________________________________________________________________________________________________
Project description: _________________________________________________________________________________
_________________________________________________________________________________________________
_________________________________________________________________________________________________
_________________________________________________________________________________________________
Implementation schedule and goal of project: _____________________________________________________________
_________________________________________________________________________________________________
_________________________________________________________________________________________________
_________________________________________________________________________________________________
_________________________________________________________________________________________________
_________________________________________________________________________________________________
_________________________________________________________________________________________________
_________________________________________________________________________________________________
Describe human-health and environmental considerations: __________________________________________________
_________________________________________________________________________________________________
_________________________________________________________________________________________________
___________________________________________________________________________________________
Small quantity generators that are also non-TRI Form R reporters are not required to complete the following portion.
Will this project result in a new pollutant, contaminant, or waste? YES NO Will this project result in a shift to another medium? YES NO
If you answered YES to either question, EXPLAIN: ________________________________________________________
_________________________________________________________________________________________________
Describe technical and economic considerations: __________________________________________________________
_________________________________________________________________________________________________
_________________________________________________________________________________________________

25
� Statement of facility goals.
� Project description.
� Implementation schedule (major steps in project development and implementation).
� Technical, economical, human-health, and environmental considerations.
� Potential for release of a new waste, pollutant, or contaminant, or for a media shift.
Remember, source reduction is reduction of waste at its source. Waste minimization is any activity (such as reuse, recycling, or neutralization) that reduces hazards associated with a waste.
To set your facility goal, estimate the amount of reduction you hope to achieve by the end of the fifth year (base-year waste-generation amount minus the reduction anticipated).
For each project, prepare an implementation schedule that outlines a schedule of major tasks to be accomplished.
Fast FactsTo choose a P2 project, consider:
� Cost benefits
� Risks of the pollutant
� How practical your project is

26

27
CHAPTER 7.
Training Employees on P2 Awareness
In this chapter . . . � Learn the importance of employee awareness and training.
� Learn how to meet the P2 planning law requirement for employee awareness and training.
In this chapter, you will learn about Step 5, concerning employee awareness and training.
A successful company is only as strong and successful as its employees. For this reason, managers
know how critical employee training and awareness can be to efficient operations.
As one of your company’s most valuable resources, employees can influence the quality of operations in general, as well as P2 success in particular. By actively encouraging all employees to get involved in P2 action and awareness, you drastically improve your company’s ability to save money and achieve P2 success.
Questions Your Assessment Team Can AddressGather your assessment team and evaluate your current awareness and training program by asking questions such as the following:
� How do we ensure that our employees properly perform their manufacturing job or other functions that are critical to our company?
� How are people trained in areas that are important to our company?
� What are the largest environmental risks to our company?
� How do we ensure that each employee knows about the risks they are responsible for managing?
� Do employees have a way of bringing environmental issues to our management?
� Do employees know the consequences of failure to follow their environmental training?
Facilities that are LQGs or that report on TRI Form R must have written documentation of an employee awareness and training program that aids in accomplishing pollution prevention goals. SQGs that do not report on TRI Form R are not required to have written documentation of the employee awareness and training program, but it is recommended to have one in place to accomplish your pollution prevention goals.
Evaluating Your Training ProgramOne method of evaluating your program is to look at employee function by process and waste generation. Refer to your facility process flow diagrams (Worksheet 2) and list employees that work within each major job function throughout the process. Then decide what training would most benefit that employee or operation, and determine how that training is currently achieved.
If something is missing, you’ll probably see it and be able to correct it. Remind your assessment team that talking with facility employees at every level of operations can stimulate innovative solutions to even the greatest of problems.
Each facility will approach employee awareness and training according to its specific needs and varied levels of P2 involvement. Facilities with the strongest commitment to reducing environmental impacts usually have very active programs and high employee involvement.
How you choose to encourage employee involve-ment and organize effective training is up to you. Worksheet 5 will help you describe how your program can contribute to the achievement of your goals. As always, worksheets are provided for your benefit, but are not required if you elect to use your own format.
Directions for Worksheet 5, Employee Awareness and TrainingThis worksheet can be used by LQGs and TRI reporters to fulfill P2 Plan requirements concerning employee aware-ness and training. Copy this sheet for each facility process in Worksheet 2 (process flow diagrams), or combine related activities to cut down on paperwork.
List which process you are describing, the major steps or activities in the process, and the waste generated. Next, list each employee who performs the given activity and determine how their job affects waste generation and reduction.
Based on the employee’s activity, decide what type of training would be most relevant and useful to assist the

28
Worksheet 5: Employee Awareness and Training
Facility: ______________________________________________________ Plan Date: _____________________
Updated: _____________________________________________________
Process/Activity Waste(s) Generated Employee(s) Performing Activity Training Needed Date Completed
Loading HW spills & leaks Joe Helpful Spill prevention and cleanup 1/12/17
Equipment safety and operation 2/16/17
How do you ensure that employees are aware of their impact on the environment, waste generation, and waste reduction for this process?
How does each training or awareness method listed above contribute to facility goal achievement?

29
employee in contributing to the facility’s pollution preven-tion goals. This will often require training in more than one subject or method, so list each method ona separate line, followed by the date when the training is completed. See the worksheet below for an example.
Finally, describe how you ensure employee awareness of their environmental impact, and how the training method selected will contribute to the achievement of your P2 projects and goals.
Fast Facts � Employee awareness is ensuring that all employees are aware of their environmental responsibilities.
� Training is only one part of an employee awareness program.
� By making employees aware of their role in the facility’s Pollution Prevention Plan, you can achieve maximum benefits.

30

31
CHAPTER 8.
Documenting the P2 Plan
In this chapter . . . � Find out which documents are required for your facility.
� Learn how to assess your progress toward facility goals.
T his chapter involves Step 6, documentation of the P2 Plan.
Following the guidance in the previous chapters will help you meet the documentation
requirement of the Pollution Prevention program. This chapter will guide you through documentation of:
� Pollution Prevention (P2) Plan
� Executive Summary
� Signed Certificate of Completeness and Correctness
� Annual Progress Report forms (LQGs and/or TRI Form R reporters only)
Notice: You are required to keep a copy of your plan on-site and available for an inspector. Many companies make the mistake of sending in their Executive Summary, even though they have no plan on-site. This results in a Notice of Violation when they are inspected.
You are required to prepare a P2 Plan and have it available for an investigator. Although you do not send the complete plan to the TCEQ, it is the most important requirement in P2 planning. Not having a P2 Plan prepared is the single most common violation.
You are required to submit the Executive Summary and, for some reporters, submit an Annual Progress Re-port to the TCEQ. Worksheet 6, available in this chapter and on the webpage <www.P2Plan.org>, is provided as an Executive Summary template. It is not required that you use this format. As long as the Executive Summary you prepare contains all of the required information, it will be accepted.
Documentation of the Pollution Prevention Plan and Executive SummaryYou can document the plan by gathering the following materials you have already completed:
� worksheets
� notes from the site assessment
� P2 options you are considering
� other information that might be useful in supporting your P2 Plan, projects, goals, and decisions
� items like Safety Data Sheets (SDSs)
� invoices, job descriptions, training documents, Annual Waste Summaries, TRI reports, and other important records for use as references
Make sure that several people are aware of the plan and have a copy. If you followed the team approach recom-mended in earlier chapters, you should have many people who are aware of the plan, following the schedules, and able to produce it if an inspector checks for it.
The Executive Summary should be included in the plan that is kept on-site, and a copy of the Executive Sum-mary and a Certificate of Completeness and Correctness should be sent to the TCEQ. Although there are no required forms for the Executive Summary, Worksheet 6 has been provided as a template. Using this worksheet will ensure that the TCEQ has the necessary information to track your compliance.
Documentation Requirements for LQGs or TRI ReportersOn the following page is a table showing the minimum documentation requirements for Pollution Prevention Plans of large quantity generators or reporters on TRI Form R.
Documentation Requirements for SQGs Who Are Not TRI ReportersBelow is a table showing the minimum documentation requirements for Pollution Prevention Plans for small quantity generators that do not report on TRI Form R.
P2 Plan Format and When to ReviseYour P2 Plan and Executive Summary can be in any format, as long as it has the elements listed in tables 4 and 5. P2 Plans must be updated every five years. Many companies revise their plans throughout the five-year period, but you are not required to send additional documentation to the TCEQ unless the facility experiences significant changes in operation and scope of work. You should begin planning three to six months before the updated plan is due.
Worksheet 6 provides you with an easy-to-use format for submitting the Executive Summary and Certificate of Completeness and Correctness. This is the part of the plan that you are required to send to the TCEQ.

32
Table 4. Minimum Documentation Requirements for Large Quantity Generators or TRI Form R Reporters
P2 Plan Executive Summary
� Facility description
� List of all hazardous waste generating activities
� List of all TRI release activities
� Prioritized list of technically and economically feasible P2 projects
� Explanation of P2 projects to be undertaken with discussion of:
• technical and economic considerations• environmental and human-health risks
� Estimate of type and amount of reduction anticipated
� Implementation schedule for each P2 project
� Description of measurable P2 goals
� Explanation of employee awareness and training programs
� Discussion of projects that may result in the release of a different pollutant or contaminant, or that may shift the release to another medium
� Signed certification by owner or corporate officer of commitment and ability to authorize company resources for implementation
� Executive Summary of the P2 Plan
� Facility description, including: • facility name• mailing and physical addresses• contact, phone numbers, and email• general description of facility• ID numbers: TCEQ Regulated Entity Number (RN),
TCEQ Customer Number (CN), TCEQ Solid Waste Registration (SWR), EPA, Pollution Prevention Number (PNumber) and TRI numbers
• SIC code and NAICS• time period the five-year plan is in effect
� List of all hazardous wastes generated and the volume of each
� List of all reportable TRI releases and the volume of each
� Prioritized list of pollutants and contaminants to be reduced
� Statement of measurable reduction goals
� Explanation of environmental and human-health risks considered in determining reduction goals
� List of projects with an associated schedule of implementation
� Implementation schedule for future reduction goals
� Discussion of projects that may result in the release of a different pollutant or contaminant, or that may shift the release to another medium
Annual Progress ReportEvery July 1 an Annual Progress Report must be submitted using TCEQ forms. Forms are available online or in this guide.
Table 5. Minimum Document Requirements for Small Quantity Generators That Do Not Report on TRI Form R
P2 Plan Executive Summary
� Facility description
� List of hazardous wastes generated and volume of each
� Prioritized list of pollutants and contaminants to be reduced
� Statement of measurable reduction goals
� Discussion of environmental and human-health risks considered in determining reduction goals
� List of P2 projects with implementation schedule
� Implementation schedule for future reduction goals
� Signed certification by owner, or officer, of commit-ment and ability to authorize company resources for implementation
� Executive Summary of the P2 Plan
� Facility description, including: • facility name• mailing and physical addresses• contact, phone numbers, and email• general description of facility• ID numbers: TCEQ Regulated Entity Number (RN),
TCEQ Customer Number (CN), TCEQ Solid Waste Registration (SWR), EPA, and Pollution Prevention Number (PNumber)
• SIC code and NAICS• Time period the five-year plan is in effect
� Prioritized list of pollutants and contaminants to be reduced
� List of source reduction activities associated with reduc-tion of prioritized wastes identified in the plan

33
Worksheet 6: Executive Summary and Certificate of Completeness and Correctness
Planning Cycle:____________________ (1st year) to ______________________ (5th year, 1st year plus 4)
Executive Summary, Part 1: Facility Information
Company name: Facility name:
Mailing address: Physical address:(if same as mailing, write “same”)
City, State, Zip: City, State, Zip:
County: County:
WRPA contact: Email:
Phone:
– – Ext.
Fax:
– –
TCEQ SWR ID: Customer reference number: (Always begins with CN)
CN
EPA ID: Regulated entity number: (Always begins with RN)
RN
TRI ID: P2 Program ID (PNumber):
Primary SIC Code:
NAICS Code:(to convert SIC to NAICS, go to: www.census.gov/epcd/www/naics.html)
General description of facility:
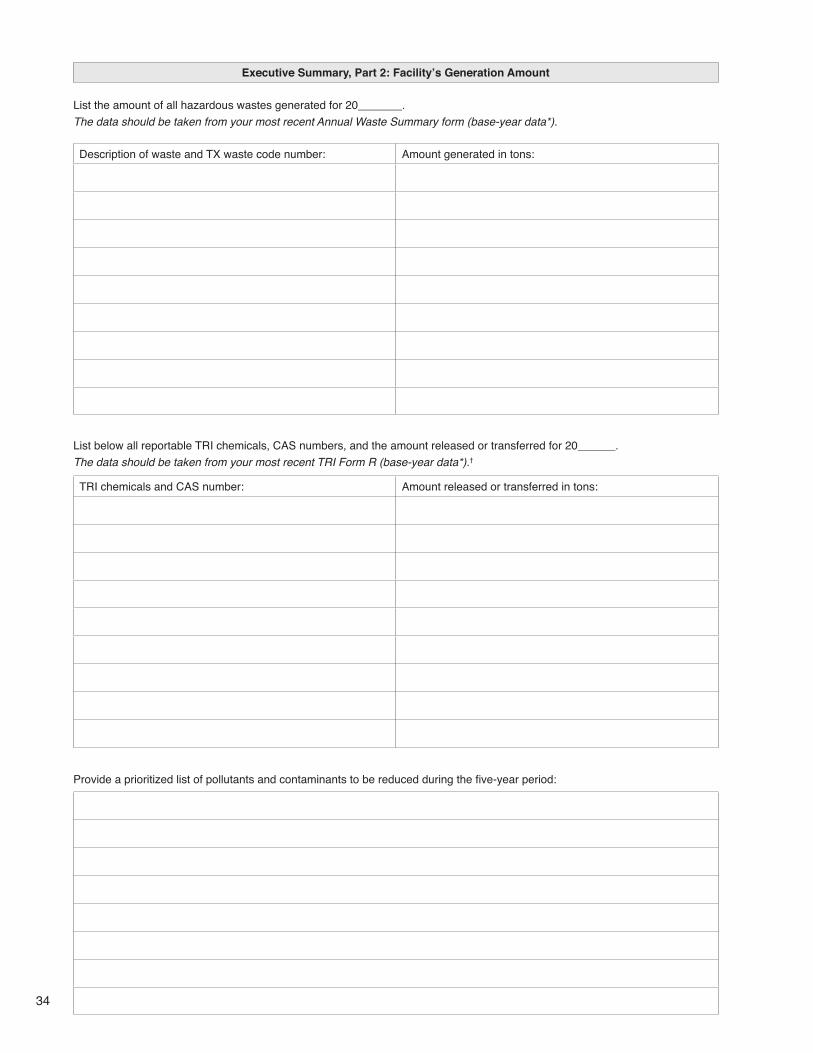
34
Executive Summary, Part 2: Facility’s Generation Amount
List the amount of all hazardous wastes generated for 20_______. The data should be taken from your most recent Annual Waste Summary form (base-year data*).
Description of waste and TX waste code number: Amount generated in tons:
List below all reportable TRI chemicals, CAS numbers, and the amount released or transferred for 20______.The data should be taken from your most recent TRI Form R (base-year data*).†
TRI chemicals and CAS number: Amount released or transferred in tons:
Provide a prioritized list of pollutants and contaminants to be reduced during the five-year period:

35
Executive Summary, Part 3: P2 Projects and Goals
Statement of facility’s measurable reduction goals:
Explain the environmental and human-health risks considered in determining reduction goals:†
List of pollution prevention projects with an implementation schedule of each project:
Implementation schedule for future reduction goals:
Identify cases in which the implementation of source reduction or waste-minimization activity may result in the release of a different pollutant or contaminant, or may shift the release to another medium.†
* The base year is the year prior to the first year of your plan.† Not required for SQGs that are non-TRI Form R reporters.

36
Certificate of Completeness and Corrections
The person who signs the Certification of Completion should have the authority to commit the corporation’s resources to implement the plan. This is usually the plant manager, owner of the facility, or whoever runs the facility.
This document certifies that the Pollution Prevention Plan has been completed and meets the specified requirements of the Waste Reduction Policy Act of 1991, the Solid Waste Disposal Act, and 30 TAC, Sections 335.471– 480, and that the information provided herein is true, correct, and complete.
This certificate should not be signed by the environmental health and safety manager. Signatures from consultants or other third parties are not compliant.
This document also certifies that the person whose signature appears below has the authority to commit the corporate resources necessary to implement this plan.
Name: _____________________________________________________ Title: _________________________________(please print clearly)
Position (check one): ❑ Facility Owner ❑ Corporate Officer
Signature: __________________________________________________ Date: ________________________________

37
CHAPTER 9.
Reporting Annually
In this chapter . . . � Find out the requirements for annual reporting.
� Learn the steps for completing the Annual Progress Report (APR).
� Learn more about the Texas Environmental Excellence Awards.
T his chapter deals with Step 7 of the P2 planning process: reporting annually.
Large quantity generators (LQGs) of hazardous waste and facilities reporting on TRI
Form R are required to report annually on their progress toward pollution prevention goals laid out in their P2 Plan. The pollution prevention Annual Progress Report (APR) measures this progress, and provides an opportunity to review and update your plan and look for new ways to save money by reducing waste. LQGs and TRI reporters must meet the annual reporting requirement by submitting the required APR form (TCEQ-00784) by July 1 of each year. The APR form is available in this guide, as well as online at <www.P2Plan.org>.
The most important information collected in the Annual Progress Report is the amount of pollution reduced at the source (Part 3). This is the one piece of information that the TCEQ could collect from no other source. It documents the amount of pollution that would have been generated if you did not have a pollu-tion prevention project. Refer to Chapter 1 for a further definition of source reduction.
Small quantity generators (SQGs) of hazardous waste, which do not report on TRI Form R, are not required to submit the required APR forms. However, they are required to submit the Annual Waste Summary to the TCEQ’s Indus-trial Hazardous Waste Registration and Reporting Program.
Purpose of the Annual Progress ReportThe purpose of the APR is to assist facilities in monitoring and improving progress toward their pollution prevention goals and to measure statewide progress toward successful pollution prevention. The TCEQ analyzes APR data in order to:
� Report the statewide status of pollution prevention to the Texas Legislature.
� Communicate industrial pollution prevention progress to the press and the public.
� Identify facilities for potential success stories.Through accurate reporting of your P2 progress, you
may contribute to the direction of future environmental programs in Texas.
The biggest benefit of the APR is for the facility. Regular reporting of the APR encourages facilities to continuously monitor and reassess their pollution prevention efforts. Many companies improve the effectiveness of their pollution prevention programs because completion of the APR reveals additional opportunities to reduce waste and increase profits.
Need Assistance? If you need ideas on how to improve the effective-ness of your pollution prevention activities, refer to the P2 options in Chapter 5. If you are unclear about the difference between source reduction and waste minimization, see the definitions listed in Chapter 1. To get the best results out of your P2 Plan, visit the technical-assistance resources available at <www.P2Plan.org>.
Reporting Online through STEERSThe TCEQ highly recommends submitting the Annual Progress Report through STEERS. You can avoid messy paperwork, last-minute mailing, and lost reports by com-pleting the APR form online. It’s fast and easy, and you’ll receive a confirmation to let you know that our system has received it. This is the only method of submission that will result in an electronic submission confirmation. You can also print out a copy for your own records.
Submitting the APR online has the added benefit of reducing typographical errors when data is entered. You insert the information and send it on its way. When we receive it, our system automatically enters the data directly into our records, which eliminates data-entry error that may occur during transcription by staff. STEERS will also alert you if there is a problem with the submission and when you should contact P2 Program staff.
Another advantage of STEERS is that you can review past APR submissions or update contact information at any time. The online APR is available in STEERS between May 15 and July 1 to report the results of the current report-ing period only. During that time period it is accessible 24-hours-a-day, 7-days-a-week. By submitting your APR online, you can rest easy knowing it will arrive on time to meet the July 1 deadline.
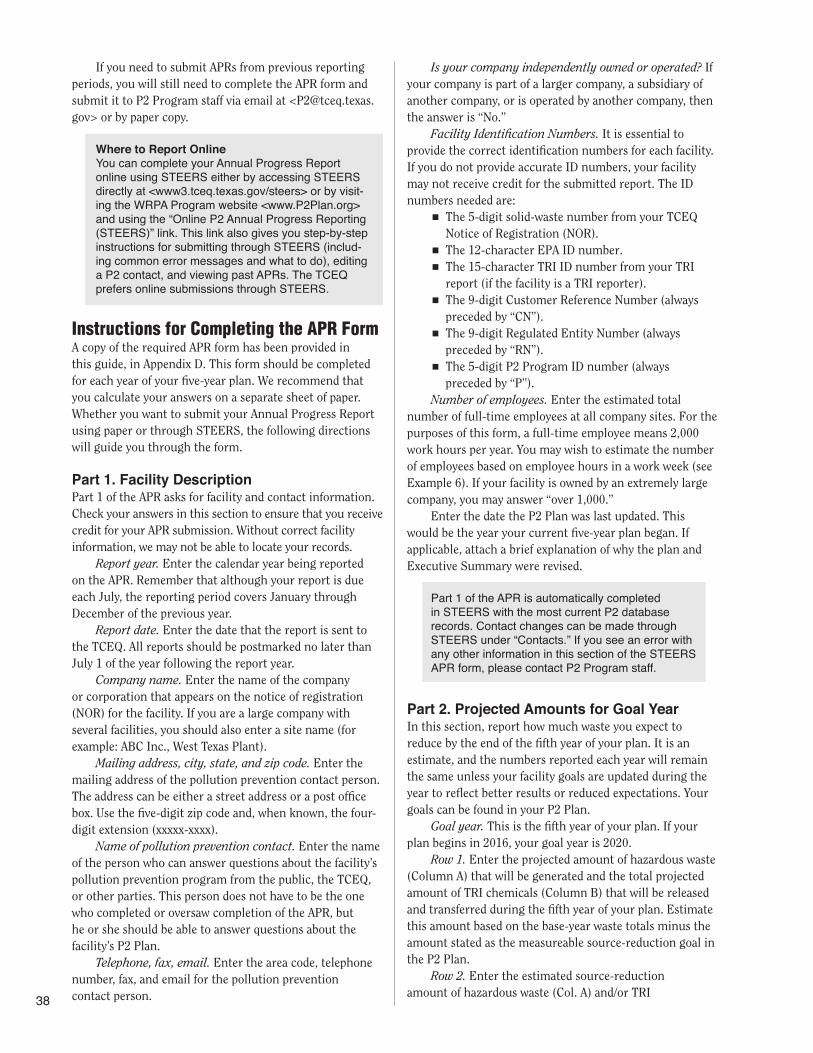
38
If you need to submit APRs from previous reporting periods, you will still need to complete the APR form and submit it to P2 Program staff via email at <[email protected]> or by paper copy.
Where to Report Online You can complete your Annual Progress Report online using STEERS either by accessing STEERS directly at <www3.tceq.texas.gov/steers> or by visit-ing the WRPA Program website <www.P2Plan.org> and using the “Online P2 Annual Progress Reporting (STEERS)” link. This link also gives you step-by-step instructions for submitting through STEERS (includ-ing common error messages and what to do), editing a P2 contact, and viewing past APRs. The TCEQ prefers online submissions through STEERS.
Instructions for Completing the APR FormA copy of the required APR form has been provided in this guide, in Appendix D. This form should be completed for each year of your five-year plan. We recommend that you calculate your answers on a separate sheet of paper. Whether you want to submit your Annual Progress Report using paper or through STEERS, the following directions will guide you through the form.
Part 1. Facility DescriptionPart 1 of the APR asks for facility and contact information. Check your answers in this section to ensure that you receive credit for your APR submission. Without correct facility information, we may not be able to locate your records.
Report year. Enter the calendar year being reported on the APR. Remember that although your report is due each July, the reporting period covers January through December of the previous year.
Report date. Enter the date that the report is sent to the TCEQ. All reports should be postmarked no later than July 1 of the year following the report year.
Company name. Enter the name of the company or corporation that appears on the notice of registration (NOR) for the facility. If you are a large company with several facilities, you should also enter a site name (for example: ABC Inc., West Texas Plant).
Mailing address, city, state, and zip code. Enter the mailing address of the pollution prevention contact person. The address can be either a street address or a post office box. Use the five-digit zip code and, when known, the four-digit extension (xxxxx-xxxx).
Name of pollution prevention contact. Enter the name of the person who can answer questions about the facility’s pollution prevention program from the public, the TCEQ, or other parties. This person does not have to be the one who completed or oversaw completion of the APR, but he or she should be able to answer questions about the facility’s P2 Plan.
Telephone, fax, email. Enter the area code, telephone number, fax, and email for the pollution prevention contact person.
Is your company independently owned or operated? If your company is part of a larger company, a subsidiary of another company, or is operated by another company, then the answer is “No.”
Facility Identification Numbers. It is essential to provide the correct identification numbers for each facility. If you do not provide accurate ID numbers, your facility may not receive credit for the submitted report. The ID numbers needed are:
� The 5-digit solid-waste number from your TCEQ Notice of Registration (NOR).
� The 12-character EPA ID number.
� The 15-character TRI ID number from your TRI report (if the facility is a TRI reporter).
� The 9-digit Customer Reference Number (always preceded by “CN”).
� The 9-digit Regulated Entity Number (always preceded by “RN”).
� The 5-digit P2 Program ID number (always preceded by “P”).
Number of employees. Enter the estimated total number of full-time employees at all company sites. For the purposes of this form, a full-time employee means 2,000 work hours per year. You may wish to estimate the number of employees based on employee hours in a work week (see Example 6). If your facility is owned by an extremely large company, you may answer “over 1,000.”
Enter the date the P2 Plan was last updated. This would be the year your current five-year plan began. If applicable, attach a brief explanation of why the plan and Executive Summary were revised.
Part 1 of the APR is automatically completed in STEERS with the most current P2 database records. Contact changes can be made through STEERS under “Contacts.” If you see an error with any other information in this section of the STEERS APR form, please contact P2 Program staff.
Part 2. Projected Amounts for Goal YearIn this section, report how much waste you expect to reduce by the end of the fifth year of your plan. It is an estimate, and the numbers reported each year will remain the same unless your facility goals are updated during the year to reflect better results or reduced expectations. Your goals can be found in your P2 Plan.
Goal year. This is the fifth year of your plan. If your plan begins in 2016, your goal year is 2020.
Row 1. Enter the projected amount of hazardous waste (Column A) that will be generated and the total projected amount of TRI chemicals (Column B) that will be released and transferred during the fifth year of your plan. Estimate this amount based on the base-year waste totals minus the amount stated as the measureable source-reduction goal in the P2 Plan.
Row 2. Enter the estimated source-reduction amount of hazardous waste (Col. A) and/or TRI

39
chemicals (Col. B) that will be achieved over the five-year plan period (see Example 7). This was estimated in the P2 Plan and Executive Summary under “Measure-able Reduction Goals.”
Row 3. Enter the projected percent of hazardous waste and/or TRI chemicals remaining in year five of your plan (Row 1) that you plan to recycle, reuse, or treat with other waste-minimization practices (see Example 8).
Part 3. Reduction Achievement for the Report YearThis section is the most important part of the Annual Progress Report. Use this section to report actual reduc-tion amounts achieved for the report year. The report should reflect the previous calendar year’s pollution prevention activities.
If you have difficulty matching your projects to our categories, refer to the “Source Reduction Activities by Category” table in Appendix B. You may not find an exact match, but most projects can be related to one of the categories provided. If you are still unable to list reduc-tions achieved at your facility, describe the reduction and quantity in the box provided.
The amount of source reduction reported in Part 3 is an estimate of the amount of pollution that would have been generated if you had not undertaken a P2 project in the report year.
Rows 1 through 8. Estimate the amount of hazardous waste and TRI reduction achieved as a result of your P2 projects. Try to use one of the eight categories listed. Some projects may fit more than one category, you can use your best judgment in assigning a category.
Report HW reductions (tons) in Rows 1 through 8, Column A. Report reductions of TRI chemicals (tons) in Column B. The quantity of source reduction for a reporting year can be determined by measurement, or estimated using activity or production indexing. Example 9 shows a simple source-reduction estimation.
Many companies have changes in pollution generated due to production changes, while simultaneously decreas-ing the amount of pollution through source reduction. If your production has changed, see Example 10. Some materials are classified as both HW and TRI. Due to differ-ent reporting standards, the amount of HW reported for a dual-classified material may be different from the amount of TRI reported for the same waste. When one of these dual-classified materials is reduced, the separate amount (tons) should be reported in Column A (for HW) and B (TRI) with different quantities. Example 11 illustrates this concept.
Row 9. Enter the sum of Rows 1 through 8 in tons.“Briefly describe . . .” This final area of Part 3 allows
you to describe how you achieved your reductions and also share information about waste reductions of nonhazardous and non-TRI chemicals, facility productivity, or any other notes you choose.
Example 6. Estimating the Number of Employees
Ed’s Repair Shop has three full-time mechanics (40 hours/week), a part-time custodian who works 10 hours per week, and a part-time secretary who works 30 hours per week. The secretary and the custodian work the equivalent of one full-time employee (total 40 hours/week). Therefore, the number of employees is four.
Example 7. Calculating Five-Year Source Reduction
A company has a P2 Plan that begins with the year 2017. In the year prior to their plan’s start, 2016, they report 20 tons of xylene on the TRI Form R. The xylene is an ingredient in the solvent they use to prepare their product. During the first year of their plan, 2017, they plan to educate their employees on better handling of the solvent: placing lids on containers, minimizing spills, and checking for leaks in the process area. By implementing these inventory-control procedures, they hope to use 5 tons/year less xylene.
In the second year, 2018, they plan to have a solvent reuse/recirculation device in place that will route unused solvent back into the process. This change is projected to result in a source reduction of 10 tons per year. By their third year, 2019, they hope to find an alternate material that does not contain hazardous or TRI-listed chemicals. This change will eliminate their remaining 5 tons of xylene.
Plan Year Amount Source-Reduced Amount Generated
2017 5 20 – 5 =15 tons
2018 10 15 – 10 = 5 tons
2019 5 5 – 5 = 0 tons
2020 0 0
2021 0 0
Adding the amount of xylene that will be reduced each year from the middle column above equals the Total Source Reduction for the five-year plan. This company would then report 20 tons in Part 2, Row 2, Column B.

40
Example 8. Calculating Percent Waste Minimization
A company predicts that they will generate 100 tons of hazardous sludge per year in the fifth year of their P2 Plan. In the fifth year they also plan to treat 30 tons of that sludge such that after treatment the waste will no longer be hazardous. Since 30/100 = 0.3, or 30%, this company will enter “30%” in Row 3, Column A, of Part 2, for “% Waste Minimization by the Goal Year.”
Example 9. Basic Source-Reduction Estimation
A facility uses a solvent bath to clean filament wire in a batch process. Facility records document that in 2015, the 500-gallon tank contents were changed 10 times, generating 1 ton of HW each cleaning. In 2016, they began monitoring the solvent’s condition, which resulted in only 9 changes of the tank contents. How much source reduction took place in 2016? What source-reduction activity should it be reported under?
Step 1. Determine quantity of waste generated in 2016 and 2017 from the batch process.
HW gen. 2015 = (10 cleanings) × (1 ton HW/cleaning) = 10 tonsHW gen. 2016 = (9 cleanings) × (1 ton HW/cleaning) = 9 tons
Step 2. Determine the difference in quantities of waste generated between 2015 and 2016. What is the amount of source reduction (the total length of wire cleaned was the same each year)?
HW Source Reduced = 10 tons - 9 tons = 1 tonAnswer: Amount Source Reduced in 2016 is 1 ton.
Reported in Part 3, in either Row 1 or Row 6, Column A.(The monitoring could be considered either “Good Operating Practice,” or improvement to “Cleaning and Degreasing.”)
Example 10. Estimating Source Reduction When There Is a Change in the Production Rate
A facility manufactures widgets and generates an amount of hazardous waste (HW) that is directly proportional to the number of widgets produced. In 2015, they made 2,000 widgets and generated 5 tons of HW. In 2016, the facility manu-factured 3,000 widgets, implemented a process modification, and generated 7 tons of HW. How much source reduction took place for the 2016 reporting year? What source-reduction activity should it be reported under?
Since waste is proportional to production, you can use the following ratio to help calculate source reduction:
Year 1 HW÷
Year 1 Prod.= Year 2 HW (Calc)÷
Year 2 Prod.
Thus
Year 2 HW (Calc) = Year 1 Waste÷
Year 1 Prod.× Year 2 Prod.
And then
Source Reduction = Year 2 Waste (Calc.) - Year 2 Waste (Actual)
Step 1. For this example, year 2 is 2016 and year 1 is 2015. Therefore, the waste that would have been generated if there had not been a process modification would be:
2016 HW (Calc) = 5 tons HW÷
2,000 widgets× 3,000 widgets = 7.5 tons HW
Step 2. Determine the amount of source reduction:
Amount Source Reduction = 7.5 - 7.0 = 0.5 tons in 2016Answer: Amount SR in 2016 is 0.5 tons.
Reported on Part 3, Row 5, Column A

41
Example 11. Materials Reported under Both TRI and Hazardous Waste Regulations
ABC Manufacturing reports benzene on its Annual Waste Summary and the TRI Form R. The benzene releases result from leaks in their pipes and connections. In order to prevent the leaks from contaminating groundwater, the floor is washed every night, and the water-benzene mixture is sent to an off-site wastewater treatment plant.
Different Reported Amounts for the Annual Waste Summary and TRI. On the TRI Form R, the total releases and transfers of benzene are reported as 4,000 pounds (2 tons.) On the Annual Waste Summary, the benzene shipped off-site is reported as 50 tons. This difference results from the benzene being disposed of in a water-benzene mixture. Under the hazardous waste regulations, when a nonhazardous substance is mixed with a listed hazardous waste, the entire mixture becomes hazardous. In contrast, the TRI reporting requirements only require facilities to report the amount of toxic chemical released or transferred. Because the reporting requirements are different, the amount of hazardous waste that is source-reduced, as reported in Column A of Part 3, will differ from the amount of TRI chemical that is source-reduced, as reported in Column B of Part 3.
Source Reduction Project. ABC manufacturing installed dry-disconnect couplings on most of their flanges, reducing the accidental leaks and spills, and thus reducing the amount of wastewater needed to handle the benzene. Since installing these dry-disconnect couplings, the amount of benzene-contaminated wastewater reported on the Annual Waste Summary was reduced from 50 tons to only 1 ton. The benzene releases and transfers reported on the TRI Form R dropped from 2 tons per year to 0.2 tons per year.
Reporting on APR Part 3
Hazardous Waste Source Reduction = 50 tons - 1 ton = 49 tons
TRI Source Reduction = 2 tons - 0.2 tons = 1.8 tons
On the TRI Form R, Section 8, the company noted that their activity has the Source Reduction Activity Code of W39, “other spill and leak prevention,” and therefore the activity will be listed on Row 3 of the APR Part 3 for both the hazardous waste and TRI columns. Note: You may find that your TRI reductions and your hazardous waste reductions are not proportional. In this example, the facility achieved a 98 percent reduction in hazardous waste, but only an 80 percent reduction of TRI chemicals.

42

43
CHAPTER 10.
Submitting Documents
In this chapter . . . � Discover when and where to mail your documentation to the TCEQ.
� Discover where to find additional assistance.
Submitting the Executive SummaryOnce every five years, all facilities subject to the P2 plan-ning law are required to submit an Executive Summary of their P2 Plan. The entire plan should not be sent to the TCEQ. Only the Executive Summary is required. The com-prehensive version of your plan should be kept available on-site so that it may be shown to inspectors when they visit. To help you create a complete Executive Summary, you may use Worksheet 6, found at the end of Chapter 8 of this guide, or download a Microsoft Word file of the worksheet at <www.P2Plan.org>.
When submitting your Executive Summary, make sure that the Certificate of Completeness and Correctness has a signature and provides the printed name and title of the signer, as well as the date. Do not send a copy of your entire plan. It will not be kept by the TCEQ. Executive Summaries may be sent by email to <[email protected]> or by mail.
If you send it by mail, clearly mark your envelope to in-dicate an Executive Summary and mail the document, along with the Certificate of Completeness and Correctness, to:
Executive SummaryPollution Prevention Planning, MC 108Texas Commission on Environmental QualityPO Box 13087Austin, TX 78711-3087
Submitting Annual Progress Reports (APRs)Your first Annual Progress Report is due on July 1 after the first full year of your P2 Plan. Subsequent APRs are due on July 1 for each year of your P2 Plan. For example, a facility whose P2 Plan begins with the calendar year of 2017 is re-quired to submit an APR by 7/01/2018. Each APR submitted should report information about reduction achievements made in the previous calendar year.
Online submission though STEERS is preferred by the TCEQ and is available by accessing STEERS directly at <www3.tceq.texas.gov/steers> or at <www.P2Plan.org>, through the “Online P2 Annual Progress Reporting (STEERS)” link. Reports may be submitted online only
from May 15 through July 1. All late reports must be emailed or mailed.
To submit an APR form via email, please send the completed document to <[email protected]>.
To submit a paper APR form via mail, send the completed document to:
Annual Progress ReportPollution Prevention Planning, MC 108Texas Commission on Environmental QualityPO Box 13087Austin, TX 78711-3087
All envelopes should be clearly marked as an Annual Progress Report
Fast Facts � The most important requirement in WRPA is to prepare a P2 Plan and keep it on-site.
� WRPA reporters are required to send an Executive Sum-mary of their plan to the TCEQ once every five years.
� Annual Progress Reports are due for LQGs and/or TRI Form R reporters on July 1, and can be completed online or by using paper forms.
Getting Additional AssistanceIf you need to order additional forms, guides, or other TCEQ publications, call Publications at (512) 239-0028. For additional assistance on submitting your P2 planning documents or completing forms, or for specific inquiries about WRPA requirements, contact the Pollution Preven-tion Team, at:
Phone: 512-239-3143Fax: 512-239-5678
Email: [email protected]
www.TCEQ.texas.govP2 page: www.P2Plan.org
orRefer to Appendix A for additional resources.

44

45
Appendices
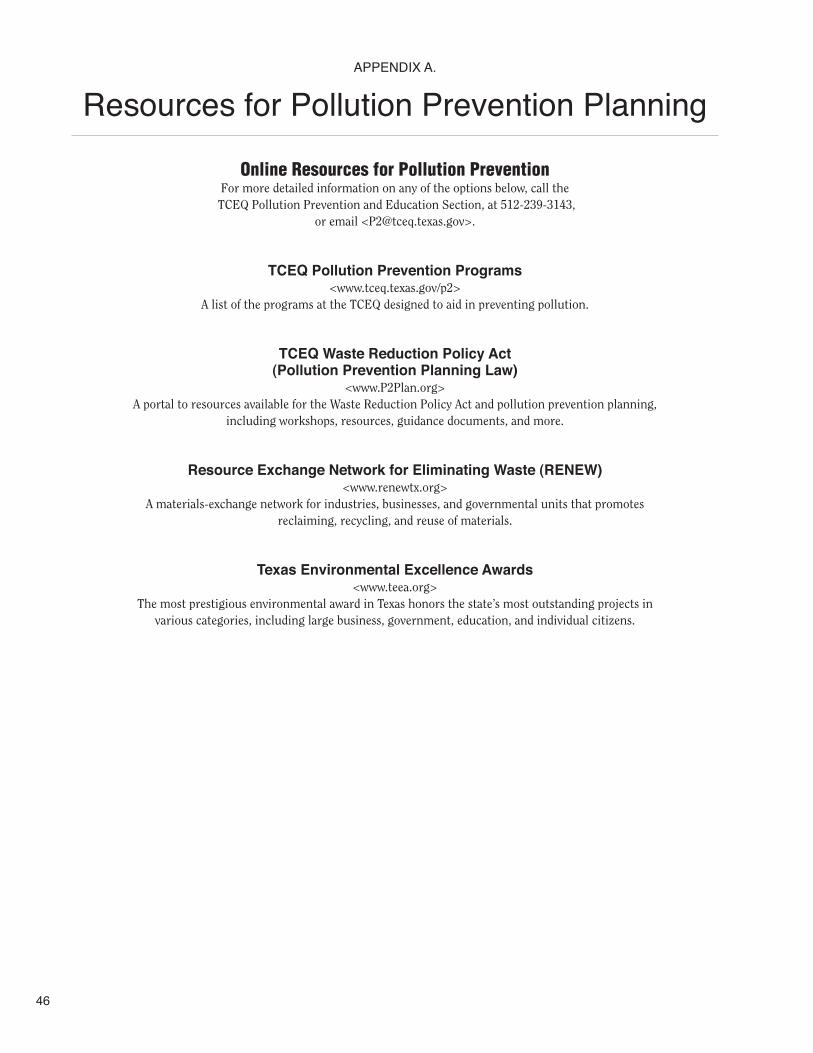
46
APPENDIX A.
Resources for Pollution Prevention Planning
Online Resources for Pollution PreventionFor more detailed information on any of the options below, call the
TCEQ Pollution Prevention and Education Section, at 512-239-3143, or email <[email protected]>.
TCEQ Pollution Prevention Programs<www.tceq.texas.gov/p2>
A list of the programs at the TCEQ designed to aid in preventing pollution.
TCEQ Waste Reduction Policy Act (Pollution Prevention Planning Law)
<www.P2Plan.org>A portal to resources available for the Waste Reduction Policy Act and pollution prevention planning,
including workshops, resources, guidance documents, and more.
Resource Exchange Network for Eliminating Waste (RENEW) <www.renewtx.org>
A materials-exchange network for industries, businesses, and governmental units that promotes reclaiming, recycling, and reuse of materials.
Texas Environmental Excellence Awards <www.teea.org>
The most prestigious environmental award in Texas honors the state’s most outstanding projects in various categories, including large business, government, education, and individual citizens.

47
APPENDIX B.
Source Reduction Activities by CategoryThe following categories will help you classify your source reduction project for the Annual Progress Report.
Source Reduction Activities by CategoryCategory Source Reduction Activity
1. Good Operating Practices
Segregate hazardous waste from nonhazardous wasteSegregate waste to increase recyclingImprove the maintenance scheduling, record keeping, or proceduresChange the production schedule to minimize equipment and feedstock changeovers
2. Inventory Control Institute procedures to eliminate expired materialTest outdated material—continue to use if still effectiveInstitute better labeling proceduresInspect and label raw materials when they arrivePurchase materials only when neededEliminate shelf-life requirements for stable materialsInstitute a clearinghouse to exchange waste materials
3. Spill and Leak Prevention
Improve storage and stacking proceduresImprove procedures for loading, unloading, and transfer operationsInstall overflow alarms or automatic shut-off valvesInstall vapor-recovery systemsImplement an inspection or monitoring program of potential spill and leak sourcesUpdate the spill response plan
4. Raw-Material Modifications/ Substitutions
Use aqueous cleaners instead of petroleum-based solventsIncrease purity of materialsSubstitute nonhazardous materials for hazardous materialsUse low-VOC paints and coatings
5. Process and Equipment Modifications
Institute recirculation within a processModify equipment, layout, or pipingUse a different process catalystInstitute better controls on operating bulk containers to minimize the discarding of empty containersInstitute closed-loop recyclingChange from small-volume containers to bulk containersReplace obsolete equipment with more efficient models
6. Cleaning and Degreasing
Modify stripping/cleaning equipmentChange to mechanical stripping/cleaning devices (from solvents or other materials)Change to aqueous cleaners (from solvents or other materials)Modify containment procedures for cleaning unitsImprove draining proceduresRedesign the parts racks to reduce drag-outModify or install rinse systemsImprove rinse equipment designImprove rinse equipment operationReduce the number of solvents used, to make waste more amenable to recycling
7. Surface Preparation and Finishing
Modify spray systems or equipmentSubstitute coating materials usedImproved application techniquesChange from spray to other system
8. Product Modifications Change product specificationsModify design or composition of the productModify the packaging
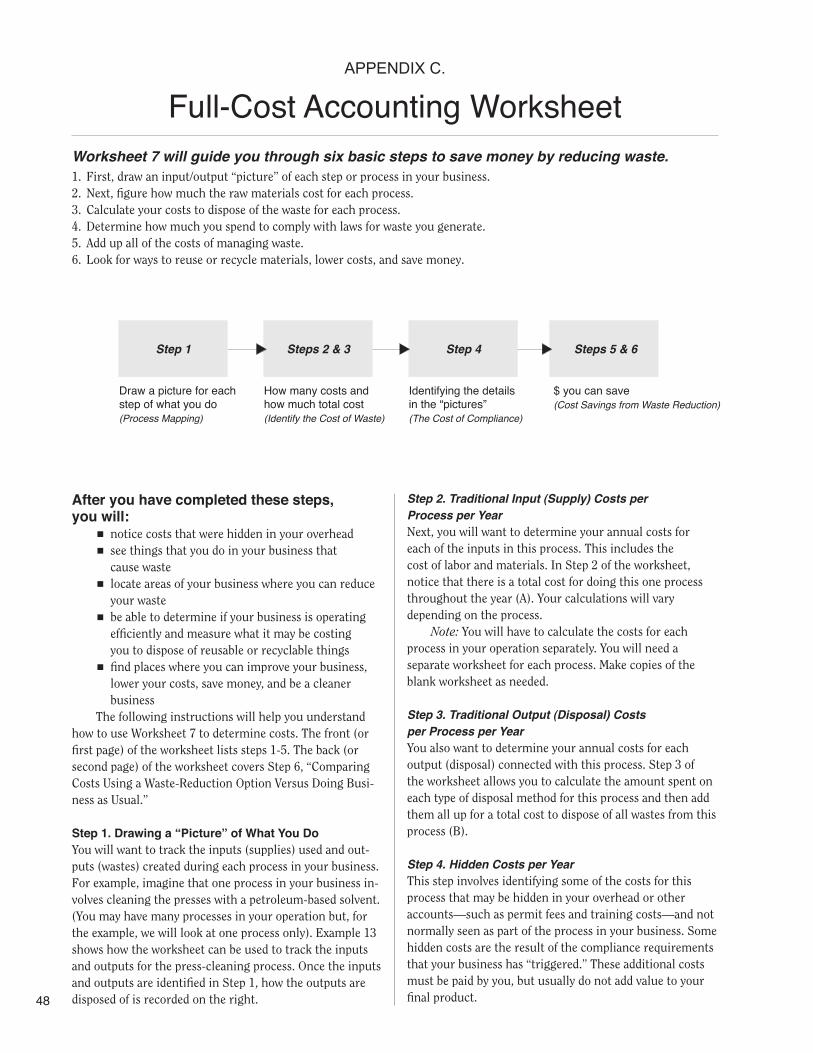
48
APPENDIX C.
Full-Cost Accounting WorksheetWorksheet 7 will guide you through six basic steps to save money by reducing waste.1. First, draw an input/output “picture” of each step or process in your business.2. Next, figure how much the raw materials cost for each process.3. Calculate your costs to dispose of the waste for each process.4. Determine how much you spend to comply with laws for waste you generate.5. Add up all of the costs of managing waste.6. Look for ways to reuse or recycle materials, lower costs, and save money.
Step 1
Draw a picture for each step of what you do(Process Mapping)
Steps 2 & 3
How many costs and how much total cost(Identify the Cost of Waste)
Step 4
Identifying the details in the “pictures”(The Cost of Compliance)
Steps 5 & 6
$ you can save(Cost Savings from Waste Reduction)
After you have completed these steps, you will:
� notice costs that were hidden in your overhead
� see things that you do in your business that cause waste
� locate areas of your business where you can reduce your waste
� be able to determine if your business is operating efficiently and measure what it may be costing you to dispose of reusable or recyclable things
� find places where you can improve your business, lower your costs, save money, and be a cleaner business
The following instructions will help you understand how to use Worksheet 7 to determine costs. The front (or first page) of the worksheet lists steps 1-5. The back (or second page) of the worksheet covers Step 6, “Comparing Costs Using a Waste-Reduction Option Versus Doing Busi-ness as Usual.”
Step 1. Drawing a “Picture” of What You DoYou will want to track the inputs (supplies) used and out-puts (wastes) created during each process in your business. For example, imagine that one process in your business in-volves cleaning the presses with a petroleum-based solvent. (You may have many processes in your operation but, for the example, we will look at one process only). Example 13 shows how the worksheet can be used to track the inputs and outputs for the press-cleaning process. Once the inputs and outputs are identified in Step 1, how the outputs are disposed of is recorded on the right.
Step 2. Traditional Input (Supply) Costs per Process per YearNext, you will want to determine your annual costs for each of the inputs in this process. This includes the cost of labor and materials. In Step 2 of the worksheet, notice that there is a total cost for doing this one process throughout the year (A). Your calculations will vary depending on the process.
Note: You will have to calculate the costs for each process in your operation separately. You will need a separate worksheet for each process. Make copies of the blank worksheet as needed.
Step 3. Traditional Output (Disposal) Costs per Process per YearYou also want to determine your annual costs for each output (disposal) connected with this process. Step 3 of the worksheet allows you to calculate the amount spent on each type of disposal method for this process and then add them all up for a total cost to dispose of all wastes from this process (B).
Step 4. Hidden Costs per YearThis step involves identifying some of the costs for this process that may be hidden in your overhead or other accounts—such as permit fees and training costs—and not normally seen as part of the process in your business. Some hidden costs are the result of the compliance requirements that your business has “triggered.” These additional costs must be paid by you, but usually do not add value to your final product.

49
Finding the exact dollar amount is not as important as identifying the various compliance costs linked to the process. Just estimate how much you spend, as closely as possible. Or, estimate your total hidden costs and divide by the number of processes. Then distribute the amount equally to each item that affects each process. Accuracy is not as important as identifying these costs, seeing where they come from, and looking at their relationship to your annual revenues and expenses. In the worksheet, the costs are estimated and totaled for the year (C).
Step 5. Total Costs per YearAdd up the cost of materials going into the process (A), the cost of disposal of excess materials and controlling materi-als (B), and any hidden costs (C). In the worksheet sample, Example 13, we calculated the total cost for cleaning the presses. By knowing what each process (press cleaning, for example) costs your business, you can start to manage your costs more effectively and save money.
Step 6. Comparing Costs Using a Waste-Reduction OptionOnce you have completed Steps 1-5, you can use this infor-mation to find ways to save money by reducing, reusing, or recycling any of those leftover materials.
Step 6 allows you to compare the cost of doing business as it is now with the cost of doing business using alternatives designed to reduce your waste at the source and save you money. We’ll continue using the press-cleaning example.
To complete Step 6, you will need to:
� Determine the cost of materials that are being lost through disposal, rather than reusing or recycling them.
� Choose a waste-reduction option from the options you have identified in your technical-feasibility study.
� Compare your current costs with the cost of using an alternative method that reduces waste.
� Determine the payback period of any new equip-ment purchased.
Based on their technical-feasibility study, the company decided to use a solvent-recycling unit. It reduces the amount of raw materials and labor needed to do cleanup (Example 12). Other processes may need different waste-reduction options.
Example 12 makes several assumptions about solvent-distillation units based on information gathered from vendors. Your unit may perform differently than the estimates here. It is important to figure out how much solvent your unit recovers, because other numbers are based on it. Even with a solvent-recovery unit, some new solvent must be purchased. Usually machines recover between 50 and 70 percent of the original solvent, so additional solvent that will need to be purchased will range from 30 to 50 percent of the initial amount.
The information from Steps 1-5 was entered in the “Before” column of Step 6 (see Example 13). Next, the new information from the “Waste-Reduction Option” table (Example 12) was written in the “After” column. Finally, the current operating costs are compared to the costs of using the new waste-reduction option.
At the bottom of the Step 6 page of the worksheet, there is a comparison calculation that will tell you how long it will take until you break even on any equipment you had to purchase in the waste-reduction option. This is called the “Payback Period,” and it shows you two things:
� how long it takes to break even on the equipment purchased
� how quickly you can start to save money
Example 12. Waste-Reduction Option: Installing a Two-Gallon Solvent-Distillation Unit
a. Amount of solvent you use in a year for this process (no. of times you do process × amount used each time) 117 gal
b. Annual costs to use this much solvent for this process ($0.53/half pt = $8.48/gal) (117 gal × $8.48/gal) $992.16
c. Annual disposal costs to dispose of this much solvent as hazardous waste (Step 3 from Worksheet 7) $231.25
d. Minimum average amount (%) of solvent recovered with a two-gallon solvent-distillation unit 0.65
e. Amount of solvent recovered per year for this process, with 65% recovery rate (a × .65) 76.05 gal
f. Additional solvent purchases required for this process, above the amount of solvent recovered with a solvent-distillation unit (a - e) 40.95 gal
g. Average amount (gal) of still-bottom sludge disposed of per year with a two-gallon solvent-distillation unit 110 gal
New cost to purchase solvent for this process (b × .35) (65% recovery rate means you only need to buy 35% as much new solvent) $347.26
Cost to dispose of 110 gal of still-bottom sludge per year for this process (contact your local hazardous-waste hauler) $185.00

50
Example 13. Step 6 (of Worksheet 7): Comparing Costs Using a Waste-Reduction Option versus Doing Business as Usual
Step 6. Comparing Costs Using a Waste-Reduction Option versus Doing Business as Usual
BEFORE WASTE REDUCTION
Process Name: _______________________________Press Cleaning
Inputs (materials, supplies)Annual input costs for each of the inputs for THIS process.from the front of your worksheet (Step 2) 1. Solvent 1. $ 992.16 2. Labor 2. $ 7,020.00 3. Rags 3. $ 299.52 4. 4. $ 5. 5. $ What is the OLD annual inputtotal cost from this process $ 8,311.68
Outputs (what’s left)Annual disposal costs from THIS process.from the front of your worksheet (Step 3)Dumpster $ Sewer $ Waste Hauler $ 231.25Recycle $
The OLD annual disposaltotal cost from this process $ 231.25
Annual HIDDEN Costsfrom the front of your worksheet (Step 4)The OLD annual hidden costs from this process $ 170.00
COST COMPARISONYour OLD Total cost per year foryour INPUTS, OUTPUTS, andHIDDEN Costs $ 8,712.93 MINUSNEW Total cost per year for your INPUTS, OUTPUTS, and HIDDEN Costs $ 8,021.78 EQUALSDifference in OLD vs. NEW TOTAL COSTS per year $ 691.15 NEXTNow subtract the cost of any NEW EQUIPMENT purchased and installed (if applicable) $ 2,100.00
The difference is: $ -1,408.05
AFTER WASTE REDUCTION
Solvent Distillation UnitP2 Option Name: ______________________________
Which INPUT(s) at the left Solventwill be affected by selecting a waste-reduction option
New Input Costs (including any changes from this P2 Option)
1. Solvent 1. $ 347.26 2. Labor 2. $ 7,020.00 3. Rags 3. $ 299.52 4. 4. $ 5. 5. $ What is the NEW annual inputtotal cost from this process $ 7,666.78
Which DISPOSAL method(s) atthe left will be affected by selecting Waste haulera waste-reduction option
New Output Costs (including any changes from this P2 Option)
Dumpster $ Sewer $ Waste Hauler $ 185.00Recycle $
The NEW annual outputtotal cost from this process $ 185.00
New Annual HIDDEN CostsThe NEW annual hidden costs (including any possible changes) $ 170.00
If you divide the new up-front cost by how much you save per year, you will determine your PAYBACK PERIOD, or how long it will take to pay for the new equipment.
$ 2,100.00 = 3.03 yrs.$ 691.15

51
Worksheet 7. Full-Cost Accounting WorksheetUse a separate worksheet for each process.
Step 1. Process input/output map Process Name
Inputs (materials, supplies)1. _____________________________2. _____________________________3. _____________________________4. _____________________________5. _____________________________
Outputs (what’s left other than the finished product)
1. _____________________________2. _____________________________3. _____________________________4. _____________________________5. _____________________________
Disposal MethodDumpsterSewerWaste haulerRecycle
OUTPUT NO.
1 2 3 4 5
Step 2. Annual input costs for this processInput costs for doing this process ONCE
Estimated number of times this process is done in a year
Annual input cost for THIS process
1. $ ________________________ × ____________ times / year = 1. $ ____________________________2. $ ________________________ × ____________ times / year = 2. $ ____________________________3. $ ________________________ × ____________ times / year = 3. $ ____________________________4. $ ________________________ × ____________ times / year = 4. $ ____________________________5. $ ________________________ × ____________ times / year = 5. $ ____________________________
Total INPUT COSTS per year for this process $ ____________________________A
Example: Estimated number of times this process is done in a year for 1 duplicator press and 1 two-color press(3 washes @ 2 times a day × 6 days a week × 52 weeks = 1,872 times/year)
Step 3. Annual OUTPUT costs for this process Annual disposal AMOUNTS for each disposal method
Estimated % of annual disposal amounts from THIS process
Annual input cost for THIS process
Annual disposal from THIS process
Dumpster ___________ loads __________ % × $ ____________________ = $ ____________________Sewer ___________ gals. __________ % × $ ____________________ = $ ____________________Waste hauler ___________ drums __________ % × $ ____________________ = $ ____________________Recycle ___________ lbs. __________ % × $ ____________________ = $ ____________________
Total OUTPUT COSTS per year for this process $ ____________________B
Step 4. Hidden costsEstimate your annual overhead costs that come from this process.Inspections & monitoring $ ___________________Permit fees & preparation $ ___________________Record keeping & reporting $ ___________________Sampling & testing $ ___________________Safety equipment $ ___________________Training $ ___________________Labels & labeling $ ___________________Secondary containment $ ___________________Storage & containers $ ___________________Pollution control equipment – maintenance $ ___________________Pollution control equipment – utilities $ ___________________Waste collection equipment – maintenance $ ___________________Waste collection equipment – utilities $ ___________________Waste pre-treatment $ ___________________
Total HIDDEN COSTS for this process $ ___________________
C
Step 5. Total costs for this process
A
B
C
$ _____________
$ _____________
$ _____________
$ _____________
$ _____________
Cost of INPUTS per year for this process + Cost of OUTPUTS per year for this process =
Total Traditional Costs per year for this process + HIDDEN COSTS per year for this process =
Total cost of THIS PROCESS per year

52
Step 6. Comparing Costs Using a Waste-Reduction Option versus Doing Business as Usual
BEFORE WASTE REDUCTION
Process Name: _______________________________
Inputs (materials, supplies)Annual input costs for each of the inputs for THIS process.from the front of your worksheet (Step 2) 1. Solvent 1. $ 2. Labor 2. $ 3. Rags 3. $ 4. 4. $ 5. 5. $ What is the OLD annual inputtotal cost from this process $
Outputs (what’s left)Annual disposal costs from THIS process.from the front of your worksheet (Step 3)Dumpster $ Sewer $ Waste Hauler $ Recycle $
The OLD annual disposaltotal cost from this process $
Annual HIDDEN Costsfrom the front of your worksheet (Step 4)The OLD annual hidden costs from this process $
COST COMPARISONYour OLD Total cost per year foryour INPUTS, OUTPUTS, andHIDDEN Costs $ MINUSNEW Total cost per year for your INPUTS, OUTPUTS, and HIDDEN Costs $ EQUALSDifference in OLD vs. NEW TOTAL COSTS per year $ NEXTNow subtract the cost of any NEW EQUIPMENT purchased and installed (if applicable) $
The difference is: $
AFTER WASTE REDUCTION
P2 Option Name: ______________________________
Which INPUT(s) at the left will be affected by selecting a waste-reduction option
New Input Costs (including any changes from this P2 Option)
1. Solvent 1. $ 2. Labor 2. $ 3. Rags 3. $ 4. 4. $ 5. 5. $ What is the NEW annual inputtotal cost from this process $
Which DISPOSAL method(s) atthe left will be affected by selecting a waste-reduction option
New Output Costs (including any changes from this P2 Option)
Dumpster $ Sewer $ Waste Hauler $ Recycle $
The NEW annual outputtotal cost from this process $
New Annual HIDDEN CostsThe NEW annual hidden costs (including any possible changes) $
If you divide the new up-front cost by how much you save per year, you will determine your PAYBACK PERIOD, or how long it will take to pay for the new equipment.
$ = _____ yrs.$

53
APPENDIX D.
P2 Annual Progress Report Form
Texas Commission on Environmental Quality
P2 Annual Progress Report Required APR Form
PART 1. FACILITY DESCRIPTION
Report Year: Report Date:
Company Name:
Facility Name:
Mailing Address: Physical Address:
Mailing City, State, Zip: Physical City, State, Zip:
Name of Pollution Prevention Contact: TCEQ SW Reg. No.
Telephone: - - Ext. TRI ID No.
Fax: - - EPA ID No.
Email (optional): P2 Program ID No. (PNumber):
Primary SIC Code: Number of Employees:
Primary NAICS: Regulated Entity No. (RN):
First year of your current plan: Customer No. (CN):
Does this report revise a previously submitted APR? Yes No
PART 2. PROJECTED AMOUNTS FOR GOAL YEAR (FROM YOUR PLAN)
Goal Year (the 5th year of your plan):
Estimate Quantity
HW [Column A]
TRI [Column B]
1. Projected amount of HW generation or TRIreleases/transfers by Goal Year
Tons Tons
2. Source reduction anticipated over five-year period Tons Tons
3. % Waste minimization by the Goal Year % %
TCEQ-00784 (5/17)

54
Facility Name: Date: Page 2 of 2
Part 3: Reduction Achievement for the Report Year
Source Reduction Activities
Estimate the amount of reduction for hazardous waste generation and TRI release/transfer that your facility experienced in each category below.
Estimate Quantity
HW (Tons) [Column A]
TRI (Tons) [Column B]
1. Good Operating Practices
2. Inventory Control
3. Spill and Leak Prevention
4. Raw-Material Modifications/Substitutions
5. Process and Equipment Modifications
6. Cleaning and Degreasing
7. Surface Preparation and Finishing
8. Product Modifications
9. Total Source Reduction (Sum 1 through 8) in Tons
Briefly describe any modifications to your plan as well as your pollution prevention projects, especially the activity you undertook to reduce waste at its source for the report year:
Note: Submission of waste-minimization information and information about HW generated and TRI released and transferred for the previous reporting year is required by the Waste Reduction Policy Act. SQGs that are non-TRI Form R reporters meet this requirement through submission of their annual waste summary. All hazardous waste generators are required to submit an annual waste summary. Submission of this form does not substitute for submission of the annual waste summary.
TCEQ-00784 (5/17)