Embed Size (px)
Citation preview

iA GUIDE TO LOW-CARBON TRANSPORT 2011
A GUIDE TO
Transportation, climate change and the UN
Framework Convention on Climate Change
17th Conference of the Parties (COP17) in Durban, 2011
LOW-CARBON TRANSPORT

A GUIDE TO LOW-CARBON TRANSPORT 2011ii
SOUTH AFRICA’S ROLE AS HOST for the UN Framework Convention on Climate Change Seventeenth
Conference of the Parties (COP17) places the country in the spotlight, not just in terms of hosting the event,
but also with regard to the role South Africa plays in both producing and mitigating carbon emissions.
This guide to low-carbon transport is intended to inform debate within the South African transport sector
on the impact of transport on climate change and the potential for low-carbon and sustainable transport to
mitigate climate change e"ects. The contents are by no means exhaustive, but should be seen as indicative
of a number of the potential approaches that can be applied in urban areas to reduce consumption of fossil
fuels, decrease emissions of greenhouse gases and contribute to more livable cities.
This document has been prepared with #nancial assistance from the South African Sustainable Transport
Project, an initiative of the South African Department of Transport, with grant funding from the Global
Environment Facility and implementation assistance from the United Nations Development Programme.
The Sustainable Transport Project has supported low-carbon transport projects in seven South African
cities in the areas of Bus Rapid Transit, High Occupancy Vehicle Lanes and Non-Motorised Transport,
together with a skills and capacity development programme. A number of these projects are described
in this document.
The management of the Sustainable Transport Project would like to thank Gail Jennings and the
numerous specialists who have contributed to this document.
A GUIDE TO
LOW-CARBON TRANSPORT
CONTRIBUTORS
Ramon J Cruz (ITDP and Bridging the Gap); Sizwe Kuzwayo, Deloitte; Cornie Huizenga, Partnership for
Sustainable Low Carbon Transport; Jane Barrett, SATAWU; Christo Valentyn; Brett Elo"; Louise Naudé
(WWF); and Carel Snyman
Produced by Gail Jennings (www.gailjennings.co.za). Designed by Cornelle Ellis
For more information about the South African Sustainable Transport Project contact:
LUSANDA MADIKIZELA
Director, Programme Management, South African Department of Transport [email protected]
DAVID INGHAM
Project Coordinator, DOT / UNDP-GEF Sustainable Transport Project, [email protected]
For
LUSAN
Direct

1A GUIDE TO LOW-CARBON TRANSPORT 2011
The transport sector accounts for 13% of all
greenhouse gas (GHG) emissions and 23%
of energy related ones on a global level.
The OECD (Organisation for Economic
Co-operation and Development) predicts a 120%
growth of global transport emissions on year 2000
levels by 2050. Transport-related CO2 emissions are
expected to increase 57% worldwide in the period
2005 to 2030.
While the largest share of GHG emissions from the
transport sector is emitted from developed countries,
much of the growth will come from the developing
countries (approximately 80% of the predicted
increase). With these !gures in mind, it is obvious
that the world cannot address the climate change
challenge and limit temperature increases to less than
2 °C without tackling transport. The transport sector,
and land transport in particular, has the potential to
play a signi!cant role in reversing the current trend
towards permanent changes in the world’s climate.
However, as Gary Kendall, author of WWF
publication ‘Plugged In: The End of the Oil Age’ puts it,
mobility enables economic development. ‘Everything
that is burning petroleum greatly enhances levels
of mobility and therefore economic activity. That is
why we move. Mobility provides access to goods,
employment, commercial and social services, access >
THE ROLE OF TRANSPORTATION
IN CLIMATE CHANGEFossil fuels are changing our climate, and so that’s what we’ve got to change. It’s high time for a rapid mobilisation to a 100% safe, just, renewable energy future. - Bill McKibben, founder, 350.org
‘Transport is the economy’ – Dr Gary Kendall

A GUIDE TO LOW-CARBON TRANSPORT 20112
to friends, relatives, communities and leisure; it also
provides access to raw materials, employees, suppliers,
customers and consumers and so on – another way of
looking at it is to say, transport is the economy.’
It is disappointing to see that the transport sector
has not bene!ted signi!cantly from the existing !nancial
mechanisms under the United Nations Framework
Convention on Climate Change (UNFCCC) process and
its Kyoto Protocol, the current international governing
structure in place to address climate change worldwide.
For example, only 36 of the 3 329 projects within the
Clean Development Mechanism pipeline and six of the
3 395 projects that had been registered by September
2011 are transport sector projects. This calls for a much
larger role of the transport sector in any possible future
agreement that may come after the !rst commitment
period of the Kyoto Protocol in 2012 or any bilateral and
regional initiatives to combat climate change.
An important way in which transport contributes
to GHGs is through fossil fuel combustion. Fossil fuels
contain a substantial amount of carbon, and when
these fuels are burned in the presence of oxygen they
form carbon dioxide. Emissions generated during the
production of electricity, and those produced during
the manufacture of liquid fuels, also contribute to the
production of GHGs.
Transport emissions in South Africa
South Africa requires more transport relative to its
GDP size than any other economy. This is because
the economy is ‘spatially challenged’ ie unlike most
countries with a coastline, South Africa’s industrial
centre is far inland. In addition, the distances between
cities are vast. South Africa accounts for 0.4% of the
world’s total GDP, but 0.7% of the world’s transport
costs and 2.2% of the world’s surface freight tonne
kilometres (road and rail combined).
A breakdown of the three primary greenhouse gases emitted from transport in 2000
GHG EMISSIONS (MtCO2e) % OF TOTAL
Carbon dioxide (C02
) 38.624 97.8%
Methane (CH4
) 0.258 0.7%
Nitrous oxide (N20) 0.629 1.6%
Total 39.5
Road-based transport (diesel and petrol) contributes 93.1% of these greenhouse gases.
MtCO2e means megatonnes of carbon
dioxide equivalent.
Road transport is responsible for 74%
of all transport emissions globally.
Private cars account for a large portion.
Aviation accounts for 12%. Short haul
$ights are the worst emitters, as the
most fuel is consumed in take-o" and
landing.
Shipping accounts for 10%. The
industry, in addition, is very polluting
of the sea and river waterways.
Rail accounts for 2% of global transport
emissions. However, many rail systems
operate o" electricity generated by
fossil fuels, and these emissions are
not included in the #gure. In addition,
the rail systems of many countries still
operate partly or fully on diesel.
In 2009 there were more than eight million motorised vehicles on South Africa’s roads
Private cars 5 411 093
LDVs – bakkies 1 946 292
Trucks 321 604
(compared to 229 000
in 2000)
Motorcyles 362 400
Minibuses 282 941
Buses 45 217 (about 25 000
in public transport)
Other and unknown 230 484
3A GUIDE TO LOW-CARBON TRANSPORT 2011
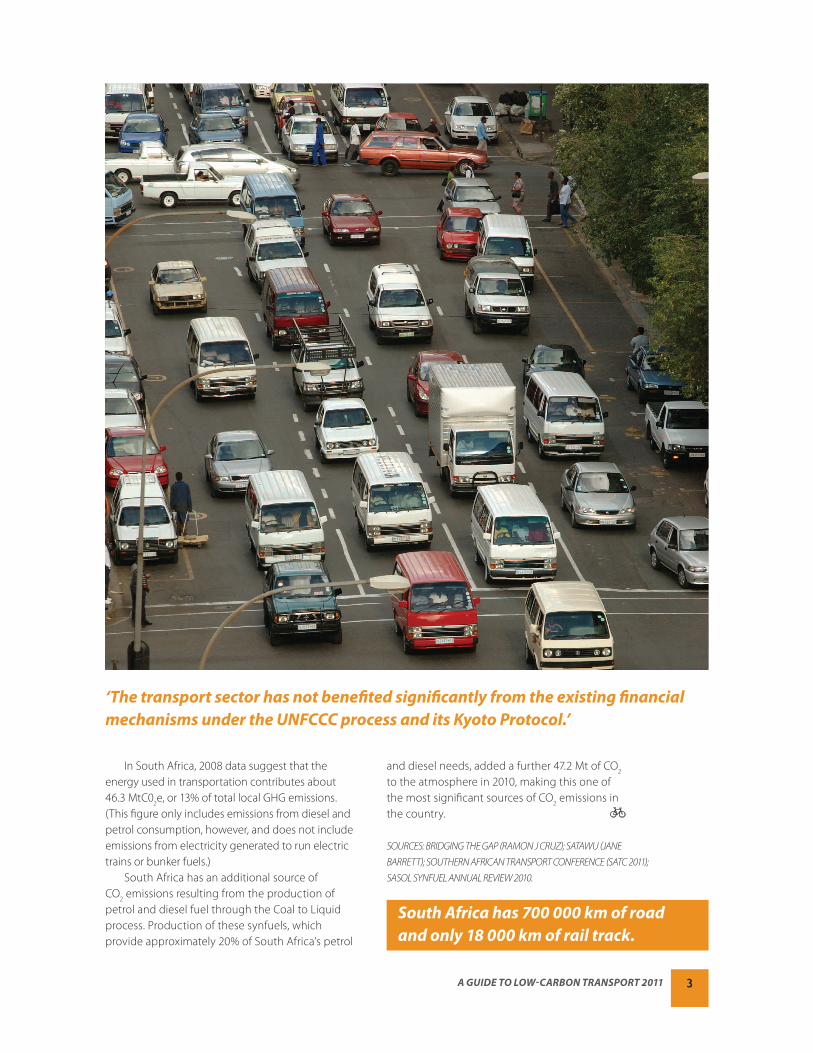
In South Africa, 2008 data suggest that the
energy used in transportation contributes about
46.3 MtC02e, or 13% of total local GHG emissions.
(This !gure only includes emissions from diesel and
petrol consumption, however, and does not include
emissions from electricity generated to run electric
trains or bunker fuels.)
South Africa has an additional source of
CO2 emissions resulting from the production of
petrol and diesel fuel through the Coal to Liquid
process. Production of these synfuels, which
provide approximately 20% of South Africa’s petrol
and diesel needs, added a further 47.2 Mt of CO2
to the atmosphere in 2010, making this one of
the most signi!cant sources of CO2 emissions in
the country.
SOURCES: BRIDGING THE GAP (RAMON J CRUZ); SATAWU (JANE
BARRETT); SOUTHERN AFRICAN TRANSPORT CONFERENCE (SATC 2011);
SASOL SYNFUEL ANNUAL REVIEW 2010.
‘The transport sector has not bene#ted signi#cantly from the existing #nancial
mechanisms under the UNFCCC process and its Kyoto Protocol.’
South Africa has 700 000 km of road
and only 18 000 km of rail track.

A GUIDE TO LOW-CARBON TRANSPORT 20114
NAMAs
The concept of NAMAs is still not concretely de!ned but
it is understood to refer to voluntary emission reduction
measures reported by national governments to the
UNFCCC. These actions can have the form of policies,
programmes or projects on the national, regional or
local level. This presents a favourable scheme to develop
mitigation activities in the land transport sector. From the
44 Parties that have submitted NAMAs (as of September
2011), 28 have made explicit reference to the land
transport sector.
Finance At COP16, developed country Parties were invited to
submit information on resources provided to ful!ll the
commitment for fast-start !nance (US$30 billion between
2010 and 2012) and to scale-up ‘long-term !nance’ to
developing countries (US$100 billion a year by 2020). This
represents an opportunity for transport stakeholders to
ensure that criteria for funding can support activities in
the land transport sector. In addition, it was decided to
establish a Green Climate Fund (GCF) to operate as the
UNFCCC’s !nancial mechanism and to be operated by an
independent secretariat and operated by the World Bank.
It went on to say that it would support projects using
‘thematic funding windows’, though it did not provide
details of these windows.
Technology The COP established a ‘Technology Mechanism’ in
order to support the di&usion and deployment of
environmentally sound technologies and knowledge,
increase investment in technology, review technological
needs, provide guidance and facilitate collaboration.
It would operate under the guidance of the COP and
guided by a Technology Executive Committee and a
Climate Technology Centre and Network.
Capacity building The outcome of the COP concluded that capacity
building support to developing country Parties should
be enhanced and developed countries should provide
!nancial resources to support this. This represents
opportunities for transport stakeholders to strengthen
institutions, networks for sharing knowledge, climate
change education and training, capacity to evaluate GHG
impacts of spending and policies, and public awareness
among other initiatives.
COP16 IMPLICATIONS FOR THE TRANSPORT SECTOR
The United Nations Framework Convention
on Climate Change (UNFCCC) is an
international environmental treaty which
was produced in 1992 at the Earth Summit
held in Rio de Janeiro. The objective of the treaty
‘is to stabilise greenhouse gas concentrations
in the atmosphere at a level that would prevent
dangerous anthropogenic interference with
the climate system.’ The Kyoto Protocol is an
international agreement under the UNFCCC, which
is used by the UNFCCC to e"ect the reduction of
global emissions by 5.2% between 2008 and 2012
based on 1990 levels.
After the Parties to the UNFCCC were not able to
reach consensus on a legally binding agreement to
curb GHG emissions after 2012, some of the con!dence
in the process was eroded.
A large focus of last year’s COP16 in Cancun,
Mexico, was to restore con!dence in the process
and push forward a series of agreements that are
more realistic for today’s world. Contrary to the
expectations of many, considerable progress was
made by Parties at the conference, particularly in
relation to Nationally Appropriate Mitigation Actions
(NAMAs), the veri!cation of developing country
mitigation actions through International Comparative
Analysis (ICA), !nancing, technology transfer and
capacity building.
Below are some of the outcomes that could be bene#cial to the transport sector:

5A GUIDE TO LOW-CARBON TRANSPORT 2011
EXPECTATIONS FOR COP17 IN DURBAN
While it is unlikely that the world will
see a legally binding agreement
to reduce GHGs at COP17, the
conference in Durban might result in
the most exciting set of accomplishments by the
COP in recent years. There is a solid foundation
for action laid out in the Cancun agreements of
COP16. The meeting in Durban will consolidate
recent advancements in the important areas of
building the institutions to deliver #nance and
technology to developing countries.
On the Technology Mechanism, there has
been progress towards the creation of the Climate
Technology Centre and Network, which should be
!nalised in Durban. In a similar way, the Transition
Committee to design the Green Climate Fund has
outlined the path towards completing its work in
Durban. These two developments are extremely
positive for transport stakeholders and an incentive
to work hard to include transport projects as part of
NAMAs, since most likely both mechanisms will rely on
the NAMAs registry for implementation.
There are areas nonetheless where it is uncertain
if Durban will deliver successful outcomes. One is that
the total sum of o*cial emission reduction pledges
until today adds up to only 60% of what is agreed is
needed to keep the temperature increase to 2 °C. It is
unclear if more countries will pledge more aggressive
GHG emission reductions while at Durban. Another
key issue that remains unsolved and will need to be
answered in Durban is the future of the Kyoto Protocol.
Many countries want the treaty to continue beyond the
!rst commitment period that !nishes in 2012, but some
are not willing to continue into a second period in its
current form.
At the heart of Durban’s new bicycle network is the
Durban International Convention Centre, from which
COP17 delegates will be able to depart on a "eet of
bicycles specially commandeered for the event.

A GUIDE TO LOW-CARBON TRANSPORT 20116
The Kyoto Protocol e"ectively committed
developed countries to emission reduction
targets, which means they needed to
take action to reduce emissions internally
and as well as buy some carbon credits from
developing countries. A carbon credit is a generic
term for any tradable certi#cate or permit
representing the right to emit one tonne of carbon
dioxide or the mass of another greenhouse gas
such as methane (CH4) with a carbon dioxide
equivalent (tCO2e) to one tonne of carbon dioxide.
The carbon market has grown signi!cantly since
its inception, doubling in volume every year for three
years since 2005. It peaked at $144bn in 2009 and
stalled to $142bn in 2010, dropping for the !rst time
since its inception. Most market commentators and
participants are of the view that this is a result of the
uncertainty about the carbon market post-2012.
Clean Development Mechanism (CDM)
The Kyoto Protocol introduced three +exible
mechanisms by which to reduce emissions, one of
which is the Clean Development Mechanism (CDM).
The CDM makes it possible for developing
countries such as South Africa, India, China and Brazil
to participate in emission reduction e&orts while
positively contributing to sustainable development.
The CDM is a project-based mechanism, which is
governed by the CDM Executive Board, appointed by
the UNFCCC (United Nations Framework Convention
on Climate Change).
How it works is that a company in South Africa
can initiate an emission reduction project, register it
under the CDM, and generate carbon credits. These
carbon credits could be sold to developed countries
to assist them in meeting their targets under the
Kyoto Protocol, while providing the much-needed
cash injection in emission reduction projects in South
Africa. The CDM was designed to enable technology
transfer, build capacity and also encourage sustainable
development. The speci!c de!nition and criteria for
sustainable development based on economic, social,
and environmental elements is left to the individual
host countries to de!ne. In addition, if a project results
in a reduction of greenhouse gases, uses an existing
approved methodology, and is additional, then it could
be developed as a CDM project. A project is regarded
additional if the emissions from the project activity are
reduced below those that would have occurred in the
absence of the CDM project activity.
CDM projects go through a lengthy, highly
technical and usually costly process to get to
registration. With more than 3 300 registered projects,
some believe the CDM to be a success; China and
India account for about two thirds of these projects,
with Brazil in third place. As at the end of August 2011,
Africa had only 66 registered projects, with South
Africa accounting for 19 of these (and none of these are
transport projects).
The current under-representation of the transport
sector could be explained by a number of barriers,
such as:
the di*culty in explaining the baseline scenario,
due to the fact that transport projects contribute
to a multitude of goals
lack of positive lists of technologies that are
common practice for easier demonstration of
additionality
data- and resource intensity of transport projects,
making monitoring di*cult and costly
extensive linkages to other exonomic activities
(makes it di*cult to give bounbdaries to a project)
transport’s strong relationship with human
behaviour, which can make evaluation di*cult
high CDM project related costs (including the cost
of devices) versus bene!ts from CDM.
Nationally Appropriate Mitigation Actions (NAMAs)
NAMAs were conceived in December 2009 at the
International Climate Change Conference held in Bali
(COP14). The Bali Action Plan, a document produced as
an outcome from the conference, speaks of ‘Nationally
Appropriate Mitigation Actions by developing
FINANCING A LOW-CARBON ECONOMY - FROM CDM TO NAMAs

7A GUIDE TO LOW-CARBON TRANSPORT 2011
countries in the context of sustainable development,
supported and enabled by technology, !nancing and
capacity building, in a measurable, reportable and
veri!able manner.’
The Copenhagen Accord, an outcome document from
COP15, speaks of two kinds of NAMAs. Those undertaken
by developing countries themselves which ‘will be subject
to their domestic measurements, reporting and veri!cation’
and those that are ‘seeking international support’,
which ‘will be recorded in a registry along with relevant
technology, !nance and capacity building support’. These
NAMAs ‘will be subject to international measurements,
reporting and veri!cation in accordance with guidance
adopted by the Conference of the Parties’.
The Cancun Agreement from COP16 invited
developing countries to inform the Secretariat of the
NAMAs for which ‘they are seeking support, along
with estimated costs and emission reductions, and the
anticipated time frame for implementation’.
The general understanding so far is that the NAMAs
are not restricted to actions that directly reduce GHG
emissions, but that they can also include actions that
will facilitate or enable the reduction of GHG emissions
such as policy development. Thus NAMAs could also
be implemented at provincial or city level.
At the end of August 2011, only 47 countries had
registered their NAMAs with the Secretariat.
NAMAs are generally categorised as follows:
Unilateral NAMAs
The developing country takes autonomous actions
to reduce emissions using domestic !nancing. These
actions can be used to meet international pledges.
Supported NAMAs
These actions will enjoy support from the international
community in the form of !nancing, technology or
capacity building. These NAMAs could be supported
by bilateral or multilateral agreements and even the
Green Climate Fund. This fund was established in
Copenhagen and was established to ‘be an operating
entity of the !nancial mechanism of the Convention
to support projects, programmes, policies and other
activities in developing countries related to mitigation
including REDD-plus, adaptation, capacity-building,
technology development and transfer’. These NAMAs
could also receive up-front !nancing from developed
countries. Support could include grants, loans, and
policy development support. They would need to be
registered in a registry.
Credited NAMAs Developing countries would earn carbon credits
from their mitigation e&orts and sell these in the
international carbon market provided they meet
certain requirements. They would also need to
be registered in a registry. How this market-based
mechanism would work was deferred to COP17 which
is taking place in Durban at the end of the year.
It is encouraging to see the principle of sustainable
development being carried forward into the NAMAs
de!nition, along with !nancing, technology transfer, and
capacity building. Also encouraging is the fact that unlike
CDM, NAMAs are not project based and could potentially
be sector speci!c and include policy development.
However, some developing nations are of the view
that all NAMAs must be supported and !nanced (as
de!ned) by developed countries. They feel that their
development must not be impeded by developed
countries. On the other hand, some developed
countries are saying that developing countries must
take independent action to reduce global emissions.
Another complication is that NAMAs are supposed
to be nationally appropriate, which means di&erent
things to di&erent countries, including that each country
has autonomy in de!ning appropriateness, while at
the same time needing to comply with ‘measurement,
reporting and veri!cation’ requirements. Moreover, the
registry still needs to be developed and approved; more
clari!cation is required on measurement, reporting and
veri!cation issues, and developing countries need to
provide proposals of their NAMAs. Ultimately, developed
countries must provide !nance for the Green Climate
Fund. In Copenhagen, developed countries agreed
to provide $30 billion in a fast-track !nancing and a
further $100 billion per year by 2020. With the recent
Global !nancial crisis, it remains to be seen whether the
!nancial support will materialise.
SIZWE KUZWAYO – DELOITTE (SUSTAINABILITY & CLIMATE
CHANGE), WITH ADDITIONAL SOURCES CORNIE HUIZENGA AND
STEFAN BAKKER (PARTNERSHIP FOR SUSTAINABLE LOW-CARBON
TRANSPORT).
Will MRV (Measurement, Reporting and
Veri#cation) measures be less restrictive
than in the case of CDM?
Can NAMAs be sector-speci#c, and at provincial
and city level?
Does your project qualify as a NAMA?
How do you apply for #nancing?
What is the progress on the NAMA registry?
A GUIDE TO LOW-CARBON TRANSPORT 20118
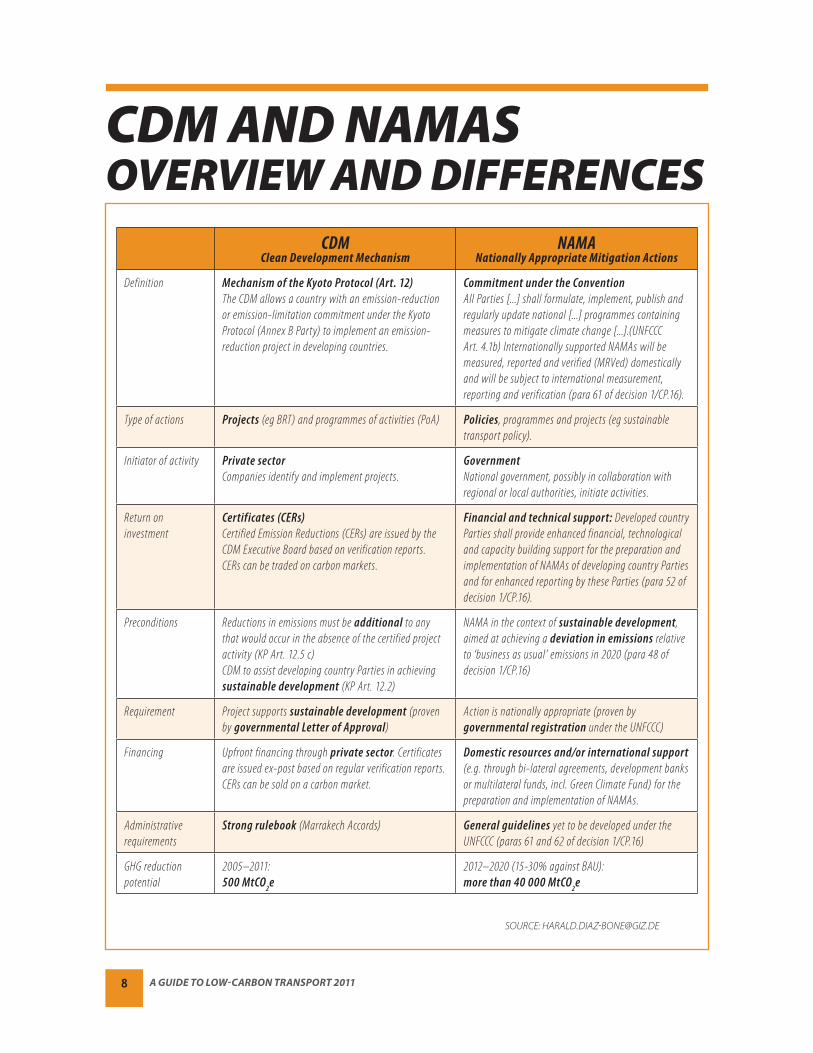
CDM AND NAMASOVERVIEW AND DIFFERENCES
CDM Clean Development Mechanism
NAMA Nationally Appropriate Mitigation Actions
Definition Mechanism of the Kyoto Protocol (Art. 12)
The CDM allows a country with an emission-reduction
or emission-limitation commitment under the Kyoto
Protocol (Annex B Party) to implement an emission-
reduction project in developing countries.
Commitment under the Convention
All Parties [...] shall formulate, implement, publish and
regularly update national [...] programmes containing
measures to mitigate climate change [...].(UNFCCC
Art. 4.1b) Internationally supported NAMAs will be
measured, reported and verified (MRVed) domestically
and will be subject to international measurement,
reporting and verification (para 61 of decision 1/CP.16).
Type of actions Projects (eg BRT) and programmes of activities (PoA) Policies, programmes and projects (eg sustainable
transport policy).
Initiator of activity Private sector
Companies identify and implement projects.
Government
National government, possibly in collaboration with
regional or local authorities, initiate activities.
Return on
investment
Certificates (CERs)
Certified Emission Reductions (CERs) are issued by the
CDM Executive Board based on verification reports.
CERs can be traded on carbon markets.
Financial and technical support: Developed country
Parties shall provide enhanced financial, technological
and capacity building support for the preparation and
implementation of NAMAs of developing country Parties
and for enhanced reporting by these Parties (para 52 of
decision 1/CP.16).
Preconditions Reductions in emissions must be additional to any
that would occur in the absence of the certified project
activity (KP Art. 12.5 c)
CDM to assist developing country Parties in achieving
sustainable development (KP Art. 12.2)
NAMA in the context of sustainable development,
aimed at achieving a deviation in emissions relative
to ‘business as usual’ emissions in 2020 (para 48 of
decision 1/CP.16)
Requirement Project supports sustainable development (proven
by governmental Letter of Approval)
Action is nationally appropriate (proven by
governmental registration under the UNFCCC)
Financing Upfront financing through private sector. Certificates
are issued ex-post based on regular verification reports.
CERs can be sold on a carbon market.
Domestic resources and/or international support
(e.g. through bi-lateral agreements, development banks
or multilateral funds, incl. Green Climate Fund) for the
preparation and implementation of NAMAs.
Administrative
requirements
Strong rulebook (Marrakech Accords) General guidelines yet to be developed under the
UNFCCC (paras 61 and 62 of decision 1/CP.16)
GHG reduction
potential
2005–2011:
500 MtCO2e
2012–2020 (15-30% against BAU):
more than 40 000 MtCO2e
SOURCE: [email protected]

9A GUIDE TO LOW-CARBON TRANSPORT 2011
Cities throughout the world face a mobility
challenge of increasing tra&c, chronic
congestion, air and noise pollution and
increased tra&c accidents – against a
background of climate change and the need to
reduce our carbon consumption.
The challenge for cities is to alter the balance of
priorities from motorised vehicles to more sustainable
and active modes.
The traditional approach to dealing with with
increased transport demand has been to provide
additional road space by means of new and expansive
road infrastructure. This approach has not delivered the
expected bene!ts, however, and a new approach to
tackling current transport problems is required.
Inspired by the principles of sustainability, an
alternative, low-carbon approach focuses on the
demand side. One new approach, known as A-S-I
(from Avoid/Reduce, Shift/Maintain, Improve), seeks to
achieve signi!cant GHG emission reductions, reduced
energy consumption and less congestion, with the !nal
objective to create more liveable cities.
Why low-carbon transport?
A low-carbon transportation infrastructure that follows
the principles of equitable, sustainable development
not only mitigates climate change but also realises the
following co-bene!ts:
increases energy security as less oil needs to be
imported. Resource con+icts can be avoided and
transport users won’t have to su&er fuel price
shocks
reduces tra*c congestion, and consequently air
pollution and noise are reduced, having a positive
impact on the environment and human health
reduces land demand by preventing urban
sprawl and preferring semi-dense mixed-use
neighbourhoods
provides visibility and acknowledgement of cities
that demonstrate leadership: sustainable and
modern low-carbon transportation systems >
WHAT IS SUSTAINABLE, LOW-CARBON
TRANSPORTATION?
‘Sustainability is a condition in which economic, social
and environmental factors are optimised, taking into
account indirect and long-term impacts. It balances
economic, social and environmental objectives.
Sustainability emphasises the integrated nature of
human activities and therefore the need for coordinated
planning among di"erent sectors, groups and
jurisdictions. This expands the objectives, impacts and
options considered in a planning process. It helps insure
that individual, short-term decisions are consistent with
strategic, long-term goals.
‘Sustainable transport planning recognises that
transport decisions a"ect people in many ways, so a
variety of objectives and impacts should be considered
in the planning process.
‘True sustainability is not just environmental
sustainability. For example, a transportation system
would not be truly sustainable if it could not be
maintained over the long run, if it did not adequately
support economic activity, or if it were unfair and
harmful to disadvantaged people.’
Todd Litman – Victoria Transport Policy Institute (www.vtpi.org)
Avoid/reduce travel demand
Shift to more economic and
environmentally friendly,
high-occupancy modes of transport
Improve e$ciency with technological
measures
A GUIDE TO LOW-CARBON TRANSPORT 201110
increases the competitiveness and attractiveness
of cities and attracts top companies, highly
quali!ed workers and employees into the country
depending on future climate change agreements,
– cities and countries that achieve mitigation
beyond baseline scenarios gain access to emission
certi!cates and carbon related funding schemes
convenient and high-quality public transport
and non-motorised transport infrastructure save
money and time.
What is low-carbon transport?
Elements of a low carbon transport system include:
dense but green and mixed use cities that allow
jobs, shopping and leisure facilities close to where
people live
modern, high-quality links between the centres
and good integration of long-distance hubs with
local transport
high-quality alternatives to individual car use,
especially e*cient public transport and good
non-motorised transport infrastructure and its
proper integration
e*cient, inter-modal freight transport and smart
urban logistics that also include clean vehicles
advanced technologies such as electric/gasoline
hybrid engines, alternative fuels or even electric
motorbikes and cars.
SOURCES: DEUTSCHE GESELLSCHAFT FÜR TECHNISCHE
ZUSAMMENARBEIT (GTZ), WATER ENERGY, TRANSPORT SECTOR
PROJECT TRANSPORT POLICY ADVISORY SERVICES
The European Council of Ministers of Transport
(ECMT) de!nes a sustainable transport system as
one that:
allows the basic access and development
needs of individuals, companies and society to
be met safely and in a manner consistent with
human and ecosystem health, and promotes
equity within and between successive
generations
is a&ordable, operates fairly and e*ciently,
o&ers a choice of transport mode and supports
a competitive economy, as well as balanced
regional development
limits emissions and waste within the planet’s
ability to absorb them, uses renewable
resources at or below their rates of generation,
and uses non-renewable resources at or
below the rates of development of renewable
substitutes, while minimizing the impact on the
use of land and the generation of noise.
In the South African context, we have a lack of
transport and therefore sustainable transport should
also:
provide a means for citizens to access social
and economic opportunities in a manner that
is cognizant of limited resources, including
energy, !nance and space
use the appropriate mode for each situation
be seen as an ultimate goal to which we need
to move, ‘greening’ transport along the way,
but simultaneously our lack of public transport
can allow us to ‘leapfrog’ to new and better
technologies and systems.
SUSTAINABLE TRANSPORT WORKSHOP, GREENING THE SOUTH AFRICAN ECONOMY, NOVEMBER 2010
‘There’s a problem with saying we need a
bit more walking, a bit more cycling, and bit
more rail, if at the end of the day we have a
broadly unsustainable system. High levels of
cycling, for example, will not solve all these
environmental problems if other things stay
the same.
‘In Europe, the problem is not that people are
driving where once they would have been
using public transport. The problem is that we
are travelling so much more, and most of this
is by motorised transport, by burning petrol.
It’s a systemic issue, and built into everyday
lives, so there is no easy consumerist solution,
unfortunately.’
Rachel Aldred – Sustainable Mobilities Research
Group, University of East London (UK)

11A GUIDE TO LOW-CARBON TRANSPORT 2011
In South Africa, increased use of public
transport would not only mitigate climate
change but would also grow the economy and
provide a signi#cant number of jobs, according
to South African Transport and Allied Workers
Union’s (SATAWU)’s Transport and Climate Jobs
research programme.
‘At the moment in South Africa, one third of people
travel to work go by private car,’ says Jane Barrett,
Satawu’s policy research o*cer. ‘If public transport
provision were to be radically increased, large numbers
of jobs could be created in manufacturing (vehicles),
construction (infrastructure), and in operations. If
improved public transport could result in attracting
only 10% of car commuters onto public transport, an
additional 1.5 million people would become public
transport users.’
Attract commuters to public transport and create jobs
If 200 000 more people caught taxis, this would mean
an increase of 1.8% on current passenger numbers. This
would require an additional 4 500 more taxi workers.
If 500 000 more people caught buses to work
and education, this would mean an increase of 14%
on current passenger numbers. This in turn would
translate into the need for an additional 3 500 buses
and 7 000 more workers in bus operations.
If 800 000 more people caught Metrorail trains, this
would mean a 28% increase in the current 2.8 million >
GROWING PUBLIC TRANSPORT
IS A JOB CREATION PRIORITY

A GUIDE TO LOW-CARBON TRANSPORT 201112
people who catch trains. An additional 113 train sets
would be required over and above the current 403
train sets in service. (This does not take into account
the additional train sets that are required to ease
current overcrowding.) The current Metrorail sta& of
8 500 would have to increase by 2 380.
In sum, if 10% of car commuters (1.5 million people)
could be attracted to public transport, and those
numbers were distributed between taxis, buses and
trains in such a way that progressively favours the mass
modes, then 13 880 direct transport operational jobs
would be created.
The ratio of direct to indirect jobs in the bus
industry is said to be 1:58. An increase of 500 000 bus
passengers could therefore translate into an additional
35 000 indirect jobs. These indirect jobs are in vehicle
maintenance and part supply, as well as in bus building.
‘If I make a conservative estimate of a ratio of 1:3 for
the taxi and rail industries, then the taxi industry would
produce 13 500 additional indirect jobs and rail would
produce 7 140 additional indirect jobs,’ says Barrett.
‘That is 69 420 new jobs if we increase public
transport usage by 1, 5 million people – excluding
additional jobs that would be created in expanding
and improving the public transport infrastructure to
accommodate expanded public transport.’
Cycling out of climate change
If the current cycling population could be increased
by just 10%, that would mean 40 000 additional
bicycles on South Africa’s roads. This, too, would create
additional employment. The building of cycling lanes
for all communities as part of road infrastructure is
therefore a signi!cant job creator.
A massive increase in bicycle use could also
facilitate a myriad of other economic activities,
including informal cycle rentals, bicycle maintenance
enterprises, bicycle taxis (three wheelers, or the bicycle
towing a small cart), and even ambulances.
TRANSPORT AND CLIMATE JOBS; SATAWU RESEARCH
PAPER, AS A CONTRIBUTION TO THE MILLION CLIMATE
JOBS CAMPAIGN; JANE BARRETT, POLICY RESEARCH
OFFICER, SATAWU
13A GUIDE TO LOW-CARBON TRANSPORT 2011
South Africa as the host country to COP17 has
a unique opportunity to trigger movement
in the climate policy arena. The South African
Ministry of Transport and transport advocacy
groups should be able to use the momentum created
by the meeting to promote sustainable transport
policies as mitigation and adaptation to climate
change and leverage funds for low carbon projects.
South Africa also has opportunities to showcase model
low-carbon transport infrastructure projects that have
developed during the last few years.
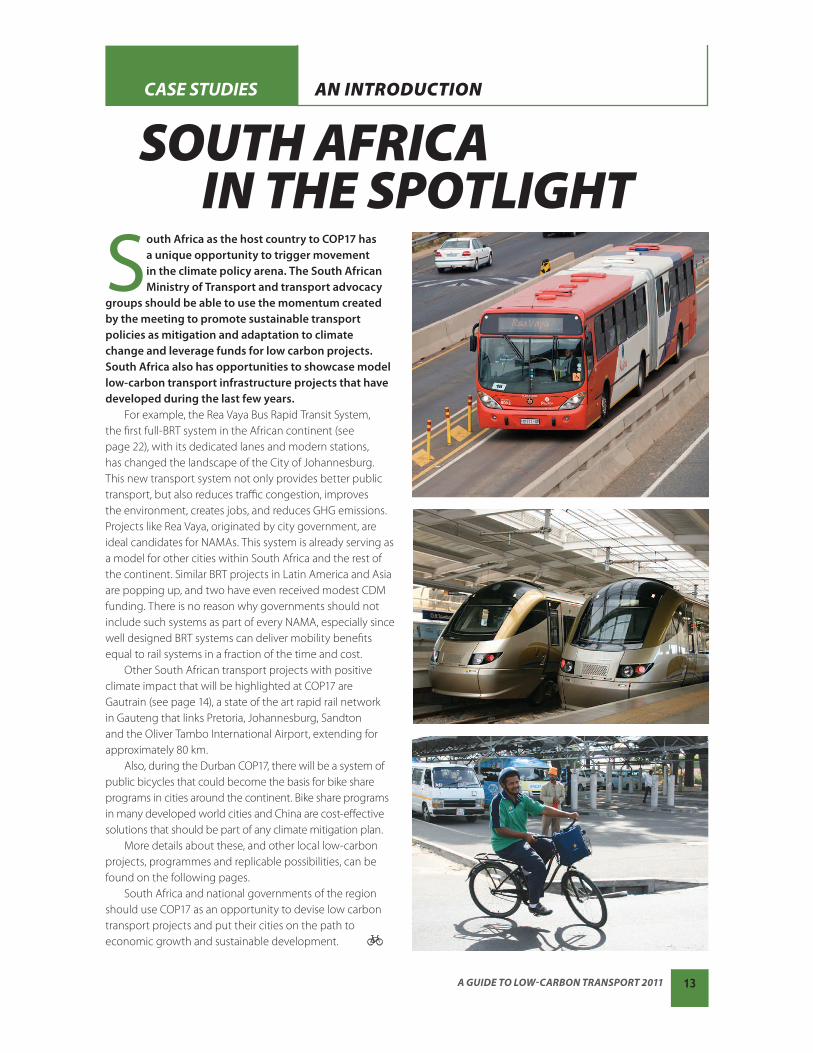
For example, the Rea Vaya Bus Rapid Transit System,
the !rst full-BRT system in the African continent (see
page 22), with its dedicated lanes and modern stations,
has changed the landscape of the City of Johannesburg.
This new transport system not only provides better public
transport, but also reduces tra*c congestion, improves
the environment, creates jobs, and reduces GHG emissions.
Projects like Rea Vaya, originated by city government, are
ideal candidates for NAMAs. This system is already serving as
a model for other cities within South Africa and the rest of
the continent. Similar BRT projects in Latin America and Asia
are popping up, and two have even received modest CDM
funding. There is no reason why governments should not
include such systems as part of every NAMA, especially since
well designed BRT systems can deliver mobility bene!ts
equal to rail systems in a fraction of the time and cost.
Other South African transport projects with positive
climate impact that will be highlighted at COP17 are
Gautrain (see page 14), a state of the art rapid rail network
in Gauteng that links Pretoria, Johannesburg, Sandton
and the Oliver Tambo International Airport, extending for
approximately 80 km.
Also, during the Durban COP17, there will be a system of
public bicycles that could become the basis for bike share
programs in cities around the continent. Bike share programs
in many developed world cities and China are cost-e&ective
solutions that should be part of any climate mitigation plan.
More details about these, and other local low-carbon
projects, programmes and replicable possibilities, can be
found on the following pages.
South Africa and national governments of the region
should use COP17 as an opportunity to devise low carbon
transport projects and put their cities on the path to
economic growth and sustainable development.
CASE STUDIES AN INTRODUCTION
SOUTH AFRICA IN THE SPOTLIGHT

A GUIDE TO LOW-CARBON TRANSPORT 201114
Gauteng Province makes up only 1.4% of
South Africa’s land area, but produces
of 40% of the country’s GDP; 65% of
the money generated in South Africa
is generated here. In an economic hub such as
this, mobility and access have always been – and
perhaps always will be – a challenge, says Gautrain
CEO Jack van der Merwe. In Gauteng today, there
are 6 million passenger trips a day, with vehicle
occupancies a mere 1.1.
The Rapid Rail project was conceptualised in 1999,
and announced in 2000; construction began in 2006.
In the !rst !ve months since its launch, in June 2010,
1.2-million people have travelled on the high-speed
train – of which more-or-less half were airport commuters.
Within its !rst month, during the FIFA World Cup,
the number of passengers was almost three times that
of the projected !gure: that’s about 80 000 commuters
each week.
The 80 km route, from Sandton to Hat!eld in
Pretoria, began operating in mid-2011. The train runs
every 12 minutes during peak, and every 20 minutes
o&-peak. Over the weekends it runs every 30 minutes.
‘Our prediction was that we would pull in 100 000
passenger trips a day, and that would have meant a
reduction of 15 000 tonnes of CO2 emissions a year, says
van der Merwe. ‘Today we have only 40 000 passenger
CASE STUDY 1
GAUTRAIN RAPID RAIL LINK
What Gautrain has 24 train units (96 rail cars), 125 feeder buses, 10 000 parking bays
80 km route between Pretoria (Tshwane) and Sandton (Johannesburg), with nine stations
OR Tambo International Airport; Pretoria; Rosebank; Sandton; Marlboro; Midrand;
Centurion; Hat#eld; and Rhodes#eld (Kempton Park)
To ease congestion on Gauteng highways, stimulate economic growth and job creation in
Gauteng, promote public transport, tourism and public-private partnerships, change the
culture of public transport use in South Africa
Announced in February 2000, launched June 2010 (ORT to Sandton), and the remaining
routes July 011
Public-Private Partnership between Bombela Consortium and Gauteng Provincial
Government
R25.2 billion
Where
Why
When
Who
Cost
Our prediction was that we would pull in 100 000 passenger trips a day, and that would have meant a reduction of 15 000 tonnes of CO
2
emissions a year. – Gautrain CEO, Jack van der Merwe
MASS TRANSIT
15A GUIDE TO LOW-CARBON TRANSPORT 2011
trips, but the current service has only been running for
6 weeks [at the time of interview, September 2011), so
it is early days to say.’ The link to Park Station, in central
Johannesburg, is also not yet operational.
‘Public transport is a carrot and a stick,’ he says.
‘The stick is congestion. But some of the “stick” has
been taken away, with the South African Roads
Agency’s Gauteng Freeway Improvement that has
gone and created eight more years of road capacity,’
says van der Merwe.
‘But the stick will come back, once the technical
challenges with the tolling system are resolved,’ he
notes. And the date for the implementing of road
tolling has been set, with perhaps a hint of irony, for
1 April 2012.
Gautrain is re-thinking its feeder bus system, which
has attracted fewer riders than anticipated. The system
had been based on the system so e&ective in Zurich.
‘There is no map, and you’ll never walk more than 1 km
without seeing public transport,’ says van der Merwe.
‘There are also no timetables, the simple point that
every ten minutes there will be a bus. So you could end
up with a grid of empty buses.’
‘We decided to do the same, to have a grid system,
but have subsequently taken the o&-peak buses out of
service.’ More than 9 000 passengers use the buses at
present.
Next on the cards is an integrated ticketing and fare
system, with synchronised timetables and schedules,
among other public transport services in Gauteng.
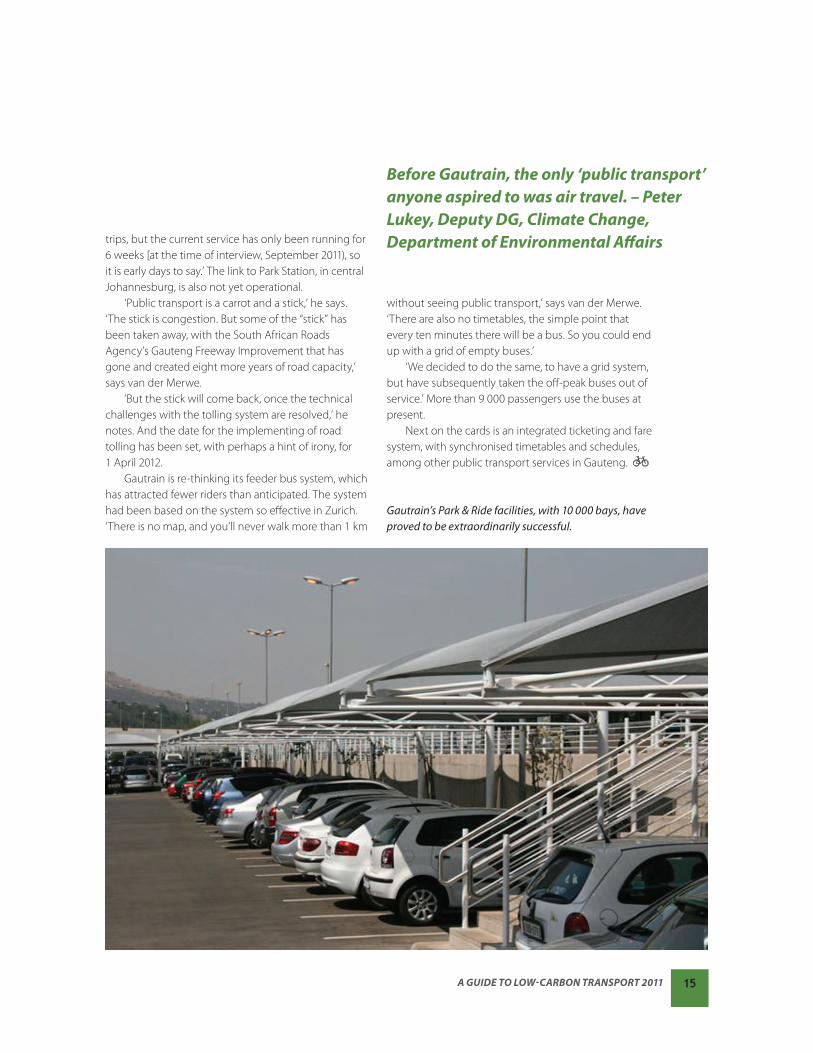
Gautrain’s Park & Ride facilities, with 10 000 bays, have
proved to be extraordinarily successful.
Before Gautrain, the only ‘public transport’
anyone aspired to was air travel. – Peter
Lukey, Deputy DG, Climate Change,
Department of Environmental A%airs
A GUIDE TO LOW-CARBON TRANSPORT 201116
CASE STUDY 2
BRIDGING THE GAP BETWEEN TRANSPORT AND CLIMATE POLICY
ADVOCACY AND POLICY DEVELOPMENT
In order to better integrate land transport into
the international climate negotiation process,
the Bridging the Gap initiative (BtG) was formed
in 2008 by a group of organisations that now
includes the German Agency for International
Cooperation (GIZ), the International Association
for Public Transport (UITP), the Transport Research
Laboratory (TRL), Veolia/Transdev and the Institute
for Transportation and Development Policy (ITDP).
This international initiative has raised the pro!le
of mobility and urban and land transport within the
UNFCCC negotiations, and has advocated an increase
in !nance for low carbon transport, particularly within
the developing world. The BtG initiative conducts
a number of complementary activities around the
di&erent UNFCCC meetings, o&ering workshops, side
events and exhibit stands. It also publishes a number
of reports and policy papers to inform country
delegations at the meetings and through its website
www.transport2012.org .
In its quest for better integration of land transport
initiatives into the negotiation process, BtG’s agenda
focuses on the acknowledgment of the sector’s role in
relation to key areas of the climate negotiations.
Mitigation
Recognise the transport sector’s importance in
mitigation e&orts, with a current focus on the potential
for transport NAMAs. Countries should consider
strategies to promote low-carbon land transport, and
these should include policies such as fuel/vehicle
e*ciency standards, public transport improvements,
parking management and regulations, vehicle
registration programs and congestion charging.
They should also develop transport speci!c data
collection processes and methodologies to support
the Measurement, Reporting and Veri!cation (MRV)
requirements for NAMAs and other sources of climate
!nance.
Adaptation
Integrate the land transport sector in adaptation
planning e&orts, such as improving the capacity of
developing countries to assess risk and vulnerability
of transport infrastructure. Climate resilient transport
networks are as important in the developed world as in
the developing one.
Finance
Consider the various options for !nancing mitigation
actions in land transport through the funds provided
under the UNFCCC. BtG has also developed a proposal
for a sectoral approach that could be !nanced through
a transport funding window under the Green Climate
Fund (GCF). The proposal REST (Reducing Emissions
through Sustainable Transport) suggests a way in
which the large mitigation potential of the land
transport sector could be realised through earmarked
support for sustainable transport.
Technology
Promote recognition of the wide potential for the
transfer of technologies in the land transport sector.
The available technologies are wide-ranging and
include mass rapid transit systems (ie Bus Rapid Transit
– BRT) and non-motorised transport solutions (ie bike
share programmes), as well as energy e*ciency vehicle
technologies.
Equally important will be the ongoing work with
country delegations, local and regional governments,
and national transport advocacy groups to formulate
and support comprehensive national mobility
plans that could be part of transport sector NAMAs
and opportunities for bilateral !nance mitigation
agreements. We hope that COP17 will be a turning
point for inclusion of the transport sector in the
UNFCCC GHG reduction and !nance mechanisms.
The BtG Initiative plans to be active in
Durban, as it has been in the last three COPs.
Look out for its side event highlighting its work
on transport NAMAs.
They
T
Du
Look
17A GUIDE TO LOW-CARBON TRANSPORT 2011
CASE STUDY 3 ADVOCACY AND POLICY DEVELOPMENT
Better transport systems in the developing
countries are needed to provide better
access to jobs, markets, schools and
health care. But an increase in motor
vehicles will not only cause an increase in GHG
emissions transport in developing countries,
but also cause congestion and contribute to air
pollution, road crashes and a general decrease
in the quality of life in many of the cities in
developing countries.
‘Yet when it comes sustainability, it appears that
transport is still involved in a catching up game with
the energy sector,’ says Cornie Huizenga, a convenor of
the Partnership on Sustainable, Low Carbon Transport
(SLoCaT). ‘This catching up appears to be a wider problem
and one not limited to the development banks.’
‘Why is it a problem that the energy sector is in
the limelight and transport in the shadows,’ he asks?
‘Perhaps because developing countries feel that they
need to focus their attention (sta& and budget) on the
energy sector, rather than the transport sector, because
of the possibilities to link up with the international
initiatives on sustainable energy. And also because of
its perceived leadership role, the energy sector !nds
it more easy to attract external !nancial resources,
including from the private sector, for co-!nancing of
energy programs and projects.
SLoCaT is a membership-based organisation
that aims to mobilise global support to reduce
the growth of GHG emissions generated by land
transport in developing countries by promoting more
sustainable, low carbon transport. It works to improve
the knowledge on sustainable low carbon transport,
helps develop better policies and catalyse their
implementation, in Asia, Latin America and Africa.
‘We can see that good gains have been made in
catching up with the energy sector through bringing
together stakeholders on transport and sustainability,’
says Huizenga.
‘But when I read the recent announcement that
readers from global corporations, !nancial institutions,
and foundations will join with UN agencies and member
states to produce a comprehensive and concrete
sustainable energy action agenda leading up to the
Rio+20 conference next year, I feel that the energy sector
is pulling away again from the transport sector.’
‘If we would have something similar for the
transport sector then it would help in getting a better
seat at the table when it comes to de!ning the role of
transport in a post-2012 climate regime and associated
new climate change !nancing modalities. Having a
similar internationally agreed upon set of goals for
sustainable transport could also greatly facilitate
the policy dialogue with developing countries on
sustainable transport and subsequent prioritisation of
sustainable transport in policy development, capacity
building and budget allocation.’
‘Transport is in many countries the most important,
or second important, economic sector, but lacks both
a formal global coordination mechanism and agreed
upon global strategy for sustainable transport.’
PARTNERSHIP ON SUSTAINABLE LOW CARBON
TRANSPORT
‘Internationally agreed goals for sustainable
transport could greatly facilitate the policy
dialogue with developing countries on sustainable
transport and subsequent prioritisation of
sustainable transport in policy development and
budget allocations’
Support the strengthening of global action on sustainable transport.
The transport sector needs to overtake
the energy sector in becoming a leader
in sustainability – Cornie Huizenga,
convenor, SLoCaT

A GUIDE TO LOW-CARBON TRANSPORT 201118
CASE STUDY 4 TRAVEL DEMAND MANAGEMENT
PARK & RIDE
The City of Cape Town implemented Park
& Ride facilities in Cape Town after a
detailed investigation into Travel Demand
Management (TDM) in the city. The project
initially meant extension and upgrade of stations
with a focus on improving the 2010 World Cup,
but also as important legacy facilities after the
event. Due to the limited budget, 26 stations were
identi#ed throughout the metropolitan area.
In Cape Town, the main daily commute is towards
the central city, which is why the Park & Ride strategy
encouraged a modal shift for this destination in
particular. A shortlist of stations was selected by taking
into account the following:
distance from central city – as the advantages of
using more remote Park & Ride sites is greater
area coverage – to ensure a broad spatial impact
across the city
densi!cation corridors – to support the objectives
of this initiative
NMT (Non-Motorised Transport) network – to
maximise the mutual bene!t between these
initiatives
IRT (Integrated Rapid Transit) network – to maximise
the bene!t to the public transport system.
This project was only able to in+uence the perception
of unsafe and unattractive stations, where cars are
vandalised, by addressing the actual safety at and
attractiveness of stations. Since the potential market
for Park & Ride users are typically not averse to parking
at shopping centres, station parking aimed to emulate
these facilities, characterised by:
high quality surfacing
good lighting
good road marking guidance
What Rail-based Park & Ride facilities
26 railway stations in Cape Town
Attract a higher proportion of the car-driving market to rail, largely through improving
the safety, security and general attractiveness of station parking, through landscaping,
urban design features, security sta", and lighting
City of Cape Town, with partial funding from the GEF for the design of the facilities
R47 million for the extension and upgrade of stations
Between a 5–14% increase at all stations, with the largest increase at Kuils River and
Kraaifontein stations
Where
Why
Who
Cost
Impact
The goal of TDM is getting people out
of their cars and into public transport.
It’s an ambitious goal for one project,
but the smaller projects all add up. –
Gerhard Hitge, City of Cape Town

19A GUIDE TO LOW-CARBON TRANSPORT 2011
Out of the whole public transport
trip, we could only in&uence the
safety and aesthetics of access to the
station, only a minor part of the trip
chain. We do not control quality of
the rail. Yet even an improvement to
these two small components seems
to have made a signi#cant impact. –
Gerhard Hitge, City of Cape Town
The City of Cape Town’s Travel Demand
Management (TDM) strategy includes:
promoting higher private vehicle occupancies
implementing Park & Ride facilities
travel planning for large employers
marketing TDM and public transport
developing supporting policies and tax
incentives
exploring a congestion pricing scheme.
adequate road signs
short walk to sheltered destination
safety while walking to station
security of car while parked
cost-e&ective (mostly free).
‘Our follow-up research showed that there was a slight
increase in the use of parking at all the upgraded stations, but
a more signi!cant increase where there were big aesthetic
improvements’, says Hitge. ‘Typically, an engineering solution
is about function, so it was interesting to discover that urban
design could have a signi!cant impact, too. For example,
at Kraaifontein station, we !xed the tarmac (it was falling
to pieces), and we created a square with trees and other
landscaping, and added a de!ned pedestrian route, so users
no longer had to weave between parked vehicles.
‘These impacts cost less than we expected, so we were
able to e&ect minor upgrades at additional stations, too.’
Stations with Park & Ride facilities
Athlone, Belhar, Bellville, Brackenfell, Century City,
Claremont, De Grendel, Eerste River, Fish Hoek, Heath!eld,
Kraaifontein, Kuils River, Lansdowne, Mitchell’s Plain,
Monte Vista, Muizenberg, Nonqubela, Oosterzee, Ottery,
Pentech, Retreat, Simon’s Town, Somerset West, Steenberg,
Steurhof, Strand.

A GUIDE TO LOW-CARBON TRANSPORT 201120
CASE STUDY 5 CYCLING MOBILITY
CALCULATING THE CARBON VALUE OF CYCLING
What Development of a methodology to allow the attribution of a climate value to cycling
Developed by Interface for Cycling Expertise (I-CE), Netherlands
The challenge with assessing the carbon impact of cycling is that cycling has an intrinsic
zero-emission value, making it di&cult to attribute (direct) carbon bene#ts. This limits
opportunities for low-carbon #nancing
Application of the methodology to the case of Bogotá, Colombia — a city with a current
bicycle modal share of 3.3% on a total of 10 million daily trips — results in a climate
value of cycling of 55 115 tonnes of CO2 per year, corresponding to an economic value of
between 1 and 7 million US dollars when traded on the carbon market
WhoWhy
Climate impact
Particularly in developing countries,
economic resources often limit
opportunities for implementing high-
cost vehicle improvement technologies,
which suggests that investments in programmes
avoiding CO2 emissions, such as NMT projects, may
be more suitable and feasible.
Besides directly reducing emissions through
modal shift, these projects may also have substantial
co-bene!ts, such as public health and tra*c safety
bene!ts. Non-motorised transportation, particularly
cycling, has great potential because it is a cheap mode
of transportation and can be used by even the poorest;
the investment costs for infrastructure are much
lower than for private motorised tra*c infrastructure,
in dense and congested urban areas the bicycle is as
time-e&ective as motorised tra*c, and, of course, it is a
zero-emission transportation mode.
In the context of the climate change debate, the
‘opportunity costs’ of a bicycle trip are the additional
CO2 emissions that are generated when the traveller
selects an alternative, motorised transportation
mode for his or her bicycle trip. In terms of avoided
CO2 emissions, therefore, cycling provides signi!cant
‘opportunity bene!ts’.
The problem with assessing the carbon impact of
cycling, however, is that cycling has an intrinsic zero-
emission value, making it di*cult to attribute (direct)
carbon bene!ts.
In economics, the concept of opportunity costs
is commonly used to value goods or services which
are di*cult to valuate. For the evaluation of the
external e&ects of CO2 emissions of transportation,
opportunity costs are often referred to as avoidance
costs. Consider the climate e&ects of a person who
can make his daily trip to the market by bicycle or
car. Suppose the person chooses to go by bicycle.
Based on the principle of opportunity costs, the
avoidance costs of using the bicycle for this trip are:
the avoidance costs of the bicycle trip itself, minus the
avoidance costs in case of the alternative action, ie
using his alternative mode, the car.
The bicycle has always been positioned
and used as the icon for sustainable
climate policies but until very recently
not as contributor to emission
reduction targets. – Cornie Huizenga,
SLoCat

21A GUIDE TO LOW-CARBON TRANSPORT 2011
The avoidance cost of the bicycle trip is zero but
the avoidance cost of the car trip is the volume of
CO2 emitted during the trip, leading to a negative net
environmental cost. The use of the bicycle for the trip
thus has an ‘opportunity bene!t’.
The climate value of cycling represents the total
amount of avoided CO2 emissions by all bicycle trips,
which is the summation of opportunity costs of each
bicycle trip in the study area. The climate value of
cycling is calculated based on a prediction of the most
likely alternative (substitution) mode for each bicycle
trip and the calculation of the additional CO2 emissions
for that trip by the alternative mode.
The fact that the climate value of cycling is higher
in places with large motorisation rates indicates the
importance of cycling mobility as a CO2 emission
mitigation strategy in developed cities. However, even
though developing cities have smaller marginal climate
values of cycling, it is expected that many of the
developing cities of today will be the developed cities
of tomorrow. For example, in Beijing the cycling modal
share has decreased from 38.5% in 2000 to 23% in 2007,
while the car modal split has increased from 26.5% to
32.6% in the same years.
When citizens from lower socio-economic strata
improve their economic status they will also change
their mobility preferences. In the absence of decent
bicycle facilities, it is more likely that private motorised
transportation will be used. Guidance in the form
of investment in bicycle facilities is therefore of vital
importance in creating a sustainable transport future.
The climate value of a cycling model can assist in
estimating the bene!ts of cycling and thus, appraise
the carbon impacts of cycling.
THE FULL PAPER CAN BE FOUND AT: ROEL MASSINK, MARK
ZUIDGEEST, JAAP RIJNSBURGER, OLGA L. SARMIENTO AND
MARTIN VAN MAARSEVEEN (2011) THE CLIMATE VALUE OF
CYCLING, NATURAL RESOURCES FORUM (UNITED NATIONS)
PHOTOGRAPHS BY BICYCLE PORTRAITS,
WWW.DAYONEPUBLICATIONS.COM

A GUIDE TO LOW-CARBON TRANSPORT 201122
CASE STUDY 6 BUS RAPID TRANSIT
REA VAYA ‘WE ARE GOING’
What Phase 1A (complete) launched in September 2009. It includes 143 Euro 1V buses, 25.5 km
of trunk route, three complementary and #ve feeder routes using 13 m buses, 27 stations
with average of 40 000 passengers per day. Phase 1B is under construction with 134 Euro
IV buses, 18 km of trunk route, 2 trunk routes, 3 complementary and 7 new feeder routes
and 16 new stations
The trunk route runs between Soweto and Johannesburg CBD
Reduce poor air quality in Johannesburg; alleviate tra&c congestion; reduce number of
trips and travel time and therefore reduce vehicle emissions; restructure spatial form of
the city
Place people within 500 m of trunk or feeder route, and provide a quality, a"ordable
public transport system for Johannesburg
A current 1.1 million passengers a month; Rea Vaya is a partnership between the City
of Johannesburg and members of a"ected public transport operators (through bus
operating company Piotrans Pty Ltd)
Phase 1A, R1.9-billion; Phase 1B, estimated R1.8-billion. GEF funding was used for legal
services, marketing and communications, assistance to the minibus taxi industry and
evaluation of the system
6 840 short-term positions and 830 permanent jobs; as station ambassadors, station
marshals and cashiers; security and cleaning of Phase 1A stations; and as drivers,
dispatchers, controllers, bus washers and administration assistants.
Estimation of overall emission reductions is 398 292 tCO2e for Phase 1A and 1B (not full
Phase 1) over the 10 year period up to 2021, through mode switching; and improved
fuel-use e&ciency through new and larger Euro IV buses
Where
Why
Overall goal
Economic impact
Who
Carbon impact
Cost
I grab Rea Vaya just close to my
house and I think it is peaceful, cheap
and comfortable. Once we didn’t have
a choice because there was no other
means of transport. Now that we have
Rea Vaya, I am happy. – John Masuku,
street trader

23A GUIDE TO LOW-CARBON TRANSPORT 2011
Rea Vaya launched its Clean Development
Mechanism (CDM) Project Idea Note
(see page 6) in October 2008; its Project
Document is complete and has been
validated by UNFCCC panel validators. However,
due to ‘prior consideration requirements’ not
being met for Phase 1A and 1B, the project will
be registered on the voluntary market (see right)
instead. Prior consideration requirements were
not met because when the #rst construction
contracts for Rea Vaya were signed in 2007, the
project had not formally indicated to UNFCCC
that it would be relying on carbon funding for
the project.
In order to calculate the carbon impact of the
project, total baseline emissions were determined
based on the mode of transport BRT passengers
would have chosen in the absence of the project,
and their respective emission factors. These included
public transport buses, minibus-taxis (capacity of 16
passengers), passenger cars, suburban rail, and walking
or cycling. Motorcycles and metered taxis were not
included as the expected mode shift from these
modes of transit was considered to be marginal.
Relevant fuel types for each vehicle category were
also established. GHG emissions per kilometre were
calculated and !xed for the project crediting period. Other
relevant data included occupation rate and trip distances.
Project emissions are based on the fuel consumed
by the buses of the project (trunk, feeder and
complementary buses).
Rea Vaya also reduces the number of remaining
buses – and, potentially, other vehicles – on the road
formerly used for mixed tra*c, thereby also reducing
congestion. Congestion change occurs on the road
where the new trunk lane operates and which was
formerly used by mixed tra*c.
Reduced congestion has the following impacts
relevant for GHG emissions:
‘rebound e&ect’ leading to additional trips and
thus higher emissions
higher average speeds and less stop-and-go
tra*c leading to lower emissions.
There are two markets for carbon o"sets. In the larger,
compliance market, companies, governments, or other
entities buy carbon o"sets in order to comply with
caps on the total amount of carbon dioxide they are
allowed to emit. This market exists in order to achieve
compliance with obligations of Annex 1 Parties under
the Kyoto Protocol, and of liable entities under the EU
Emissions Trading Scheme. In 2006, about $5.5 billion
of carbon o"sets were purchased in the compliance
market, representing about 1.6 billion metric tonnes of
CO2e reductions.
In the much smaller, voluntary market, individuals,
companies or governments buy carbon o"sets to
mitigate their own greenhouse gas emissions from
transport, electricity use, and other sources. For
example, someone might buy carbon o"sets to
compensate for the greenhouse gas emissions caused
by personal air travel.
I work in Joburg CBD and I really thank the
government for this Rea Vaya thing. From
my personal experience, it truly made a
di%erence in my life. – Selinah Ndlovu, shop
assistant in Soweto
A GUIDE TO LOW-CARBON TRANSPORT 201124
South Africa is extremely vulnerable to the
impacts of climate change, with water
shortages, diseases, food security and
other challenges. The most vulnerable
people are also those who are most at risk to the
impacts of climate change.
Which is why WWF South Africa has begun to
design a Low Carbon Action Plan (LCAP), which looks
speci!cally at the way in which we make decisions
around carbon mitigation and adaptation.
‘At WWF we talk about a just transition to a low-
carbon future,’ says Louise Naudé, National Climate
Change O*cer, WWF South Africa. ‘The low-carbon part
is easy – obviously we have to cut out greenhouse gases
(GHG), and defend and repair our ecosystems. The “just”
part is that all of this is about poverty – in whose interests
are the choices about low-carbon development?’
‘In South Africa we don’t necessarily need the sexy
vehicles; we need to produce mobility services for the
majority of people who are hampered by the lack of
access. And making people more mobile is climate
mitigation in itself,’ she notes, as mobility enables
greater resilience.
In order to achieve the level of GHG cuts required
by science, and make e*cient decisions around low-
carbon development, WWF South Africa proposes a
national low-carbon budget – the overall quantity of
carbon emissions that South Africa can emit between
now and 2050 to develop its low-carbon infrastructure,
and transition to an in!nitely smaller ongoing annual
carbon budget post-2050.
A tonne of CO2 emitted by one sector at any point
in time implies one less tonne of CO2 available to be
emitted by that or any other sector now or in the
future – so it’s about looking at what activities produce
the most value per unit of emissions space occupied.’
‘It’s a trade-o&,’ says Naudé. ‘Who do we put at
the centre of the transition to a low carbon economy?
Within our limited resources, and to balance our carbon
budget, do we spend on freeways, or do we spend on
public transport, for example? In whose interests are
we spending the money? And what is the best “bang”
for our “carbon buck”?’
WWF South Africa has therefore begun the
collaborative and participative process of collecting
and collating transport information, and would
eventually like to develop a package of exemplar
transport NAMAs. In early 2012 the organisation
will work to model di&erent transport intervention
possibilities, and through stakeholder meetings will
formulate the questions and share the solutions. ‘Our
goal is to use the carbon budget framework and
facilitate key stakeholders collectively scoping iconic,
game-changing transport projects.’
CASE STUDY 7 ASSESSING PRIORITIES
WORKING WITHIN A CARBON BUDGET
What A framework around which to approach transport decision-making
A Low Carbon Action Plan o"ers a way in which to unpack the what, when and how of low-
carbon economy planning and implementation
WWF South Africa
Develop a package of transport NAMAs
Why
Who
Goal
Within our limited resources,
for example, and to balance our
carbon budget, do we spend on
freeways, or do we spend on public
transport? – Louise Naudé, WWF
South Africa
The WWF’s Living Planet Unit will be at
COP17, so ask their representatives how
you can become involved in their participative
planning process. What is the best deployment
of the limited emissions space left in which to
achieve South Africa’s development needs?
nation
The
CO

25A GUIDE TO LOW-CARBON TRANSPORT 2011
South Africa started investigating electric
vehicles (EVs) in the early 1970s (during the
#rst oil crisis) at the CSIR, where researchers
developed the current Li-Ion and ZEBRA
battery technology (now sold throughout the
world). But when the fuel crisis faded, so did the
interest in EVs. Interest was renewed in the 1980s,
#rst through the National Energy Council, then
Eskom and again in 2008 through SANERI (South
Africa’s National Energy Research Institute). In
2010, Blue IQ, through the Innovation Fund (a
Gauteng Province instrument), provided some seed
funding to a private company – GridCars, for the
development of a small EV commuter.
The Eskom programme delivered a number of electric
vehicles of all sizes – from e-bikes to a 20-seater game-
viewing vehicle. The Innovation Fund more recently
invested in the design and concept model of a !ve-seater,
!ve-door passenger car named the Joule (right).
There are no current EV pilot projects in South
Africa, though, largely due to lack of funding and
government backing for technology development.
Users have been slow to adopt EVs – although the
vehicles are growing in popularity internationally (below
right) – due to anxiety about range, and concerns about
battery technology cost (which makes the vehicle
expensive).
Yet EVs o&er signi!cant carbon mitigation
opportunities, says Carel Snyman, who has worked on
most of the above programmes.
‘A petrol car in city tra*c, with a fuel consumption of
10 litres per 100 km, adds 25 kg of CO2 per 100 km’, says
Snyman. ‘A diesel vehicle is only slightly more e*cient. An
electric vehicle would produce none of these emissions.’
When you include the carbon cost of the fuel-
producing industry in South Africa, this increases the
CO2 impact: the re!nery produces an additional 7 kg of
CO2 per 100 km, and SASOL (which produces 20% of all
fuels sold in South Africa) produces 50 kg per 100 km.
Calculating an average (SASOL and other fuels),
this means that a South African city car produces
approximately 45 kg of CO2 per 100 km travelled.
An electric vehicle of the same size – given the
contribution of coal-!red Eskom electricity – would
produce 39 kg per 100 km, although there are no
emissions produced in the city where the car is used;
these emissions occur at source, at the power station,
where emissions are easier to control.
But a small electric commuter (such as a shared-car
or three-wheeler) would produce only 13 kg per 100 km.
And due to its size and small battery requirements,
such a car could easily be powered by the sun.
‘And, of course, if you use solar energy, you’ll have
zero emissions,’ says Snyman.
CASE STUDY 8 TECHNOLOGY DEVELOPMENT
ELECTRIC VEHICLESWhat 100 % electric vehicles
Possibility of almost zero emissionsWhy
A South African city car produces 45 kg of
CO2 per 100 km traveled; a small EV has
the potential to produce zero emissions.
– Carel Snyman, GridCars
A GUIDE TO LOW-CARBON TRANSPORT 201126
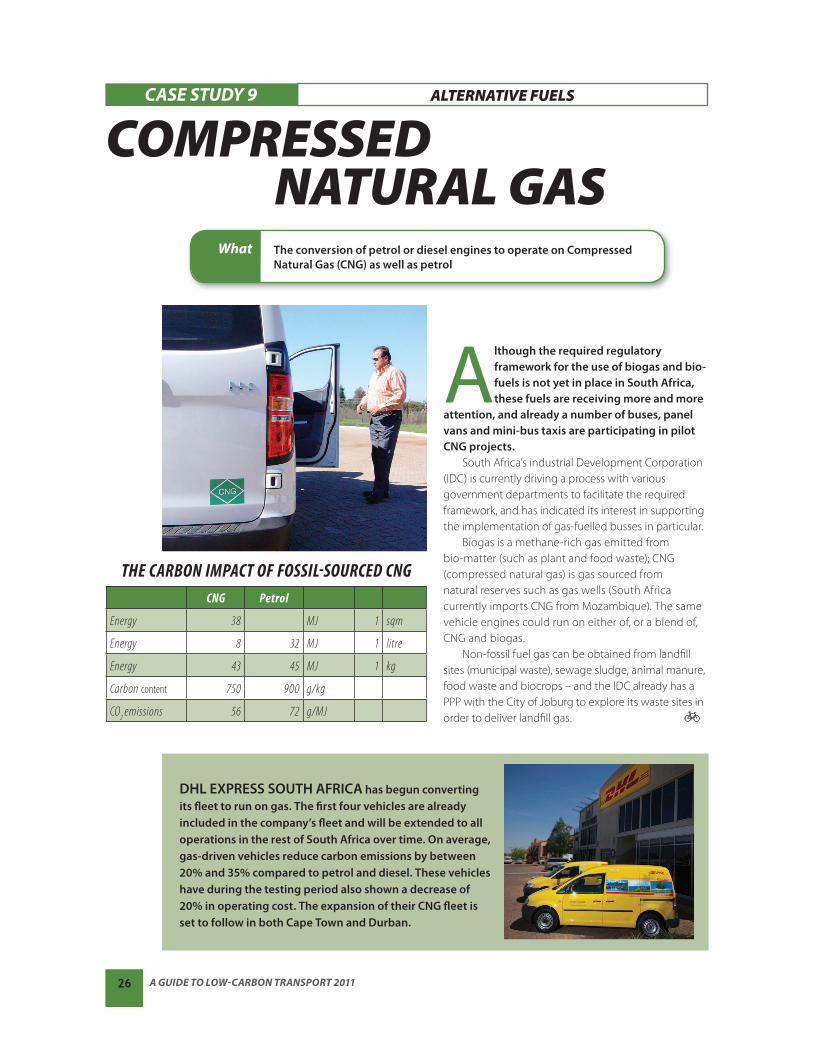
Although the required regulatory
framework for the use of biogas and bio-
fuels is not yet in place in South Africa,
these fuels are receiving more and more
attention, and already a number of buses, panel
vans and mini-bus taxis are participating in pilot
CNG projects.
South Africa’s industrial Development Corporation
(IDC) is currently driving a process with various
government departments to facilitate the required
framework, and has indicated its interest in supporting
the implementation of gas-fuelled busses in particular.
Biogas is a methane-rich gas emitted from
bio-matter (such as plant and food waste); CNG
(compressed natural gas) is gas sourced from
natural reserves such as gas wells (South Africa
currently imports CNG from Mozambique). The same
vehicle engines could run on either of, or a blend of,
CNG and biogas.
Non-fossil fuel gas can be obtained from land!ll
sites (municipal waste), sewage sludge, animal manure,
food waste and biocrops – and the IDC already has a
PPP with the City of Joburg to explore its waste sites in
order to deliver land!ll gas.
CASE STUDY 9 ALTERNATIVE FUELS
COMPRESSED NATURAL GAS
What The conversion of petrol or diesel engines to operate on Compressed
Natural Gas (CNG) as well as petrol
THE CARBON IMPACT OF FOSSIL-SOURCED CNG
CNG Petrol
Energy 38 MJ 1 sqm
Energy 8 32 MJ 1 litre
Energy 43 45 MJ 1 kg
Carbon content 750 900 g/kg
CO2
emissions 56 72 g/MJ
DHL EXPRESS SOUTH AFRICA has begun converting
its $eet to run on gas. The #rst four vehicles are already
included in the company’s $eet and will be extended to all
operations in the rest of South Africa over time. On average,
gas-driven vehicles reduce carbon emissions by between
20% and 35% compared to petrol and diesel. These vehicles
have during the testing period also shown a decrease of
20% in operating cost. The expansion of their CNG $eet is
set to follow in both Cape Town and Durban.

27A GUIDE TO LOW-CARBON TRANSPORT 2011
In South Africa, the challenges and costs of
road freight transport and road maintenance
continue to escalate. The country’s secondary
road system also continues to deteriorate
for lack of maintenance and because it, too, is
overburdened with heavy freight tra&c. The
required funding required to maintain and
upgrade these roads will be more profound and
the cost impact signi#cant.
And while it’s clear that a greater proportion
of freight needs to move to rail, the current carbon
impact of road freight needs to be considered.
Truck manufactures are constantly working on
reducing the amount of CO2 emissions produced by
their products, and South Africa is starting to see the
bene!ts of this with truck manufacturers introducing
Euro 3,4,5 engines into the local market.
In an attempt to reduce the carbon impact of its
transportation, South Africa Barloworld Logistics recently
decided to look at aerodynamics as a possible avenue
in reducing the amount of diesel used. The company
commissioned the CSIR to conduct research on the
in+uence of drag on a truck tractor and taut-liner link.
The result was a ‘green trailer’, an interlink taut liner
trailer combination that achieves signi!cant reductions
in the amount of fuel it uses. The trial rig has been
running on a dedicated route for a specially selected
customer for six months in order to con!rm the
quanti!able bene!ts of the trailer.
‘All the changes that we made to the green trailer are
within the bounds of current legislation,’ says Francois
van Rensburg, Divisional Director at Barloworld Logistics,
’and are practical in normal operating conditions.’
The research for the green trailer was conducted
on the N3 between Johannesburg and Durban. The
vehicles on this route do a round trip of 1 160 km on a
dedicated route every 24 hours and 98% of the route
is on the N3 and N2. This meant that the vehicles
maintained a much more constant speed compared to
vehicles operating on secondary roads or in urban areas.
This also meant that the e&ects of wind resistance were
higher than on any other route. The initial simulations
based on the green trailer research indicated a 35%
reduction in the total drag when travelling at a constant
speed between 70 and 80 km/h.
The rig travelled 100 000 km in the six-month
period, and saved 10.6% in fuel when compared to
the rest of the +eet running the same route, under the
same weather conditions and with the same payload.
This equates to an actual cost saving of R8 500 per
month just on fuel, and just on one rig! The total wind
drag reduction came in up to 43%.
The 10.6% fuel saving amounted to a reduction of
13.77 tonnes of CO2 emissions during the test period.
Says van Rensburg, ‘The payback period on
investment in the conversion is around 17 months.
Following this successful trial, we are in the process
of converting the rest of the +eet on the same route
running the same contract.’
CASE STUDY 10 VEHICLE DESIGN
‘GREEN TRAILER’ REDUCES DRAG
What An interlink, taut-liner ‘green trailer’
Barloworld Logistics
Up to 35% reduction in drag, up to 10,6% fuel savings
Reduction of 13.77 tonnes of CO2 emissions during six-month test period
Who
Fuel savings impactCarbon impact

A GUIDE TO LOW-CARBON TRANSPORT 201128
CASE STUDY 11 PROJECT GREENING
RUSTENBURGRAPID TRANSIT
Carbon mitigation: Cllr Shimane Seriteng and Executive
Mayor Mpho Khunou dig in to do the hard work of tree
planting at Boikagong Secondary School.
What Integrated Rapid Public Transport Network including a BRT, direct and feeder routes. A 40 km BRT route with two main trunk corridors between Phoekeng and central Rustenburg and Kanana and central Rustenburg; 37 stations proposed, with more than 500 other stops along direct and feeder routes.
Rustenburg, North West Province
To ease congestion on Rustenburg roads, stimulate economic growth and job creation in Rustenburg, reduce carbon emissions, encourage more e"ective settlement patterns, CBD regeneration and development along the RRT corridors; to create a better, more mobile city that is universally accessible.
Planning & Design 2011-12; Construction 2012-14; System operational in 2015
For an estimated 200 000 residents
Currently estimated at R3 billion
WhereWhy
WhenWho
Cost
When feasibility planning started in
2010 on the Rustenburg Integrated
Rapid Public Transport Network,
the technical team considered the
environment as a fundamental building block for
the kind of public transport system to be created.
This was triggered by two main factors – the #rst
being the more obvious need to contribute to
ensuring South Africa achieves its stated emissions
reduction target by 2020, and the second being
the rural setting of this Magaliesberg town.
The future Rustenburg Rapid Transport (RRT) system
will deliver a considerable carbon emissions reduction
by replacing an aging taxi +eet with a modern +eet
of buses – which comply not only with emissions
standards, but also look at alternative fuel sources.
In addition, the RRT project will develop not only
a public transport system, but also a Transport and
Climate Change Action Plan for Rustenburg. While
increasing the share of public transport and non-
motorised modes, such as walking and cycling, are core
elements in any emission reduction strategies, they
need to be supplemented by smart land use, better
tra*c management, a more balanced parking policy,
better information on travel choices, and increased
public awareness. The RRT project also intends
investigating alternative funding mechanisms, such as
Nationally Appropriate Mitigation Actions (NAMAs).
But apart from the system requirements, the RRT
project planning has gone one step further in ensuring
that in all aspects of the project planning, design and
implementation, the outlook is green.
Notes RRT Project Manager Pauline Froschauer:
‘We ensure that as far as possible all our printing is
on recycled paper, our IT solution is cloud based, our
architects and engineers have been briefed to seek out
environmentally friendly products and processes and
we even carbon-o&set our main stakeholder events
(such as with tree-planting) within the municipality.’
‘The focus on local suppliers and materials adds to
containing our carbon emissions, and as a team we are
always considering ways to work together remotely
and online. Obviously there are also the required
environmental impact studies which are being carried
out along the transport corridors where needed.’

29A GUIDE TO LOW-CARBON TRANSPORT 2011
In Mangaung a Global Environment
Facility (GEF) grant was used assist with
implementation of a pedestrian route through
the design of a pedestrian bridge crossing the
busy Markgraaf Street to safely link the pedestrian
and cycle route to the sporting, shopping and
employment areas.
This project of approximately 1.2 km links the
Free State Stadium and Loch Logan Waterfront
Shopping Mall with the bus and taxi rank adjacent to
the Central Railway Station. The project involved the
creation of one-way roads and the removal of on-street
parking. This roadspace, previously used by cars, was
replaced with pedestrian and cycle paths between 6 m
and 3 m wide. (Photo above right)
Polokwane Local Municipality has a high
proportion of captive public transport users, reliant on
buses, minibus taxis and walking as the main mode
of transport. With assistance from the GEF grant the
Municipality implemented 3.2 km of pedestrian and
bicycle paths with a 3.0 m lane width within the CBD.
These facilities also constituted the Fan Walk for 2010
FIFA World Cup linking the City Centre to the Peter
Mokaba Stadium. (Photo below right)
The Rustenburg NMT project included the
construction of 14.5 km of sidewalks, completed
and operational in time for the 2010 FIFA World
Cup. In addition to improving accessibility to the
Royal Bafokeng Stadium, these routes also directly
serve the main activity centres in Phokeng: the central
minibus taxi rank, the Phokeng Shopping Mall, the
Phokeng Civic Centre, two primary schools and one
middle school.
CASE STUDY 12 LIVEABLE CITIES
IMPROVED PEDESTRIAN FACILITIES
What Development of non-motorised transport infrastructure in three small to medium sized South African cities
Local Municipalities of Mangaung, Polokwane and Rustenburg
Partial funding from the GEF for design of the facilities and provision of implementation assistance
WhereWho
The sidewalks, the pavements, are the most important element in city
infrastructure – this is how to make a city better for human beings.
– Enrique Penalosa, former mayor of Botota and pioneer of BRT
This roadspace, previously used by cars,
was replaced with 6 m-wide pedestrian and
cycle paths.
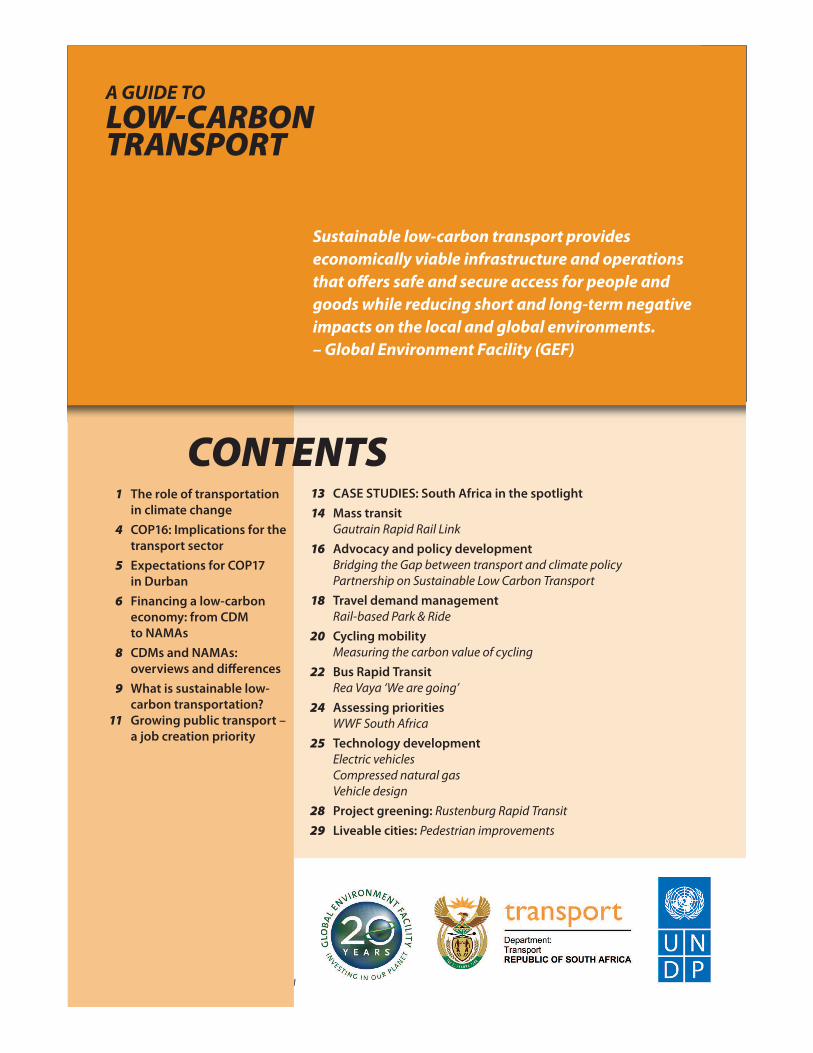
A GUIDE TO LOW-CARBON TRANSPORT 201130
1 The role of transportation
in climate change
4 COP16: Implications for the
transport sector
5 Expectations for COP17
in Durban
6 Financing a low-carbon
economy: from CDM
to NAMAs
8 CDMs and NAMAs:
overviews and di"erences
9 What is sustainable low-
carbon transportation?
11 Growing public transport –
a job creation priority
Sustainable low-carbon transport provides
economically viable infrastructure and operations
that o%ers safe and secure access for people and
goods while reducing short and long-term negative
impacts on the local and global environments.
– Global Environment Facility (GEF)
A GUIDE TO
LOW-CARBON TRANSPORT
CONTENTS 13 CASE STUDIES: South Africa in the spotlight
14 Mass transit
Gautrain Rapid Rail Link
16 Advocacy and policy development
Bridging the Gap between transport and climate policy
Partnership on Sustainable Low Carbon Transport
18 Travel demand management
Rail-based Park & Ride
20 Cycling mobility
Measuring the carbon value of cycling
22 Bus Rapid Transit
Rea Vaya ‘We are going’
24 Assessing priorities
WWF South Africa
25 Technology development
Electric vehicles
Compressed natural gas
Vehicle design
28 Project greening: Rustenburg Rapid Transit
29 Liveable cities: Pedestrian improvements