Embed Size (px)
Citation preview
A Guide to Exchange-Traded Australian Government Bonds
For Retail InvestorsAustralian Government Bonds commenced trading on the Australian Stock Exchange (ASX) on 21 May 2013 in the form of CHESS Depositary Interests. These securities form part of the Federal Government’s deep and liquid corporate bond market initiative which in turn is part of the Competitive and Sustainable Banking System Policy. This handbook is designed to help retail investors understand the structure of ASX-listed government bonds, factors affecting market prices, key risks, and what part these bonds play in overall portfolios.

The Australian Government Bond Handbook 2
Background 3
Overview 3
CHESS Depositary Interests (CDIs) – How They Work 3Potential Conversion to Physical Bonds 3Australian Office of Financial Management (AOFM) 3Types of Commonwealth Government Securities 4Why Do We Need Exchange-Traded Treasury Bonds? 4
Understanding Market Pricing – Dirty vs. Clean Price 5
Investment Risks 5
Duration: How to Measure Interest Rate Risk 5Duration and Your Portfolio 6
What is the Yield Curve? 7
The Shape of the Yield Curve 7The Neutral Interest Rate 8
Inflation and its Impact on Government Bonds 8
What is Inflation? 8How Is Inflation Measured? 8What are Exchange-traded Treasury Indexed Bonds (eTIB)? 8Understanding Breakeven Inflation 9
Pricing and Valuation 9
Active vs. Passive Management 10
Passive Bond Strategy 10Active Bond Strategy 11Conclusion 11
Appendix A – Security Detail 12
Appendix B – Historical Yields 13
Contents
The Australian Government Bond Handbook 3
BackgroundIn December 2010 the Federal Government announced the Competitive and Sustainable Banking System policy. As part of this policy the government is developing reforms to create a deep and liquid corporate bond market. The first step of these reforms was legislation enacted on 17 November 2012 to enable retail investors to trade Commonwealth Government Securities on an exchange. This is designed to reduce the government’s reliance on offshore funding and introduce some balance into the nation’s superannuation system. As a result of this legislation, the Australian Securities Exchange (ASX) now provides investors with access to interests in Australian Government Bonds that can be traded on the ASX at any point prior to maturity.
OverviewAustralian Government Bonds (AGBs), also known as Commonwealth Government Securities (CGS) or Treasury Bonds (TBs), are debt securities issued by the Commonwealth of Australia. These securities pay fixed coupon interest payments every six months (or quarterly for inflation-linked bonds) until maturity.
Institutional investors have historically held these securities for a number of reasons such as liquidity, duration positioning, and income, but it is important for individual investors to understand their use before implementing them as part of their investment strategy.
The physical AGBs are not traded on the ASX and are typically traded ’over the counter’ in large parcels, putting them beyond the reach of many retail investors. But legislation passed in November 2012 means the rights to these physical bonds can be traded on the ASX as a CHESS Depositary Interest. These depositary interests are known as exchange-traded treasury bonds (eTBs) and exchange-traded treasury-indexed bonds (eTIBs).
These securities have the appeal and convenience of being electronically traded and settled through the Australian Securities Exchange (ASX) in small or large parcels. Exchange-traded AGBs offer a convenient and readily accessible way for investors to buy Australian Government Bonds.
CHESS Depositary Interests (CDIs) – How They WorkThe owner of an eTB (or eTIB) will hold an Australian Government Bond in the form of a CHESS Depository Interest (CDI). This means the holder obtains all the economic benefits (including payments) of the underlying bond but without legal title which remains with the nominee (explained below).
The mechanism for ownership is somewhat confusing, but in reality both the physical treasury bond and the exchange-traded treasury bond work in exactly the same manner except that the market makers
(intermediaries CommSec, JPMorgan, and UBS) must ensure they maintain sufficient liquidity in both products within a few basis points of each other. The market makers have agreed to provide two way liquidity of at least AUD 5 million with a bid-offer spread which is for retail participants very competitive.
One exchange-traded AGB provides beneficial ownership of AUD 100 face value of the TB or TIB over which it has been issued. Owning an exchange-traded AGB gives the holder the right to receive interest and principal payments due on the underlying AGB.
The Depositary Nominee
CHESS Depositary Nominees Pty Ltd is the entity appointed by the Australian Government under the ASX Settlement Operating Rules to hold any economic benefits respective to the specific exchange-traded Treasury bond. This company is a 100%-owned subsidiary of the ASX and will hold the securities for the benefit of the holder of an exchange-traded treasury bond.
The Legal Owner (Austraclear)
Austraclear is the ASX wholesale securities depositary, which holds legal title to all AGBs.
The Issuer (The Australian Government)
The Australian Government is the issuer of the underlying AGB and makes interest and principal payments due on the underlying bond. Under payment instructions from Austraclear and the Depositary Nominee, interest and principal payments due on the underlying AGBs are paid from the Australian Government to the holders of the exchange-traded AGBs.
Potential Conversion to Physical BondsInvestors should be aware that the Government at its sole discretion may convert the exchange-traded government bonds into physical government bonds. If this were to occur, then investors would continue to receive the same Coupon Interest Payment and maturity amounts they were entitled to, but would not be able to sell their investment on the ASX.
For example, the Government could decide to do this if its agreement with the ASX for trading bonds was terminated.
Australian Office of Financial Management (AOFM)The AOFM is a specialist agency of the Treasury responsible for the management of all forms of Australian Government debt, including exchange-traded treasury bonds. Its primary role is debt management activities including the issue of debt securities such as Treasury Bonds, Treasury Indexed Bonds and Notes. But it also undertakes financial risk management and compliance activities on behalf of the Government including managing funding risk, market risk, credit risk, and operational risk.

The Australian Government Bond Handbook 4
Types of Commonwealth Government SecuritiesThe Australian Government currently issues debt securities to the public in the form of Treasury Bonds, Treasury Indexed Bonds and Treasury Notes.
3 Treasury Bonds are medium- to long-term debt securities that carry an annual rate of interest fixed over the life of the security, payable six-monthly. There are currently 17 bond issues on offer, and 13 of these lines have more than AUD10 billion outstanding. Treasury Bonds are only issued in AUD as prescribed in Section 3A of the Commonwealth Inscribed Stock Act 1911.
3 Treasury Indexed Bonds are medium- to long-term securities for which the capital value of the security is adjusted for movements in the Consumer Price Index (CPI). Interest is paid quarterly, at a fixed rate, on the adjusted capital value. At maturity, investors receive the adjusted capital value of the security, being the value adjusted for movement in the CPI over the life of the bond.
3 Treasury Notes are short-term debt securities issued to assist with the Australian Government’s within-year financing task. Treasury notes are not included as part of the exchange-traded government bond initiative.
In the past, the Australian Government has issued a range of other types of debt securities such as Australian Saving Bonds and Treasury Adjustable Rate Bonds. All debt securities issued by the Australian Government both now and in the past are collectively known as Commonwealth Government Securities.
Why Do We Need Exchange-Traded Treasury Bonds?There are a number of reasons why we need exchange-traded treasury bonds.
1. Their issue is part of a broad government initiative to develop a deep and liquid corporate bond market and promote Australia as a leading financial services hub. A vibrant corporate bond market provides a competitive medium- to long-term funding source as an alternative to banks and equity markets, allowing issuers to reduce their financing costs and spread their funding risks.
2. It will reduce Australia’s reliance on offshore funding. The development of an exchange-traded CGS and corporate bond market will assist in mobilising domestic savings for investment in infrastructure and corporate expansion, and so reduce Australia’s reliance on offshore markets for funding requirements. Retail CGS may also lead to increased foreign investment in Australia as it adds a further low-risk asset class.
3. Exchange-traded treasury bonds will provide retail investors with a more visible pricing benchmark for investments they may wish to make in corporate bonds.
4. It will encourage retail investors to diversify their savings through investments in fixed income products like government and corporate bonds, thereby reducing the risk of retail investor wealth being heavily affected by sharp movements in equity and property prices.
5. Treasury bonds provide higher-certainty income streams attractive to self-managed superannuation funds in the pension stage.
Types of Exchange-Traded Treasury Bonds
There are two different types of exchange-traded AGBs:
Exchange-Traded Treasury Bonds (eTBs) are medium- to long-term debt securities that carry an annual rate of interest fixed over the life of the security, payable every six months.
Exchange-Traded Treasury Indexed Bonds (eTIBs) are medium- to long-term debt securities for which the face value of the security is adjusted for movements in the Consumer Price Index (CPI). Interest is paid quarterly, at a fixed rate, on the adjusted face value. At maturity, investors receive the adjusted face value of the security – the value adjusted for movement in the CPI over the life of the bond (this final value is also known as the ‘nominal value’).
The minimum investment holding of any Exchange-traded TB will be one unit which is equivalent to AUD 100 Face Value of the Treasury Bond over which the exchange-traded TB has been issued.
The minimum investment holding of any Exchange-traded TIB will be one unit which is equivalent to AUD 100 Face Value adjusted for movements in the CPI of the Treasury Indexed Bond over which the exchange-traded TIB has been issued.
For more security detail please see Appendix 1.
Oct-03
Jun-0
4Feb
-05Oct-
05Ju
n-06
Feb-07
Oct-07
Jun-0
8Feb
-09Oct-
09Ju
n-10
Feb-11
Oct-11
Feb-13
Jun-1
2
98.00
100.00
102.00
104.00
106.00
108.00
110.00
112.00
114.00
$
The Australian Government Bond Handbook 5
Understanding Market Pricing – Dirty vs. Clean Price
There are 17 eTBs and 5 eTIBs listed on the ASX. Each of these securities has a similar name but their market values are very different and hence investors should be careful not confuse one security with another.
The price of each security is driven by its yield to maturity, which in turn is driven by the shape of the yield curve and expectation of inflation.
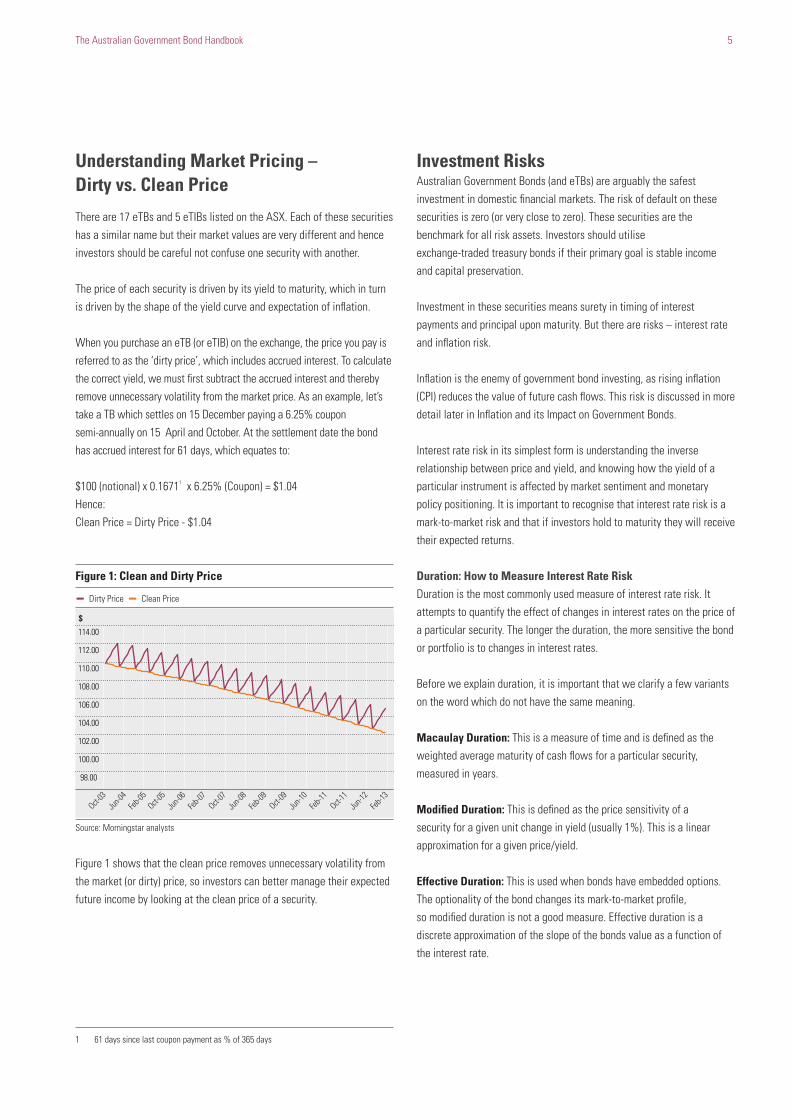
When you purchase an eTB (or eTIB) on the exchange, the price you pay is referred to as the ‘dirty price’, which includes accrued interest. To calculate the correct yield, we must first subtract the accrued interest and thereby remove unnecessary volatility from the market price. As an example, let’s take a TB which settles on 15 December paying a 6.25% coupon semi-annually on 15 April and October. At the settlement date the bond has accrued interest for 61 days, which equates to:
$100 (notional) x 0.16711 x 6.25% (Coupon) = $1.04Hence:Clean Price = Dirty Price - $1.04
Figure 1: Clean and Dirty Price
j Dirty Price j Clean Price
Source: Morningstar analysts
Figure 1 shows that the clean price removes unnecessary volatility from the market (or dirty) price, so investors can better manage their expected future income by looking at the clean price of a security.
1 61 days since last coupon payment as % of 365 days
Investment RisksAustralian Government Bonds (and eTBs) are arguably the safest investment in domestic financial markets. The risk of default on these securities is zero (or very close to zero). These securities are the benchmark for all risk assets. Investors should utilise exchange-traded treasury bonds if their primary goal is stable income and capital preservation.
Investment in these securities means surety in timing of interest payments and principal upon maturity. But there are risks – interest rate and inflation risk.
Inflation is the enemy of government bond investing, as rising inflation (CPI) reduces the value of future cash flows. This risk is discussed in more detail later in Inflation and its Impact on Government Bonds.
Interest rate risk in its simplest form is understanding the inverse relationship between price and yield, and knowing how the yield of a particular instrument is affected by market sentiment and monetary policy positioning. It is important to recognise that interest rate risk is a mark-to-market risk and that if investors hold to maturity they will receive their expected returns.
Duration: How to Measure Interest Rate RiskDuration is the most commonly used measure of interest rate risk. It attempts to quantify the effect of changes in interest rates on the price of a particular security. The longer the duration, the more sensitive the bond or portfolio is to changes in interest rates.
Before we explain duration, it is important that we clarify a few variants on the word which do not have the same meaning.
Macaulay Duration: This is a measure of time and is defined as the weighted average maturity of cash flows for a particular security, measured in years.
Modified Duration: This is defined as the price sensitivity of a security for a given unit change in yield (usually 1%). This is a linear approximation for a given price/yield.
Effective Duration: This is used when bonds have embedded options. The optionality of the bond changes its mark-to-market profile, so modified duration is not a good measure. Effective duration is a discrete approximation of the slope of the bonds value as a function of the interest rate.
p
r
Price
Yield
Apr-90
Apr-92
Apr-94
Apr-96
Apr-98
Apr-00
Apr-02
Apr-04
Apr-06
Apr-08
Apr-10
Apr-12
200
400
600
800
1000
1200
The Australian Government Bond Handbook 6
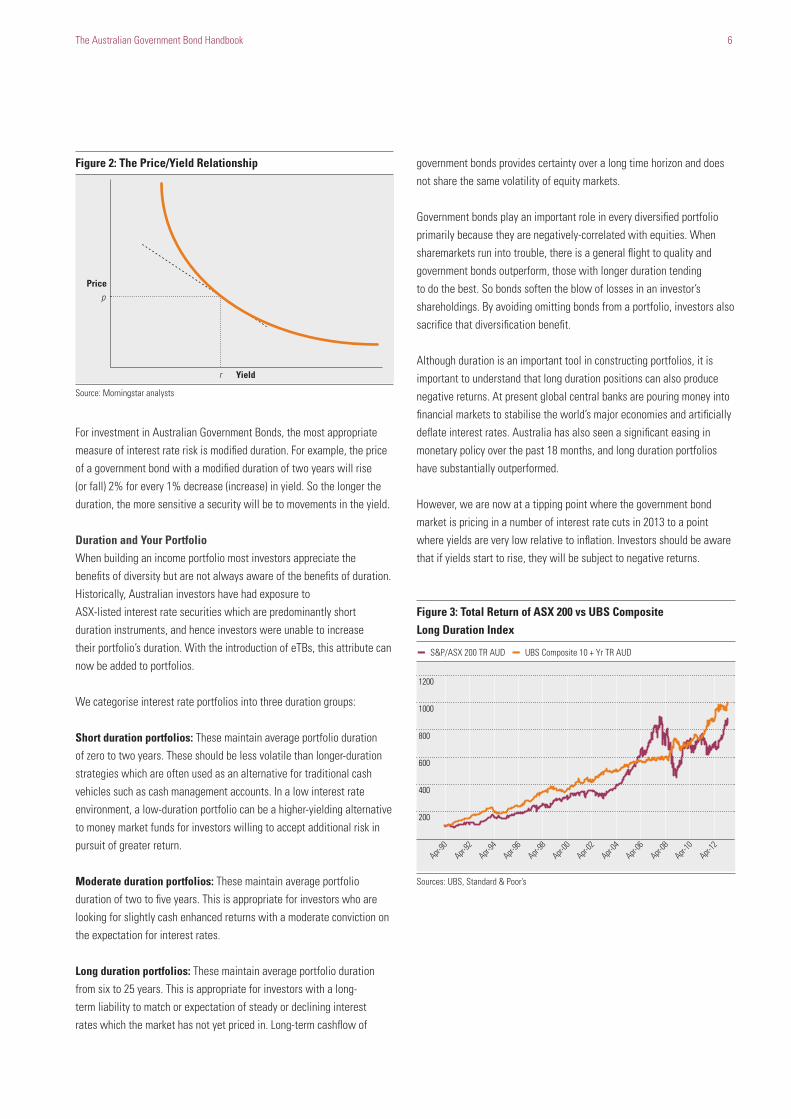
Figure 2: The Price/Yield Relationship
Source: Morningstar analysts
For investment in Australian Government Bonds, the most appropriate measure of interest rate risk is modified duration. For example, the price of a government bond with a modified duration of two years will rise (or fall) 2% for every 1% decrease (increase) in yield. So the longer the duration, the more sensitive a security will be to movements in the yield.
Duration and Your PortfolioWhen building an income portfolio most investors appreciate the benefits of diversity but are not always aware of the benefits of duration. Historically, Australian investors have had exposure to ASX-listed interest rate securities which are predominantly short duration instruments, and hence investors were unable to increase their portfolio’s duration. With the introduction of eTBs, this attribute can now be added to portfolios.
We categorise interest rate portfolios into three duration groups:
Short duration portfolios: These maintain average portfolio duration of zero to two years. These should be less volatile than longer-duration strategies which are often used as an alternative for traditional cash vehicles such as cash management accounts. In a low interest rate environment, a low-duration portfolio can be a higher-yielding alternative to money market funds for investors willing to accept additional risk in pursuit of greater return.
Moderate duration portfolios: These maintain average portfolio duration of two to five years. This is appropriate for investors who are looking for slightly cash enhanced returns with a moderate conviction on the expectation for interest rates.
Long duration portfolios: These maintain average portfolio duration from six to 25 years. This is appropriate for investors with a long-term liability to match or expectation of steady or declining interest rates which the market has not yet priced in. Long-term cashflow of
government bonds provides certainty over a long time horizon and does not share the same volatility of equity markets.
Government bonds play an important role in every diversified portfolio primarily because they are negatively-correlated with equities. When sharemarkets run into trouble, there is a general flight to quality and government bonds outperform, those with longer duration tending to do the best. So bonds soften the blow of losses in an investor’s shareholdings. By avoiding omitting bonds from a portfolio, investors also sacrifice that diversification benefit.
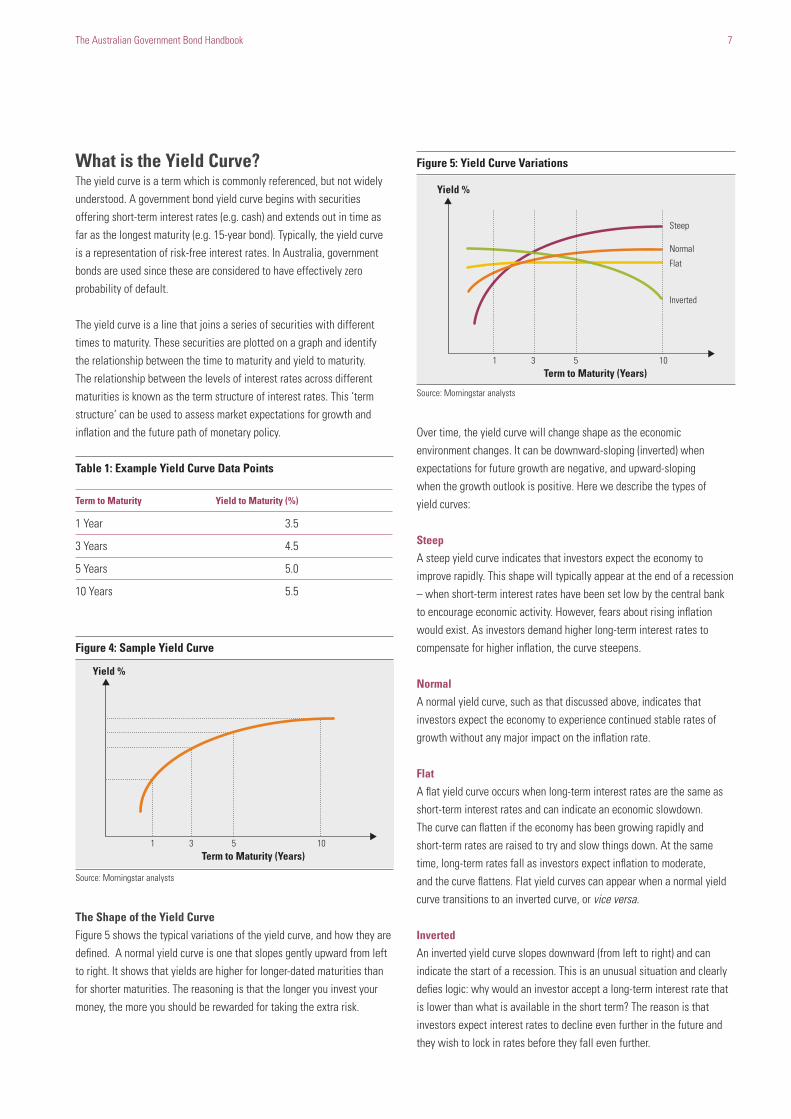
Although duration is an important tool in constructing portfolios, it is important to understand that long duration positions can also produce negative returns. At present global central banks are pouring money into financial markets to stabilise the world’s major economies and artificially deflate interest rates. Australia has also seen a significant easing in monetary policy over the past 18 months, and long duration portfolios have substantially outperformed.
However, we are now at a tipping point where the government bond market is pricing in a number of interest rate cuts in 2013 to a point where yields are very low relative to inflation. Investors should be aware that if yields start to rise, they will be subject to negative returns.
Figure 3: Total Return of ASX 200 vs UBS Composite Long Duration Index
j S&P/ASX 200 TR AUD j UBS Composite 10 + Yr TR AUD
Sources: UBS, Standard & Poor’s
Term to Maturity (Years)
Yield %
1 3 5 10
Term to Maturity (Years)
Yield %
1 3 5 10
Steep
Normal
Flat
Inverted
The Australian Government Bond Handbook 7
What is the Yield Curve?The yield curve is a term which is commonly referenced, but not widely understood. A government bond yield curve begins with securities offering short-term interest rates (e.g. cash) and extends out in time as far as the longest maturity (e.g. 15-year bond). Typically, the yield curve is a representation of risk-free interest rates. In Australia, government bonds are used since these are considered to have effectively zero probability of default.
The yield curve is a line that joins a series of securities with different times to maturity. These securities are plotted on a graph and identify the relationship between the time to maturity and yield to maturity. The relationship between the levels of interest rates across different maturities is known as the term structure of interest rates. This ‘term structure’ can be used to assess market expectations for growth and inflation and the future path of monetary policy.
Table 1: Example Yield Curve Data Points
Term to Maturity Yield to Maturity (%)
1 Year 3.5
3 Years 4.5
5 Years 5.0
10 Years 5.5
Figure 4: Sample Yield Curve
Source: Morningstar analysts
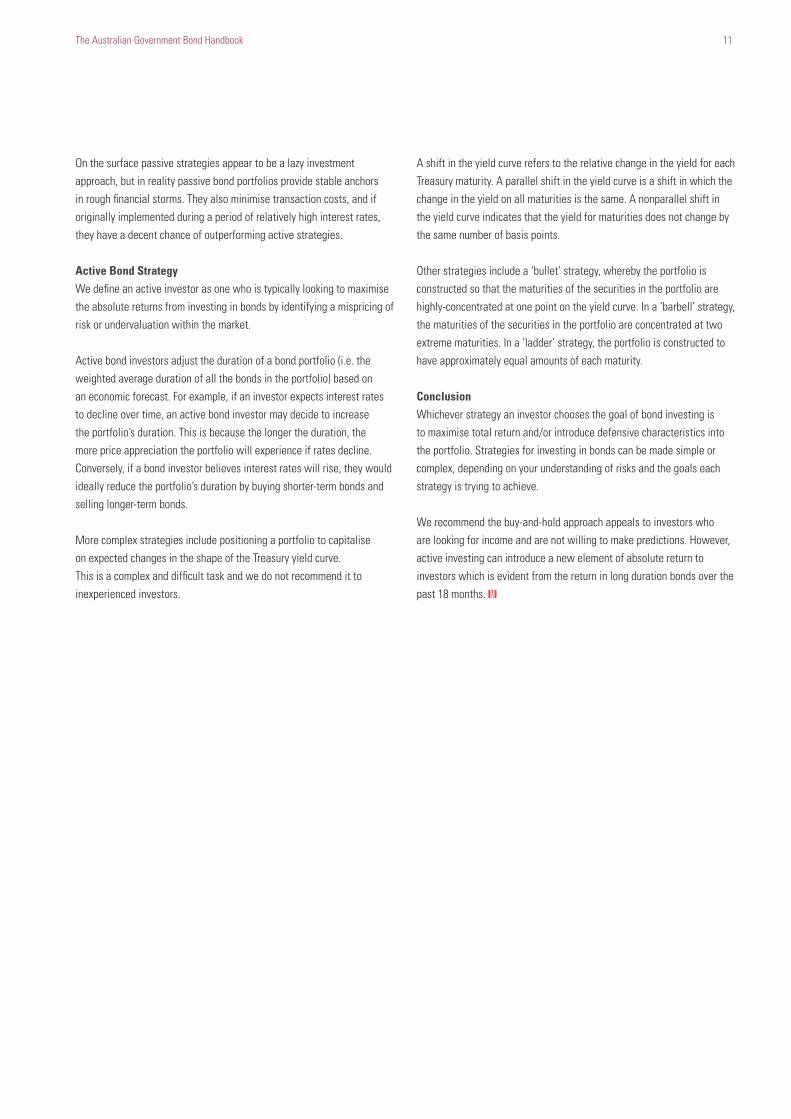
The Shape of the Yield CurveFigure 5 shows the typical variations of the yield curve, and how they are defined. A normal yield curve is one that slopes gently upward from left to right. It shows that yields are higher for longer-dated maturities than for shorter maturities. The reasoning is that the longer you invest your money, the more you should be rewarded for taking the extra risk.
Figure 5: Yield Curve Variations
Source: Morningstar analysts
Over time, the yield curve will change shape as the economic environment changes. It can be downward-sloping (inverted) when expectations for future growth are negative, and upward-sloping when the growth outlook is positive. Here we describe the types of yield curves:
Steep
A steep yield curve indicates that investors expect the economy to improve rapidly. This shape will typically appear at the end of a recession – when short-term interest rates have been set low by the central bank to encourage economic activity. However, fears about rising inflation would exist. As investors demand higher long-term interest rates to compensate for higher inflation, the curve steepens.
Normal
A normal yield curve, such as that discussed above, indicates that investors expect the economy to experience continued stable rates of growth without any major impact on the inflation rate.
Flat
A flat yield curve occurs when long-term interest rates are the same as short-term interest rates and can indicate an economic slowdown. The curve can flatten if the economy has been growing rapidly and short-term rates are raised to try and slow things down. At the same time, long-term rates fall as investors expect inflation to moderate, and the curve flattens. Flat yield curves can appear when a normal yield curve transitions to an inverted curve, or vice versa.
Inverted
An inverted yield curve slopes downward (from left to right) and can indicate the start of a recession. This is an unusual situation and clearly defies logic: why would an investor accept a long-term interest rate that is lower than what is available in the short term? The reason is that investors expect interest rates to decline even further in the future and they wish to lock in rates before they fall even further.

%20
16
12
8
4
0
-4
1965 1977 1989 2001 2013
Target introduced mid-1993
The Australian Government Bond Handbook 8
The Neutral Interest RateNow that we understand what is driving the yield curve, the next point of understanding is where the curve is positioned relative to the neutral interest rate. Over the past few years, market participants have been actively defining the new neutral cash rate and whether or not the Reserve Bank of Australia’s position is stimulatory or not relative to this level.
For the official cash rate to be expansionary, it must stimulate money supply in the wider economy. But this relationship does not work if the primary money lenders (banks) do not pass on the full amount to their clients. This leads to the current position where a 2.75% cash rate today is not as effective as a 2.75% cash rate five years ago.
Inflation and its Impact on Government Bonds
Inflation is one of the key risks to understand when dealing with government bonds. Investment returns are only positive if purchasing power parity is maintained over the life of the security. This means that it is possible to underperform if inflation is higher than expected returns over the life of the security.
The purpose of investing in government securities is for risk-averse investors to receive income while maintaining purchasing power parity.
What is Inflation?Inflation is defined by the Australian Bureau of Statistics as an upward movement in the general level of prices which can impose costs on individuals and the economy. Over time, inflation reduces the purchasing power of money and can lead to market inefficiencies. A low and stable rate of inflation is desirable for the health of the economy. Although inflation is defined as a rise in the general level of prices, not all prices change at the same rate or even in the same direction. For this reason, inflation can also affect the distribution of real income and wealth among individuals and households. This is the key reason why defensive investors in instruments such as government bonds should understand the components of inflation and what will drive future inflationary expectations.
It is the role of the Reserve Bank to set monetary policy based on achieving an average inflation rate of two to three percent over the economic cycle. This acts as an anchor for business expectations and gives investors a minimum compound return target over the life of their investment.
Figure 6: Inflation Over the Long-Run
Sources: ABS, RBA
How Is Inflation Measured?There are several regularly reported measures of inflation but the primary measure which is relevant to government bond investors is the Consumer Price Index (CPI).
The CPI, as measured by the Australian Bureau of Statistics, reflects retail prices of goods and services, including housing costs, transportation, and healthcare.
When analysing inflation investors should focus on ‘core inflation’ rather than the ‘headline’ or reported inflation rate. Core inflation removes volatile components (such as petrol) which can cause unwanted distortion to the headline figure and don’t reflect the true medium to long term trend.
Reported inflation gives us current data, but how do we measure any future inflationary expectations? The most widely-used market-based measures of medium- to long-term inflation expectations are those derived from government bonds. Their use is based on the idea that treasury bond yields have three main components:
3 the real yield, which bond investors demand as compensation for postponing consumption (the term risk premium);
3 compensation for expected inflation over the term of the bond (inflation risk premium); and
3 any potential variation in either of the above two components. 3 In academic fields this deconstruction is known as the Fisher
equation.
What are Exchange-Traded Treasury Indexed Bonds (eTIBs)?Treasury Indexed Bonds are government bonds which protect investors from the negative impact of inflation by contractually linking the capital value of the bond to the ABS Consumer Price Index.

The Australian Government Bond Handbook 9
Historically, the issuance of inflation-linked securities in Australia has been dominated by the Australian Government. These securities have been in existence since 1983 but have gone through periods of limited issuance. The primary investors in the inflation-linked market have been superannuation funds, life insurance companies and professional fund managers.
These bonds, also known as ‘linkers’, have performed very well over the past 20 years, primarily due to inflation being somewhat volatile and their tendency to be long duration. For this reason some of the trading prices on eTIBs will look closer to AUD 200 than AUD 100.
Table 2. Exchange-Traded Capital Indexed Bonds
ASX Code Coupon Maturity Date of IssueIssuance
Volume ($B)Modified Duration
GSIO15 4.00% 20-Aug-15 17-May-94 AUD 3,196 2.38
GSIO20 4.00% 20-Aug -20 10-Oct-96 AUD 4,523 6.61
GSIC22 1.25% 21-Feb-22 21-Feb-12 AUD 1,950 8.51
GSIQ25 3.00% 20-Sep-25 30-Sep-09 AUD 5,250 10.69
GSIQ30 2.50% 20-Sep-30 16-Sep-10 AUD 2,450 14.51
Just like treasury bonds, whose prices move in response to nominal interest rate changes, the prices of Treasury Indexed Bonds will change as real yields fluctuate. In the circumstance where an economy goes through a sustained period of deflation, it is possible that the inflation adjusted principal could decline below its par value. Luckily for investors the Australian Government offers inflation floors at maturity which means investors will always receive par (at minimum) at maturity.
Treasury Indexed Bonds are a defensive alternative for investors seeking to preserve purchasing power. They are less volatile than stocks, commodities or currencies, and given their predictable real return, inflation-linked bonds are arguably a more reliable way to protect against inflation than equities.
History suggests that spikes in inflation can occur without warning, particularly after long periods of low inflation. Similar to an insurance premium, the best time to purchase protection against inflation can be before it starts rising. Investors looking to employ inflation-linked strategies in their portfolios should understand how these securities react to changing market conditions. The best way to understand what the market is expecting for inflation is to understand the break-even inflation rate.
Understanding Breakeven InflationIn its simplest form, breakeven inflation is the difference in yield between treasury indexed bonds and nominal bonds for a given maturity (e.g. 10-year Treasury Bond yield less 10-year Treasury Indexed Bond Yield).
This is considered a rough measure of future inflationary expectations. Breakeven inflation encompasses both the expected inflation rate and the inflation risk premium, two components of nominal yields that on their own are not always easily quantifiable. Put another way, breakeven inflation is the future inflation rate required for a real bond to achieve the same return as a comparable nominal bond, if held to maturity.
If actual inflation is more than breakeven inflation, a real bond is likely to outperform the nominal bond. If actual inflation is less than breakeven inflation, the nominal bond is likely to outperform. Breakeven inflation is only a rough measure because a number of factors can influence it, including liquidity and supply and demand.
Pricing and ValuationAustralian Government Bonds consist of a series of future coupon payments and the repayment of the principal at maturity. Therefore, the fair price is the sum of the present values of all future cash flows, including coupon payments and the redemption payment. Any formula used to put a value on these payments must rest on certain assumptions. To standardise these assumptions, the Reserve Bank of Australia introduced standard pricing conventions for all Commonwealth Government Securities.
As the price of a bond is the present value of its expected cash flows, if investors apply different interest rate forecasts, they will arrive at different values for a given bond. Investors can therefore judge whether particular bonds appear ‘cheap’ or ‘expensive’.
The yield to maturity, which represents the annual rate of return of the security, is derived by solving an equation with the purchase price on one side and the present (discounted) value of the series of payments on the other.
A yield could be expressed for any defined period, but it is convenient to quote yearly rates. With bonds, it is conventional in Australia that these annual rates are obtained by doubling an effective or true half-yearly rate. That is, the usual calculations involve rates of return earned over a half year. The yearly rate is simply double this half-yearly rate and should properly be regarded as a nominal rate, as it ignores the compounding (or reinvestment effect) of the half-yearly rate over the year. The use of effective half-yearly rates accords with the fact that, in Australia, interest is normally paid half-yearly. Some correction may be needed for comparison of yields, such as with those overseas, where interest periods are different from this.
Importantly, there is no single right answer to yield calculations, hence the formula for calculating the price per AUD 100 of an Australian Commonwealth Treasury Bond as supplied by the Reserve Bank of Australia:

P = v f/d (g[1 + an] + 100vn)
P = v f/d (gan + 100vn)
an = v + v2 + ... vn =
P =
P = the price per $100 face value
v = , where 100i = half yearly yield (%) to maturity
f = the number of days from the date of settlement to the next interest payment date
d = the number of days in the half year ending on the next interest payment date
g = the half yearly rate of coupon payment per $100 face value
n = the term in half years from the next interest payment date to maturity
CPIt = is the current Consumer Price Index
CPIt-2 = is the Consumer Price Index two quarters previously
100 + g
11 + i
1 + i
1 - vn
i
an = v + v2 + ... vn =
f = the number of days from the date of settlement to the next interest payment date
d = the number of days in the half year ending on the next interest payment date
g = the half yearly rate of coupon payment per $100 face value
n = the term in half years from the next interest payment date to maturity
1 - vn
i
( )f365
Kt 1 +
100
( )p100
P = v f/d x (g[1 + an] + 100vn) x
- f/d
P = the price per $100 face value
v = , where 100i = half yearly yield (%) to maturity11 + i
p100Kt = Kt-1 1 + ; where( )
1002p = ; where( )CPIt
CPIt-2
-1
Basic Formula:
Ex interest:
Where:
Where:
K links inflation to the capital value of the security
The Australian Government Bond Handbook 10
Exchange-Traded Treasury Bonds (eTBs)
Exchange-Traded Treasury Indexed Bonds (eTIBs)
.
Active vs. Passive ManagementFirst and foremost, Treasury Bonds and Treasury Indexed Bonds are defensive investment securities designed to reduce risk in a portfolio. These securities are the risk-free benchmark and can be used in ways to create secure long-term income.
Historically, individual investors have only had access to bond markets through managed funds. These funds actively manage bond portfolios relative to a specified benchmark. In Australia, the most commonly-used benchmark is the UBS Composite Index.
The problem for investors is that fixed income benchmarks present a number of complex issues which generally benefit issuers not investors. The primary issues revolve around the fact that fixed income benchmarks are capitalisation-weighted. This sounds normal, as is acceptable for equities, but in fixed income it creates two major complications:
The first problem stems from the fact that the duration of the benchmark comes from issuer preferences, and does not necessarily reflect the best interests of a given investor. When issuing bonds, the issuer is looking to optimise its duration preferences and, in the case of company issuers, minimise their cost of capital. Therefore the benchmark duration is an aggregate of issuer preferences and not what investors should be focusing on.
The second problem is what is commonly known as the ‘bums problem’. This was originally identified in 2003 by Larry Siegel, who identified that market-weighted fixed income indices were heavily-skewed by issuers with the highest debt outstanding. This seems perverse, as issuer creditworthiness and total debt volume are typically inversely-correlated.
These issues can be avoided by introducing passive and active bond investment strategies with exchange-traded treasury bonds.
Passive Bond StrategyWe define a passive investor as one who typically looks to maximise the income-generating properties of bonds without managing any of the risk. This is what is commonly known as a buy-and-hold investor.
This strategy assumes government bonds are safe and predictable sources of income. Investors purchase the individual bonds, hold them to maturity, and any cash flow from the bonds is used to fund external income needs or is reinvested in the portfolio.
Passive bond strategies make no assumptions about the future direction of interest rates and subsequent changes in the price value of the bond. Shifts in the yield curve are not important, but the main concern is that the par value will be received upon maturity.
The Australian Government Bond Handbook 11
On the surface passive strategies appear to be a lazy investment approach, but in reality passive bond portfolios provide stable anchors in rough financial storms. They also minimise transaction costs, and if originally implemented during a period of relatively high interest rates, they have a decent chance of outperforming active strategies.
Active Bond StrategyWe define an active investor as one who is typically looking to maximise the absolute returns from investing in bonds by identifying a mispricing of risk or undervaluation within the market.
Active bond investors adjust the duration of a bond portfolio (i.e. the weighted average duration of all the bonds in the portfolio) based on an economic forecast. For example, if an investor expects interest rates to decline over time, an active bond investor may decide to increase the portfolio’s duration. This is because the longer the duration, the more price appreciation the portfolio will experience if rates decline. Conversely, if a bond investor believes interest rates will rise, they would ideally reduce the portfolio’s duration by buying shorter-term bonds and selling longer-term bonds.
More complex strategies include positioning a portfolio to capitalise on expected changes in the shape of the Treasury yield curve. This is a complex and difficult task and we do not recommend it to inexperienced investors.
A shift in the yield curve refers to the relative change in the yield for each Treasury maturity. A parallel shift in the yield curve is a shift in which the change in the yield on all maturities is the same. A nonparallel shift in the yield curve indicates that the yield for maturities does not change by the same number of basis points.
Other strategies include a ‘bullet’ strategy, whereby the portfolio is constructed so that the maturities of the securities in the portfolio are highly-concentrated at one point on the yield curve. In a ‘barbell’ strategy, the maturities of the securities in the portfolio are concentrated at two extreme maturities. In a ‘ladder’ strategy, the portfolio is constructed to have approximately equal amounts of each maturity.
Conclusion Whichever strategy an investor chooses the goal of bond investing is to maximise total return and/or introduce defensive characteristics into the portfolio. Strategies for investing in bonds can be made simple or complex, depending on your understanding of risks and the goals each strategy is trying to achieve.
We recommend the buy-and-hold approach appeals to investors who are looking for income and are not willing to make predictions. However, active investing can introduce a new element of absolute return to investors which is evident from the return in long duration bonds over the past 18 months. K

The Australian Government Bond Handbook 12
Appendix A – Security Detail
Exchange Traded Treasury Bonds (eTBs)
ASX Code2 ISIN (AGB) ISIN (eTB) Coupon Ex-date Record Date3 Payment Dates4 Maturity
GSBW13 AU3TB0000069 AU000GSBW132 5.50% 15-Jun, 15-Dec 15-Dec-13
GSBK14 AU3TB0000028 AU000GSBK145 6.25% 15-Jun, 15-Dec 15-Jun-14
GSBS14 AU3TB0000085 AU000GSBS148 4.50% 21-Apr, 21-Oct 21-Oct-14
GSBG15 AU0000XCLWI3 AU000GSBG150 6.25% 15-Apr, 15-Oct 15-Apr-15
GSBS15 AU3TB0000119 AU000GSBS155 4.75% 21-Apr, 21-Oct 21-Oct-15
GSBK16 AU3TB0000077 AU000GSBK160 4.75% 15-Jun, 15-Dec 15-Jun-16
GSBC17 AU300TB01208 AU000GSBC175 6.00% 15-Feb, 15-Aug 15-Feb-17
GSBM17 AU3TB0000127 AU000GSBM174 4.25% 21-Jan, 21-Jul 21-Jul-17
GSBA18 AU3TB0000093 AU000GSBA187 5.50% 21-Jan, 21-Jul 21-Jan-18
GSBE19 AU300TB01224 AU000GSBE197 5.25% 15-Mar, 15-Sep 15-Mar-19
GSBG20 AU3TB0000036 AU000GSBG200 4.50% 15-Apr, 15-Oct 15-Apr-20
GSBI21 AU0000XCLWM5 AU000GSBI214 5.75% 15-May, 15-Nov 15-May-21
GSBM22 AU3TB0000051 AU000GSBM224 5.75% 15-Jan, 15-Jul 15-Jul-22
GSBG23 AU3TB0000101 AU000GSBG234 5.50% 21-Apr, 21-Oct 21-Apr-23
GSBG24 AU3TB0000143 AU000GSBG242 2.75% 21-Apr, 21-Oct 21-Apr-24
GSBG25 AU3TB0000168 AU000GSBG259 3.25% 21-Apr, 21-Oct 21-Apr-24
GSBG27 AU3TB0000135 AU000GSBG275 4.75% 21-Apr, 21-Oct 21-Apr-27
GSBG29 AU3TB0000150 AU000GSBG291 3.25% 21-Apr, 21-Oct 21-Apr-29
Exchange Traded Treasury Indexed Bonds (eTIBs)
ASX Code ISIN (AGIB) ISIN (eTIB) Coupon Ex-date Record Date3 Payment Dates4 Maturity
GSIO15 AU0000XCLWD4 AU000GSIO159 4.00% 20-Feb, 20-May, 20-Aug, 20-Nov 20-Aug-15
GSIO20 AU0000XCLWE2 AU000GSIO209 4.00% 20-Feb, 20-May, 20-Aug, 20-Nov 20-Aug-20
GSIC22 AU000XCLWAB3 AU000GSIC220 1.25% 21-Feb, 21-May, 21-Aug, 21-Nov 21-Feb-22
GSIQ25 AU0000XCLWP8 AU000GSIQ253 3.00% 20-Mar, 20-Jun, 20-Sep, 20-Dec 20-Sep-25
GSIQ30 AU0000XCLWV6 AU000GSIQ303 2.50% 20-Mar, 20-Jun, 20-Sep, 20-Dec 20-Sep-30
2 The code convention is AGBMYY Where AGB = AGB Type (e.g. GSB for Treasury Bond or GSI for Treasury Indexed Bond) M = Expiry Month (e.g. January = A or B, February = C or D, March = E or F, etc…) YY = Expiry Year (e.g. 2017 = 17)
3 If this date is a non-business day then the record date will become the previous business day.
4 If the payment date in a non-business day then the payment date will become the next business day.
2 ca
lend
ar d
ays
prio
r to
reco
rd d
ate
2 ca
lend
ar d
ays
prio
r to
reco
rd d
ate
8 ca
lend
ar d
ays
prio
r to
paym
ent d
ate
8 ca
lend
ar d
ays
prio
r to
paym
ent d
ate

1.0
2.0
3.0
4.0
5.0
6.0
7.0
Jan-2
009 Mar-
2009
May-20
09 Ju
l-200
9 Sep
-2009
Nov-20
09 Ja
n-201
0 Mar-20
10 May-
2010
Jul-2
010
Sep-20
10 Nov-
2010
Jan-2
011 Mar-
2011
May-20
11 Ju
l-201
1 Sep
-2011
Nov-20
11 Ja
n-201
2 Mar-20
12 May-
2012
Jul-2
012
Sep-20
12 Nov-
2012
Jan-2
013
GSBW
13
GSBK
14
GSBS
14
GSBG
15
GSBS
15
GSBK
16
GSBC
17
GSBM
17
GSBA
18
GSBE
19
GSBG
20
GSBI
21
GSBM
22
GSBG
23
GSBG
27
GSBG
29
GSBG
29
The Australian Government Bond Handbook 13
Appendix B – Historical Yields
Sour
ces:
RBA
Sta
tistic
al Ta
bles
, Mor
ning
star

Level 36, Australia Square264 George StreetSydney, NSW 2000+61 2 9276 4444 3+61 2 9276 4545 5www.morningstar.com.au
© 2013 Morningstar, Inc. All rights reserved. Neither Morningstar, nor its affiliates nor their content providers guarantee the data or content contained herein to be accurate, complete or timely nor
will they have any liability for its use or distribution. Any general advice has been prepared by Morningstar Australasia Pty Ltd ABN: 95 090 665 544, AFSL: 240892 (a subsidiary of Morningstar, Inc.),
without reference to your objectives, financial situation or needs. You should consider the advice in light of these matters and, if applicable, the relevant product disclosure statement before making
any decision to invest. Some material is copyright and published under licence from ASX Operations Pty Limited ACN 004 523 782 (“ASXO”). DISCLOSURE: Employees may have an interest in the
securities discussed in this report. Please refer to our Financial Services Guide (FSG) for more information at www.morningstar.com.au/fsg